
Submitted:
21 August 2025
Posted:
22 August 2025
You are already at the latest version
Abstract
Chemoresistance, particularly to cisplatin, remains a significant challenge in treating high-risk neuroblastoma, resulting in a mere 20% five-year overall survival rate. Recent evidence suggests that tumour-derived small extracellular vesicles (sEVs) play a crucial role in cancer progression by promoting angiogenesis, invasion, and proliferation in recipient cells. This study investigated the alterations in the protein cargo of sEVs secreted by cisplatin-resistant neuroblastoma cells and their impact on reprogramming non-cancerous recipient cells, with a focus on angiogenesis.
We utilised an in vitro model of cisplatin-resistant neuroblastoma (KellyCis83) paired with its cisplatin-sensitive parental cell line (Kelly). Functional enrichment analysis of the sEV proteome identified metabolism as a key dysregulated pathway in KellyCis83 sEVs. Notably, sEVs from drug-resistant KellyCis83 cells significantly increased the basal oxygen consumption rate and tubule formation in human umbilical vein endothelial cells (HUVECs) compared to Kelly's sEVs.
The angiogenic potential of both Kelly and KellyCis83 sEVs was assessed using cell proliferation, migration, and tube formation assays. We observed that sEV uptake by HUVECs is energy-dependent and slows cell proliferation when cultured in media lacking angiogenic factors (VEGF, IGF-1, and b-FGF), likely due to increased anchorage-dependent differentiation of HUVECs.
This study demonstrates a potential mechanism by which sEVs derived from cisplatin-resistant neuroblastoma cells modulate endothelial cell function through alterations in metabolic pathways. These findings provide new insights into the role of sEVs in chemoresistance and angiogenesis in neuroblastoma, potentially opening avenues for novel therapeutic strategies.
Keywords:
neuroblastoma
; cisplatin resistance
; extracellular vesicles
; proteomics
; metabolism
1. Introduction
Neuroblastoma (NB) is an aggressive paediatric cancer originating from the sympathetic nervous system, primarily affecting children under five years old [12]. Its aggressiveness is linked to several molecular features, including chromosomal abnormalities 1p, 3p, 14q, and 11q; unbalanced gain of 1q, 11p, and 17q; and MYCN amplification (a transcription factor belonging to the MYC proto-oncogene family), which occurs in 20-25% of patients and is associated with high-risk disease. The first line of treatment often includes a combination of cisplatin, vincristine, carboplatin, etoposide and cyclophosphamide. Then high-risk patients undergo surgery, radiation and myeloablative treatments using escalating chemotherapy by bone marrow infusion. High-risk NB patients face a grim prognosis despite intensive multimodal treatment involving chemotherapy combinations, surgery, radiation, and myeloablative therapies [15]. The five-year overall survival rate for this cohort is a mere 20%, mainly due to the development of chemoresistance.
Acquired chemoresistance profoundly alters cancer cell signalling at multiple levels - genomic, epigenomic, transcriptomic, proteomic, and metabolomic. These alterations significantly impact cell-to-cell interactions, including the biogenesis, content, and biological activity of extracellular vesicles (EVs). EVs, particularly small EVs (sEVs) (30-150 nm), play a crucial role in intercellular communication in both normal and pathological conditions [26,32]. sEVs not only transfer bioactive molecules, including oncoproteins and nucleic acids, but they also promote tumour growth and metastasis through various mechanisms such as angiogenesis, invasion, and proliferation in recipient cells [9,13,27].
Recent studies have revealed that sEVs from drug-resistant cancer cells can directly transfer chemoresistance to drug-sensitive cells with multiple different chemotherapy agents across various cancer types, such as breast, ovarian, leukaemia, prostate, colorectal and pancreatic cancer [13]. In NB, sEVs from MYCN-amplified cells have been shown to promote doxorubicin resistance in non-MYCN-amplified cells, which was reversed with shRNA knockdown of MYCN expression [8]. Furthermore, NB-derived sEVs can indirectly promote chemoresistance by modulating the tumour microenvironment (TME). For example, Challagundla et al demonstrated that NB-derived sEVs can induce human monocytes to release sEVs containing miR-155, which, upon uptake in NB cells, conferred cisplatin resistance [3]. In a more recent study, doxorubicin-treated NB cells were found to secrete sEVs that promoted pre-metastatic niche formation and increased metastasis in NB cell line mouse models [33].
A key aspect of sEV-mediated effects is their ability to induce metabolic reprogramming, such as aerobic glycolysis and reduced oxidative phosphorylation in recipient cells, promoting the Warburg effect [9]. Several studies demonstrated that sEV-driven metabolic changes promote angiogenesis in acute myeloid leukaemia (AML), colorectal cancer and head and neck cancer using HUVECs tube formation assay via different mechanisms such as miR-221-3p transfer in AML, SRSF3-mediated VEGF upregulation in colorectal cancer, and MMP-9 enrichment in head and neck cancer [11,16,23,30]. Tumour growth and propagation require oxygen and nutrient supply, metabolites, and an effective way to remove waste products, which can be facilitated through newly developed vasculature. However, nothing is known about how the metabolic reprogramming by sEVs can foster angiogenesis in neuroblastoma.
Our hypothesis posits that acquired cisplatin resistance in NB alters the proteome and function of NB-derived sEVs, leading to enhanced metabolic reprogramming, angiogenesis, and propagation of a chemoresistant phenotype. To test this hypothesis, we employed a well-characterised in vitro model: the cisplatin-sensitive Kelly and cisplatin-resistant KellyCis83 NB cell lines [6,19,20]. The KellyCis83 cell line was established by gradually exposing parental Kelly cells to increasing concentrations of cisplatin over 6 months, reaching a final concentration of 83 µM. This method effectively simulates the gradual acquisition of drug resistance observed in clinical settings.
Comprehensive genomic and phenotypic analyses have demonstrated that KellyCis83 is distinct from its parental line while retaining key features of aggressive NB. Array comparative genomic hybridisation (aCGH) revealed that KellyCis83 has acquired 12 additional chromosomal aberrations, including 9 gains, 2 losses, and 1 homozygous deletion. The cell line has been thoroughly profiled using mass spectrometry, proliferation assays, and toxicity assays, providing detailed insights into its cellular characteristics. Thus, confirming KellyCis83 as being both phenotypically and genomically distinct from the parental Kelly cell line, while maintaining MYCN amplification, a hallmark of high-risk neuroblastoma and ensuring its relevance as a model for aggressive disease.
This well-defined model allows us to identify the effects of acquired cisplatin resistance on sEV composition and function, providing a robust foundation for our investigation. By utilising the Kelly/KellyCis83 pair, we can directly compare sEVs from cisplatin-sensitive and cisplatin-resistant cells, offering valuable insights into how drug resistance influences intercellular communication via sEVs.
Our study will focus on how acquired cisplatin resistance alters the protein cargo of sEVs secreted by NB cells and how these changes reprogram non-cancerous recipient cell functions to promote a pro-tumorigenic phenotype with a particular emphasis on angiogenesis and metabolic alterations. This approach has the potential to uncover novel mechanisms of chemoresistance propagation and identify new therapeutic targets to improve outcomes for high-risk NB patients.
In this paper, the terms ‘exosomes’ and ‘extracellular vesicles (EVs)’ are used in reference to original studies published before the updated Minimal Information for Studies of Extracellular Vesicles (MISEV) guidelines. This terminology has been retained to reflect original characterisation methods, which differ from current standards.
2. Materials and Methods
2.1. Cell Lines
The NB cell lines Kelly and KellyCis83 were cultured in Gibco™ RPMI 1640 Medium supplemented with 10% Gibco™ Foetal Bovine Serum (FBS), and 1% Gibco™ Penicillin-Streptomycin (P/S) (5,000 U/mL). SH-SY5Y cells were cultured in a 1:1 ratio of Gibco™ MEM, no L-glutamine and Gibco™ Ham's F-12 Nutrient Mix supplemented with 10% FBS and 1% P/S. Human Umbilical Vein Endothelial Cells (HUVECs) were cultured in corresponding cell culture media (Table S1). All cell lines were authenticated by DNA profiling before use.
2.2. Cell Culture and Conditioned Media Harvest from CELLine™ AD1000 Bioreactor
For sEV production, 2.5 × 10^7 Kelly and KellyCis83 cells were cultured in CELLine™ AD1000 bioreactor flasks (DWK Life Sciences, Cat. No. WCL1000AD-3). The AD1000 flasks consist of two compartments, media and cellular, separated by a 10 kDa semipermeable membrane. Cells were cultured in 15 mL of RPMI 1640 supplemented with 10% Gibco™ FBS, exosome-depleted (Cat. No. A2720801) and 1% Gibco™ Antibiotic-Antimycotic (100X) (Cat. No. 15240062). In the media compartment, 500 mL of RPMI 1640 supplemented with 10% FBS and 1% P/S was added. Conditioned media were harvested after 6 days and centrifuged at 1,200 rpm (Eppendorf, Model No. 5804) for 2 minutes to remove any cells, before centrifugation at 2,000 x g (Sorval ST40R with a TX-1000 rotor) for 30 minutes at 4⁰C, to remove large EVs. Clarified conditioned media were stored at -80⁰C before sEV isolation.
Sub-culturing of cells cultured in bioreactors involved removal of spent media, washing of the cellular compartment twice with 11 mL phosphate-buffered saline (PBS), followed by enzymatic detachment with 13 mL of Gibco™ Trypsin-EDTA (0.25%) for 5-10 minutes. Collected cells were centrifuged at 1,200 rpm for 3 minutes (Eppendorf, Model No. 5804). The cellular compartment was washed with 11 mL of PBS before reintroduction of 2.5 × 10^7 cells into the cellular compartment with 13 mL of complete media. The rubber port, which provides access to the cellular compartment, was sterilised regularly to minimise the chance of infection during the sub-culturing process with 70% alcohol wipes. The trypan blue exclusion assay was regularly performed to determine the cellular viability of passaged cells.
2.3. sEV Isolation
sEVs were isolated by differential centrifugation in 36 mL polypropylene thin-walled tubes (Thermo Scientific™, Cat. No. 3141). Conditioned media was centrifuged at 16,000 x g (Sorval WX Ultra with a Surespin 630 rotor) for 30 minutes at 4⁰C. The supernatant was collected and centrifuged at 110,000 x g for 90 minutes to pellet sEVs. The sEV pellet was resuspended in 30 ml 0.2 µm filtered PBS and centrifuged again at 110,000 x g for 90 minutes. The final sEV pellet was resuspended in either PBS or RIPA buffer, depending on downstream analysis, and stored at 4⁰C to be analysed within 3 days. sEV isolates resuspended in RIPA for proteomics were stored at -20⁰C prior to analysis. When sEVs were co-cultured with cells in culture, they were filtered with a 0.45 µm Millex-HV syringe filter unit (Millipore, Cat. No. SLHV013SL) to remove any biological contaminants introduced in the isolation process.
2.4. Nanoparticle Tracking Assay (NTA)
Pelleted sEVs were diluted in 1 mL of 0.2 µm filtered PBS to yield a concentration of 40-80 particles per frame. Each sample was analysed at 20-25°C with a blue 488 nm laser and a camera level of 14 using the Nanosight NS300 (Malvern Instruments) NTA platform. A sCMOS camera with a slider shutter of 1,000, a slider gain of 400 and a frame rate of 25 fps was used to capture three 60-second videos of suspended sEVs. Data were analysed using the NanoSight NTA 3.2 software version Dev Build 3.2.16. The detection threshold was set to five, and the maximum jump mode, maximum jump distance, and minimum track length were all set to auto.
2.5. Transmission Electron Microscopy (TEM)
sEV samples were air-dried on top of formvar/silicon monoxide 200 mesh copper grids (Ted Pella, Cat. No. 01830) for 10 minutes. A negative stain of a 1:4 dilution of uranyl acetate alternative (Ted Pella, Cat. No. 19485) was applied for 1 minute and imaged on a Hitachi H7650 at 100 kV.
2.6. ExoView Platform
Samples were analysed on the ExoView platform with the ExoView Tetraspanin Kit (NanoView Biosciences, MA, USA). Each sample was diluted 1:1 in manufacturer-supplied incubation solution and incubated overnight at room temperature on ExoView Tetraspanin Chips. The chips were washed three times in solution A prior to incubation with fluorescent tetraspanin antibodies. The tetraspanin fluorescent antibodies consisted of anti-CD9 CF488, anti-CD81 CF555 and anti-CD63 CF647. Antibodies were diluted 1:500 as per the manufacturer's instructions and incubated on chips for one hour at room temperature. The chips were then washed in kit-supplied buffers, dried and imaged by the ExoView R100 using nScan v2.7. Data were analysed using NanoViewer v2.7. Fluorescent cut-offs were set relative to the murine IgG (mIgG) control.
2.7. Western Blot
sEV and cells were lysed in RIPA buffer and Halt™ protease inhibitor cocktail (100X) (Thermo Scientific™, Cat. No. 78430) followed by quantification of protein concentrations of sEV and cell lysates by the Micro BCA™ (mBCA) Protein Assay Kit (ThermoFisher Scientific™, Cat. No. 23235) and Pierce™ BCA Protein Assay Kit (ThermoFisher Scientific™, Ca. No. 23225) respectively, following the manufactures guidelines. Protein samples were diluted in 4X Bolt™ LDS sample buffer (Invitrogen™, Cat. No. B0008) and denatured at 95⁰C for 5 minutes. Equal concentrations of protein, between 1-5 µg, were separated by SDS-PAGE on Bolt™ 4-12% bis-tris plus gels (Invitrogen™, Ca. No. NW04120, NW04122, NW04125) followed by the protein transfer to a nitrocellulose membrane (ThermoFisher Scientific™, Ca. No. 88018). Blots were first incubated in blocking buffer 5% BSA/TBS-T, followed by incubation with primary antibodies for 16-28 hours at 4⁰C with constant agitation. Primary antibodies were diluted in blocking buffer, with a dilution ranging from 1:250 to 1:2,000 (Supplementary Table S3).
2.8. Nuclear and Cytoplasmic Fractionation
To separate nuclear and cytoplasmic fractions from Kelly and KellyCis83 cells, we modified the protocol outlined by Schreiber, E. et al [24]. Cell pellets were mixed, on ice, with hypotonic cytoplasm extraction (CE) buffer.
2.9. Mass Spectrometry
Protein was isolated from Kelly and KellyCis83 sEV cytosolic and nuclear fractions, using RIPA buffer. Protein samples were run at 190 volts for 5 minutes on a Bolt™ 4-12% Bis-Tris plus gel. Tryptic digests were produced by in-gel digestion according to the protocol outlined by Shevchenko et al. [25]. For liquid chromatography tandem mass spectrometry (LC-MS/MS), peptide samples were injected into a ThermoFisher Scientific™ Q Exactive mass spectrometer connected to a Dionex Ultimate 3000 (RSLCnano) chromatography system. Tryptic peptides (5 μl of digest) from each sample were loaded onto a fused silica emitter (75 μm ID, pulled using a laser puller (Sutter Instruments P2000)), packed with UChrom C18 (1.8 μm) reverse phase media (nanoLCMS Solutions LCC) and were separated by an increasing ATN gradient over 60 minutes at a flow rate of 250 nL/min. The mass spectrometer was operated in data-dependent TopN 12 mode, with the following settings: mass range 300-1600Th; resolution for MS1 scan 70,000; AGC target 3e6; resolution for MS2 scan 17,500; AGC target 5e4.
2.10. Data Processing
Data were processed using MaxQuant version 1.6.10.43 and the Human UniProt database (downloaded 12/11/2019) with the following parameters: fixed mod: carbamidomethylation; variable mods: methionine oxidation, acetyl (protein N-term); trypsin/P digest enzyme; precursor mass tolerances 4.5 ppm; fragment ion mass tolerances 20 ppm; peptide FDR 1% and protein FDR 1%. Reverse matches and potential contaminants were removed by row filtering, along with proteins identified by a single site or only one peptide. Label-free quantification (LFQ) intensities were log2-transformed and filtered for valid values. Prior to differential abundant protein identification, LFQ intensities were further filtered and imputed with PhosR version 1.12.0. LFQ intensities were filtered so that at least three valid values were present for either Kelly or KellyCis83 peptide samples. A two-step imputation process was utilised. First, imputation was performed on missing values within groups that had at least 50% availability. Group-specific imputation values were sampled from an empirical normal distribution within each group. For the remaining missing values, imputation was done using small values derived from the lower tail of the sample distribution.
2.11. Bioinformatics and Network Analysis
Differentially abundant proteins for each data type (sEV, nuclear, and cytoplasm) were identified from normalised LFQ data with limma version 3.58.1 [21]. Differentially abundant proteins were defined based on the following criteria: adjusted p < 0.05 and absolute fold-change > 1.5. Gene set enrichment analyses were performed with clusterProfiler using Pathway Commons and Gene Ontology: Biological Process (GO: BP) databases [1,22,34]. A network of functionally related, significantly enriched pathways was created by inferring each pathway’s functional correlation using Jaccard distance with a minimum of 20% overlapping proteins using Enrich Plot version 1.22.0 [35].
2.12. NIR-AZA 1 Fluorophore sEV Labelling and Uptake
We seeded 2.0 x 10⁴ HUEVCs in a chambered coverslip (ibidi®, Cat. No. 80826). After 24 hours, we added KellyCis83's sEVs, labelled with the near-infrared fluorophore NIR-AZA 1 as described previously [18]. The sEV-treated HUVECs were kept at 37°C for 4 hours. Then the cells were washed twice with pre-warmed Hank’s Balanced Salt Solution (HBSS) and counterstained with 2 µg/mL of Hoechst in HBSS for 6 minutes. This was followed by two more washes with HBSS before confocal and fluorescent imaging. Images were processed using ImageJ (NIH, MD, USA, version 1.53f51).
2.13. Lactate Secretion
For the lactate secretion assay, we used the Lactate-Glo™ Assay (Promega, Cat. No. J5021) according to the manufacturer’s guidelines. Conditioned media were collected from Kelly, KellyCis83 and HUVECs treated with 10 μg of sEVs. Equal volumes of media and luciferin detection solution were mixed and incubated for 60 minutes at room temperature. Luminescence was measured on a PerkinElmer Victor3 plate reader (PerkinElmer, MA, USA), with 5 seconds shaking and 0.2 second measurement time. Relative luminescence was measured by subtracting the luminescence of each test well from the blank, which consisted of non-conditioned culture media.
2.14. Seahorse XF Glycolytic Rate Assay
To measure the glycolytic rate of HUVECs treated with 10 μg of Kelly and KellyCis83 sEV, we performed the Seahorse XF Glycolytic Rate Assay (Agilent Technologies, Kit 103344-100), using the Seahorse XFe Analyser, according to the manufacturer's guidelines. HUVECs were plated at a density of 15 × 10^3 cells per day prior to treatment with either Kelly or KellyCis83 sEVs. HUVECs and sEVs were co-cultured for 24 hours before washing three times with assay medium containing DMEM, glucose, pyruvate, and L-glutamine. Next, 0.5 μM Rot/AA and 50 mM 2-DG were resuspended in the assay medium and loaded onto the sensor cartridge. Lastly, the cell plate and sensor cartridge were loaded onto the Seahorse XFe Analyser, and the Seahorse XF Glycolytic Rate Assay was performed.
2.15. Tubule Formation Assay
The tubule formation assay was performed by treating Human Umbilical Vein Endothelial Cells (HUVECs) cultured on Matrigel® Growth Factor Reduced Basement Membrane Matrix (Corning® Cat. No. 354230) with 20 μg of Kelly and KellyCis83 sEVs. HUVECs are an adherent cell line pooled from the umbilical cord tissue of three newborn patients (PromoCell (HUVEC-c pooled, Growth Medium 2, order number: C-12208, lot number: 447Z015, PromoCell, Heidelberg, Germany)). HUVECs were cultured in Endothelial Cell Growth Medium 2 (PromoCell, Cat no. C-22111). To preserve the differentiating properties of HUVECs, cells were kept in a passage range of 2-8 for all downstream analysis. To create positive and negative culture conditions for the functional analysis of HUVECs, culture media conditions were designed (Table 1).
Each well was imaged in two locations, every hour, for 24 hours on a ZEISS Celldiscoverer 7 microscope (Carl Zeiss Ltd, Cambridge, UK). Tubule formation was measured stereoscopically using ImageJ (NIH, MD, USA, version 1.53f51). The number of times a HUVEC tubule or part of the cell body fully crossed an overlayed grid of 114,344.90 µm2 was counted, and tubule formation was reported as the number of HUVEC tubule grid intersections.

Table 1.
Supplementation of GF+ and GF- HUVEC media.
| Supplement | Concentration | GF+ | GF- |
|---|---|---|---|
| Foetal calf serum | 0.02 ml/mL | + | + |
| Epidermal growth factor (EGF) | 5 ng/mL | + | + |
| Ascorbic Acid | 1 ug/mL | + | + |
| Heparin | 22.5 ug/mL | + | + |
| Hydrocortisone | 0.2 ug/mL | + | + |
| Basic fibroblast growth factor (b-FGF) | 10 ng/mL | + | - |
| Insulin-like growth factor (IGF-1) | 20 ng/mL | + | - |
| Vascular endothelial growth factor 165 (VEGF) | 0.5 ng/mL | + | - |
2.16. Wound Healing Assay
A reproducible 500 μm cell-free scratch in a monolayer of HUVECs was created using silicone 2-well inserts (ibidi®, Cat. No. 80209), placed in a 48-well plate. Into each well of each insert, 5 × 10^4 HUVECs were seeded. At 48 hours post-seeding, the inserts were removed, cells were washed with pre-warmed PBS and treated with 20 μg of sEVs. Each scratch was imaged in three locations every hour for 24 hours on a ZEISS Celldiscoverer 7 microscope (Carl Zeiss Ltd, Cambridge, UK). The scratch area was measured using the area measurement tool on ImageJ (NIH, MD, USA, version 1.53f51). The following formula was used to determine the percentage of scratch or wound closure:
2.17. Cell Proliferation
Cell proliferation was assessed using the Quant-iT PicoGreen dsDNA Assay Kit (Invitrogen, Cat. No. P7589) as per the manufacturer’s instructions. Into a 96-well plate, 1.0 × 10^4 cells were seeded and treated with sEVs at 24 and 48 hours after plating. On day five, after the last sEV treatment, the media was removed, the cells were washed with pre-warmed PBS and then lysed with dsDNA extraction buffer (0.1M sodium bicarbonate and 1% Triton-X) for 30 minutes before collection. Each dsDNA sample was diluted 1:4 in TE buffer (200 mM Tris-HCl, 20 mM EDTA, pH 7.5), and diluted PicoGreen™ reagent (1:200 in TE buffer) was added. The results were measured using the Tecan i-control infinite 200Pro plate reader (Tecan Group Ltd, Switzerland).
2.18. Half Maximal Inhibitory Concentration (IC50) Determination
To determine the half maximal toxic concentration (IC50) of cisplatin, we plated 1.0 x 10⁴ Kelly, KellyCis83, and SH-SY5Y cells in 96-well plates. After 24 hours, cells were washed with PBS and treated with five concentrations of cisplatin, ranging from 0.5 µM to 10 µM, including an untreated control. Cell viability was determined by using the CellTiter-Glo® 3D Cell Viability Assay (Promega, Cat. No. G9681) to measure cellular ATP levels and percentage of viability relative to the untreated control. The IC50 was calculated on GraphPad Prism (GraphPad Software, CA, USA, version 9.0.0) by non-linear regression (curve fit) with a baseline set to 0, plotting percentage viability on the y-axis and log10 cisplatin concentration on the x-axis.
2.19. Cisplatin Toxicity Assay
We assessed the ability of Kelly and KellyCis83 sEVs to inhibit cisplatin toxicity in Kelly and SH-SY5Y cells. We plated 1.0 × 10^4 Kelly and SH-SY5Y cells in 96-well plates and treated them twice with 8 µg of Kelly and KellyCis83 sEVs. After 24 hours, the cells were treated with 2 µM of cisplatin. After 5 days, the percentage of cell viability was measured relative to the untreated control using the CellTiter-Glo® 3D Cell Viability Assay (Promega, Cat. No. G9681).
2.20. Statistics
Data were analysed using the Student’s t-test to calculate the p-value and determine statistical significance. The Student’s t-test was calculated using GraphPad Prism (GraphPad Software, CA, USA, version 9.0.0). All tests were unpaired, two-tailed, and any p-value less than 0.05 was determined to be statistically significant and indicated on the graphs. Graphed p values are represented as follows: * = p ≤ 0.05, ** = p ≤ 0.01, *** = p ≤ 0.001 and **** = p ≤ 0.0001.
3. Results
3.1. Purification and Physical Characterisation of sEVs Derived from Kelly and KellyCis83 NB Cells
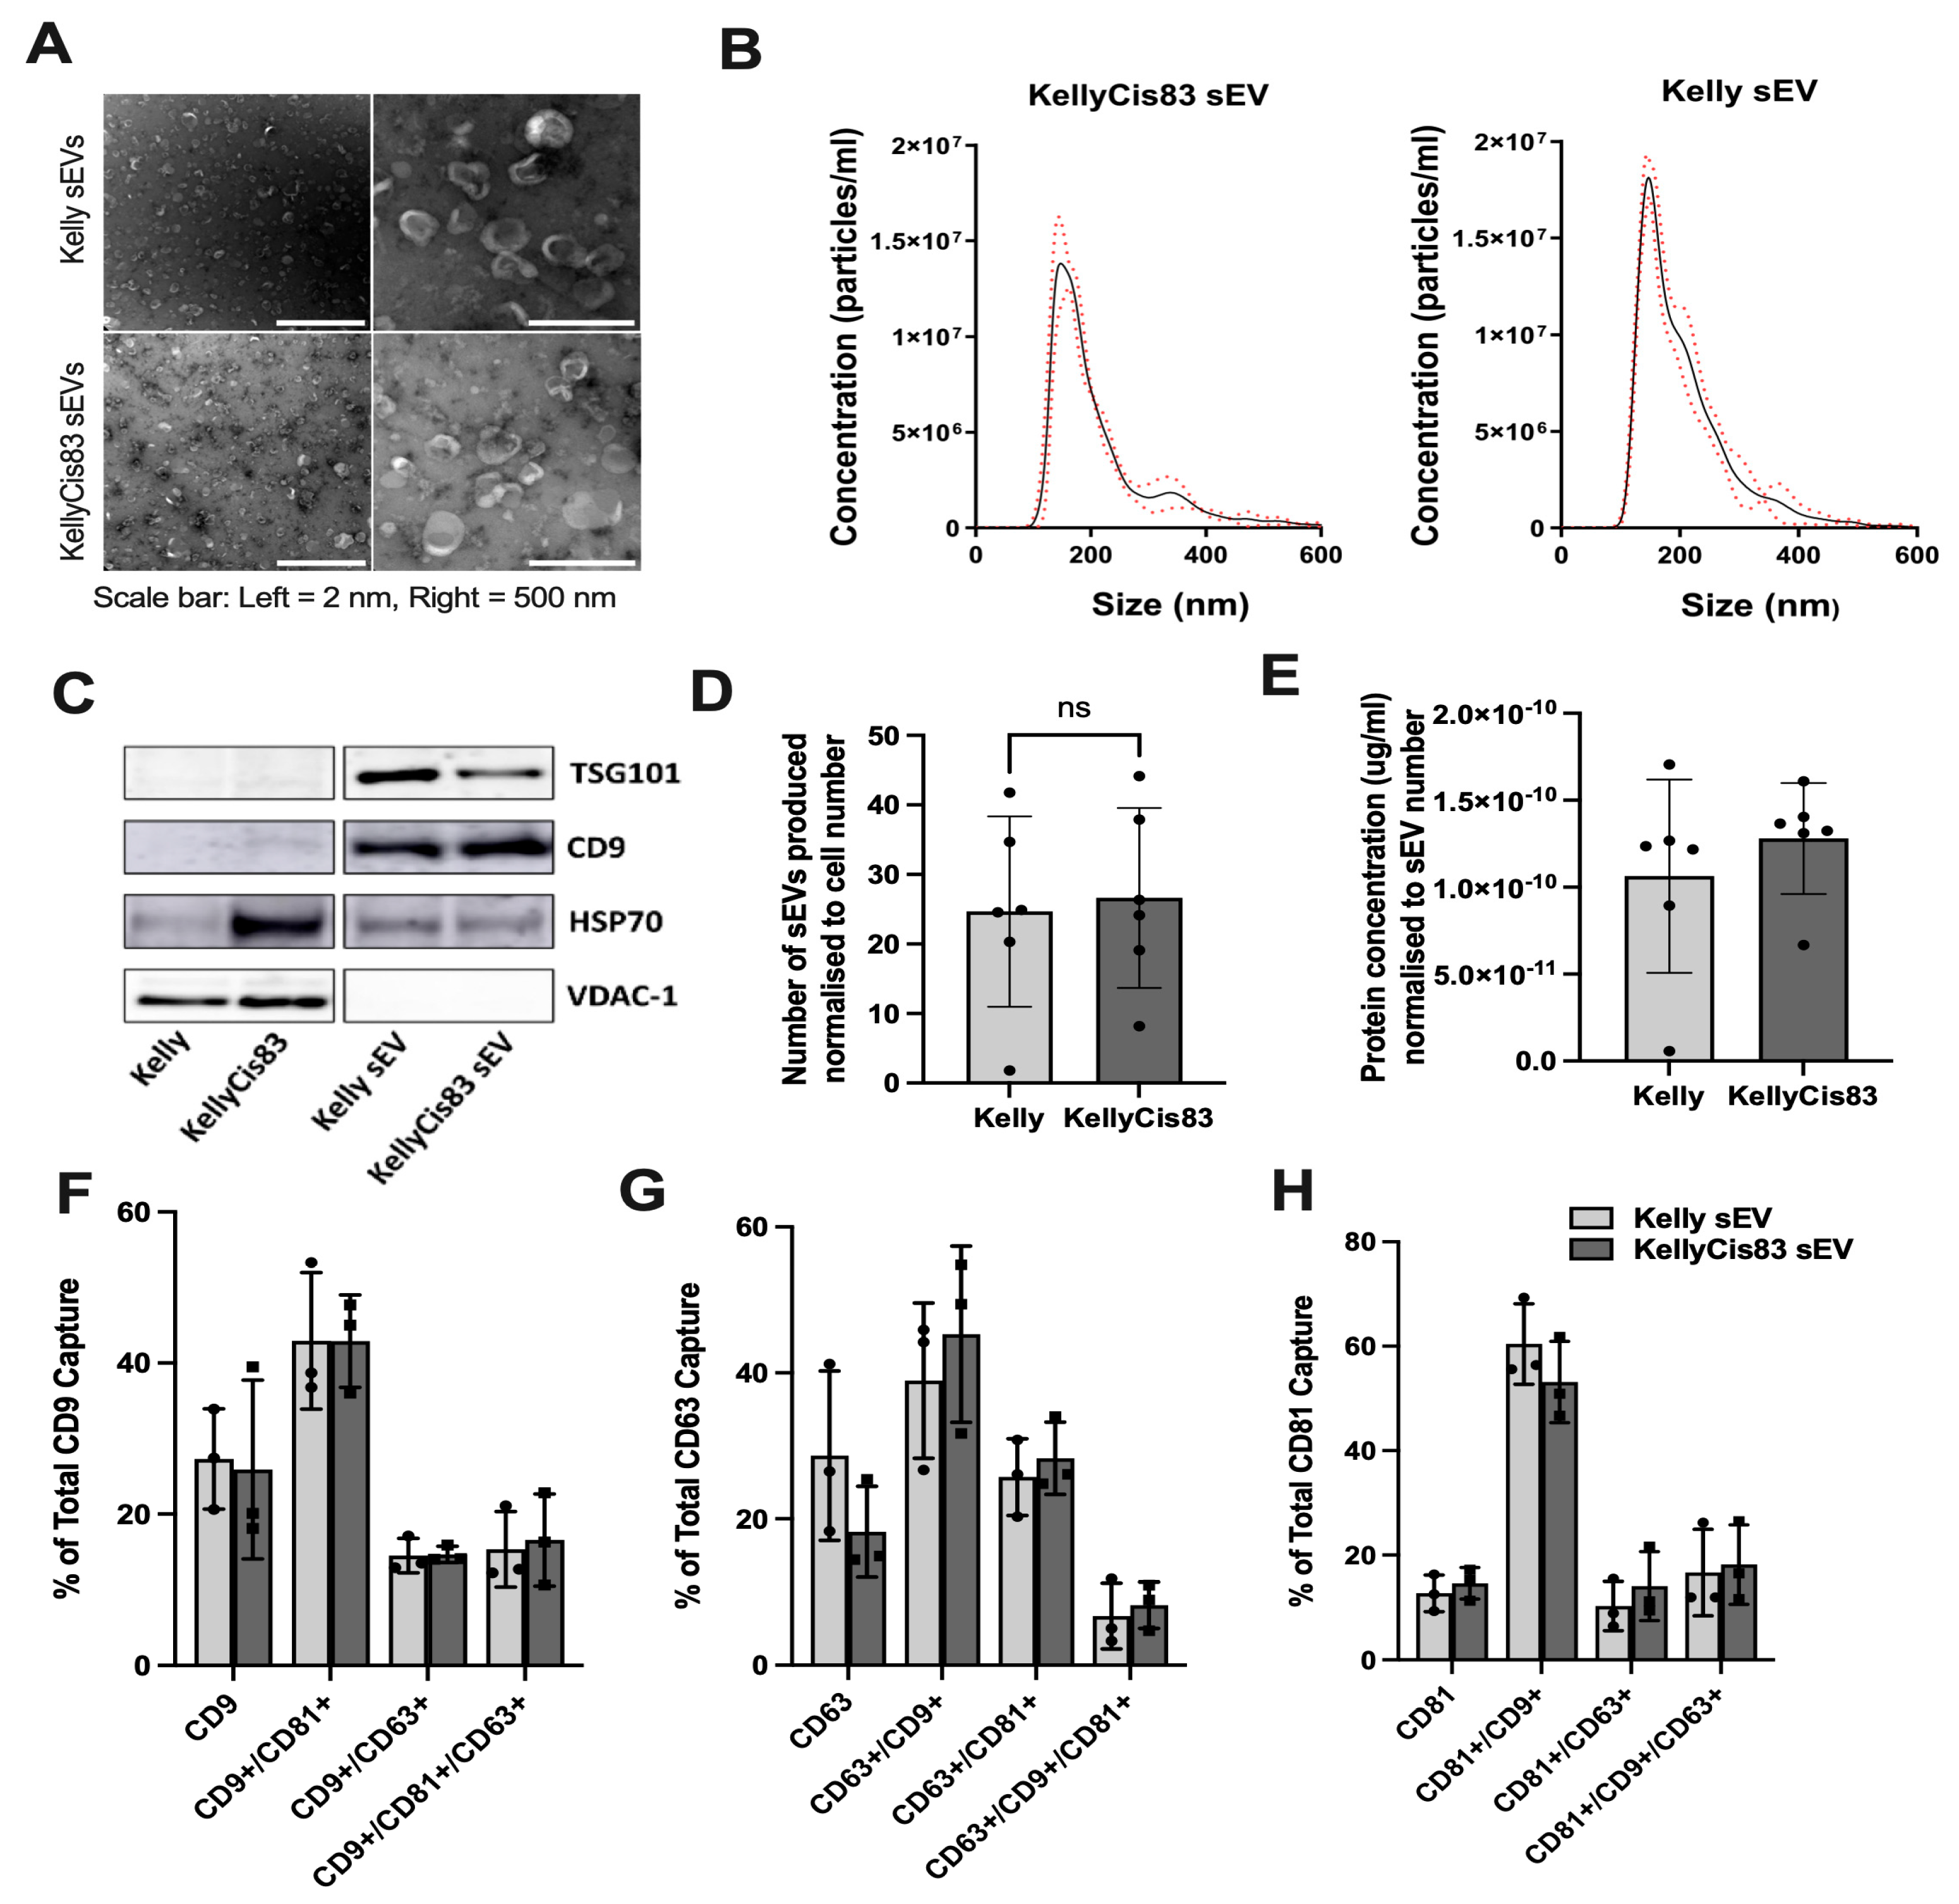
Kelly and KellyCis83 sEVs cultured in CELLine AD1000 bioreactors were isolated by differential ultracentrifugation and characterised by nanoparticle tracking analysis (NTA), transmission electron microscopy (TEM) and western blot (WB), fulfilling the MISEV 2023 guidelines for characterisation of small extracellular vesicles [31]. We observed spherical particles with a bright outer ring and a darker central area using TEM (Figure 1A). The diameters of the sEV samples ranged from 132 to 175 nm. Kelly's sEVs had a mean diameter of 206 ± 3 nm and a mode diameter of 147 ± 3 nm. KellyCis83 sEV had a mean diameter of 216 ± 4 nm and a mode diameter of 155 ± 7 nm (Figure 1B). Western blot results showed that both Kelly and KellyCis83 sEVs are enriched in CD9 and TSG101, compared to their parental cells (Figure 1C). HSP70 was expressed in sEVs but did not have the same level of enrichment compared to the parental cells. VDAC-1, a mitochondrial membrane-bound protein, was not detected in Kelly or KellyCis83 sEVs, showing that the sEV isolates were free from cellular contamination. Comparison of the number and protein concentration of sEVs isolated from Kelly and KellyCis83 cells revealed no significant differences when normalised to the number of cells at conditioned media harvest (Figure 1D,E).
Using the ExoView R200 platform, we examined the surface topology of single Kelly and KellyCis83 sEVs. We performed a tetraspanin antibody array, detecting expression and co-localisation of CD9, CD81 and CD63 (Figure 1F-H). CD9 is the dominant tetraspanin expressed on the surface of both Kelly and KellyCis83 sEVs (Figure 1F). The CD9+/CD81+ phenotype is the most common tetraspanin phenotype in both types of sEVs. Triple tetraspanin-positive sEVs account for only 3-27% of sEVs (Figure 1G,H). These results show that while the development of cisplatin resistance profoundly reshaped the genome and proteome of the KellyCis83 cell line [20], it did not significantly alter sEV tetraspanin expression.
Figure 1.
Kelly and KellyCis83 sEV characterisation: (A) TEM images of Kelly sEV and KellyCis83 sEV (scale bar = 2 nm and 500 nm); (B) NTA size range of Kelly sEV and KellyCis83 sEVs (n=3). Data represented as mean ± standard deviation (red dotted line); (C) Representative blot of three independent experiments, showing expression of CD9, HSP70, TSG101, and VDAC-1 in Kelly and KellyCis83 parental cells and sEVs. Images for VDAC-1 and TSG101 are derived from the same blot, cut into two, prior to primary antibody incubation. The same is for CD9 and HSP70 images; (D) Number of sEVs produced by Kelly and KellyCis83 cells, normalised to cell number; (E) Protein concentration of Kelly and KellyCis83 sEVs, normalised to sEV number; (F) Co-localisation of CD9, CD81 and CD63 on Kelly and KellyCis83 sEVs captured by anti-CD9, (G) anti-CD63 and (H) anti-CD81 antibodies on the ExoView platform. Data represented as mean ± standard deviation. Statistical significance was calculated by an unpaired t-test (* p ≤ 0.05 and ** p ≤ 0.01, only statistically significant values graphed).
3.2. Functional Enrichment Analysis of sEV Proteome Identifies Metabolism as a Key Dysregulated Pathway in KellyCis83 sEVs
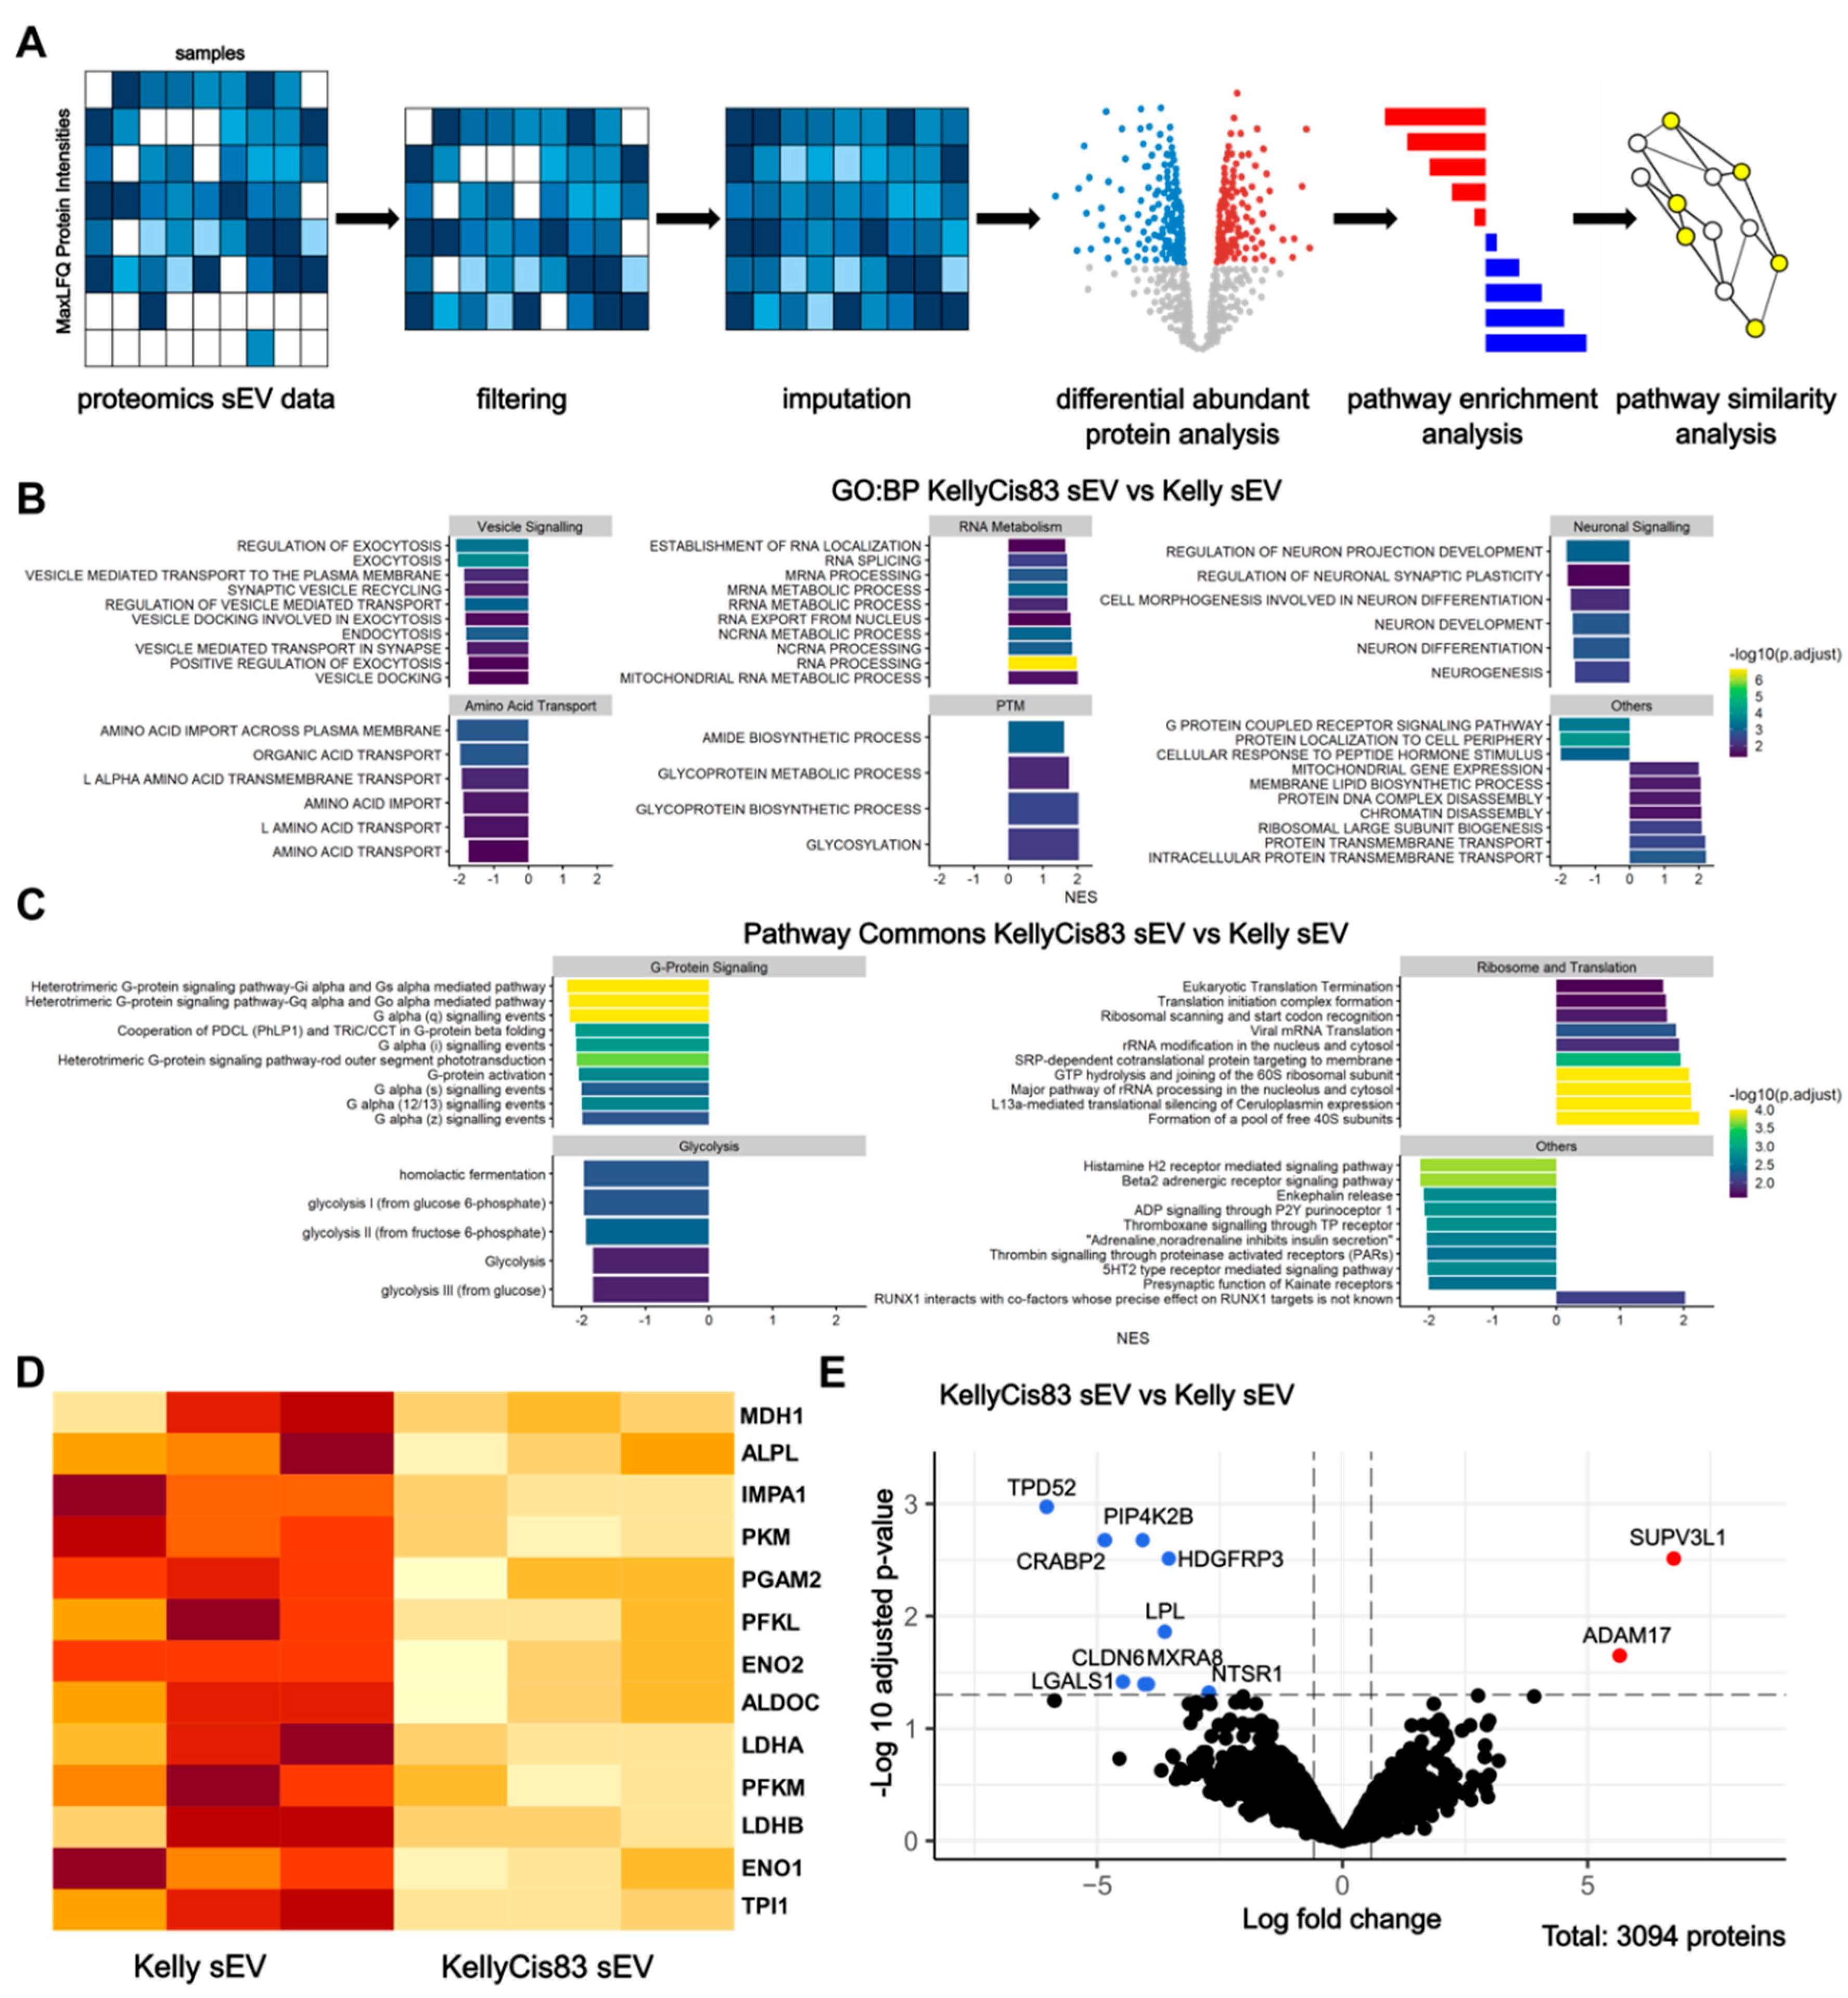
To further characterise Kelly and KellyCis83 sEV content and determine protein expression changes as a result of cisplatin resistance development, we performed liquid chromatography with tandem mass spectrometry (LC-MS/MS) on Kelly and KellyCis83 sEVs, followed by bioinformatic analysis using clusterProfiler (Figure 2A). Data were filtered and imputed. This resulted in the identification of a total of 3,094 proteins (Figure 2E). To gain insight into the different biological and molecular functions of proteins differentially expressed in our cisplatin-resistant model of NB, we performed gene set enrichment analysis (GSEA) followed by pathways similarity analysis and network visualisation (Figure 2B,C). Differentially abundant proteins between Kelly and KellyCis83 sEVs were denoted with an absolute fold change of >1.5 and an adjusted p value of <0.05. With this threshold, we identified nine downregulated proteins (TPD52, PIP4K2B, CRABP2, HDGFRP3, LPL, MXRA8, CLDN6, LGALS1, and NTSR1) and two upregulated proteins (SUPV3L1 and ADAM17) in KellyCis83 sEVs (Figure 2E, Figure S1, Table S1).
We identified a group of pathways that were significantly downregulated in KellyCis83 sEVs related to vesicle signalling, amino acid transport, neuronal signalling, and glycolysis. Conversely, we identified RNA metabolism and post-translational modification to be significantly upregulated in KellyCis83 sEVs (Figure 2B,C). We further investigated the downregulation of glycolysis in KellyCis83 sEVs, a sign of metabolic dysregulation. Although glycolysis proteins were not found to be differentially abundant in KellyCis83 sEVs, we identified several proteins contributing to the gene set enrichment analysis of the significantly downregulated glycolysis pathway, such as ENO1, ENO2, ALDOC, LDHA, and LDHB (Figure 2D).
Figure 2.
Mass spectrometry and bioinformatic analysis of Kelly and KellyCis83 sEVs: (A) Bioinformatics Workflow for sEV Proteomics Analysis in Kelly and KellyCis83 cells; (B) Gene Set Enrichment Analysis using the Gene Ontology: Biological Processes (GO: BP) and (C) Pathway Commons databases. The colour gradient indicates the –log10-adjusted p value, and the x-axis indicates the normalised enrichment score (NES). Significant pathways (p < 0.05) are grouped based on the higher-level classifications, and the top 10 most significant are visualised; (D) Heatmap of normalised LFQ intensities of proteins that contributed to significant glycolysis enrichment. A darker orange colour indicates a higher protein abundance. Individual proteins were not differentially abundant in KellyCis83 sEVs; (E) Volcano plot displaying differential abundance of KellyCis83 and Kelly sEV proteins (adjusted p <0.05, absolute fold change > 1.5).
3.3. KellyCis83 sEVs Are Internalised by Cancerous and Non-Cancerous Cells
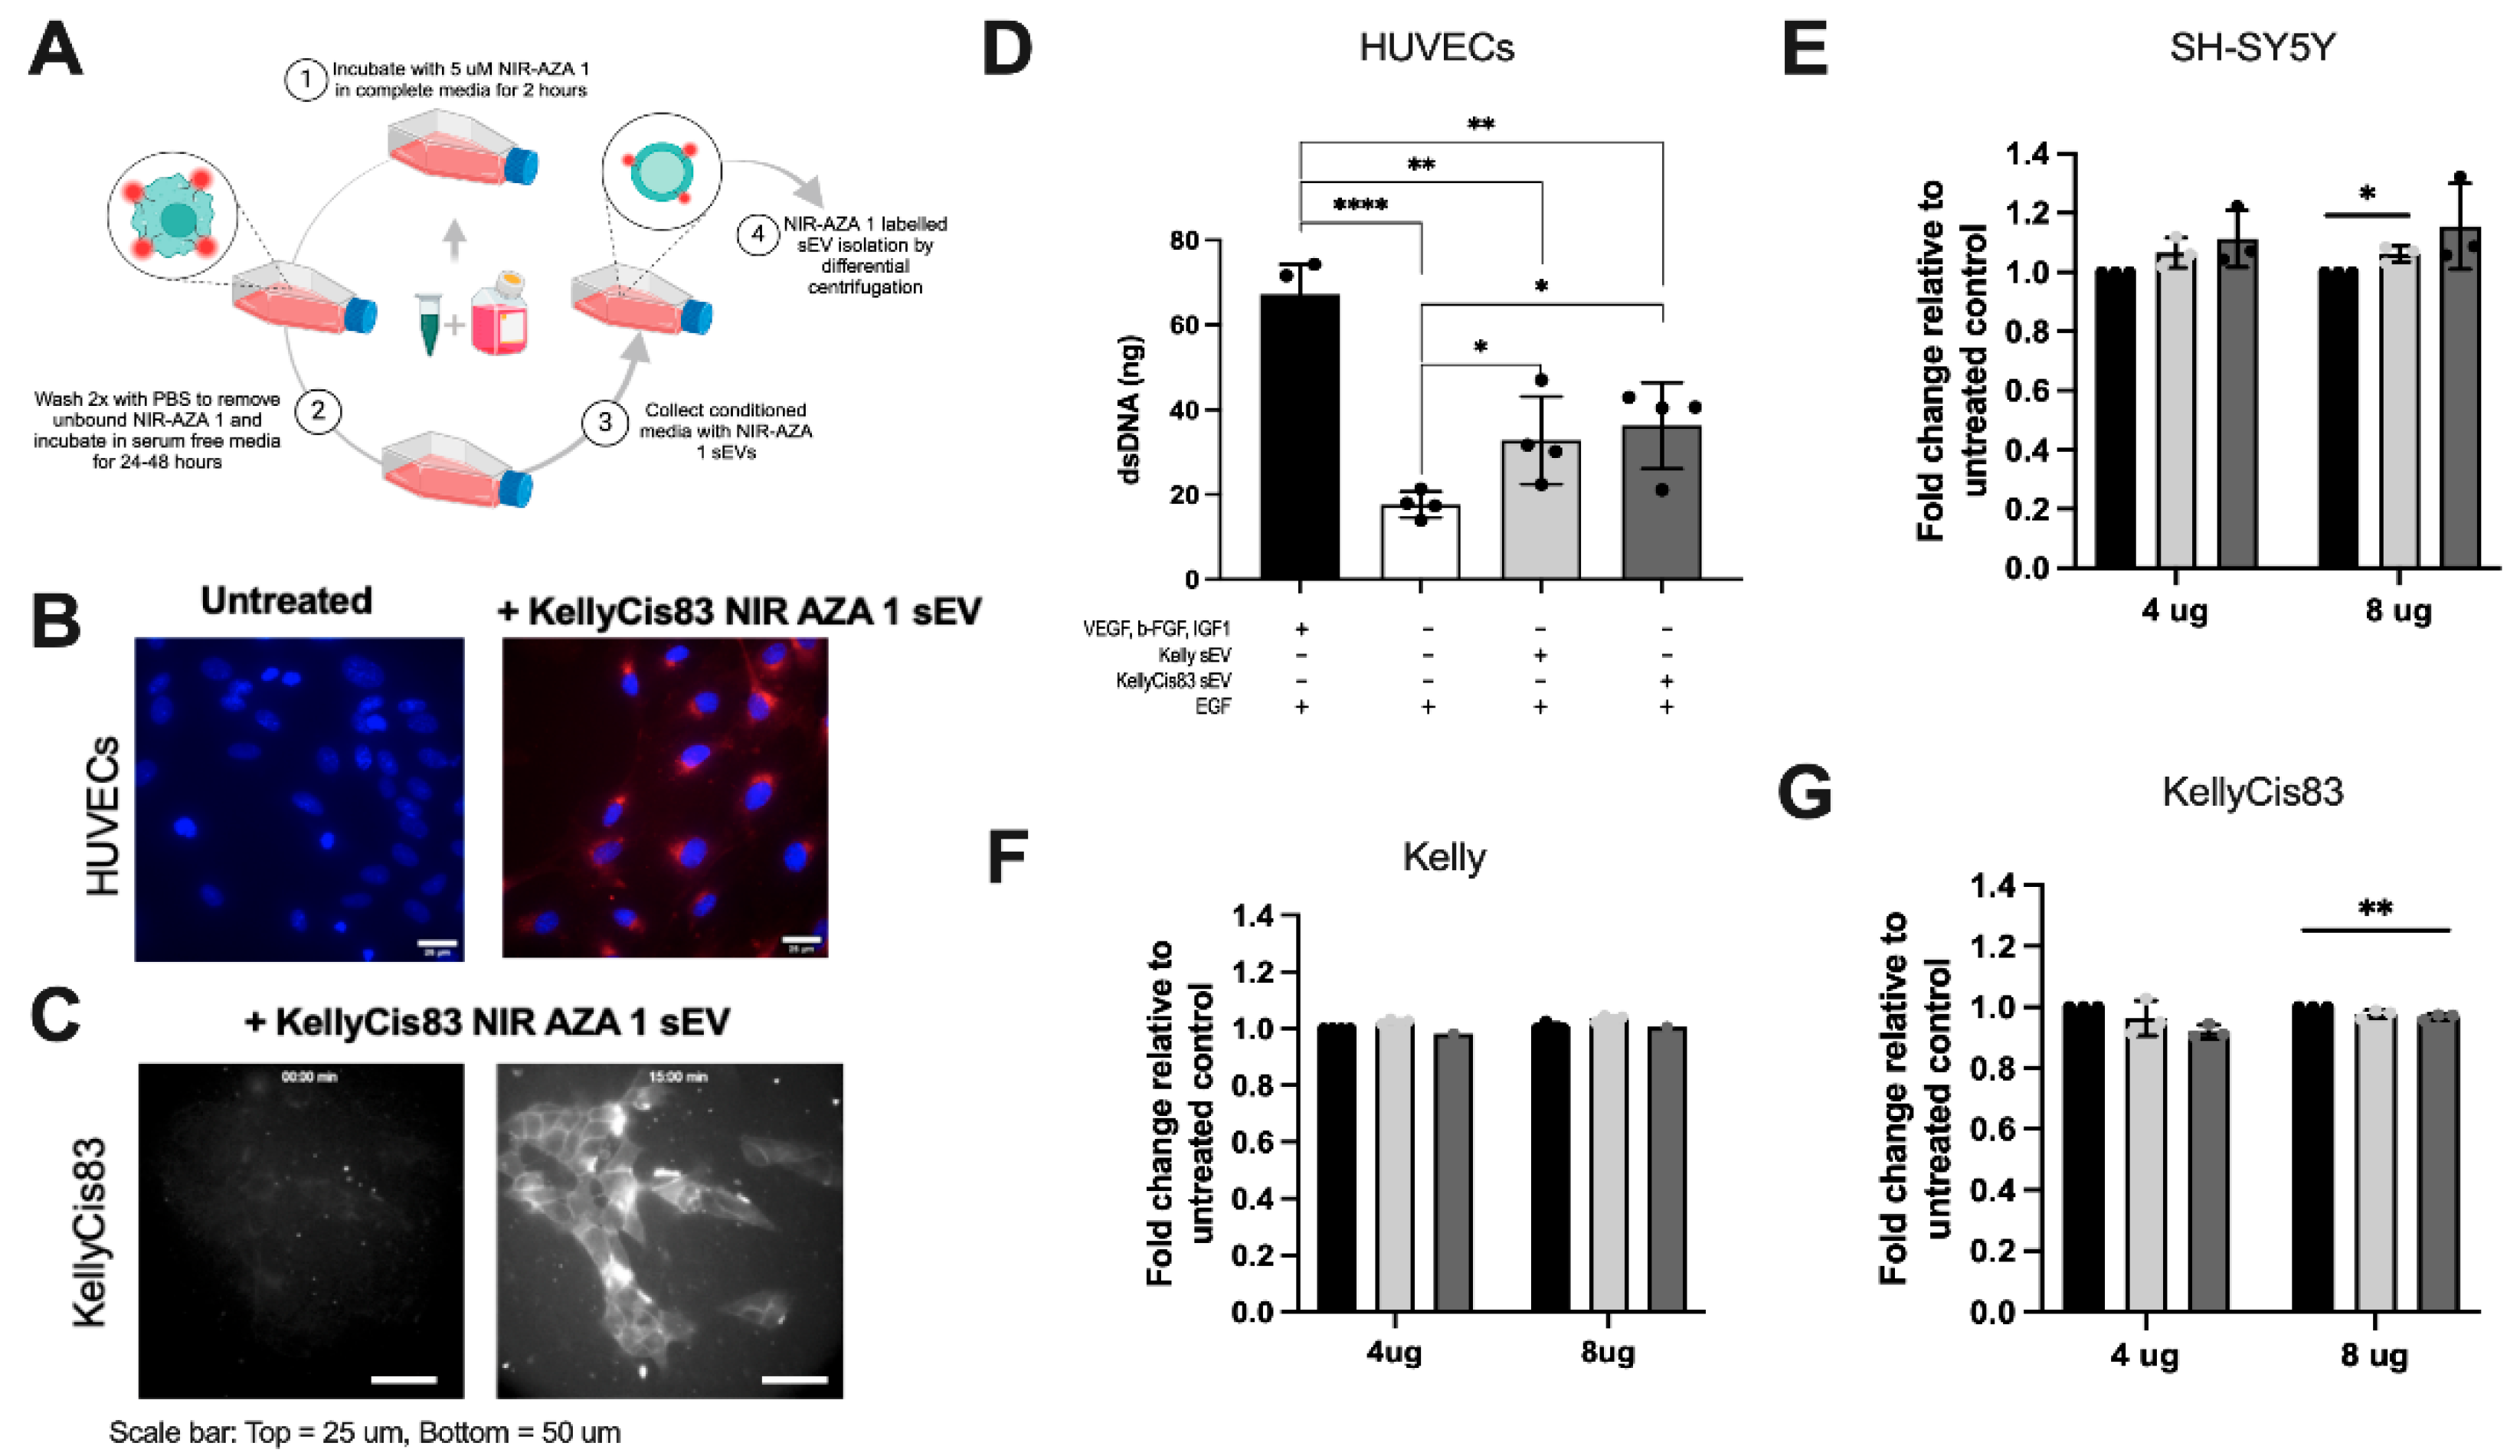
To visualise sEV uptake by cancerous (KellyCis83 cells) and non-cancerous (human umbilical vein endothelial cells (HUVECs)) recipients, we produced near-infrared fluorescent KellyCis83 sEVs using the previously reported endogenous labelling method with the NIR-AZA 1 fluorophore [18] (Figure 3A). Next, we incubated HUVECs with either PBS or NIR-AZA 1-labelled KellyCis83 sEVs in 5% CO2 at 37⁰C. After 3 hours, the HUVECs were washed with HBSS, fixed in paraformaldehyde (PFA), counterstained with Hoechst, and then visualised using confocal microscopy (Figure 3B). Cellular fluorescence of recipient KellyCis83 cells was observed following 15 minutes of incubation with NIR-AZA 1-labelled KellyCis83 sEVs. Cells were imaged by live widefield fluorescent microscopy at 0 minutes and 15 minutes (Figure 3C).
Figure 3.
sEVs taken up by cancerous and non-cancerous cells affect cell proliferation: (A) Schematic representation of NIR-AZA 1 labelling protocol; (B) Confocal imaging of HUVECs fixed in PFA and counterstained with Hoechst after incubation with PBS (untreated) or KellyCis83 NIR-AZA 1 sEVs. Scale bar = 25 µm; (C) Live fluorescent microscopy imaging time lapse of KellyCis83 NIR-AZA 1 sEV uptake in unlabelled KellyCis83 cells at 0 minutes and 15 minutes. Scale bar = 50 µm; (D) Proliferation of HUVECs, measured by dsDNA, 5 days after treatment with 4 μg Kelly's sEVs and KellyCis83's sEVs (n=3). The bar colour coding for treatments: positive control (GF+) is black, negative control (GF-) is white, Kelly sEV treatment is light grey, and KellyCis83 sEV treatment is dark grey; (E) Fold change of cell proliferation (dsDNA) of SH-SY5Y, (F) Kelly and (G) KellyCis83 cells five days after treatment with 4 μg or 8 μg of Kelly and KellyCis83 sEVs. Data collected from three technical replicates. Bar colour coding for treatments: untreated is black, Kelly's sEV is light grey, and KellyCis83's sEV is dark grey. Data represented as mean ± standard deviation of fold change relative to untreated control. Statistical significance was calculated by a Student’s unpaired t-test (* = p ≤ 0.05 and ** = p ≤ 0.01, only statistically significant values graphed).
3.4. Cell Proliferation Demonstrated a Dose-Dependent Response to sEV Treatment
We then investigated whether the active uptake of Kelly and KellyCis83 sEVs in cancerous and non-cancerous cells affects their proliferation. We observed increased proliferation in HUVECs treated with Kelly and KellyCis83 sEVs (Figure 3D). HUVECs cultured in HUVEC media lacking the angiogenic factors VEGF, IGF-1 and b-FGF (GF-) were treated with 4 μg Kelly and KellyCis83 sEVs 24 hours post-seeding. HUVECs cultured in GF+ and GF- media with an equal volume of PBS in place of treatment were used as positive and negative controls. After five days of culture, dsDNA was measured to ascertain the HUVEC rate of proliferation. The proliferative rate of HUVECs treated with Kelly and KellyCis83 sEVs was increased by >16% (p = 0.04) and >30% (p = 0.03), respectively, compared to the untreated negative control.
NB cells with different MYCN status were then treated with 4 μg and 8 μg of Kelly and KellyCis83 sEVs (Figure 3E-G). When treating MYCN-amplified Kelly and KellyCis83 cells with sEVs, Kelly cells had no significant change in proliferation. However, the proliferation rate of KellyCis83 cells decreased by 8% (p = 0.007) and 3.2% (p = 0.0092) when treated with 4 ug and 8 ug of KellyCis83 sEVs, respectively, when compared to the untreated control. Conversely, non-MYCN-amplified SH-SY5Y cells had an observable increase in proliferation compared to the untreated control, an effect that was enhanced with higher quantities of KellyCis83 sEVs. The proliferation of SH-SY5Y cells increased by 14% (p = 0.005) and 18% (p = 0.002) with Kelly and KellyCis83 sEV treatment, respectively. The characteristic of Kelly and KellyCis83 sEVs with amplified MYCN, a known oncogenic transcription factor, may be responsible for this effect in non-MYCN-amplified cells.
3.5. sEVs Secreted by Neuroblastoma Cells Increased Lactate Secretion and Altered Metabolic Pathways in HUVECs
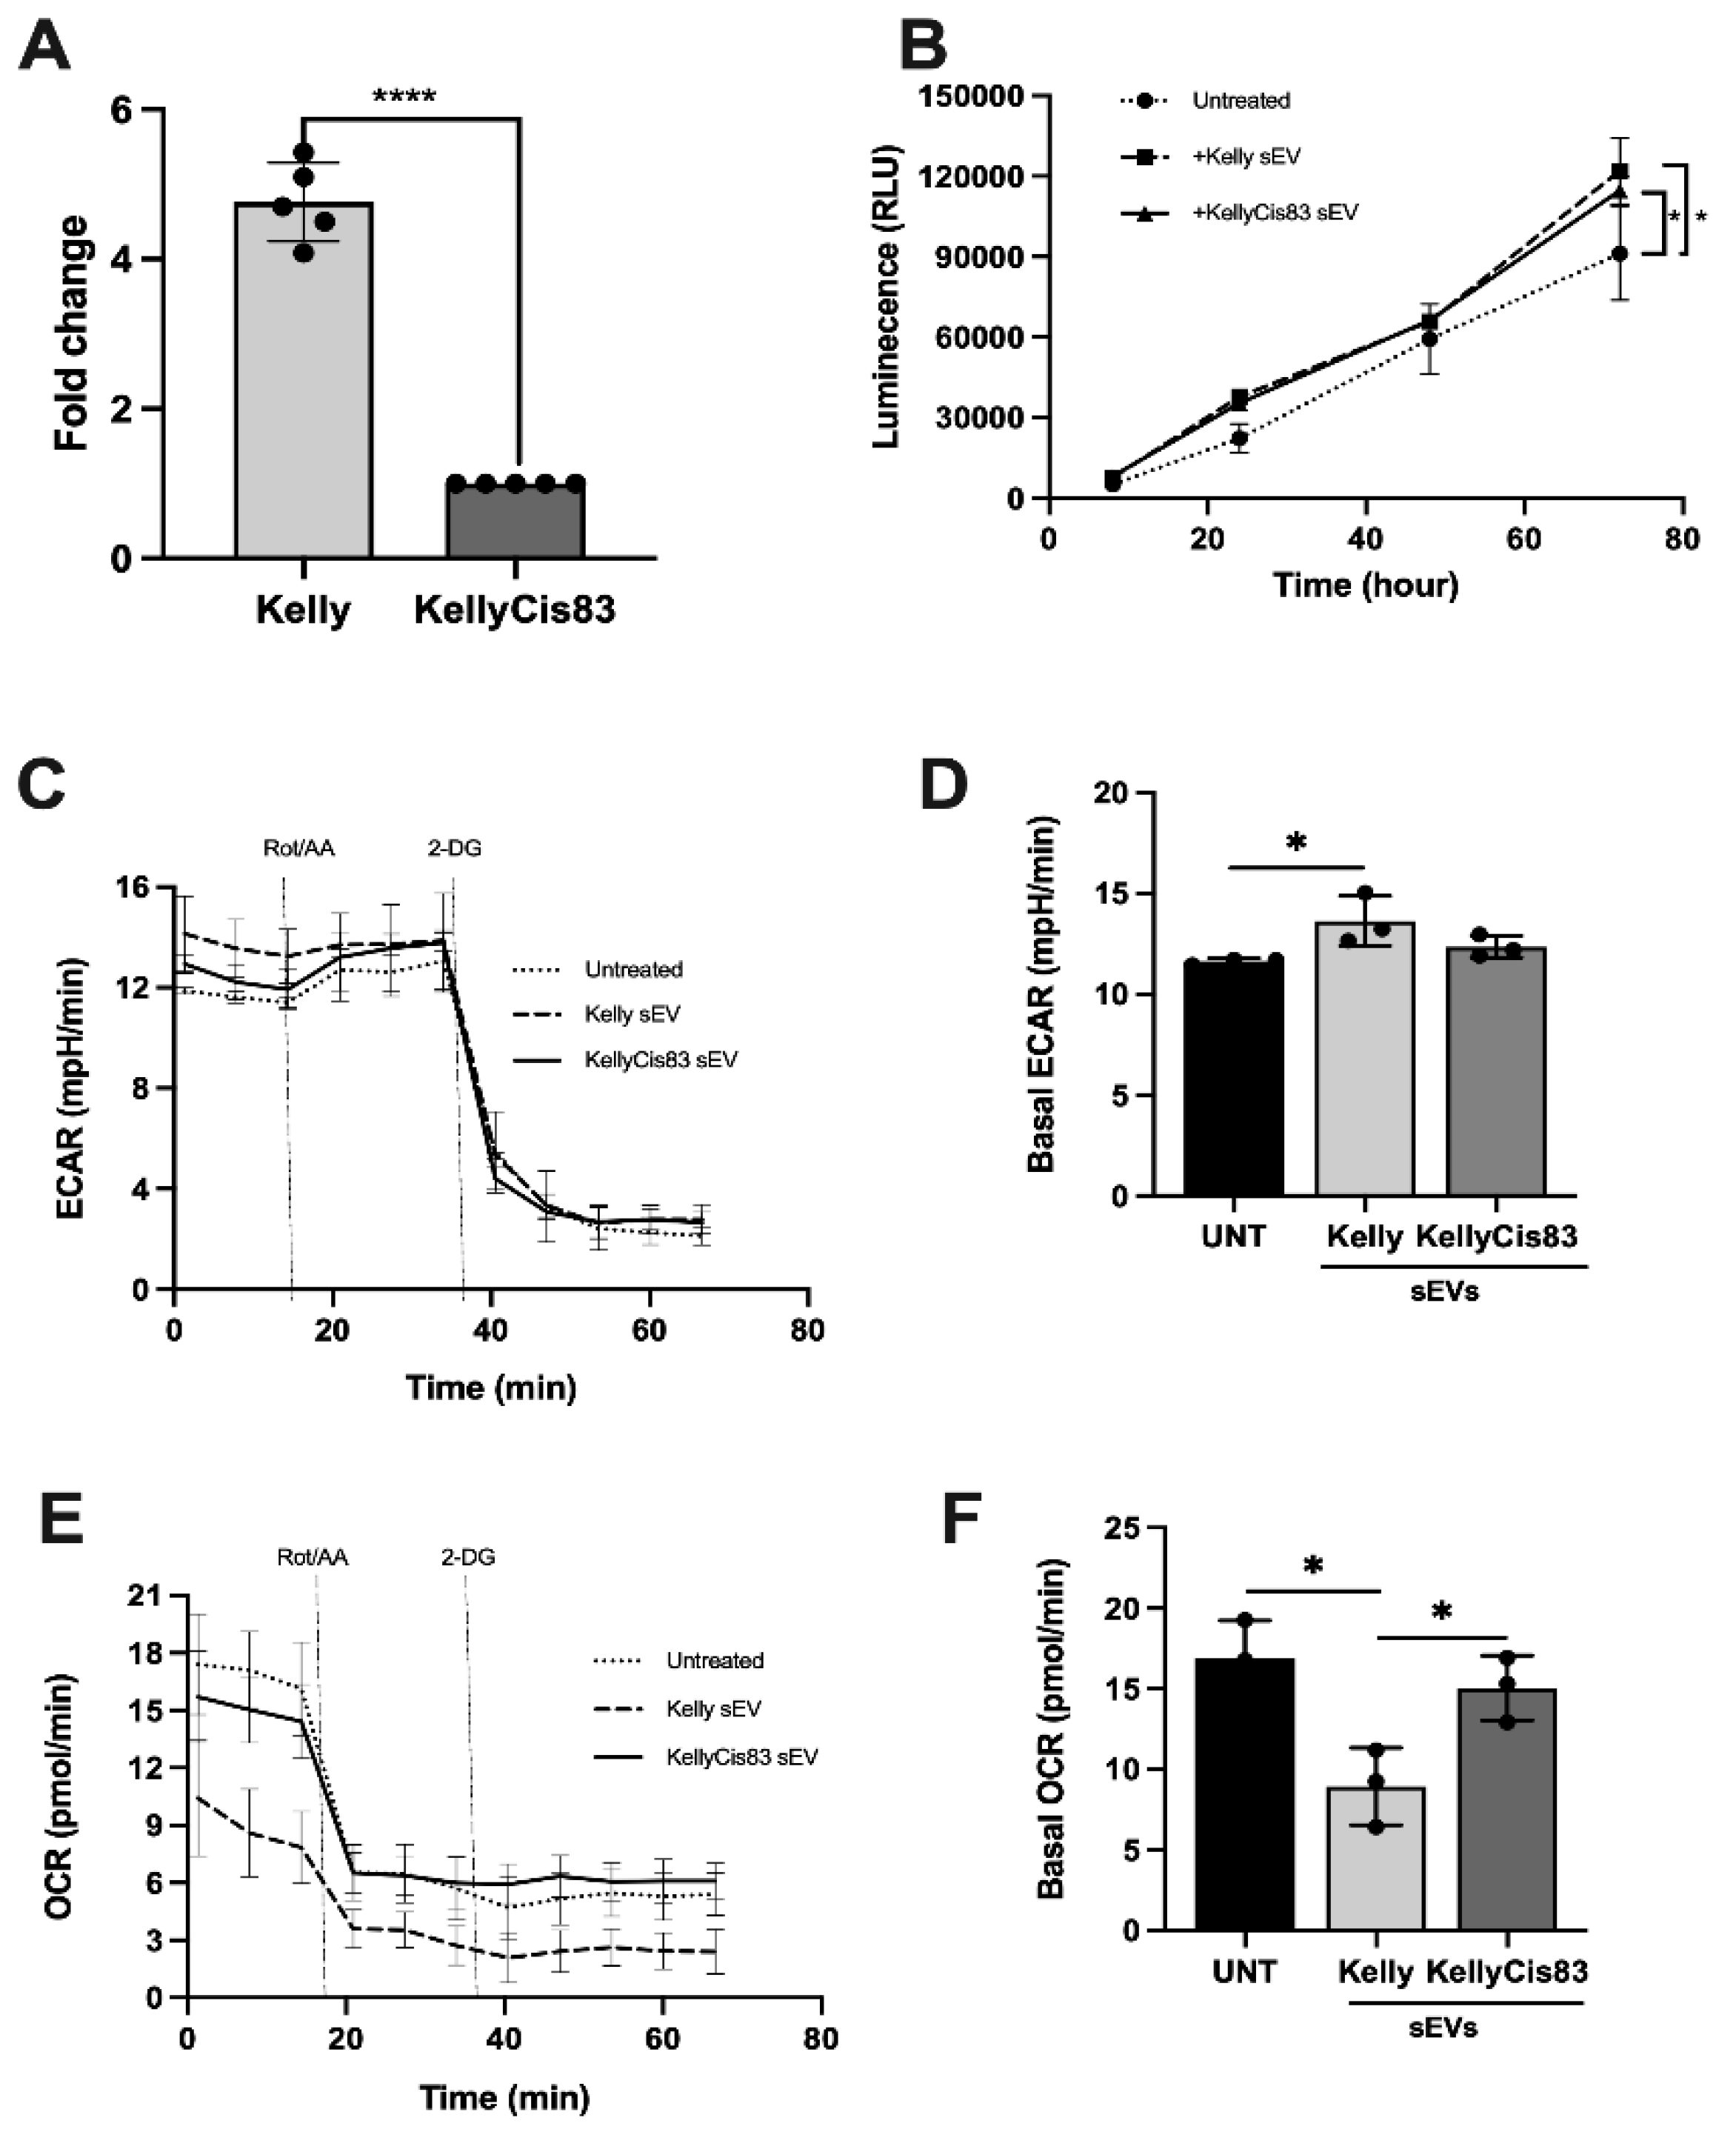
Proteomic analysis of Kelly and KellyCis83 cells and their corresponding sEVs identified several dysregulated biological pathways related to metabolism and glycolysis (Figure 2). To validate this altered metabolic proteome, we first analysed lactate secretion, a metabolite of the glycolysis pathway closely related to cell proliferation, in Kelly and KellyCis83 cells. To control for changes in proliferation due to culture media and sEV treatment, we normalised lactate secretion to dsDNA yield. After 72 hours of culture, Kelly cells secreted >4.7 fold (p = 0.0001) more lactate compared to KellyCis83 (Figure 4A). To determine if sEVs could alter lactate secretion in cells of the NB microenvironment, we treated HUVECs with 10 μg of Kelly and KellyCis83 sEVs. Lactate secreted from HUVECs was measured at 8, 24, 48, and 72 hours. Lactate secretion in HUVECs 72 hours post sEV treatment increased by 33% (p = 0.03) and 25% (p = 0.04) when treated with Kelly and KellyCis83 sEVs, respectively, compared to the untreated negative control (Figure 4B). This indicates that Kelly and KellyCis83's sEVs can metabolically reprogram endothelial cells. To confirm this finding further, we performed the Seahorse XF Glycolytic Rate Assay on HUVECs treated with 10 µg of Kelly and KellyCis83 sEVs 48 hours prior to analysis on the Seahorse XF Analyser. We found that Kelly's sEVs significantly increased the extracellular acidification rate (ECAR) of HUVECs compared to the untreated control (Figure 4C,D). Conversely, Kelly's sEVs significantly decreased the oxygen consumption rate (OCR) of HUVECs (Figure 4E,F). This demonstrates that Kelly’s sEVs increase the glycolytic rate and decrease the oxidative phosphorylation rate in HUVECs due to sEV enrichment with glycolytic enzymes (Figure 2).
Figure 4.
Metabolic reprogramming of HUVECs by Kelly and KellyCis83 sEVs: (A) Lactate secretion in Kelly and KellyCis83 cells represented as fold change relative to KellyCis83 after normalisation to dsDNA yield. Data represented as the mean ± standard deviation of 5 technical replicates; (B) Lactate secretion of HUVECs measured at 8, 24, 48, and 72 hours after treatment with 10 μg of Kelly and KellyCis83 sEVs; (C, D) Seahorse glycolytic rate assay: extracellular acidification rate and (E, F) oxygen consumption rate of HUVECs treated with 10 µg of Kelly and KellyCis83 sEVs (n = 3). The bar colour coding for treatments: untreated is black, Kelly's sEVs is light grey, and KellyCis83's sEVs is dark grey. Data represented as the mean ± standard deviation. Statistical significance was calculated by a Student’s unpaired t-test (* = p ≤0.05 and ** = p ≤ 0.01, only statistically significant values graphed).
3.6. KellyCis83 sEVs Increased Anchorage-Dependent Differentiation of HUVECs
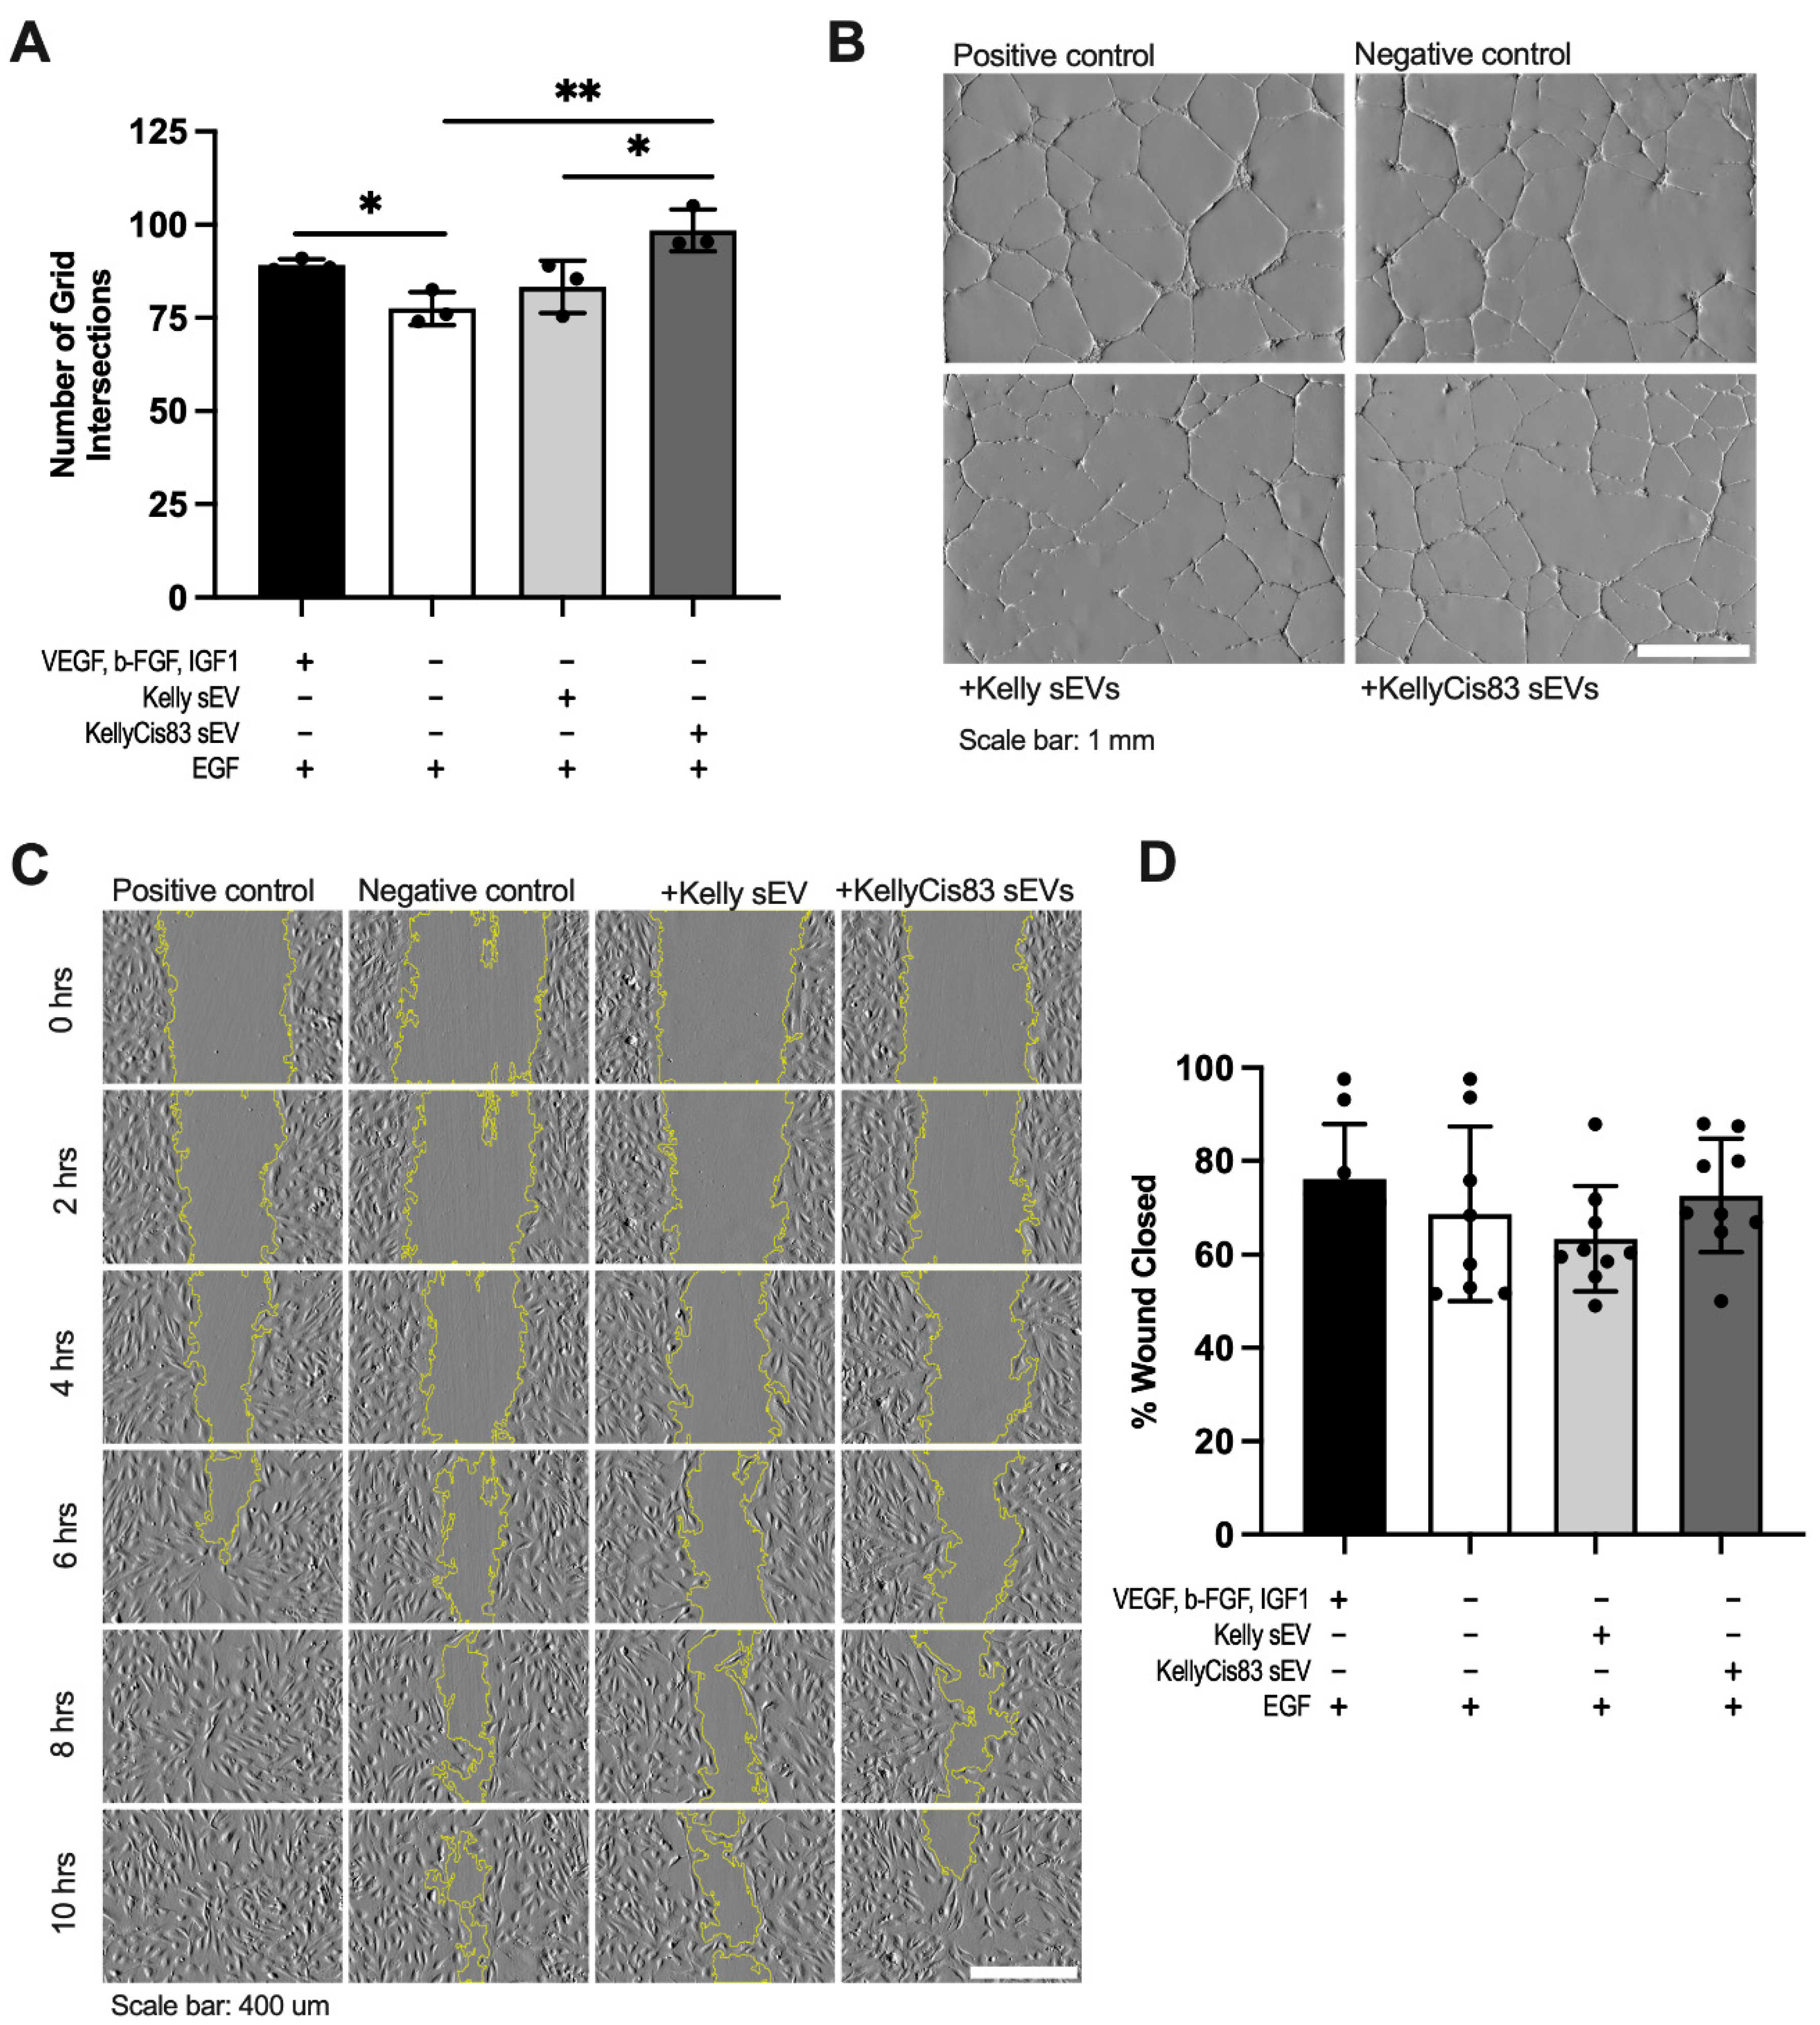
After confirming the ability of neuroblastoma sEVs to alter cell proliferation and metabolism of HUVECs, we decided to test the ability of Kelly and KellyCis83 sEVs to trigger their anchorage-dependent differentiation. We performed a tubule formation assay by seeding HUVECs on Matrigel in HUVEC media lacking the angiogenic factors VEGF, b-FGF, and IGF-1 (GF-). The cells were then treated with 20 μg of Kelly or KellyCis83 sEVs. The negative control (GF-) and positive control (GF+) were treated with an equal volume of PBS. After 24 hours, we performed a stereoscopic analysis and counted each instance in which a tubule intersected a 114,344.90 μm2 grid. We demonstrated that GF- media significantly decreased tubule formation compared to HUVECs cultured in GF+ media containing angiogenic factors (Figure 5A). We identified amplified tubule formation in HUVECs cultured in GF- media in response to KellyCis83 sEV treatment. HUVECs treated with KellyCis83 had 27% more tubule formation (p = 0.007) compared to the negative control and 18% more compared to HUVECs treated with Kelly's sEVs (p = 0.04) (Figure 5A,B).
To verify that the observed anchorage-dependent differentiation abolishes HUVECs' migration in response to Kelly and KellyCis83 sEV exposure, we performed a scratch assay. We measured the percentage of wound closure after 10 hours. In GF+ media, 25,000 HUVECs were seeded into each well of a 0.22 cm2 insert. After 24 hours, the insert was removed, and cells were treated with 8 μg of Kelly or KellyCis83 sEVs and GF- media. The positive and negative control media were replaced with GF+ and GF- media, respectively. While no significant changes in migration were observed when HUVECs were exposed to Kelly or KellyCis83 sEVs compared to the negative control, KellyCis83 sEVs had an observed higher capacity of migration in comparison to Kelly sEVs by 10 hours (Figure 5C,D). Either an increased amount of KellyCis83 sEVs or more frequent treatment with sEVs may further stimulate cell migration.
Figure 5.
Anchorage-dependent differentiation of HUVECs treated with Kelly and KellyCis83 sEVs: (A) Tubule formation in HUVECs 24 hours after treatment with 20 μg of Kelly and KellyCis83 sEVs measured by the number of tubule intersections with a 114,344.90 μm2 grid. Graphs display the mean ± standard deviation of three technical replicates; (B) Representative images of HUVECs in GF+ and GF- media treated with PBS and HUVECs in GF- media treated with Kelly's sEVs and KellyCis83 sEVs. Scale bar = 1 mm; (C) Representative images of HUVECs in scratch assay with Kelly and KellyCis83 sEV treatment over 10 hours. Scale bar = 400 μm; (D) Percentage of wound closure 10 hours after treatment of HUVECs with 8 μg Kelly and KellyCis83 sEVs. Graphs display the mean ± standard deviation of three technical replicates. The bar colour coding for treatments: positive control (GF+) is black, negative control (GF-) is white, Kelly's sEV treatment is light grey, and KellyCis83's sEV treatment is dark grey. Statistical significance was calculated by a Student’s unpaired t-test (* = p ≤ 0.05 and ** = p ≤ 0.01, only statistically significant values graphed).
3.7. Transfer of Chemoresistance via KellyCis83 sEVs
To determine the ability of sEVs derived from KellyCis83 cells to transfer the cisplatin resistance phenotype to cisplatin-sensitive NB Kelly and SH-SY5Y cells, we treated Kelly and SH-SY5Y cells with Kelly and KellyCis83 sEVs in conjunction with cisplatin.
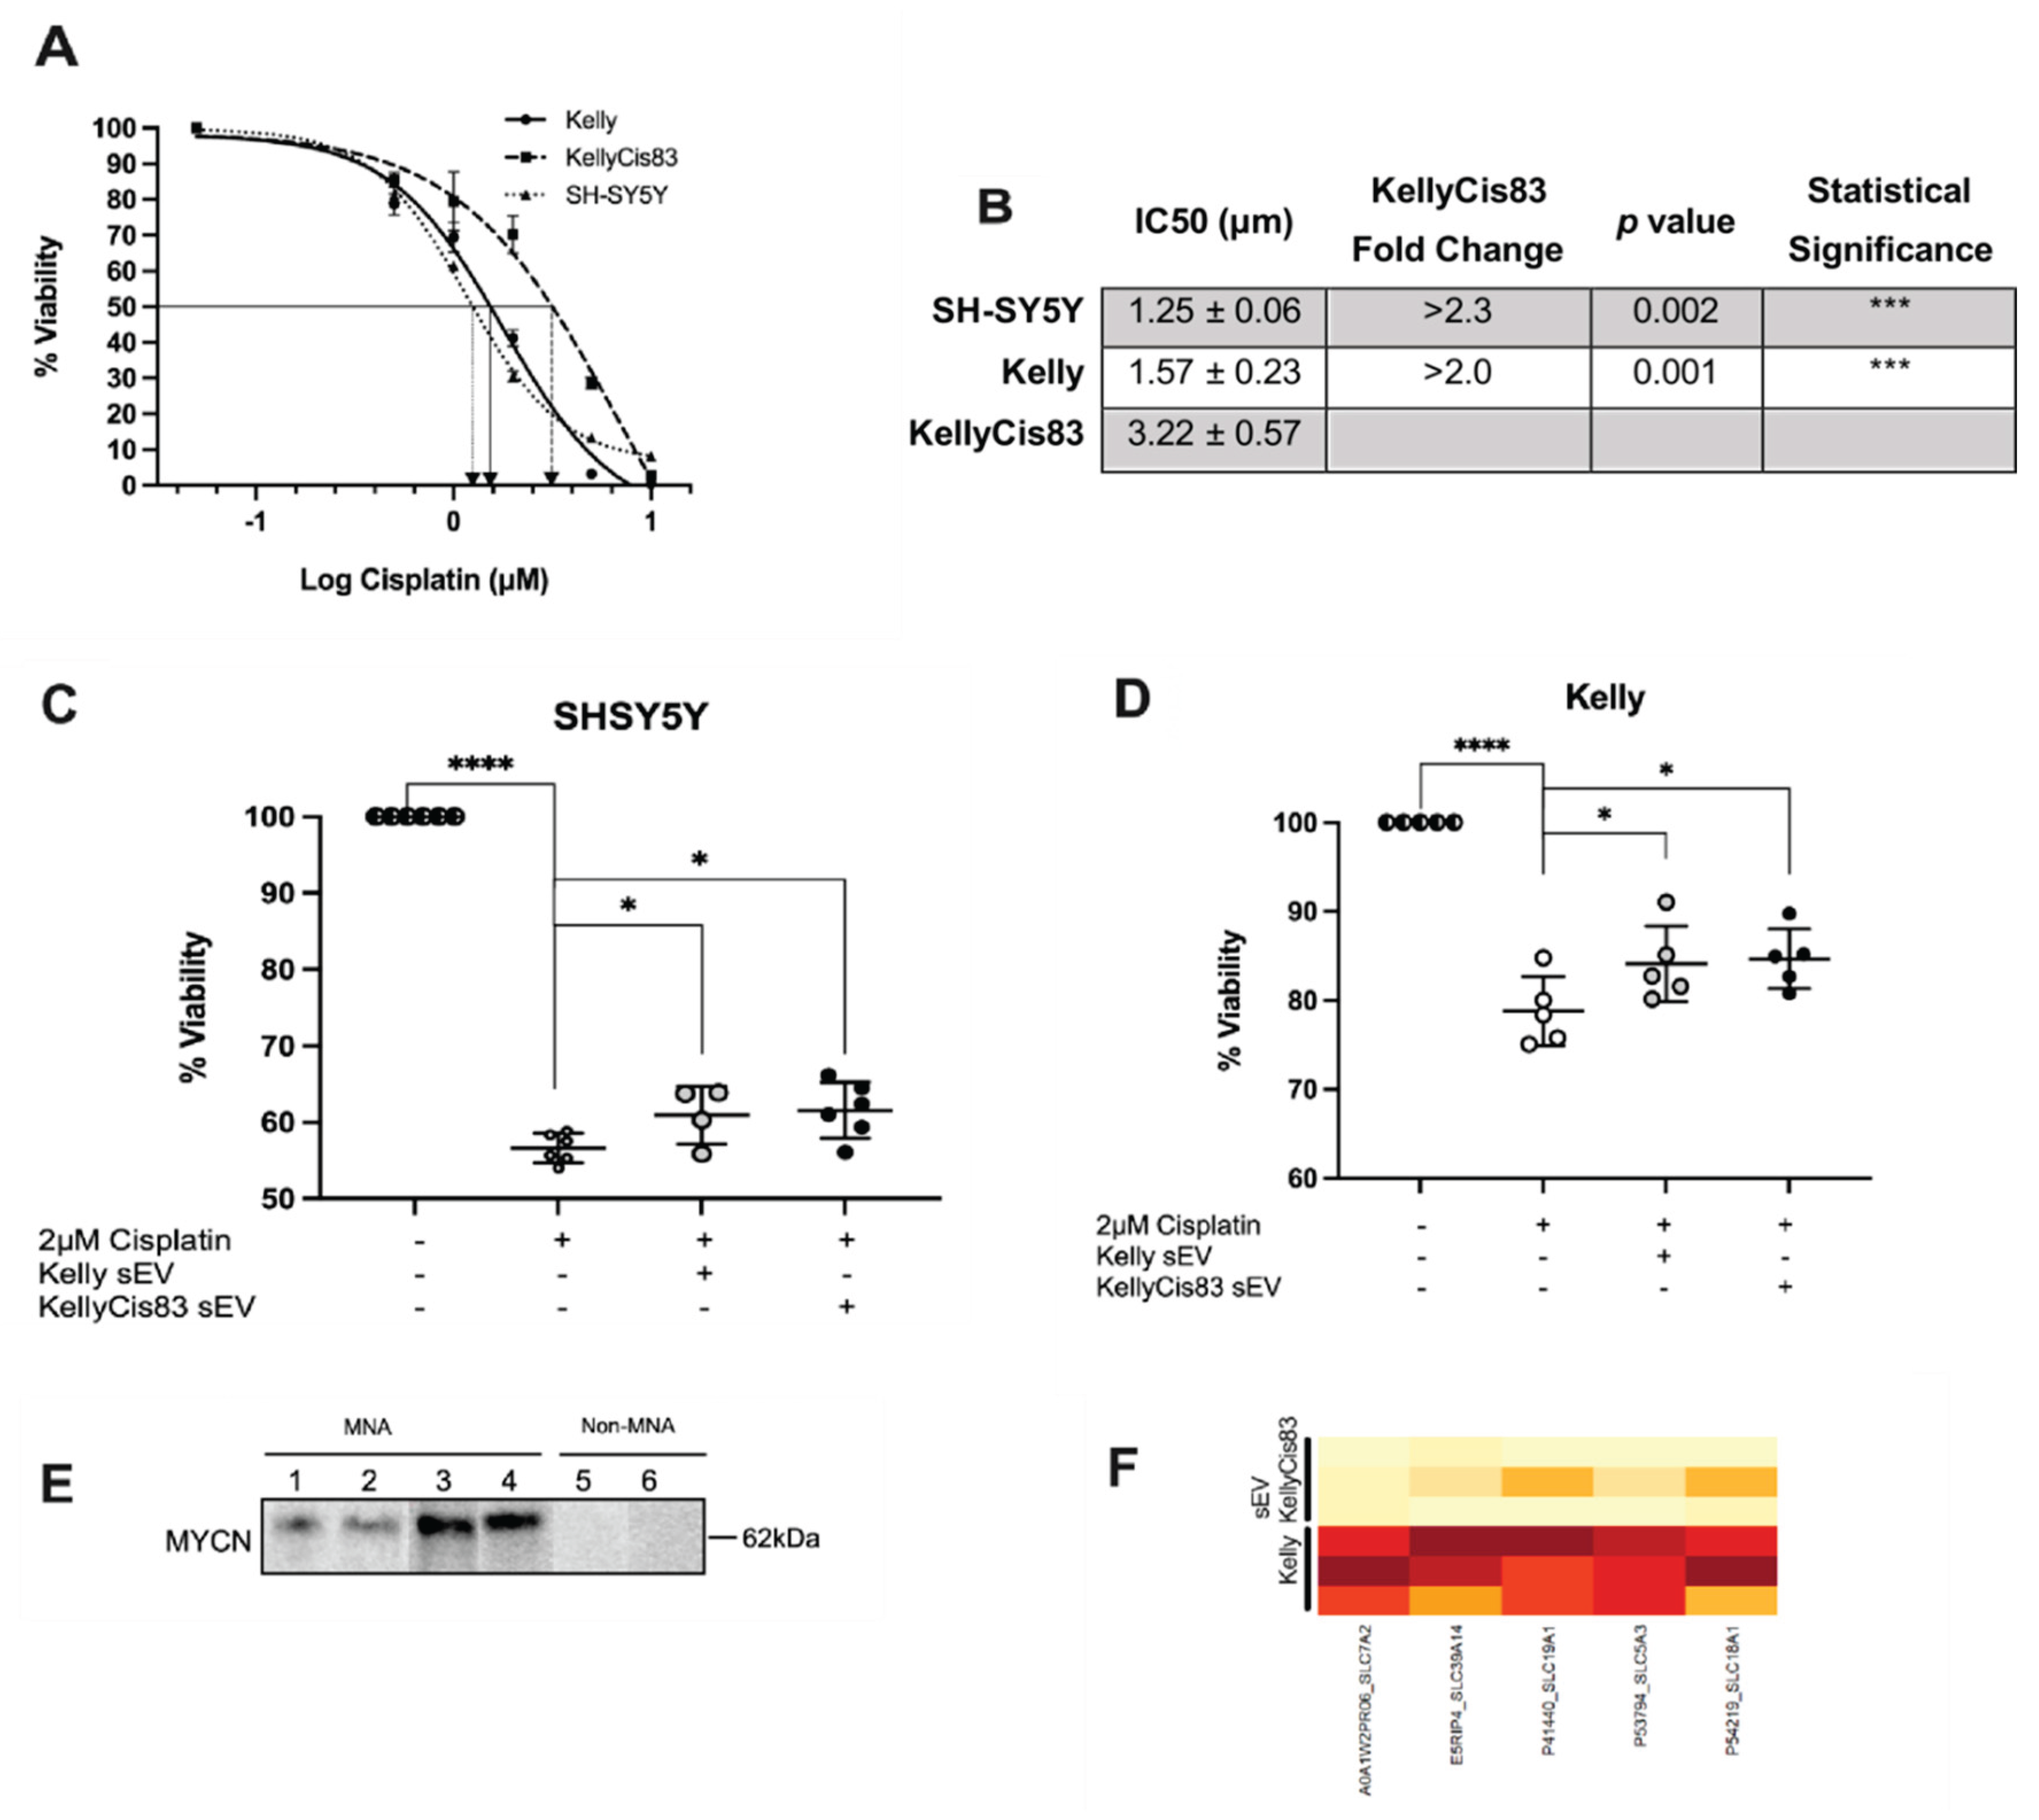
The appropriate dose of cisplatin for this experiment was extracted from the cisplatin dose response curve for Kelly, KellyCis83 and SH-SY5Y (Figure 6A,B). The half-maximal inhibitory concentrations (IC50) were determined by fitting a non-linear regression curve, with a baseline of zero, to the percentage of viable cells after increasing doses of cisplatin. The IC50 values of cisplatin treatment were 3.22 µM for KellyCis83 cells, 1.57 µM for Kelly cells and 1.25 µM for SH-SY5Y cells. When compared to Kelly and SH-SY5Y cells, the KellyCis83 IC50 was > 2-fold higher (p = 0.001) and > 2.3-fold higher (p = 0.002), respectively.
Kelly and SH-SY5Y cells were treated twice with 8 µg sEVs (total of 16 µg sEV treatment), in the 48 hours prior to treatment with 2 µM of cisplatin, and their approximate IC50 concentrations of cisplatin. Five days post cisplatin treatment, we measured cellular adenosine triphosphate (ATP) to calculate cellular viability. There was an average increase of 4.3% (p = 0.04) and 5.0% (p = 0.01) in SH-SY5Y viability with Kelly and KellyCis83 sEV treatment, respectively (Figure 6C). We observed a 6.08% (p = 0.04) increase in the viability of Kelly cells treated with Kelly sEVs and an increase of 6.62% (p = 0.02) with KellyCis83 sEV treatment (Figure 6D).
The sEVs isolated from Kelly and KellyCis83 cells were found to similarly protect NB cells from the effects of cisplatin, possibly due to the amplification of the MYCN oncogenic transcription factor. Western blot analysis of sEVs derived from NB cells confirmed MYCN-amplification in KellyCis83, Kelly, SK-N-BE(2), and NB-1691 sEVs, as well as the non-MYCN-amplification in SH-SY5Y and SK-N-AS sEVs (Figure 6E, Figure S2, Table S2). While bioinformatic analysis did not find any significant upregulation of drug transporters in KellyCis83 sEVs, it found several solute carrier (SLC) proteins that contribute to significantly enriched pathways, mainly related to amino acid transport, suggesting dysregulated cellular transport in KellyCis83 sEVs (Figure 6F). Lack of significant changes in drug transporter expression suggests that sEV protective effects are not due to altered cisplatin transport.
4. Discussion
Very little research has been conducted on how chemoresistant cancer cells influence sEV signalling in neuroblastoma (NB). In this study, we employed an in vitro model of a cisplatin-resistant NB (KellyCis83) developed in our lab [6,19,20] to characterise changes in the sEV proteome, to evaluate associated phenotypic changes and to investigate the potential for chemoresistance transfer promoted by sEVs. The number of differentially expressed proteins in KellyCis83 sEVs suggests functional shifts that could alter communication with recipient cells. Our findings are supported by a recent study demonstrating an altered exosomal protein composition in response to ionising radiation of NB SH-SY5Y cells [28]. An increase in viability, migration, and radio resistance in non-irradiated SH-SY5Y cells treated with irradiation-induced EVs was reported. This suggests that sEVs secreted by cisplatin-resistant NB cells may promote similar pro-survival or pro-tumourigenic signals in various recipient cell types.
4.1. Metabolic Reprogramming
In KellyCis83's sEVs, the majority of pathways altered were related to glycolysis, mirroring pathways identified in the parental cells in the early work by Piskareva et al. Ingenuity Pathway Analysis in that study identified enrichment of proteins in KellyCis83 cells related to sucrose degradation, glycolysis and gluconeogenesis [20]. Further validation of proteomics and gene ontology results demonstrated that cisplatin-sensitive Kelly cells produced >4.7 fold more lactate than cisplatin-resistant KellyCis83 cells, indicating a metabolic shift. The cisplatin-resistant modulation of glycolysis effect has also been reported in ovarian cancer [2]. Increased glycolysis and reduced oxidative phosphorylation (OXPHOS) are metabolic features characteristic of hypoxic cancer cells [7], which we found more pronounced in Kelly's sEVs compared to KellyCis83's sEVs. The growing evidence suggests that tumour cells undergo metabolic reprogramming to survive and promote resistance to chemotherapy agents [4,7,17]. The metabolic symbiosis phenomenon describes how tumour cells switch between aerobic glycolysis and OXPHOS depending on the tumour microenvironment (TME) and amplified oncogenes such as MYCN [17,29]. Therefore, the primary driver behind KellyCis83's resistance to cisplatin is likely mediated by an altered metabolism, which is reflected in the sEV proteome by identified proteins that contribute to metabolism and respiration rather than proteins of drug transporter families. Interestingly, both Kelly and KellyCis83 sEVs reprogrammed HUVECs to increase lactate secretion at equivalent levels. While the sEV-induced aerobic glycolytic rate is similar, OXPHOS is significantly reduced in HUVECs treated with Kelly’s sEVs compared to KellyCis83’s sEVs. Our data provide direct evidence that NB-derived sEVs can reprogram the metabolome of endothelial cells in vitro.
4.2. Angiogenic Differentiation
Characterisation of the growth dynamics of HUVECs cultured in modified growth media, GF-, demonstrated a reduction in cellular viability and proliferation. Utilising this modified media, we observed an increase in tubule formation in HUVECs treated with KellyCis83 sEVs compared to Kelly sEV treatment. This indicates that the adaptation of cisplatin resistance through sEV transfer results in enhanced anchorage-dependent differentiation without affecting proliferation or migration. Interestingly, we observed similar levels of tubule formation in HUVECs treated with KellyCis83 sEVs compared to HUVECs treated with pro-angiogenic growth media (GF+). Both Kelly and KellyCis83 sEVs had increased proliferation compared to the untreated negative control. Additionally, HUVEC migration was unaffected by either Kelly or KellyCis83 sEV treatment. A recent study with similar results reported that prokineticin receptor 1 (PKR1) positive exosomes derived from ovarian cancer cell lines A2780 and HO-8910 increased tubule formation and migration in HUVECs, but did inhibit HUVEC proliferation and cell viability [36].
Previous studies have demonstrated that sEVs derived from drug-resistant cancer cells promote angiogenesis via different mechanisms [14,37], though few link metabolic changes that promote angiogenesis and chemoresistance [30]. For example, Li et al. found that sEVs derived from cisplatin-resistant ovarian cancer cells SKOV3-DPP increased tubule formation, proliferation and migration of HUVECs in vitro, compared to sEVs derived from cisplatin-sensitive SKOV-3 cells [14]. A similar study by Zheng et al. demonstrated that EVs from 5-fluorouracil-resistant colon cancer cells (HCT-15/FU) increased HUVEC proliferation, migration and tubule formation in vitro, compared to EVs from 5-fluorouracil-sensitive HCT-15 cells [37]. In vivo, these cell-derived resistant EVs also increased microvascular density in a rat abdominal aortic neovascularisation assay, compared to EVs derived from sensitive cells. Growth/differentiation factor 15 (GDF15) was found to be enriched in HCT-15/FU EVs. When delivered to HUVECs, GDF15 increased transforming growth factor beta receptor type 3 (TGFBR-3) expression, which subsequently decreased phosphorylated SMAD2/3 expression. Inhibition of the SMAD signalling pathway in this context can increase the expression of pro-angiogenic factor periostin.
Similarly, in acute myeloid leukaemia (AML), exosomes enriched with vascular endothelial growth factor (VEGF) and VEGF receptor (VEGFR) messenger RNA enhanced endothelial cell glycolysis and proliferation, leading to the promotion of chemoresistance in AML cells. [30].
Figure 6.
Kelly and KellyCis83 sEVs can reduce cisplatin toxicity in NB cells: (A) Cisplatin dose response curve in Kelly, KellyCis83 and SH-SY5Y cells. Data represented as mean ± standard deviation of three technical replicates; (B) IC50 values of Kelly, KellyCis83 and SH-SY5Y cells treated with cisplatin. IC50 fold change values are relative to KellyCis83 IC50; (C) Percentage viability of SH-SY5Y and (D) Kelly cells treated with two doses of 8 µg Kelly and KellyCis83 sEVs and 2 µM cisplatin. Viability was measured by cellular ATP production 5 days post-cisplatin treatment. Data represented as mean ± standard deviation of a minimum of four technical replicates. Circle colour coding for treatments: untreated is half black, cisplatin treated is white, Kelly's sEVs is light grey, and KellyCis83's sEVs is dark grey; (E) Western blot results of NB cell line-derived sEVs examined with MYCN target. MYCN-amplified NB-derived sEVs: (1) KellyCis83, (2) Kelly, (3) SK-N-BE(2), and (4) NB-1691. Non-MYCN-amplified NB-derived sEVs: (5) SH-SY5Y and (6) SK-N-AS. Images for MYCN-enriched sEVs are derived from different blots but incubated with the primary antibody in the same tray. (F) Bioinformatic analysis of Kelly and KellyCis83 sEV proteome for altered drug transporters. A darker orange colour indicates a higher protein abundance. Individual proteins were not differentially abundant in KellyCis83 sEVs.
4.3. Effects on Neuroblastoma Cell Proliferation
We also tested NB cell lines with increasing concentrations of sEVs to determine whether proliferative effects were dose dependent. However, we found that KellyCis83's sEVs did not transfer their proliferative phenotype to Kelly cells. Interestingly, exposure of KellyCis83 cells to 8 μg of their sEVs partially inhibited their proliferation, suggesting KellyCis83 sEVs export bioactive molecules detrimental to their own sustained proliferative signalling. In contrast, SH-SY5Y cells exhibited increased proliferation when treated with either Kelly or KellyCis83 sEVs in a dose-dependent manner, with no significant difference between the two. This proliferative response could be attributed to MYCN amplification in Kelly and KellyCis83 cells, an oncogene transcription factor that confers an aggressive phenotype [10]. A study by Fonseka et al. demonstrated that sEVs from MYCN-amplified NB cells increased the colony-forming ability of non-MYCN-amplified SH-SY5Y cells [8]. In this scenario, MYCN may be able to “overwrite” some acquired changes during chemoresistance development once incorporated into sEVs.
4.4. sEV-Mediated Cisplatin Protection
While cisplatin and its derivatives remain the standard therapy for NB, patients who initially respond to treatment eventually develop chemoresistance with an approximate five-year overall survival rate of only 20%. In this study, we explored the ability of sEVs to protect cells from cisplatin cytotoxicity in vitro. However, Kelly and KellyCis83 sEVs offered equal protection against cisplatin toxicity in Kelly and SH-SY5Y recipient cells, suggesting that both share common regulators. MYCN transfer facilitated through sEVs could account for the observed limited protection against cisplatin. Notably, a similar level of ~ 5% protection against drugs has been reported for in vitro docetaxel-resistance in prostate cancer models, DU145RD and 22Rv1RD, despite 108 and 71-fold resistance to docetaxel compared to their respective aged parent cell lines [5]. The authors suggested that this effect was due to the transfer of MDR-1/P-gp to the recipient cells.
5. Conclusions
In summary, this study has highlighted a potential mechanism for sEVs derived from cisplatin-resistant NB cells to modulate varied cellular effects such as metabolism, proliferation, anchorage-dependent growth of endothelial cells, and cisplatin-resistance in recipient cells. Our findings demonstrated the ability of MYCN-amplified NB-derived sEVs to shift glycolysis/OXPHOS balance in NB and HUVEC cells, enhance tubule formation in HUVECs without proliferative or migratory effects, stimulate non-MYCN-amplified SH-SY5Y proliferation, and confer a modest protection against cisplatin resistance in recipient cells. This work supports promising future investigations of targeting sEV-mediated communication to counter chemoresistance in NB.
Supplementary Materials
The following supporting information can be downloaded at the website of this paper posted on Preprints.org.
Author Contributions
Conceptualization, T.F. and D.F.O. ;M.M.; O.P.; methodology, T.F.; D.W.; B.C.; D.F.O.; V.Z.; M.M.;O.P.; software, X.X.; validation, T.F. L.M.; B.C.; V.Z.; O.P.; and Z.Z.; formal analysis, T.F.; V.Z.; M.M.; O.P.;investigation, T.F.;L.M.; B.C.; V.Z.; O.P.;resources, X.X.; data curation, O.P.;; writing—original draft preparation, T.F. O.P.;; writing—review and editing, T.F. L.M.A.S.;D.F.O.; V.Z. M.M.;O.P.; visualization, T.F. L.M.;D.W.; O.P.; supervision, D.F.O.; V.Z.; M.L.; M.M.;O.P.; project administration, O.P.; funding acquisition, T.F.; M.L.;O.P.; All authors have read and agreed to the published version of the manuscript.”.
Funding
T.F. received support for this project through the Irish Research Council – National Children's Research Centre (EPSPG/2017/298). L.M., M.L. and O.P. received support through the RCSI - Soochow University StAR International PhD Programme. O.P. – RCSI Strategic Academic Recruitment (StAR) Programme, National Children’s Research Centre (Project grant (A/17/2)). A.S. received support from the Fulbright-RCSI Scholarship, DOS thanks the RCSI Super Resolution Imaging Consortium, funded by Science Foundation Ireland (18/RI/5723), and the Advanced Materials and BioEngineering Research (AMBER Research Centres Phase 2: 12/RC/2278_P2) for funding support.
Institutional Review Board Statement
Not applicable.
Informed Consent Statement
Not applicable.
Data Availability Statement
The original contributions presented in this study are included in the article/supplementary material. Further inquiries can be directed to the corresponding author.
Conflicts of Interest
The authors declare no conflict of interest.
References
- Ashburner, M.; et al. Gene Ontology: tool for the unification of biology. Nature Genetics 2000, 25, 25–29. [Google Scholar] [CrossRef]
- Catanzaro, D.; et al. Inhibition of glucose-6-phosphate dehydrogenase sensitises cisplatin-resistant cells to death. Oncotarget 2015, 6, 30102–30114. [Google Scholar] [CrossRef]
- Challagundla, K. B.; et al. Exosome-Mediated Transfer of microRNAs Within the Tumor Microenvironment and Neuroblastoma Resistance to Chemotherapy. JNCI: Journal of the National Cancer Institute 2015, 107. [Google Scholar] [CrossRef]
- Colla, R.; et al. Glutathione-mediated antioxidant response and aerobic metabolism: two crucial factors involved in determining the multi-drug resistance of high-risk neuroblastoma. Oncotarget 2016, 7, 70715–70737. [Google Scholar] [CrossRef] [PubMed]
- Corcoran, C.; et al. Docetaxel-Resistance in Prostate Cancer: Evaluating Associated Phenotypic Changes and Potential for Resistance Transfer via Exosomes. PLoS ONE. 2012, 7, e50999. [Google Scholar] [CrossRef] [PubMed]
- Curtin, C.; et al. A physiologically relevant 3D collagen-based scaffold–neuroblastoma cell system exhibits chemosensitivity similar to orthotopic xenograft models. Acta Biomaterialia 2018, 70, 84–97. [Google Scholar] [CrossRef] [PubMed]
- Desbats, M. A.; et al. Metabolic Plasticity in Chemotherapy Resistance. Frontiers in Oncology 2020, 10. [Google Scholar] [CrossRef]
- Fonseka, P.; et al. Exosomes from N-Myc amplified neuroblastoma cells induce migration and confer chemoresistance to non-N-Myc amplified cells: implications of intra-tumour heterogeneity. Journal of Extracellular Vesicles 2019, 8. [Google Scholar] [CrossRef]
- Fridman, E. S. , Ginini, L. and Gil, Z. ‘The Role of Extracellular Vesicles in Metabolic Reprogramming of the Tumor Microenvironment. Cells 2022, 11, 1433. [Google Scholar] [CrossRef]
- Huang, M. and Weiss, W. A. Neuroblastoma and MYCN. A. Neuroblastoma and MYCN. Cold Spring Harbor Perspectives in Medicine 2013. [CrossRef]
- Ikeda, A.; et al. Colorectal Cancer–Derived CAT1-Positive Extracellular Vesicles Alter Nitric Oxide Metabolism in Endothelial Cells and Promote Angiogenesis. Molecular Cancer Research 2021, 19, 834–846. [Google Scholar] [CrossRef] [PubMed]
- Irwin, M. S.; et al. Revised Neuroblastoma Risk Classification System: A Report From the Children’s Oncology Group. Journal of Clinical Oncology 2021, 39, 3229–3241. [Google Scholar] [CrossRef] [PubMed]
- Li, J.; et al. The Emerging Role of Exosomes in Cancer Chemoresistance. Frontiers in Cell and Developmental Biology 2021, 9. [Google Scholar] [CrossRef] [PubMed]
- Li, Z.; et al. Exosomes secreted by chemoresistant ovarian cancer cells promote angiogenesis. Journal of Ovarian Research 2021, 14, 7. [Google Scholar] [CrossRef]
- Liang, W. H.; et al. Tailoring Therapy for Children With Neuroblastoma on the Basis of Risk Group Classification: Past, Present, and Future. JCO Clinical Cancer Informatics 2020, 895–905. [Google Scholar] [CrossRef]
- Ludwig, N.; et al. Exosomes from HNSCC Promote Angiogenesis through Reprogramming of Endothelial Cells. Molecular Cancer Research 2018, 16, 1798–1808. [Google Scholar] [CrossRef]
- Ma, L.;Zong, X. Metabolic Symbiosis in Chemoresistance: Refocusing the Role of Aerobic Glycolysis. Frontiers in Oncology 2020, 10. [Google Scholar] [CrossRef]
- Monopoli, M. P.; et al. Endogenous exosome labelling with an amphiphilic NIR-fluorescent probe. Chemical Communications 2018, 54, 7219–7222. [Google Scholar] [CrossRef]
- Murphy, C.; et al. In vivo cisplatin-resistant neuroblastoma metastatic model reveals tumour necrosis factor receptor superfamily member 4 (TNFRSF4) as an independent prognostic factor of survival in neuroblastoma. PLOS ONE. Edited by S.-G. Lee 2024, 19, e0303643. [Google Scholar] [CrossRef]
- Piskareva, O.; et al. The development of cisplatin resistance in neuroblastoma is accompanied by epithelial to mesenchymal transition in vitro. Cancer Letters. The Authors 2015, 364, 142–155. [Google Scholar] [CrossRef]
- Ritchie, M. E.; et al. limma powers differential expression analyses for RNA-sequencing and microarray studies. Nucleic Acids Research 2015, 43, e47–e47. [Google Scholar] [CrossRef] [PubMed]
- Rodchenkov, I.; et al. Pathway Commons 2019 Update: integration, analysis and exploration of pathway data. Nucleic Acids Research 2019. [CrossRef] [PubMed]
- Sato, S.; et al. EPHB2 carried on small extracellular vesicles induces tumor angiogenesis via activation of ephrin reverse signaling. JCI Insight 2019, 4. [Google Scholar] [CrossRef] [PubMed]
- Schreiber, E.; et al. Rapid detection of octamer binding proteins with “mini extracts”, prepared from a small number of cells. Nucleic Acids Research 1989, 17, 6419–6419. [Google Scholar] [CrossRef]
- Shevchenko, A.; et al. In-gel digestion for mass spectrometric characterisation of proteins and proteomes. Nature Protocols 2006, 1, 2856–2860. [Google Scholar] [CrossRef]
- Sinha, D.; et al. Trends in research on exosomes in cancer progression and anticancer therapy. Cancers 2021, 13, 1–31. [Google Scholar] [CrossRef]
- To, K. K. W. and Cho, W. C. S. ‘Exosome secretion from hypoxic cancer cells reshapes the tumor microenvironment and mediates drug resistance. Cancer Drug Resistance 2022, 5, 577–94. [Google Scholar] [CrossRef]
- Tortolici, F.; et al. Ionizing Radiation-Induced Extracellular Vesicle Release Promotes AKT-Associated Survival Response in SH-SY5Y Neuroblastoma Cells. Cells 2021, 10, 107. [Google Scholar] [CrossRef]
- Tsakaneli, A.; et al. MYC regulates metabolism through vesicular transfer of glycolytic kinases. Open Biology 2021, 11. [Google Scholar] [CrossRef]
- Wang, B.; et al. Exosomes derived from acute myeloid leukemia cells promote chemoresistance by enhancing glycolysis-mediated vascular remodeling. Journal of Cellular Physiology 2019, 234, 10602–10614. [Google Scholar] [CrossRef]
- Welsh, J. A.; et al. Minimal information for studies of extracellular vesicles (MISEV2023): From basic to advanced approaches. Journal of Extracellular Vesicles 2024, 13. [Google Scholar] [CrossRef] [PubMed]
- Willms, E.; et al. Extracellular Vesicle Heterogeneity: Subpopulations, Isolation Techniques, and Diverse Functions in Cancer Progression. Frontiers in Immunology 2018, 9. [Google Scholar] [CrossRef] [PubMed]
- Wills, C. A.; et al. Chemotherapy-induced small extracellular vesicles prime the pre-metastatic niche to accelerate neuroblastoma metastasis. Genes & Diseases 2024, 11, 101017. [Google Scholar] [CrossRef]
- Wu, T.; et al. clusterProfiler 4.0: A universal enrichment tool for interpreting omics data. The Innovation 2021, 2, 100141. [Google Scholar] [CrossRef]
- Yu, G. (2020) ‘Gene Ontology Semantic Similarity Analysis Using GOSemSim. in, pp. 207–215. [CrossRef]
- Zhang, X.; et al. Ovarian cancer derived PKR1 positive exosomes promote angiogenesis by promoting migration and tube formation in vitro. Cell Biochemistry and Function 2021, 39, 308–316. [Google Scholar] [CrossRef]
- Zheng, X.; et al. Exosomes derived from 5-fluorouracil-resistant colon cancer cells are enriched in GDF15 and can promote angiogenesis. Journal of Cancer 2020, 11, 7116–7126. [Google Scholar] [CrossRef]
Disclaimer/Publisher’s Note: The statements, opinions and data contained in all publications are solely those of the individual author(s) and contributor(s) and not of MDPI and/or the editor(s). MDPI and/or the editor(s) disclaim responsibility for any injury to people or property resulting from any ideas, methods, instructions or products referred to in the content. |
© 2025 by the authors. Licensee MDPI, Basel, Switzerland. This article is an open access article distributed under the terms and conditions of the Creative Commons Attribution (CC BY) license (https://creativecommons.org/licenses/by/4.0/).
Copyright: This open access article is published under a Creative Commons CC BY 4.0 license, which permit the free download, distribution, and reuse, provided that the author and preprint are cited in any reuse.


