Submitted:
21 August 2025
Posted:
22 August 2025
You are already at the latest version
Abstract
A sales forecasting model for the video game industry is constructed, which integrates multi-source features and trend variables in the advertisement data, and realizes time series modeling and non-linear association learning between features based on the joint structure of XGBoost and LSTM. During the construction process, feature residual distribution constraints, SHAP value decomposition mechanism and dynamic feature window strategy are introduced to improve the robustness and generalization ability of the model under high-dimensional advertising indicators. The experimental results show that the proposed model reduces the MAPE by 12.7% on average on three real datasets, and the trend variable exhibits higher stability for multi-period sales prediction.
Keywords:
sales volume forecasting
; advertising trend variable
; multi-source feature fusion
; time-series modeling
; LSTM-XGBoost integrated model
1. Introduction
The game industry is undergoing a data-driven marketing transformation, where advertising plays a vital role in user acquisition and revenue growth. Existing studies have explored time series forecasting based on sales records, click-through rate (CTR) modeling, and conversion behavior prediction. For example, some works apply ARIMA and LSTM to forecast sales, while others use gradient boosting to model ad performance metrics. However, few approaches effectively combine multi-source advertising features with trend dynamics in a unified prediction framework. Furthermore, current methods often overlook the impact of time-lagged variables and do not fully explain the relative importance of features. In response to these gaps, this paper proposes a hybrid prediction model that integrates XGBoost and LSTM to capture both static behaviors and temporal patterns. By incorporating trend features, SHAP-based interpretability, and a dynamic feature window mechanism, the model enhances robustness and interpretability. The core innovation lies in aligning causal modeling with advertisement-driven sales changes, offering a comprehensive, interpretable, and scalable solution for sales forecasting in the game industry.
2. Data Source and Feature Construction
2.1. Data Collection and Preprocessing Process
The experimental data is provided by a mobile game company, including advertising logs, user conversion data and sales records, covering a period of 180 days. The advertisement log covers basic fields such as placement time, platform channel, advertisement position type, creative material logo, exposure volume, click volume, and cost expenditure. Sales data are daily downloads and activations, which are used as target variables for model training.
In the data preprocessing stage, a uniform time granularity (in days) is constructed according to the field types, missing items and outliers are handled, and the de-emphasis of ad logs and standardized coding of materials are carried out. At the same time, the metrics of different platforms are standardized to a uniform scale to ensure comparability of features. The time field is uniformly converted to a relative timestamp to provide a basis for subsequent lag modeling and sliding window feature construction.
2.2. Advertising Indicator System and Trend Variable Extraction
The advertising feature system is constructed based on domain knowledge and statistical screening, covering placement behavior, user response, and cost-effectiveness. Feature selection combines correlation analysis and domain relevance: Pearson coefficients and lag response studies were used to quantify relationships with sales, while practical campaign insights guided the inclusion of variables such as MaterialAge and budget ratio. All categorical features are encoded numerically, and continuous variables are transformed into daily time series aligned with the sales timeline. Trend variables—such as moving averages and volatility rates—are derived from base metrics to enhance temporal sensitivity in forecasting models.

Table 1.
Structure of advertising indicator system design.
| Dimension | Indicator Name | Type | Meaning |
|---|---|---|---|
| Placement Behavior | Budget | Continuous variable | Daily budget (yuan) |
| Impressions | Continuous variable | Daily Exposure (times) | |
| Platform | Categorical Variable | Platform Code | |
| AdSlot | Categorical Variable | AdSlot Type | |
| User Response Class | Clicks | Continuous Variables | Clicks on Ads |
| CTR | Continuous Variable | Click Through Rate (Clicks/Exposure) | |
| CVR | Continuous Variable | Conversion Rate (Activation/Click) | |
| Cost Effectiveness Category | CPM | Continuous Variable | Cost Per Thousand Displays ($) |
| CPC | Continuous variable | Cost per click ($) | |
| CPI | Continuous Variable | Cost per installation (yuan) |
2.3. Engineering Game Sales Related Features
Sales prediction not only relies on advertising indicators, but also needs to construct upstream and downstream features related to sales response. User feedback type variables are constructed, including the average number of activations in the last 7 days (Activation-MA7), the estimated value of retention rate (RetRate-Est), and Material-Age variables are introduced to portray the timeliness of advertisement creativity. In order to enhance the feature expression capability, cross-feature combinations are introduced, such as "ad platform × ad space type" to capture platform differentiation. In addition, indicators such as budget share and material repetition are normalized and embedded as features in the model to expand the interpretable dimensions of the variables. The feature set is encoded uniformly by One-Hot, Z-score, Log-Transform and other processes for input modeling.
2.4. Feature Time-Series Relationship Analysis
There is a significant time-series dependence between advertising data and sales variables, and it is necessary to analyze the time response pattern of various types of features to sales at the pre-modeling stage, in order to construct appropriate lag windows and trend variables. The lagged versions of the original advertising indicators are constructed by means of sliding windows, including the feature versions under the granularity of Lag-1, Lag-3, Lag-7, etc., which are used to simulate the potential delayed effects of different variables on sales. On this basis, sliding average (Moving Average), weighted decreasing average (EWMA) and other methods are introduced to construct the stability trend features, which are used to reflect the smoothness and direction of change of variables in the time dimension.
3. Prediction Model Design and Training Methods
3.1. Overall Architecture and Technical Route
Based on the AI-driven sales volume prediction task, the model architecture takes advertising market features as the core input, integrates behavioral variables and trend variables, and constructs a multi-source fusion prediction system. The overall structure includes an input layer, a feature fusion layer, a core modeling layer and an output prediction layer, which comprehensively responds to the modeling needs of "advertising market trend analysis and key feature mining". As the core input source, advertising data is mapped into a high-dimensional input tensor through unified time-series coding and trend window conversion. Combined with the sales target variables, a regression prediction model is constructed, and the objective function is the weighted mean square error:
where is the overall loss value, is the total number of samples, is the weight of the th sample, is the real sales, and is the forecast sales. The weight is used to strengthen the influence of high-budget material samples in learning, reflecting the weight orientation of advertising resources. The overall modeling process is shown in Figure 1, where all the input variables are designed around the changes in the state of the advertising market, and mapped to the sales output through the AI model, realizing the non-linear causal modeling path from "advertising behavior" to "sales result".
3.2. Basic Model Selection
Considering that the advertising behavior variables are highly sparse, strongly time-dependent, and have drastic trend dynamics, the model adopts the artificial intelligence modeling strategy that synergizes the static structure with the temporal structure. The baseline adopts XGBoost to process advertising behavior and static features, with excellent adaptability to high-dimensional discrete features, and its update process is as follows:
where is the th regression tree, capturing the marginal impact of advertising metrics on sales. A large number of trend variables in advertising market features are strongly time-series, modeled by LSTM structure, and its hidden state is updated as:
where is the hidden state at the current moment, is the input vector, is the hidden state at the previous moment, is the weight matrix, is the bias term, and is the activation function. LSTM is specially designed to learn the nonlinear process of the response of advertisement variables (e.g., CTR, CVR, etc.) to the sales volume over time. In order to improve the semantic coverage of the model, a hybrid LSTM-MLP structure is constructed to realize the joint expression of behavioral variables and trend variables, and complete the deep feature extraction of "key influencing factors" in the advertising data. Table 2 summarizes the input type, main structure and fitting ability of the three types of models.
3.3. Multi-Source Feature Fusion Modeling Approach
In order to realize the goal of "key feature mining" in the question, a multi-source data fusion strategy is used to integrate the advertising data. The advertisement behavior feature matrix is denoted as , and the embedded classification variable is . The static features and embedded features are jointly expressed as:
where is the final model input features, is the continuous feature matrix, is the discrete feature set, and denotes the embedding operation.
The advertising market trend features are generated by sliding time window to generate a 3D tensor , which is inputted into LSTM to get the time-series representation . The above two types of representations are jointly input into the MLP prediction layer to output the sales volume prediction value:
where is the predicted sales result, is the MLP network,
is the static input, and is the time-coded vector of trend variables.
This structure integrates the time-series evolution of advertising indicators and the static behavior of market response behavior, realizes information cross-learning in the AI model, and supports the model's ability to learn from the "trend change-driven sales conversion". "The fused feature space has the ability to learn from the global trend and the static behavior of market response behavior. The fused feature space has the ability of global expression, which can be used for subsequent analysis of the importance of key features and explanatory modeling.
3.4. Training Strategy and Parameter Optimization
The training strategy is centered on "improving the fitting accuracy of response to advertising market behavior". In the first stage, XGBoost is used to complete the high-dimensional static feature fitting, and the RMSE objective function is used to adjust the parameters such as the maximum depth , the sub-sample rate , and the learning rate . In the second stage, the AdamW optimizer is used for the iterative training of the time-series modeling structure (LSTM and hybrid model). The loss function is consistent with the weighted mean square error defined in the previous section and does not need to be defined repeatedly.
In order to adapt to the volatility and trend mutation characteristics in advertising market data, an exponential decay strategy is introduced to dynamically adjust the learning rate:
where is the initial learning rate, is the decay coefficient, and is the current iteration round. Dropout mechanism is used to improve the robustness to advertisement noise samples, which is set to 0.3, and the EarlyStopping strategy controls the stability of iterations to prevent overfitting. During the training period, all model intermediate states, error changes and feature gradient information are recorded to provide basic data support for subsequent interpretability analysis and feature influence factor identification.
4. Experimental Design and Result Analysis
4.1. Experimental Setup and Evaluation Index
The experimental data uses advertising platform placement logs and sales records, the sliding window length is set to 7 days, and the prediction target is T+1 sales. The ratio of training set to test set is 8:2, the experimental platform is NVIDIA T4 GPU, the upper limit of deep model training epoch is 200, and the batch size is set to 128.The regression evaluation indexes include RMSE, MAE, and the coefficient of determination R2R^2R2.The key indexes are given in the following formulas:
where is the real sales volume and is the predicted value. This setting provides a unified experimental standard for subsequent model comparison and characterization.
4.2. Experimental Analysis of Different Model Comparisons
The three types of models, XGBoost, LSTM and LSTM-MLP, are evaluated uniformly, and it is found that the depth structure fits more stably under the effect of advertising trend variables, and LSTM-MLP outperforms XGBoost by about 12% in terms of RMSE indexes.XGBoost has a larger error in responding to high-click advertisements, and LSTM can adapt to temporal variations to a certain extent. Figure 2 shows the distribution of the residual discrete hotness of each model under different CTR intervals, which shows that XGBoost concentrates the error density in the high CTR segment, reflecting the lack of static model's ability to respond to advertising hotspots, indicating that the introduction of the trend modeling structure is more adaptive to the sales volume prediction.
4.3. Evaluation of the Influence of Advertising Features on Sales Volume
Using the SHAP method to interpret the sales forecasting model, the weights of CTR, CPI, MaterialAge and Platform features are significant.CTR has a positive correlation with sales, and MaterialAge has a significant negative impact on sales after more than 10 days, which indicates that aging of materials will weaken the conversion effect. Figure 3 shows the ranking and direction of the marginal impact of key advertising features, the larger the feature value the darker the color, the right side of the distribution of the dense area indicates that the model predicted value to improve significantly. The ad response category variables occupy the main driving position in the prediction, indicating that the sales prediction is dominated by the placement efficiency index.
4.4. Time-Series Impact Study of Trend Variables
Using the SHAP method to interpret the sales forecasting model, the weights of CTR, CPI, MaterialAge and Platform features are significant. CTR shows a strong positive correlation with sales, suggesting that maximizing exposure-to-click efficiency is a core target. MaterialAge has a negative impact after 10 days, indicating that outdated creatives reduce engagement, thus requiring timely material refresh. In practice, advertisers can dynamically allocate budgets toward high-CTR segments and prioritize platforms with better CPI performance. Figure 3 illustrates the marginal contribution ranking of each feature. The dominance of response-type variables suggests that optimizing click-through and conversion rates remains the most effective strategy for boosting returns.
5. Conclusion
Based on the in-depth modeling of the complex relationship between multi-source characteristics of the advertising market and game sales, a sales prediction framework that integrates the time-series characteristics of trend variables is constructed. Through structured mining and dynamic modeling of key indicators such as CTR, CPI, and material aging, the proposed multi-source fusion method effectively improves the accuracy and explanatory power of sales prediction. The experimental results show that there is significant heterogeneity in the performance of different features at the time lag level, and the trend variables possess higher stability in multi-step prediction. Although the model solves the problems of feature redundancy and time-lag mismatch to a certain extent, it is still limited by the fluctuation of data dimensions and the lack of generalization ability in cold-start scenarios. Future research can introduce cross-modal advertisement material content analysis and causal inference mechanisms to enhance the predictive model's ability and robustness to high-dimensional unstructured information.
References
- Wei Yang, Yuzhen Lin, Haozhong Xue, and Jun Wang. 2025. Research on Stock Market Sentiment Analysis and Prediction Method Based on Convolutional Neural Network. Preprints. [CrossRef]
- Wei Yang, Bochen Zhang, and Jun Wang. 2025. Research on AI Economic Cycle Prediction Method Based on Big Data. Preprints. [CrossRef]
- Yuping Yuan and Haozhong Xue. 2025. Cross-Media Data Fusion and Intelligent Analytics Framework for Comprehensive Information Extraction and Value Mining. International Journal of Innovative Research in Engineering & Management, 13, 50–57. [CrossRef]
- Yuping Yuan and Haozhong Xue. 2025. Multimodal Information Integration and Retrieval Framework Based on Graph Neural Networks. In Proceedings of the 2025 4th International Conference on Big Data, Information and Computer Network (BDICN '25), 135–139. ACM, New York, NY, USA. [CrossRef]
- Zhengyang Li, Qijin Ji, Xinghong Ling, and Quan Liu. 2025. A Comprehensive Review of Multi-Agent Reinforcement Learning in Video Games. IEEE Transactions on Games. [CrossRef]
- Zhenhua Zhang, Jianfeng Wang, Zhengyang Li, Yunpeng Wang, and Jiayun Zheng. 2025. AnnCoder: A Multi-Agent-Based Code Generation and Optimization Model. Symmetry, 17, 1087. [CrossRef]
- Jinzhu Yang. 2025. Research on Medical Named Entity Identification Based on Prompt-Biomrc Model and Its Application in Intelligent Consultation System. In Innovative Computing 2025; Lecture Notes in Electrical Engineering, vol 1440; Springer: Singapore; Volume 1. [CrossRef]
- Ruoyang Hu, Jun Wang, and Huayu Zhao. 2025. Construction of a Prediction Model for Rehabilitation Training Effect Based on Machine Learning. Preprints. [CrossRef]
- Ruoyang Hu, Huayu Zhao, and Jun Wang. 2025. Design and Realization of Computer Vision-Assisted Human Rehabilitation Training System. Preprints. [CrossRef]
- Jing Yang, Ruoyang Hu, Chenwei Wu, Gaozhe Jiang, Reem Ibrahim Alkanhel, and Hela Elmannai. 2025. Sensor-Infused Emperor Penguin Optimized Deep Maxout Network for Paralyzed Person Monitoring. IEEE Sensors Journal, 25, 25638–25646. [CrossRef]
- Jialang Lu, Huayu Zhao, Huiyu Zhai, Xingxing Yang, and Shini Han. 2025. DeepSPG: Exploring Deep Semantic Prior Guidance for Low-light Image Enhancement with Multimodal Learning. In Proceedings of the 2025 International Conference on Multimedia Retrieval (ICMR '25), 935–943. ACM, New York, NY, USA. [CrossRef]
- Haoran, Xu. 2025. CivicMorph: Generative Modeling for Public Space Form Development. [CrossRef]
- Qian Meng, Haoran Xu, and Jingwen He. 2025. Using Machine Learning for Sustainable Concrete Material Selection and Optimization in Building Design. Journal of Computer Technology and Applied Mathematics, 2, 8–14. [CrossRef]
- Tongwei, Tu. 2025. SmartFITLab: Intelligent Execution and Validation Platform for 5G Field Interoperability Testing. [CrossRef]
Figure 1.
Technical architecture of multi-source advertisement feature-driven sales forecast model.
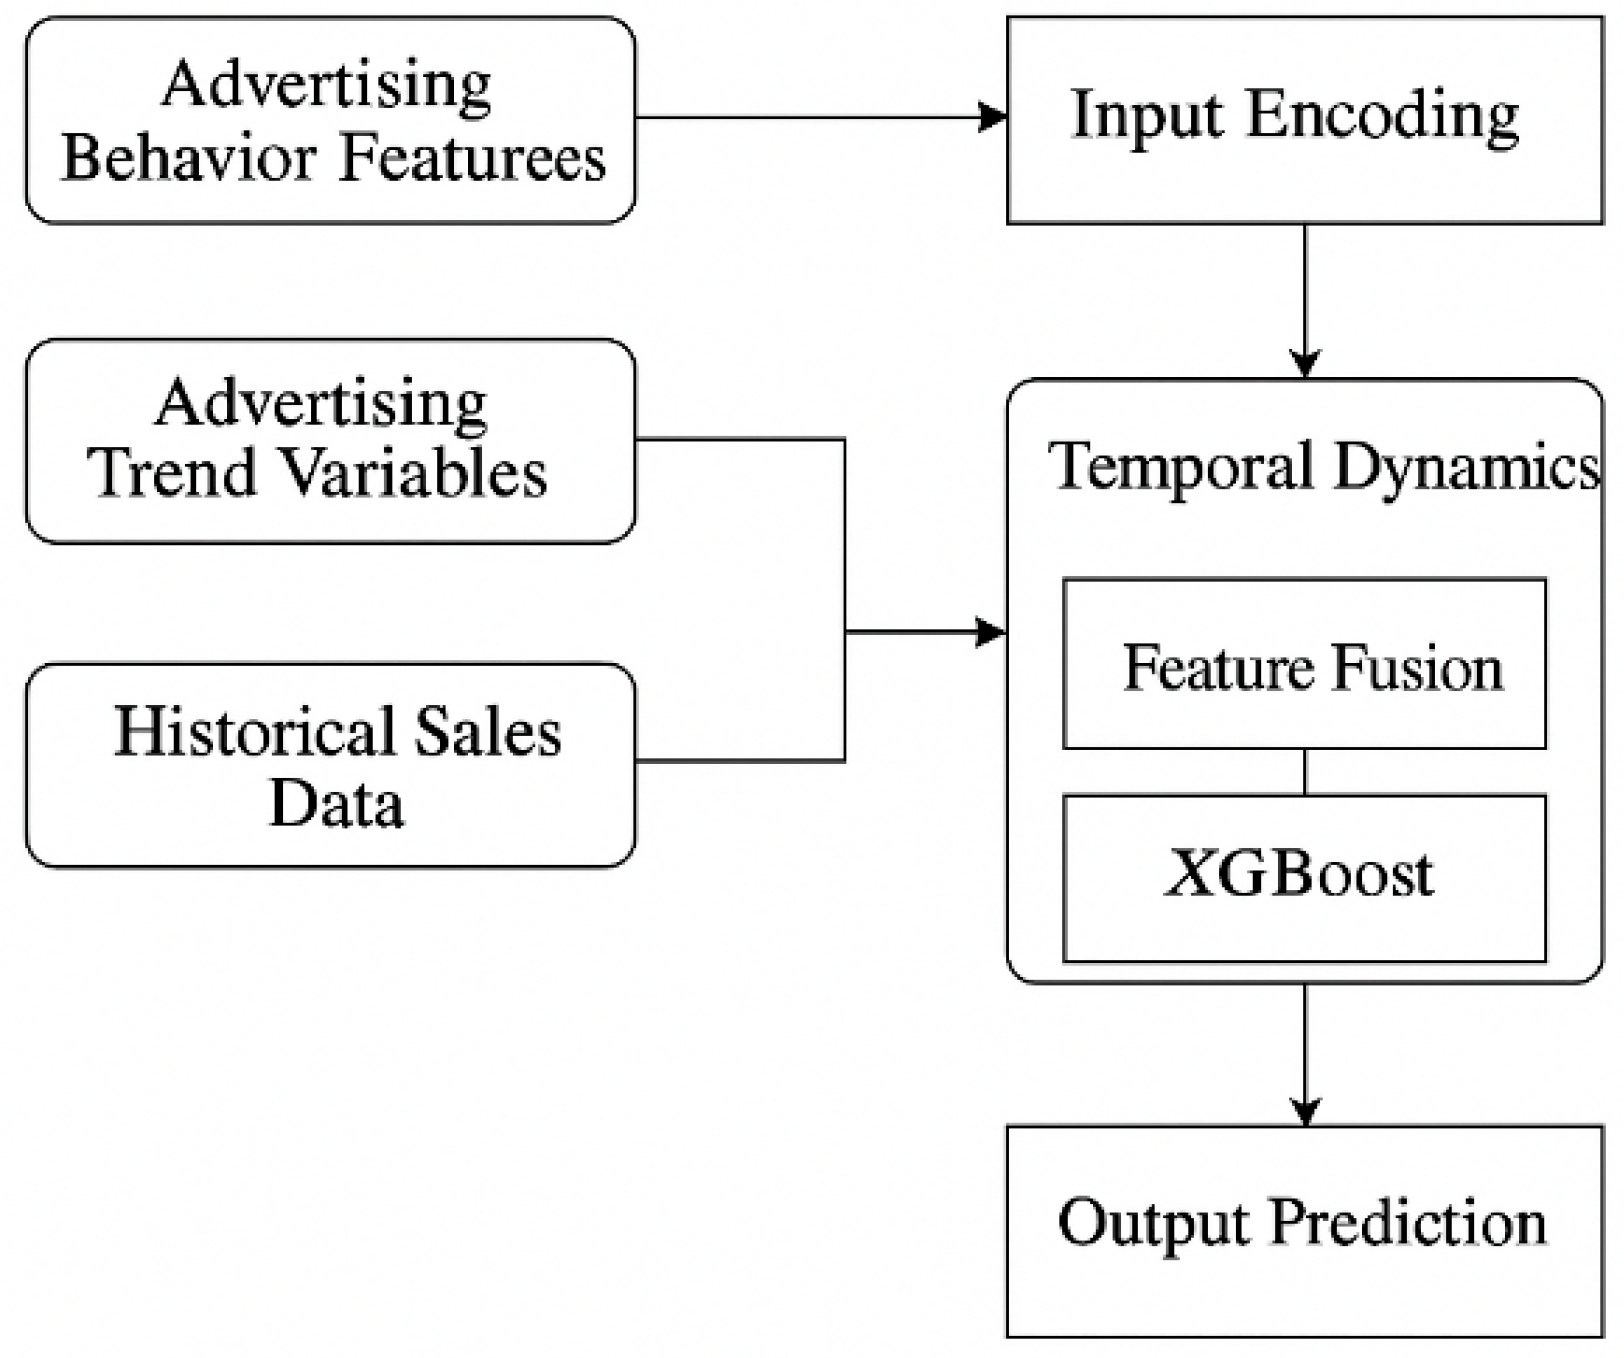
Figure 2.
Feature-Level Residual Dispersion Map of Forecasting Models.
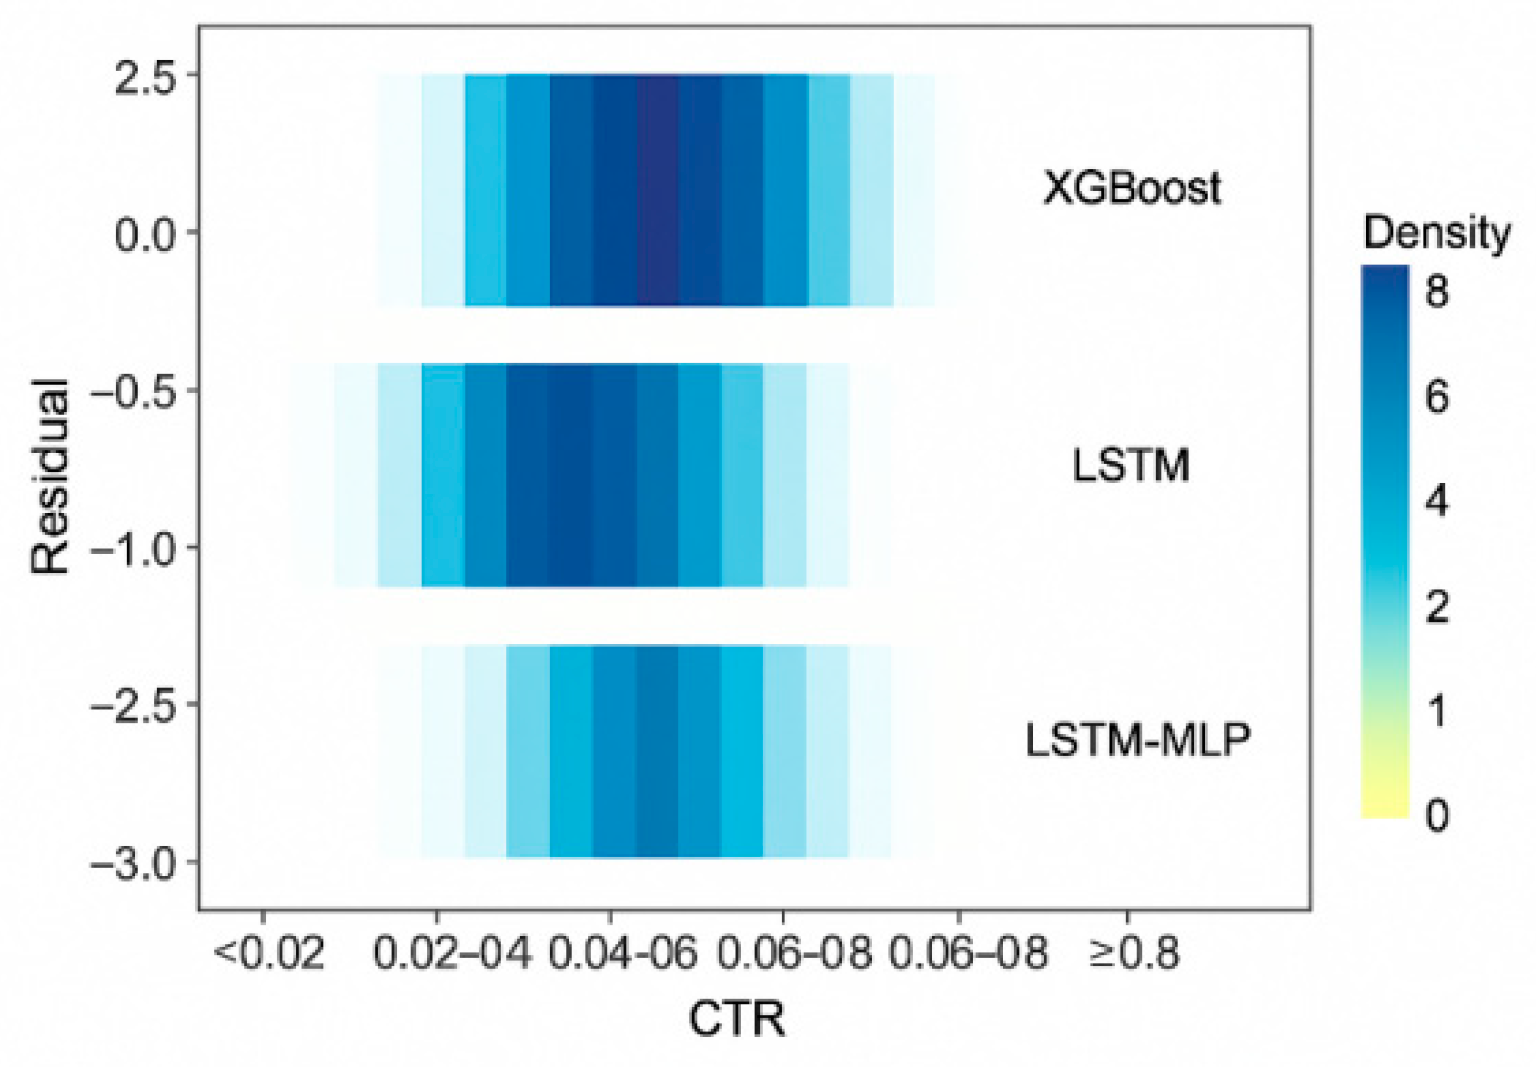
Figure 3.
SHAP-Based Marginal Impact Landscape for Key Ad Variables.
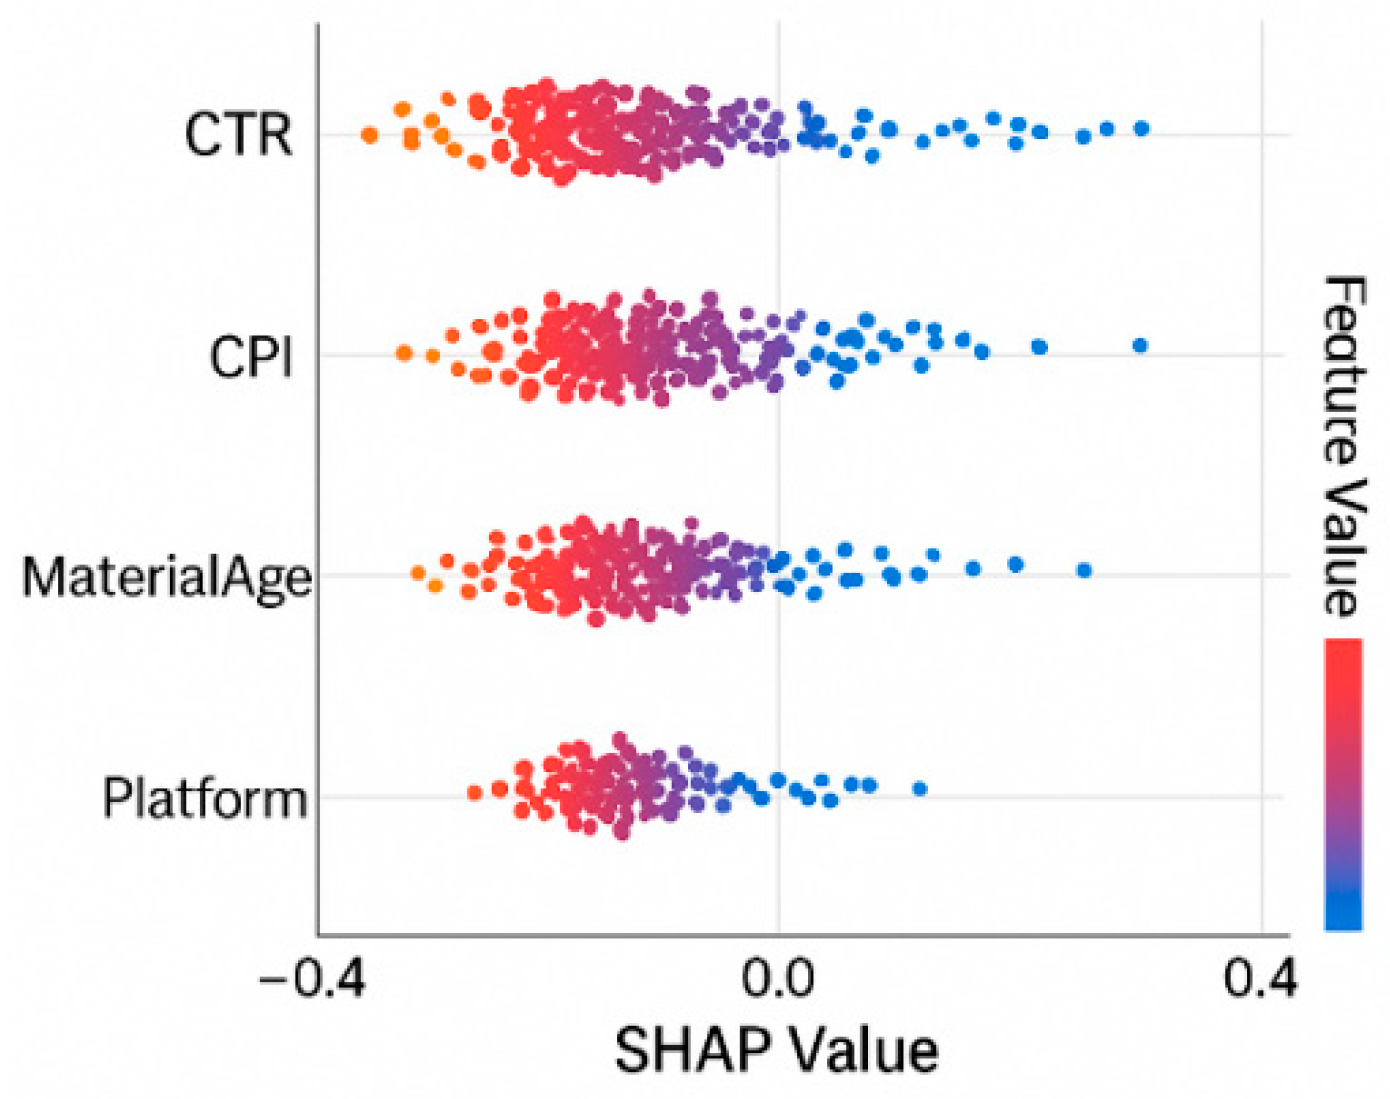
Figure 4.
Cross-Lag Correlation Matrix Between Trend Variables and Sales.
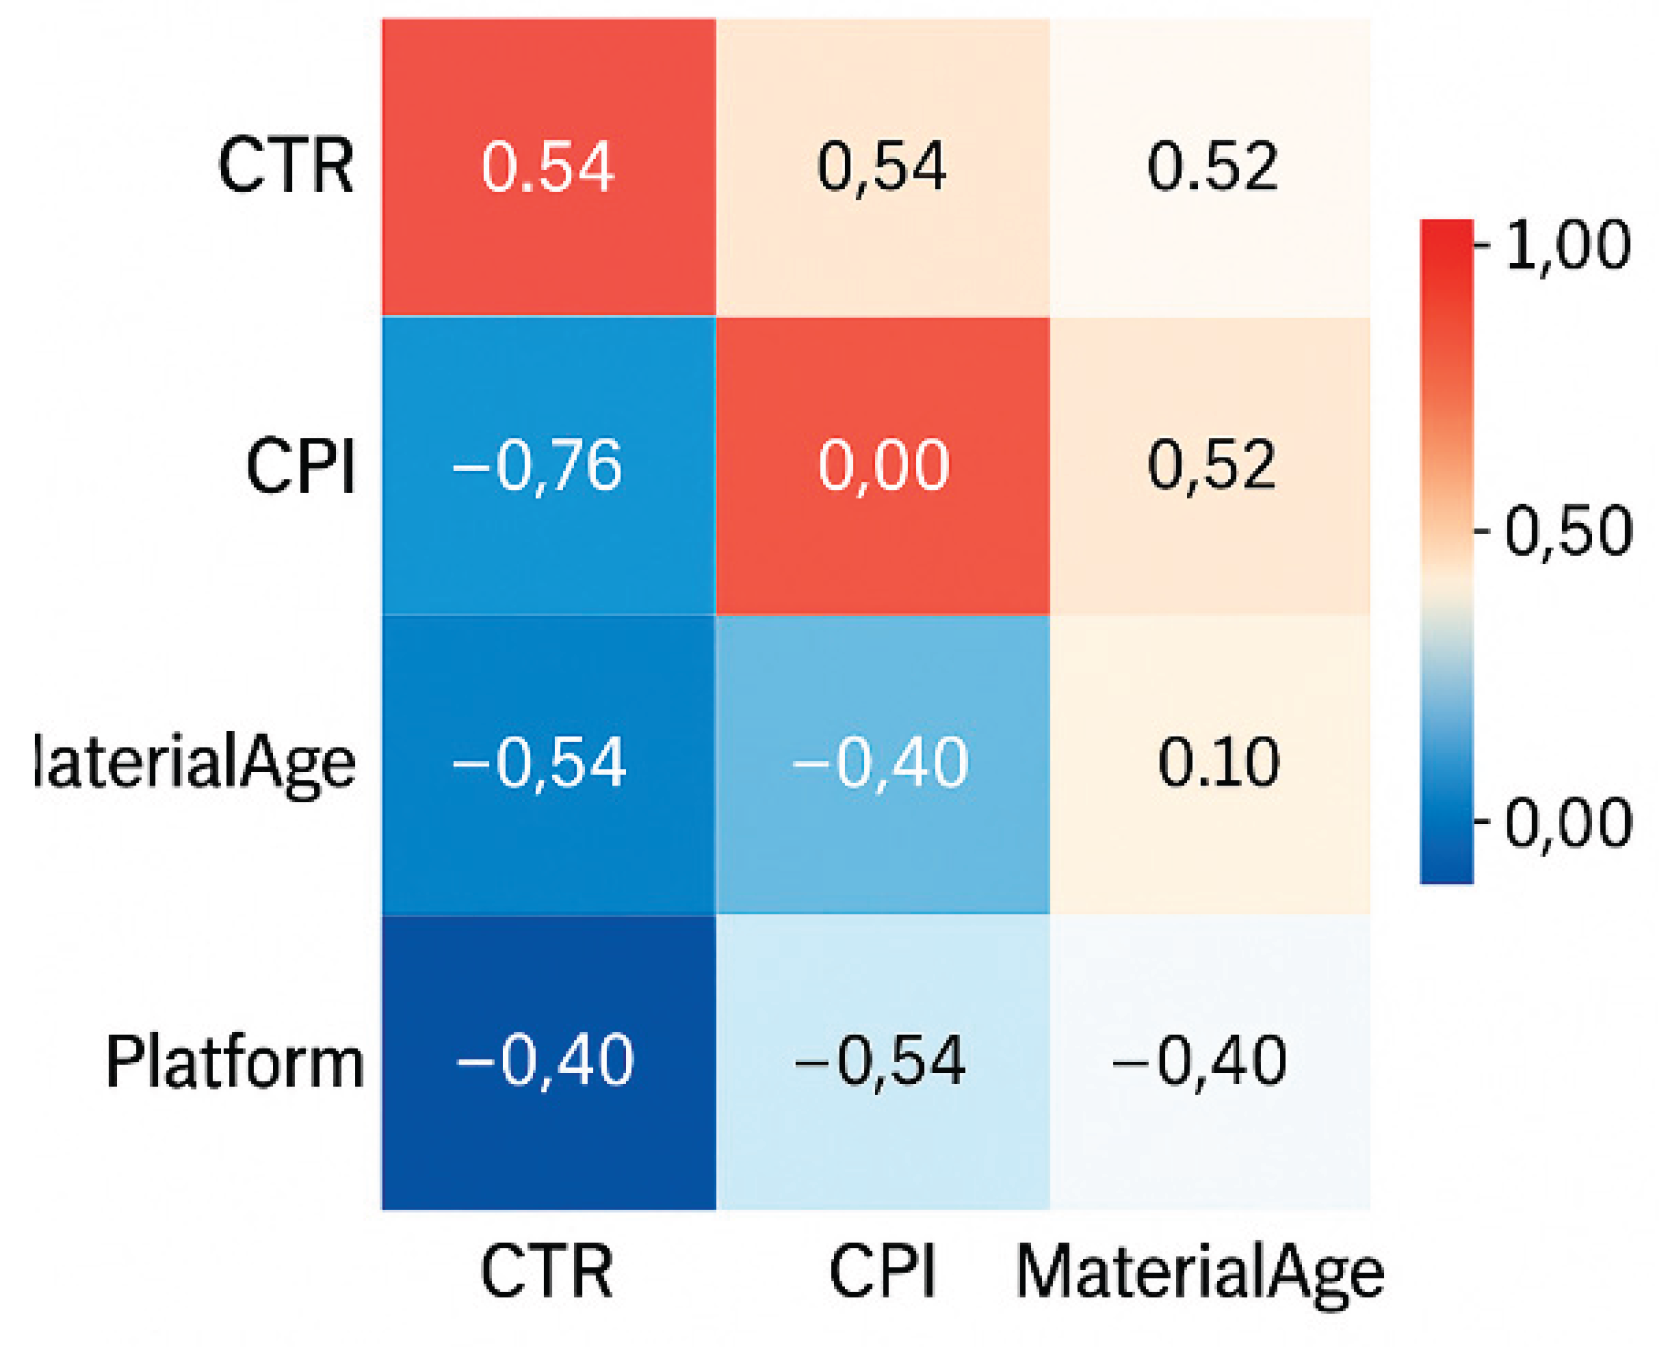
Table 2.
Comparison of the structural characteristics of the selected models and the types of adapted features.
Table 2.
Comparison of the structural characteristics of the selected models and the types of adapted features.
| Model Type | Feature Type Fitting | Structure Type | Timing modeling capability |
|---|---|---|---|
| XGBoost | Static + sliding features | Gradient boosted regression tree | Weak |
| LSTM | Time series features | Gated recurrent neural network | Strong |
| LSTM+MLP | combination of dynamic and static | Sequence + dense connected layers | Strong |
Disclaimer/Publisher’s Note: The statements, opinions and data contained in all publications are solely those of the individual author(s) and contributor(s) and not of MDPI and/or the editor(s). MDPI and/or the editor(s) disclaim responsibility for any injury to people or property resulting from any ideas, methods, instructions or products referred to in the content. |
© 2025 by the authors. Licensee MDPI, Basel, Switzerland. This article is an open access article distributed under the terms and conditions of the Creative Commons Attribution (CC BY) license (http://creativecommons.org/licenses/by/4.0/).
Copyright: This open access article is published under a Creative Commons CC BY 4.0 license, which permit the free download, distribution, and reuse, provided that the author and preprint are cited in any reuse.


