Submitted:
20 August 2025
Posted:
22 August 2025
You are already at the latest version
Abstract
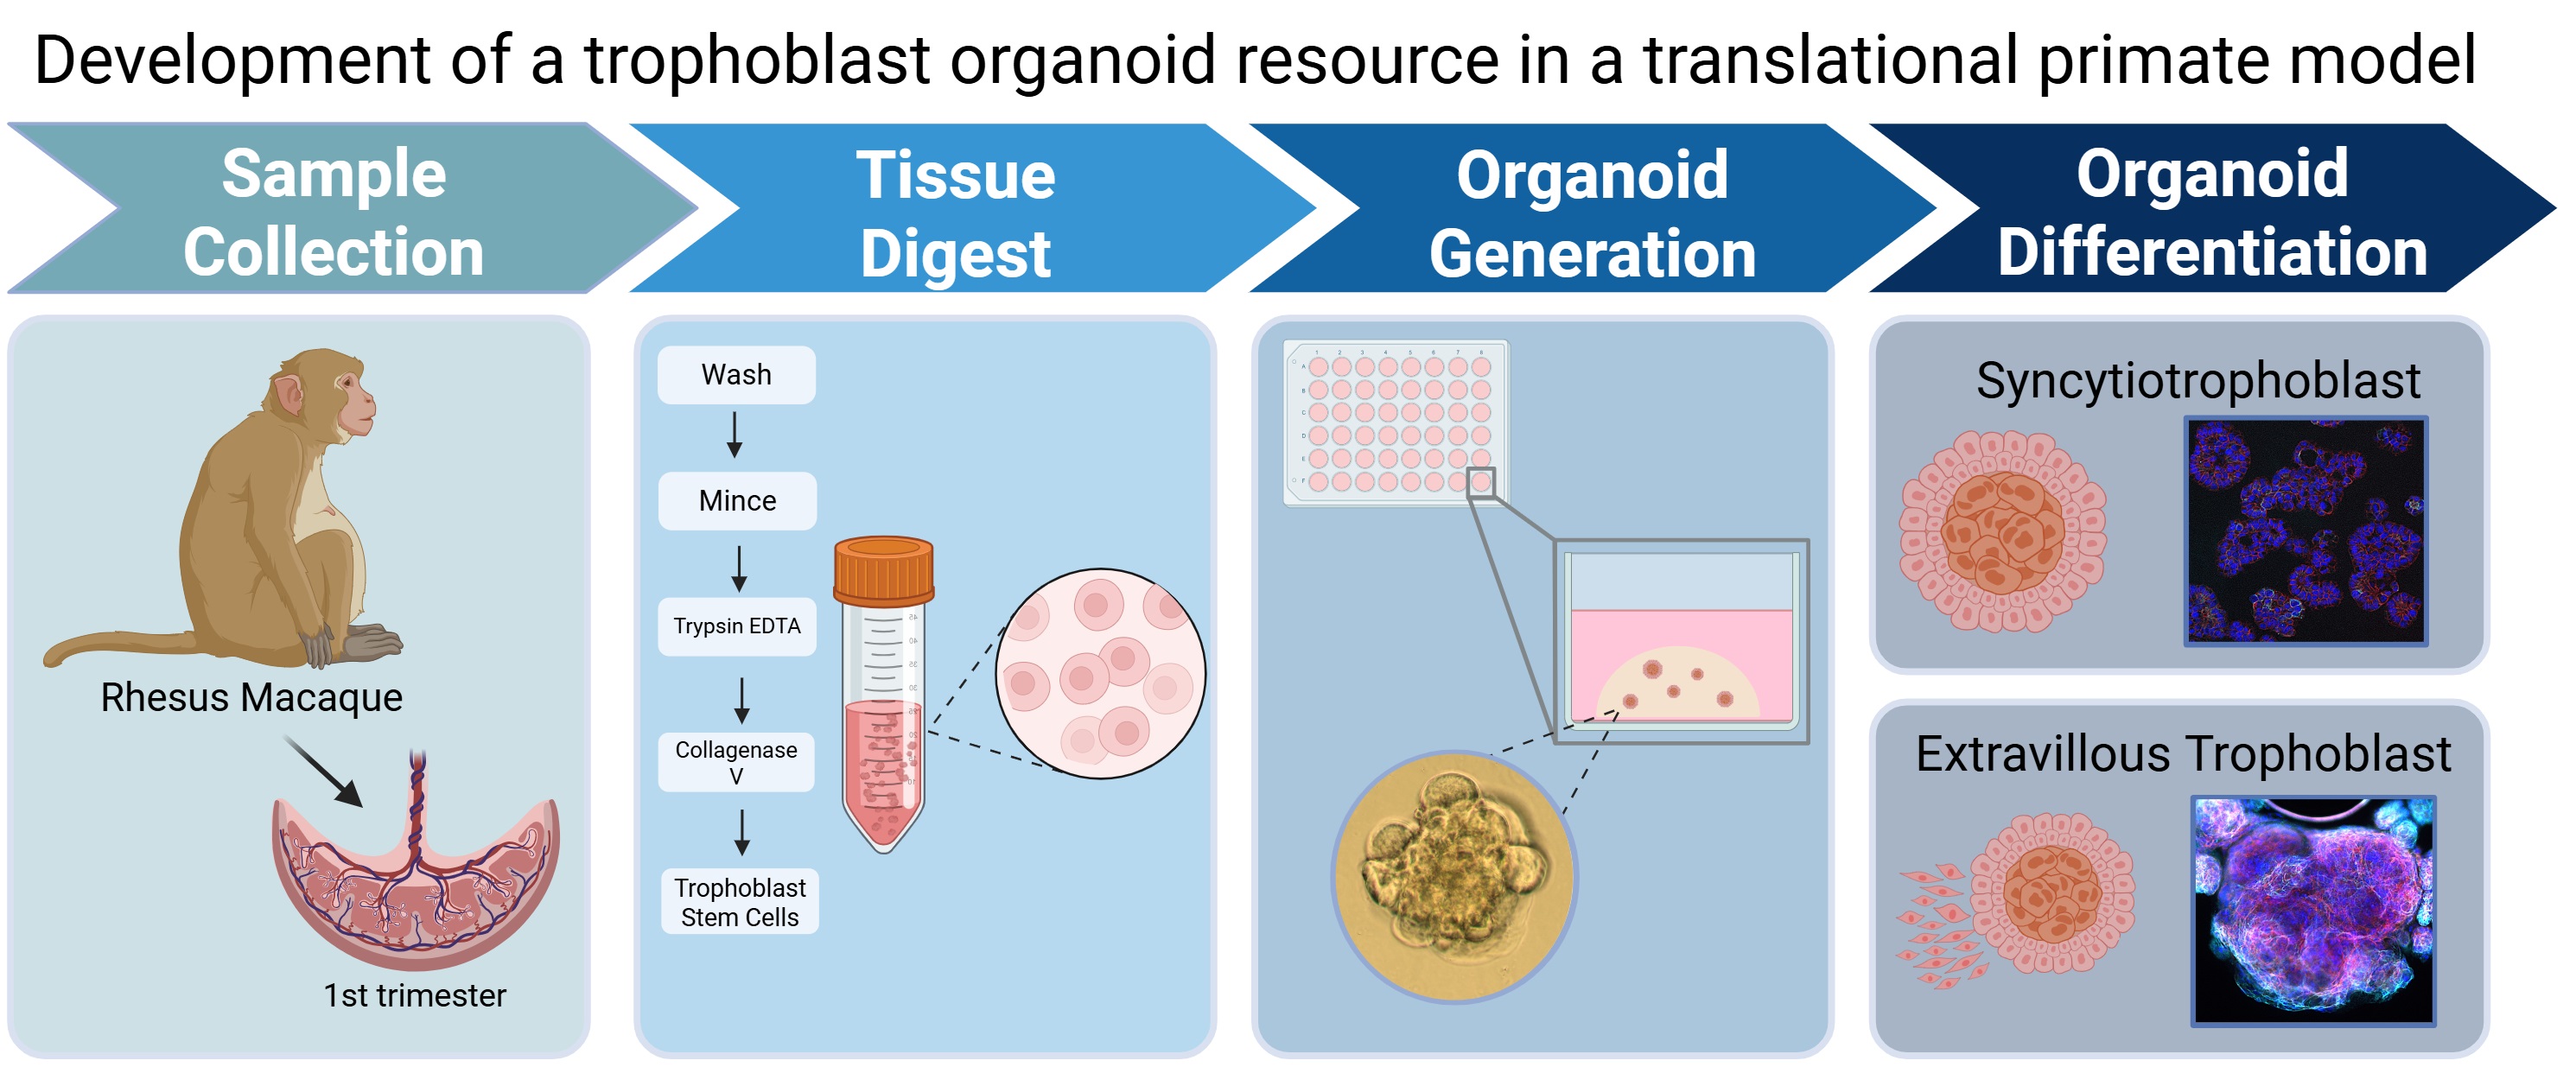
First trimester placental development is comprised of many critical yet understudied cellular events that determine pregnancy outcomes. Improper placentation leads to a host of health issues that not only impact the fetal period but also influence later-life offspring health. Thus, an experimental paradigm to study early placental development is necessary and has spurred the development of new in vitro models. Organoid model systems are three-dimensional structures comprised of multiple differentiated cell types that originate from a progenitor population. Trophoblasts are the progenitor cells that serve as the proliferative base for differentiation and maintenance of the placenta. Due to research constraints, experimental studies on the causal mechanisms underlying pathological pregnancies cannot readily be performed in human subjects. The nonhuman primate (NHP) offers a solution to this problem as it circumvents the limitations of human pregnancy sampling. Importantly, NHPs share many developmental features of human pregnancy including placenta type and a similar fetal growth trajectory, making longitudinal pregnancy studies feasible and relevant. Since perturbations made in vivo can be validated in vitro, an NHP model of early pregnancy would facilitate mechanistic studies of pregnancy disorders. Herein we describe the methodology for establishment of a first trimester NHP placenta trophoblast organoid model system.
Keywords:
rhesus macaque
; 3-dimensional culture
; nonhuman primate
; first trimester placenta
; trophoblast organoid
1. Introduction
The placenta is a truly unique and remarkable organ. It performs a multitude of functions to not only support the growth needs of the developing fetus, but also simultaneously growing and maturing itself across the course of pregnancy. This entails a complex interplay of cellular development, endocrine activity, immune function and many other factors that influence early establishment of the feto-placental unit [1]. As a waste product of pregnancy, the delivered placenta has been studied for decades, and many fundamental aspects of pregnancy biology have been revealed from post-delivery assessments. Conventional methods such as gross review, histology, immunohistochemistry and stereology provide insight into the structural component of placental development. Molecular analysis of preserved tissue is informative of gene and protein function, and culture methods can add to the experimental assessment of placental function. These methods include short and longer-term explant culture [2], primary cell isolations grown in 2-dimensonal culture [3], and technologies such as organ on a chip and microfluidics [4]. However, recognition of the importance of early gestation developmental events in pregnancy outcome and offspring health in later-life, has focused recent attention towards understanding the functional roles of the placenta during the first trimester.
It is well known that appropriate placentation and early establishment of a strong foundation is essential for pregnancy success. The numerous maternal and fetal cell types that comprise the uteroplacental interface make understanding the phenotypic properties and the intricacies between the diverse cell populations uniquely challenging. In early placental development, trophoblast cells, a specialized placental stem cell, differentiate into several subtypes with different anatomical and functional features [5]. There are two primary types: extravillous trophoblast cells (EVTs) invade the maternal spiral arteries, anchor the placenta in the decidua and are critical for forming a strong vascular foundation for a fully functioning placenta. The syncytiotrophoblast (SYN) is a multinucleated epithelium which serves as the maternal-fetal exchange interface, and importantly, is the immune barrier for fetal protection [5]. Trophoblast cell differentiation events predominantly take place during the first trimester; therefore, this is a critical period of vulnerability to adverse stimuli for the developing placenta and subsequent impacts to the fetus. However, despite the importance of the first trimester period, understanding the regulation of trophoblast cell lineage specification and differentiation has been partially hindered by the lack of appropriate cellular model systems and access to placental tissue from early gestation. Hence, there is growing interest in new methodologies and models to assess early placental function [6,7].
Several approaches can be taken: the use of in vivo imaging permits longitudinal assessments [8,9], but not direct tissue sampling. Biomarker studies such as blood, urine, or extracellular vesicles analysis have utility in identifying pathological pregnancies which are likely attributed to placental dysfunction but are typically not mechanistic in nature. In vitro alternatives exist but can face challenges for tissue accessibility and sampling. Specifically, there has been significant interest in the generation of first trimester placental trophoblast organoid (TO) model systems. Organoids are self-organizing and propagating 3-dimensional culture models that are derived from stem cells. By using growth factors to provide developmental cues, these stem cells can be directed to grow ex vivo into mini structures that recapitulate the structural organization and functionality of the host organ from which they originated [10,11,12] albeit without a vascular supply. Human trophoblast organoids generated from first trimester tissue were first published in 2018 [10,12], yet the use of human pregnancy tissue for research, which can be obtained following induced abortion, is restricted based on specific funding constraints. There has been a shift towards generating organoids from stem cell sources, which may increase the feasibility of human investigations. However, use of a translational animal model remains favorable for mechanistic studies that allow in vitro to in vivo data correlation.
The nonhuman primate (NHP) is an excellent surrogate for studying human placentation due to anatomic and physiological similarities which include length of gestation, placental type and fetal developmental ontogeny [13,14]. Our group have used the pregnant rhesus macaque for many years for in vivo assessments of placental function using a multimodal noninvasive imaging approach [15,16,17,18]. In addition, we have performed comprehensive transcriptomic analysis of rhesus macaque versus human placenta to demonstrate the translational suitability of the pregnant NHP model, with recognition of some species-specific limitations [19]. During the first trimester, extensive fetal and placental growth occurs [20] making this a critical period to understand the dynamic regulation of placental development and function. Figure 1 illustrates the significant growth that occurs between gestational days 30 and 50 in the rhesus macaque (full term is 165 days) which roughly equates to the 7-to-12-week window of human gestation. This is similarly supported by the King ultrastructure study of rhesus macaque pregnancy spanning gestational days 19 to 60. During the window of 19 to 35 days, no major structural villi changes were observed and Hofbauer cells (fetal macrophages) were undetectable. However, between 35 and 60 days there was demonstration of dramatic proliferation and placental expansion [20]. Therefore, our rationale for developing an NHP trophoblast organoid model system is twofold: 1) the existence of a substantial amount of in vivo animal model data that can now be supported by complimentary in vitro mechanistic studies and 2) a translational animal model overcomes the sampling restrictions of first trimester human pregnancy.
There has been comprehensive development and publication of appropriate protocol conditions to optimize isolation and maintenance of human first trimester tissue-derived trophoblast organoids in culture [10,12,21]. We have used this as a basis to develop an NHP protocol, with modifications as needed and described in the Methods. Establishment of a trophoblast organoid model system from whole placenta samples obtained in the first trimester from pregnant rhesus macaques which can be propagated, passaged and used for multiple experimental applications from one initial source, not only expands our ability to study early placental development and function, but also supports the implementation of new approach methods to reduce the number of research animals required to achieve scientific significance.
2. Materials and Methods
2.1. Pregnant Dams
Female rhesus macaques used in this study were all healthy, typical weight animals fed a standard chow diet (Purina Mills™). All animals were assigned to the Time-Mated Breeding (TMB) program and had a proven reproductive history with prior live birth offspring. Reproductive hormone assessments were tracked through daily blood sampling to accurately time breeding attempts, and to assess early breeding success. Within the TMB program, animals are housed as female pairs in continuous full contact, apart from the time (typically 3-5 days) that females are transferred and co-housed with a male for breeding. All early pregnancies were identified through daily monitoring of estrogen and progesterone levels and confirmed by ultrasound. Based on extensive hormonal assessment studies conducted at the ONPRC [22,23], gestational age is calculated by considering the first day of conception as two days after the estrogen peak for consistent and reproducible dating. Pregnancies were delivered by cesarean surgery performed by trained staff in the Surgical Services Unit between gestational days (G) 30 to G50 (where full term gestation is G165 [24]) to allow for placental tissue collection.
2.2. Organoid Isolation
The isolation method described here closely followed the published methodology describing trophoblast organoid generation from human pregnancy [12]. Where protocol deviations were needed for successful application to the rhesus macaque, these are noted below. Whole placenta tissue was obtained from rhesus macaques (n=25) for generation of Rhesus Trophoblast Organoids (RTO). Immediately following delivery, tissue was promptly placed in pre-warmed wash buffer #1 (see Table 1 for complete list of all buffer compositions) for no longer than one hour. Deviation: Whole tissue was washed for 10 minutes at 37oC with gentle shaking on an agitating platform with wash buffer #2 before being placed in 30mls of red blood cell (RBC) lysis buffer (BioLegend 420301) for 5 minutes at 37oC with gentle shaking. Tissue was rinsed in wash buffer #2 following the RBC lysis step which was found to be necessary as organoid cultures failed to survive in the presence of significant RBC contamination. Placenta cell homogenate was harvested via scraping of villi with a scalpel and pooled into digest buffer. Homogenate was digested for 5 minutes at 37oC with shaking before being strained and quenched with digest stop buffer. Undigested material in the strainer was transferred into collagenase V solution (1mg/ml) and digested for an additional 5 minutes to maximize yield. All digest homogenates were quenched with digest stop buffer before being centrifuged at 600xg for 6 minutes to pellet cells. Cell pellet was washed once in 1:1 DMEM:F12 (DMEM/F12), centrifuged again, and transferred into a microfuge tube for a second RBC lysis step (deviation). If few/no RBC were present, this step was omitted. If present, the cell suspension was placed in warm RBC lysis buffer for 5 mins before being quenched with DMEM/F12. Cells were then centrifuged, and debris removed, with 3 washes in DMEM/F12. Cells were suspended in Geltrex (Gibco, A1413202) and 25µl droplets were seeded into a 48-well plate. The Geltrex domes were given 15 minutes to polymerize at 37oC before being overlaid with 250µl of fresh Trophoblast Organoid Media (TOM, low Y-2, Table 2).
2.3. Routine Maintenance and Passage
Media replenishment was performed at 48-to-72-hour intervals with 250µl of fresh, pre-warmed TOM media added to each well. After approximately 7 days in culture, organoids were passaged. Passage was performed by harvesting organoids from their wells into microfuge tubes. Organoids were then washed with DMEM/F12 before manual dissociation of Geltrex. Dissociation was performed by electronic pipettor for 400 total cycles per microfuge tube. The organoids were then pelleted and remaining Geltrex was drawn off. Organoid bodies were enzymatically digested by addition of 500µl of TrypLE Express (Gibco, 12604013) (Deviation: For human TO passage, Stempro Accutase (Gibco, A1110501) is used [21] but this was found to be less effective with RTO passage). Resuspension of the organoid pellet into the solution was critical for appropriate dissociation. Digestion occurred for 5 minutes at 37oC with gentle shaking in an incubator. TrypLE was quenched by addition of 1ml of DMEM/F12, followed by centrifugation. All centrifugation of organoid cultures was performed at 600 x g for 6 minutes at room temp, unless otherwise noted. The organoids were then manually dissociated for 80 cycles using an electronic pipette. Organoids were washed by resuspension in 1ml of DMEM/F12 and centrifuged. Media was completely drawn off for resuspension in Geltrex. According to pellet size, approximately 10X the volume of Geltrex was used per tube. Organoid/Geltrex mixture were seeded at 25µl droplets into 48 well plates for continuing propagation at 37oC in TOM.
2.4. Cryopreservation and Re-Establishing in Culture
Organoids were frozen at a ratio of 4 wells per cryovial, with each cryovial containing 1ml final volume. Organoids were harvested from wells and centrifuged. The cell pellet was washed with DMEM/F12 prior to Geltrex dissociation. Dissociation was achieved via electronic pipette set to 80-160 cycles. Organoids were centrifuged after dissociation, and the remaining Geltrex was removed as described for passage above. The pellet was washed with DMEM/F12 and centrifuged. DMEM/F12 was removed to the maximum extent without disturbing the pellet. 500µl of freeze media #1 (Table 1) was then added and the pellet resuspended. 500µl of freeze media #2 (Table 1) was slowly added and mixed thoroughly, then the entire mixture was moved into a labelled cryovial. Organoids were frozen in a controlled-rate freezing apparatus at -80oC, then moved for long term storage into a liquid nitrogen dewar.
Re-establishment of organoid cultures from frozen stocks consisted of thawing rapidly in a water bath at 37oC, followed by transfer to a microfuge tube. After transfer, the organoids were centrifuged, and freezing media mixture was drawn off. 1ml of DMEM/F12 was added to resuspend the organoids, and they were centrifuged again. Excess media was removed, and the organoids were resuspended in Geltrex at approximately 10X the volume of the pellet. Organoids were seeded as before. Light microscopy was used to check the organoids for appropriate morphology and growth following re-establishment. The organoids were typically passaged 7-14 days post-thaw.
2.5. Differentiation of Trophoblast Organoids
Following passage, 100µl droplets of Geltrex/organoid mixture were seeded into pre-warmed 12-well plates. Geltrex droplets were allowed to cure for 15-20 minutes before being overlaid with 1ml of TOM. Media was replenished with TOM every 48-72hrs, and media were collected from one designated well per cohort for five days following passage, before being switched to EVT media #1 (Table 2) for seven to ten days (depending on observed growth) when outgrowths became evident. EVT media #2 (Table 2) was then applied for another 5 to 7 days. After 18 to 21 days, organoids were harvested by overlaying droplets with 750µl of Cell Recovery Solution (CRS, Corning, 354253) and allowing them to incubate at 4oC for 30 minutes. Organoids were manually scraped and harvested from the wells into 1.5ml eppendorf tubes, and centrifuged. The resulting pellets were rinsed 2x with PBS to ensure full Geltrex removal. Organoids were then lysed with TRIzol and stored at –80oC for RNA collection (see RNA isolation section) or lysed with Cell Lysis Buffer (ThermoFisher Scientific, FNN0011) and taken into the protein isolation protocol (see below).
2.6. Media Harvesting and Storage
Media harvested from organoids was pooled in 4-well increments prior to being centrifuged at 600xg for 6 minutes to remove any debris/organoids. Centrifuged media samples were aliquoted into clean labeled tubes and stored at -20oC until further analysis.
2.7. Histology
Paraffin embedded organoids were produced using Histogel® (Epredia, HG4000012). As described above, CRS was used to remove as much Geltrex as possible prior to harvesting with cold PBS. Organoids were pooled into microcentrifuge tubes and centrifuged. The resulting pellet was washed 3X with 1ml of PBS, along with mechanical disruption to remove any residual Geltrex, which would interfere with the Histogel solidity. After washing, Histogel was prepared by heating until liquified. 500µl of warm Histogel overlaid the pellet, followed by a brief centrifuge pulse to ensure the pellet was at the bottom of the gel. The pellet/gel assembly solidified at 4oC for an hour before removal from the microcentrifuge tube. The Histogel plug was removed and excess gel trimmed to fit in a standard histology cassette with biopsy foam to prevent loss due to small size. Samples were then fixed for 24 hours in 10% neutral buffered formalin before being processed and embedded in paraffin.

Table 3.
Extravillous trophoblast differentiation media components and reagents per 20 mL total media volume.
Table 3.
Extravillous trophoblast differentiation media components and reagents per 20 mL total media volume.
| Media Component | Volume | Stock Concentration |
Final Concentration |
Manufacturer / Catalog Number |
|---|---|---|---|---|
| Advanced DMEM/F12 | 17.6mL | N/A | N/A | ThermoFisher 12634028 |
| L-glutamine | 200µl | 200mM | 2mM | Fisher Scientific 25-030-149 |
| 2-mercapthoethanol | 36.4µl | 55mM | 100µM | Gibco 21985023 |
| Penicillin/Streptomycin | 100µl | 100X | 0.5X | Fisher Scientific 15-140-148 |
| Bovine Serum Albumin | 1mL | 7.5% | 0.375% | Sigma Aldrich A8412-100ML |
| Insulin-Transferrin-Selenium Ethanolamine | 200µl | 100X | 1X | Gibco 15140148 |
| Neuraregulin-1* | 20µl | 100µg/ml | 100ng/ml | ThemoFisher 100-03-50UG |
| A83-01 | 30µl | 5mM | 5µM | Millipore Sigma SML0788-5MG |
| Knockout Serum Replacement | 800µl | N/A | 4% | Gibco 10828028 |
2.8. Immunostaining of Organoids
Organoids were seeded on either glass chamber slides (Ibidi, 80807) or in 96-well optical film bottom plates (Corning, 4680). For chamber slides, 25µl droplets of Geltrex and 250µl of media were overlaid; for 96-well plates, 10µl droplets of Geltrex were overlaid with 150µl of media. Organoids were treated with CRS to remove as much Geltrex as possible prior to fixing in 4% paraformaldehyde for 30 minutes at room temperature. Organoids were then rinsed with PBS before permeabilization buffer (Table A1) was added for 30 minutes at 4°C. Permeabilization buffer was drawn off and blocking buffer was added for an hour at room temperature. Primary antibodies (Table 4) were prepared in blocking buffer and used at the listed dilutions. Primary antibodies were added to submerge the organoids and allowed to incubate at 4°C overnight. Primary antibodies were then drawn off, followed by three washes with PBS to remove unbound antibody. Secondary antibodies were prepared in blocking buffer at the dilutions listed in Table 4 and allowed to incubate for one hour at room temp. Phalloidin, if used, was also added during the secondary antibody incubation step at 1X concentration from 10000X stock and allowed to incubate for one hour (ThermoFisher Scientific, R415). Secondary antibodies were then drawn off and DAPI stains were performed using 1ug/ml DAPI solution and incubated for five minutes at room temperature. Organoids were rinsed 3x with PBS to remove any unbound DAPI/Secondary antibody. Cover slipping for chamber slide organoids was performed using Prolong Gold Antifade (Invitrogen, P36930) mounting reagent and slides were allowed to cure overnight at room temperature before imaging. 96-well plate organoids were covered with 100µl of PBS and imaged within 72 hours of staining.
2.9. Immunostaining FFPE Tissue
Histological sections were cut from paraffin embedded blocks at a thickness of 5µm. Slides were heated to 60°C for 1 hour prior to being dewaxed in xylenes followed by 5 minute ethanol gradient washes of 95% x2, 90% x2, 85% x1 and 80% x1 followed by deionized water to rehydrate the tissue. After rehydration, tissues were permeabilized for 30 minutes at room temperature in permeabilization buffer (Table A1). Heat induced epitope retrieval was performed using either citrate buffer pH 6 or Tris buffer pH 9 (Table A1) in a pressure cooker set to 100°C for 10 minutes. Sections were stained with the conditions described above for organoid samples.
2.10. Confocal Microscopy
Confocal microscopy images were acquired using a Leica Stellaris DMi8 housed by the OHSU ONPRC Integrated Pathology core. All organoid images shown were acquired using the 20X dry objective (NA 0.75) with a pinhole set to 1 Airy Unit.
2.11. RNA Isolation
RNA isolations were performed via phenol/chloroform separation using TRIzol (Invitrogen, 15596026) reagent. Organoid samples were incubated in CRS for 30 minutes before harvesting followed by two PBS washes before TRIzol addition. 1mL of TRIzol was added to an organoid pellet containing organoids harvested from 4-6 wells. Samples were then stored at –80°C until extraction. Immediately after thawing, 800µl of lysate was transferred into a clean labelled tube with approximately 50µl of DuPont Molykote vacuum grease at the bottom (ThermoFisher Scientific, 044224.KT). 200µl of chloroform was overlaid, and the mixture was inverted 20x before being allowed to stand for 5 minutes at room temperature. The samples were then spun at 4°C at 21,300 x g for 5 minutes. The aqueous layer was drawn off and transferred into 400µl of isopropanol with 1µl of linear acrylamide carrier (AM9520) and inverted 20x to mix, followed by a 15-minute incubation at room temperature. Samples were then spun at 4°C at 21,300 x g for 15 minutes and subsequently washed twice in 80% ethanol, spinning at 21,300 x g at 4°C for 5 minutes. Excess ethanol was then removed, and the pellets were dried for approximately 10 minutes at room temperature, then eluted in 40ul of nuclease-free water (ThermoFisher Scientific, J71786.AP). RNA concentrations and purity were measured via Nanodrop instrument. If 260/280 and 260/240 ratios were not satisfactory (>1.8 for each), the samples were cleaned as follows: water added as needed to bring volumes to 100µl. 50µl of 7.5M NH4Ac and 200µl of isopropanol were added to each sample to precipitate and incubated for 10 minutes at room temp. Samples were spun at 21,300 x g for 10 minutes, and supernatant was drawn off. A wash with 80% ethanol followed. Supernatant was removed, and the pellet air-dried for 10 minutes at room temperature. Pellets were dissolved in 40µl of nuclease-free water and a Nanodrop Spectrophotometer was used to confirm purity. RNA integrity was assessed via an RNA bleach gel before proceeding to RT-qPCR [25].
2.12. RT-qPCR
For all samples used in RT-qPCR, 1µg of RNA was converted into cDNA using Superscript III RT kit (ThermoFisher, 18080044). RNA was treated with DNase I (Promega, M6101) according to manufacturer recommendations prior to cDNA synthesis to remove genomic DNA (gDNA). Negative controls (no reverse transcriptase added) were also performed and analyzed by gel electrophoresis to confirm no gDNA was present. cDNA was stored at 4oC for short-term and –20oC for long-term storage. Random hexamers (ThermoFisher, N8080127) were used to prime RNA samples for whole RNA conversion. Primers were either sourced from published literature or designed using the NCBI Primer BLAST tool, as noted in Table A2. All qPCR assays were performed on the Applied Biosystems Quant Studio 3 machine in the 96-well plate format with the annealing temperature set to 55oC. Primers were validated by both gel electrophoresis to confirm specificity and melting point analysis following qPCR. Sybr Green based chemistry was used to assay gene abundance, using PowerTrack master mix (ThermoFisher Scientific, A46109) A modified version of the Pfaffl method [26] was used to perform relative quantification for genes of interest. Primer efficiencies were obtained using five-point standard curves with purified PCR product diluted to copy number of 2 x 10⁶ and serially diluting at 1:5 thereafter before experimental samples were run. Gel extractions were performed using the Monarch Spin DNA gel extraction kit according to manufacturer protocol (New England Biosciences, T1120S). In the event of unclean template, PCR product cleanup was performed using the Wizard SV Gel and DNA Clean-up System (Promega A9281). Experimental cDNA were diluted at 1:100 before being used in qPCR reactions. All RT-qPCR samples and standard curves were run in triplicate with non-template controls using molecular grade water.
2.13. Agarose Gel Electrophoresis
To confirm the specificity of primers used in RT-qPCR and that RNA samples used had no gDNA contamination, gel electrophoresis was performed. Agarose gels were created at 2% w/v agarose in Tris-acetate-EDTA buffer (TAE) to analyze PCR amplicons. Gels were run in diluted 1x TAE buffer (ThermoFisher Scientific, B49) at 120V for 45 minutes and subsequently stained with SYBR Safe stain (Invitrogen, S33102) at 1X concentration for 15 minutes prior to imaging. Images were acquired on an Invitrogen iBright CL1500 using UV light. ThermoFisher GeneRuler 100bp ladder was used to confirm the size of PCR amplicons were within expected parameters.
2.14. Protein Isolation
Media was removed from the wells and organoids were washed in 250µl of ice-cold CRS. Geltrex domes were dislodged via scraping with a pipette tip and pooled into microfuge tubes. Pooled samples incubated in CRS on ice for 30 minutes to fully remove Geltrex. Organoids were centrifuged to form a pellet and the remaining Geltrex was removed. Organoids were washed 3X with ice-cold PBS to ensure full removal. Following wash steps, 150-250µl of cell lysis buffer (ThermoFisher Scientific, FNN0011) with added protease inhibitor-- 0.1M PMSF and Halt Protease Inhibitor Cocktail (ThermoFisher Scientific, 78440) was added, volume dependent on the volume of the pellet. Lysis occurred for 30 minutes on ice with pipetting and gentle vortexing every 10 minutes. The lysate was then centrifuged at 13,500 x g for 10 minutes to remove cellular debris, and aliquoted prior to storage at -80oC (long term). Protein concentrations were quantified via Bradford Protein Assay (ThermoFisher Scientific, A55866) according to manufacturer protocol. Protein yields ranged from 0.620 ng/µl to 1.584 ng/µl.
2.15. LDH Assay
Lactate Dehydrogenase (LDH) colorimetric assays were performed according to manufacturer instructions using diluted supernatant samples (MyBioSource, MBS822351). To ensure accurate measurement of LDH, assays were performed within 6 months of supernatant collection (stored at –20oC). Due to the presence of TOM media component phenol red in supernatant samples, dilutions of 1:4 were used to minimize interference. Samples were assayed in triplicate and averages are reported.
2.16. GDF-15 ELISA
GDF-15 ELISA kits were performed according to manufacturer instructions using diluted supernatant samples (Thermo-Fisher, EP7RB). All samples were diluted at 1:50. Samples were assayed in duplicate and averages are reported.
2.17. Organoid Polarity Manipulation
To alter physiological polarity, modifications were made to the passage protocol to omit Geltrex and use Corning 7007 ultra-low adhesion U-bottom plates. After the final spin in the passage protocol, organoids were resuspended in TOM media. Several dilutions were prepared and plated in a test plate to achieve 2-3 organoids in a 10µl drop as observed under a microscope. Once satisfied with the concentration of organoids, the U-bottom plates were seeded. Continuous mixing of the organoid suspension was critical to achieving consistent plating. After the plates were seeded, each well was overlaid with 190µl of TOM. Media was refreshed every 72 hours by removing 75µl of media and replacing it with 75µl of fresh media. Careful feeding is required to ensure organoids are not disturbed at the bottom of each well. Growth rates are slower for organoids seeded in this way. To characterize the polarity of the organoids, samples were taken from 7, 14, and 21 days post-plating. These were then stained as described above for SDC1 and CDH1, which localize to SYN and CTB cells, respectively.
2.18. Image Processing
Image processing was performed in Fiji [27]. Processing of brightfield images included scaling using a known reference slide, cropping and inserting a scalebar using the Fiji scalebar tool. Processing of fluorescent and confocal images consisted of cropping and separating fluorescent channels. Sample images shown were created from slices of stacks in representative images. All raw images are available in the supplementary material.
3. Results
3.1. Generation of Rhesus Trophoblast Organoids
In this report, human protocols [10,12,21] were successfully applied to rhesus macaque first trimester tissue spanning the gestational age range of G30 to G50, with minor modifications reported as needed for optimization of placenta trophoblast organoid yields. Rhesus macaque organoid isolations were attempted from placenta samples from 25 pregnancies with 19 yielding successful preparations. A number of these RTO lines have been propagated through 20 passages equating to ~6 months in culture and they remain healthy in appearance as assessed by morphology. Passage was performed when the majority of organoid bodies reached >300µm in diameter (Figure 2A). The typical time interval between passages was 7 days. Importantly, RTO lines have been successfully re-established and propagated after cryopreservation and liquid N2 storage which confirms the long-term utility of this model resource.
3.2. Characterization of Rhesus Trophoblast Organoids
Immunofluorescent characterization is shown for two representative RTO lines generated from rhesus macaque placental tissue delivered at G30 (Figure 2B) and G50 (Figure 2C). The expression of Ki67 and KRT7 demonstrates the presence of proliferative trophoblast cells within the organoid bodies (Figure 2B,C). Of note, CDH1, a marker of cytotrophoblast cells is predominantly expressed on the external surface of the organoids, which is in keeping with the reverse polarity issue found in human trophoblast organoid preparations [28,29].
3.3. Differentiation of Rhesus Trophoblast Organoids
To verify the ability of RTO lines to be experimentally manipulated to induce trophoblast differentiation, media conditions were manipulated and morphological appearance and secretory assessments were performed. For comparison, control RTOs were plated as replicate samples and maintained in TOM for an extended period. Figure 3A represents the organoid structures over days 10 to 19 post passage. The darkened appearance of the organoids is not unexpected given the typical 7-day interval between passage. Production
of LDH was measured in supernatant collected over the 19-day culture period with undetectable levels prior to day 10 and modest production noted with subsequent time in culture (Figure 3C). In a subset of organoids intentionally lysed by brief incubation with Triton-X as a positive control, LDH levels were 30-fold higher than those reported here. Organoids grown in EVT differentiation media #1 (applied from day 10 onward), were altered in appearance with evidence of EVT-like outgrowth (Figure 3B, panels d14 and d17) and cystic-like structures evident shortly after the transition to EVT#2 media (Figure 3B, panel d19). There was an initial spike in LDH production following the switch to EVT#1 media but generally low levels of LDH were produced by EVT-differentiated RTOs (Figure 3C).
Figure 3.
EVT Differentiation in Rhesus Trophoblast Organoids A) Growth through time of RTO6 P10 in TOM. Scale bar is 150 µm. B) Growth through time of RTO6 P10 in EVT media. EVT #1 is applied from days 10 to 17, followed by EVT #2 from day 17 onwards. Arrows denote EVT-like outgrowths. C) LDH levels detected (Units of enzyme/ml) in supernatants of EVT and TOM controls. Filled circles denote EVTs, open circles denote TOM. D) GDF15 levels detected (ng/ml) by ELISA assay in supernatants of EVT and TOM controls. Filled circles denote EVT, open circles denote TOM controls. E) RT-qPCR data from EVT organoids, normalized to TOM controls. Circles represent average fold-change per EVT group. EVT organoids display up-regulation of key EVT marker genes ITGA5, GCM1, and MMP2, while expressing relatively lower levels of CTB marker CDH1. P: passage number; D: days in culture.
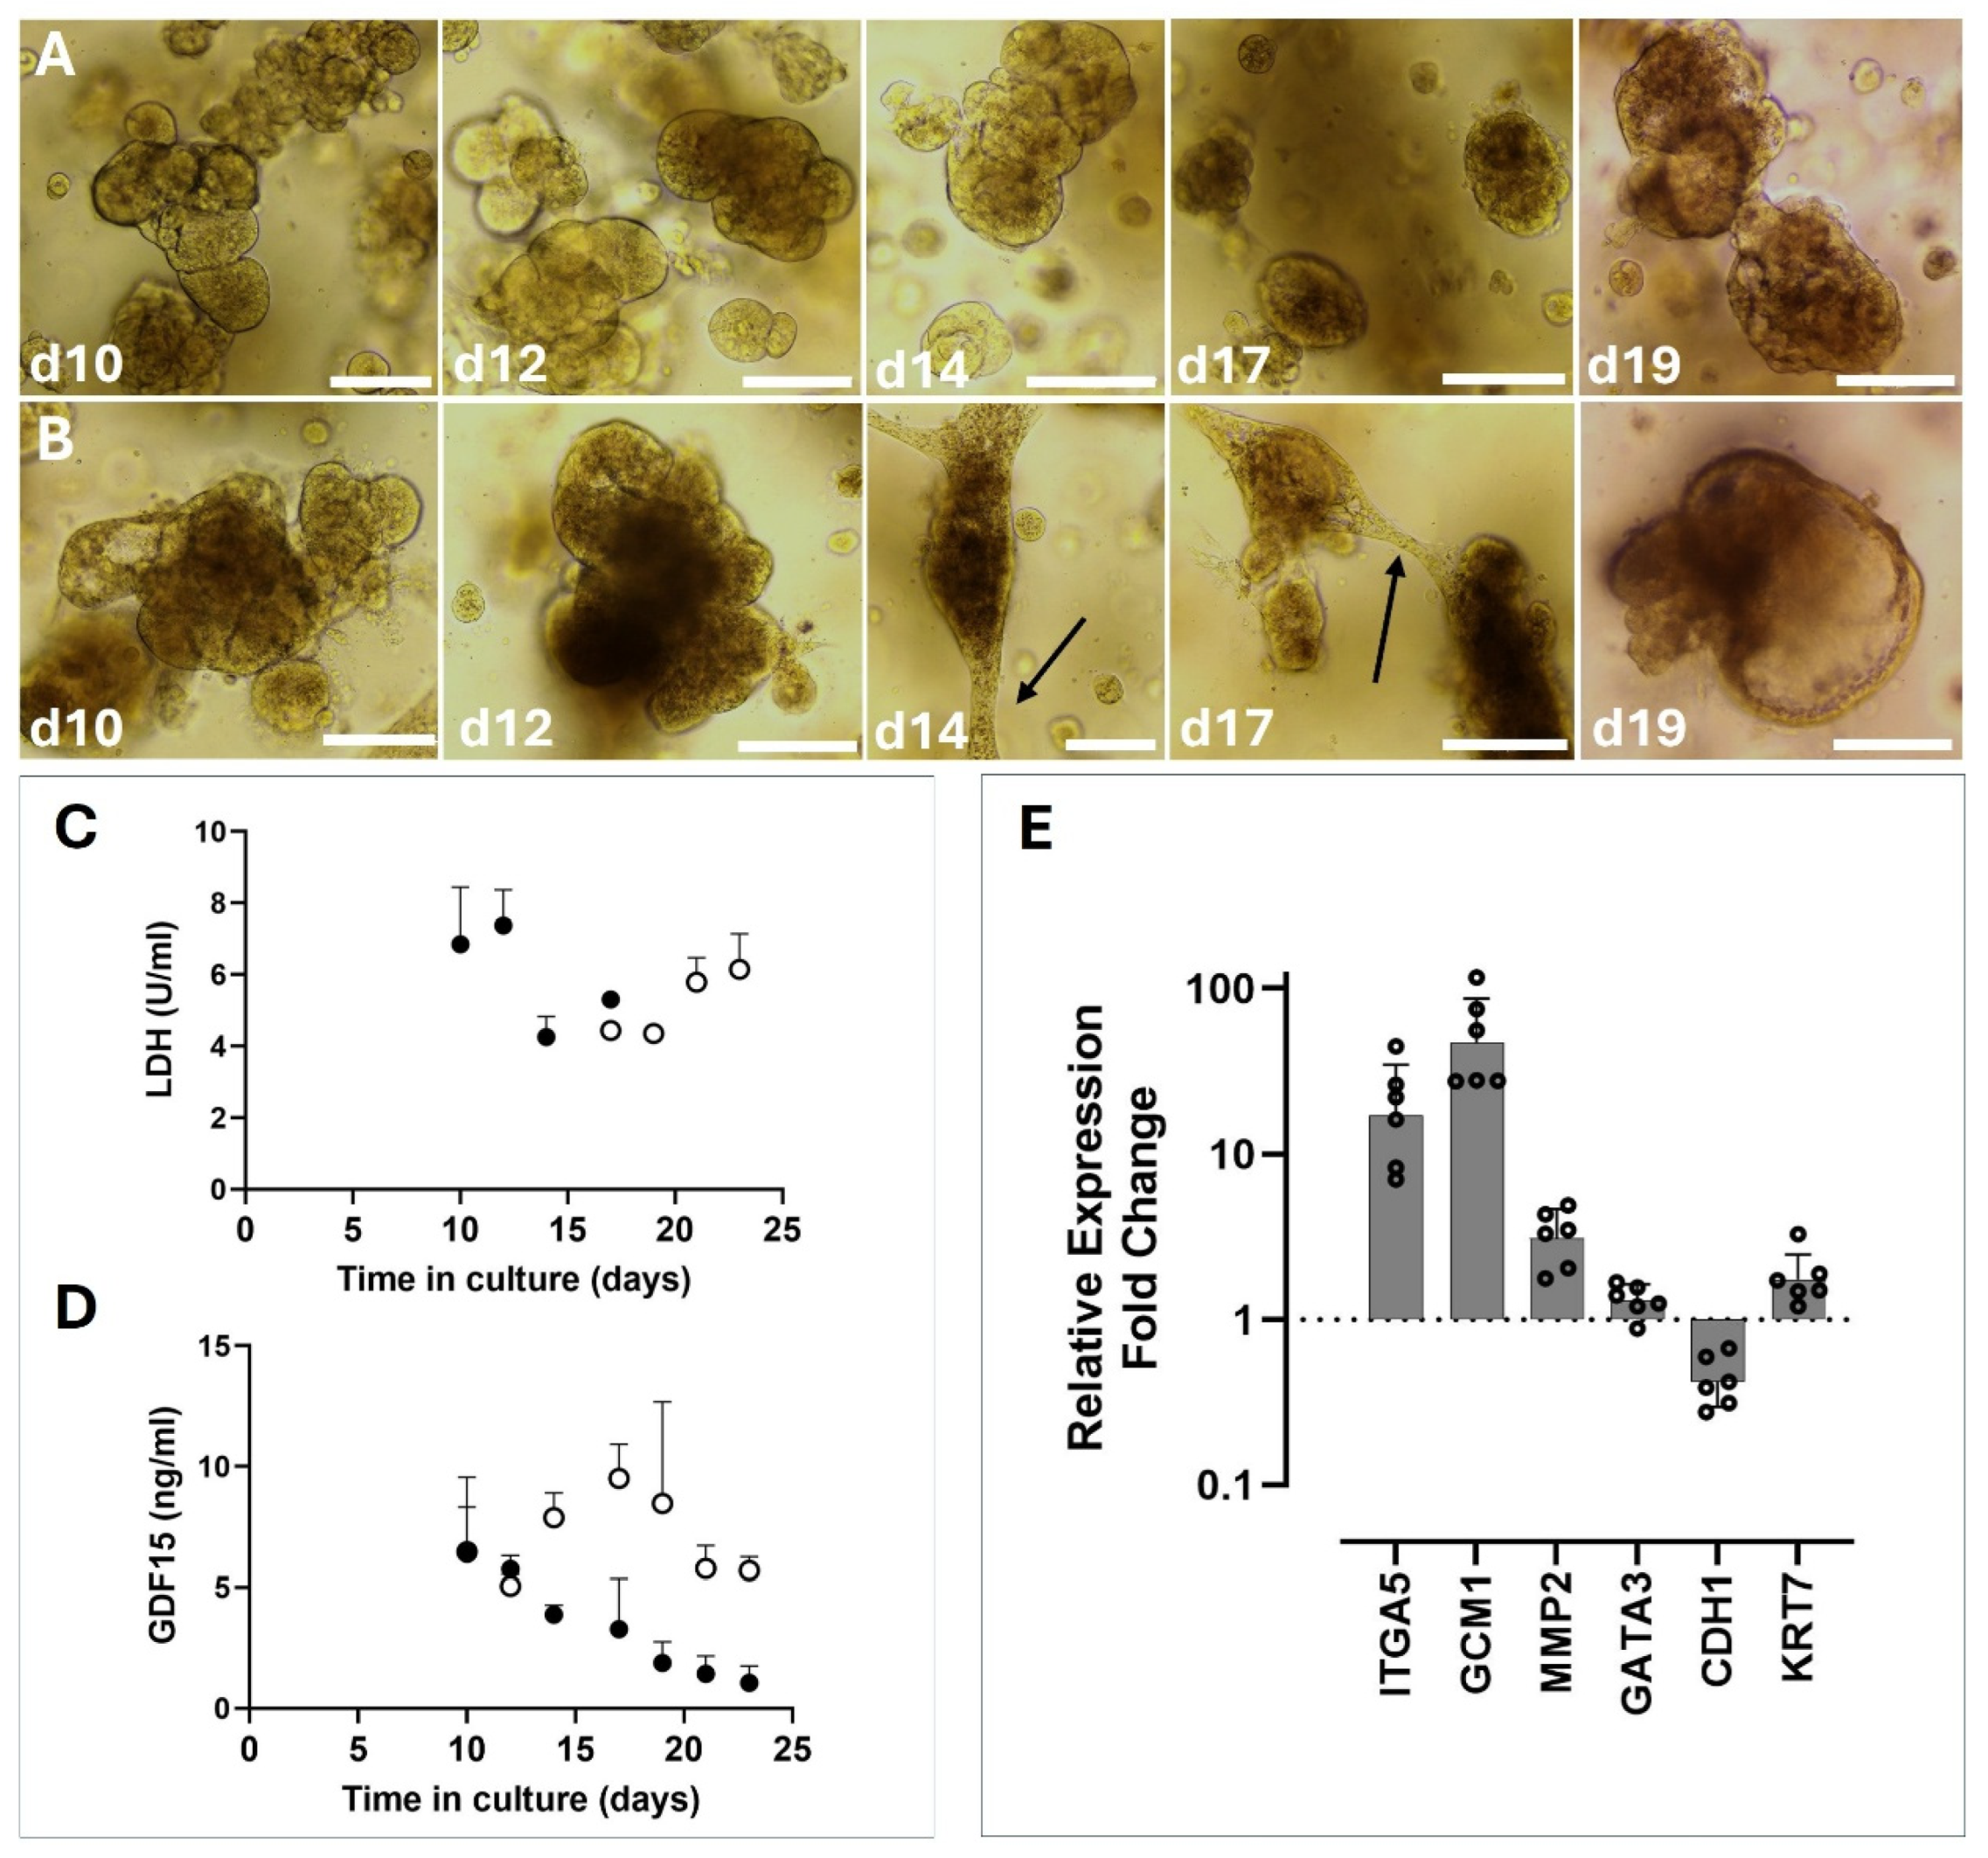
GDF-15 plays a role in trophoblast invasion and migration [30]. Similar to LDH, GDF-15 levels were undetectable prior to day 10 in culture supernatants. Organoids maintained in TOM showed an initial increase in expression which decreased somewhat with extended time in culture. By comparison, organoids incubated in EVT-differentiation media had gradually decreased GDF-15 production with time in culture (Figure 3D).
To complete characterization of the EVT-differentiation process, gene expression of cytotrophoblast and extravillous trophoblast markers was quantified by RT-qPCR (Figure 3E). EVT-differentiated organoids (combined data from G30 and G50 RTO lines) demonstrate upregulation of key EVT marker genes including ITGA5, GCM1 and MMP2 and appropriately reduced levels of the cytotrophoblast-specific marker CDH1 (Figure 3E).
3.3. Differentiation of Rhesus Trophoblast Organoids
One technical challenge with the generation of organoids is their orientation as they typically assemble with cytotrophoblast cells facing outwards and the syncytiotrophoblast layer internalized (Figure 2B,C). To address this issue, we plated organoids in U-bottom shaped wells in the absence of an extracellular matrix media. By brightfield imaging we observe a more rounded shape for the organoid bodies (Figure 4A) which lack the more typical ‘blebbing’ appearance (exampled in Figure 2 A and Figure 3 A). Preservation of polarity-altered organoids by formalin fixation and paraffin embedding allowed for histological imaging for comparison to similarly conserved placental tissue from the corresponding initial sample (Figure 4B–D). Expression of the syncytiotrophoblast-specific marker, SDC1 on the outer surface of the organoids (cyan stain in Figure 4C) and internal localization of the cytotrophoblast-specific marker, CDH1 (red stain in Figure 4C) demonstrates our ability to alter RTO polarity using this technical manipulation.
4. Discussion
First trimester placental development is comprised of some of the most critical and yet largely understudied cellular events that determine subsequent fetal outcomes. Improper placentation leads to a host of health issues that not only impact the fetal period but also influence offspring throughout their life. Thus, a paradigm to study early placental development is necessary and this has spurred on the pursuit of new in vitro model systems that recapitulate specific aspects of placentation for further study. One of the most complex and translationally valid models to arise are organoids, three-dimensional structures comprised of multiple differentiated cell types that originate from a common progenitor population [12,21]. Trophoblasts are the progenitor cells that serve as the proliferative base for differentiation and maintenance of the placenta. One challenge for human pregnancy studies is the availability of first trimester tissue. The NHP is an excellent surrogate for studying human placentation due to anatomic and physiological similarities which include gestational length and developmental ontogeny [14]. We have previously performed comprehensive transcriptomic analysis of rhesus macaque versus human placenta to demonstrate the suitability of this NHP model, with recognition of some species-specific limitations [19].
In this study we have leveraged the rhesus macaque to derive trophoblast organoids that behave similarly to human trophoblast organoids (HTO). Importantly, RTOs demonstrate similar size and spatial organization to their human counterparts. Expression of cytotrophoblast markers CDH1 and KRT7 at both the RNA and protein level help confirm their identity as trophoblast (Figure 2 and Figure 3). No changes were required from the human formulation for TOM media, which suggests that the trophoblast stem cell niche in the primate is similar in nature to the human [12,21]. Of note, growth rates are slightly faster with the average time to passage RTOs being 7 days compared to 10 days for HTOs [12]. We report that a more aggressive dissociation reagent is preferable in RTOs, utilizing TrpLE Express as opposed to Stem Pro accutase. We have successfully propagated RTO lines up to 20 passages with no visual signs of decline, marking a significant improvement over primary trophoblast cells in 2-dimensional culture. The overlap between rhesus and human models for basic trophoblast stem cell (TSC)/cytotrophoblast function and SYN differentiation makes leveraging in vivo data in the rhesus more intriguing. Furthermore, primary tissue derived RTOs from early gestational timepoints alleviate constraints around the study of early gestational events in human subjects.
Organoids in standard TOM typically undergo spontaneous SYN differentiation, similar to villous cytotrophoblasts in 2-dimensional culture [31]. Significant divergence in the characterization of macaque EVT cells has been reported [19,32] and replicated herein. We have demonstrated partial success in differentiating RTOs into EVT cells, but we note multiple points of divergence from the human successes with this process. Namely, the key markers of EVT cells are completely different. Recent reports have converged on ITGA5, MMP2, and NCAM1 as markers for EVT cells in the rhesus, differing from HLA-G as the most reliable marker in human [33,34]. We have found that in response to Wnt withdrawal and increased TGF-β inhibition by A83-01, RTOs do increase their expression of EVT markers and morphologically become more invasive and spindlier, but also develop cystic structures that are less invasive in nature (Figure 3 B). It is known that macaque EVT’s do not invade as deeply into the uterine wall as human EVTs [14]. Indeed, it could be that the macaque EVT invasion program is not as aggressive as that in humans, but whether this is because of differences in gene expression, or if it arises from immune regulation on the maternal side has not been explored. Further disentangling the factors governing EVT differentiation in both species may allow for direct investigation of gene functions in the context of the developing placenta.
Stable expression of trophoblast markers KRT7, GATA3 and CDH1 suggest that the identities of RTO lines are indeed trophoblasts. We also note that organoids grown in TOM maintain a very proliferative state, with robust nuclear Ki67 expression through multiple passages (Figure 2). In TOM after an establishment period of 10-21 days following initial isolation, RTOs are quite stable with routine passage every 7 days. LDH levels detected in supernatants confirm this, with undetectable LDH from RTOs maintained in TOM until approximately 14 days post passage (Figure 3).
In analyzing gene expression of key EVT markers, we noted a sharp upregulation of GCM1 in macaque EVTs. The transcription factor GCM1 is typically considered a marker for SYN, not for EVTs [35]. GCM1 is necessary for proper SYN development in the mouse and human, with knockout mice being embryonic lethal, and is highly expressed through pregnancy in the placenta [35,36]. However, GCM1 also plays a role in EVT differentiation, specifically by influencing the expression of NOTUM, a Wnt antagonist [37]. Our data suggest that this role may be conserved in the rhesus placenta, as we observed consistent upregulation of GCM1 transcription in the EVT media condition. However, it cannot be assumed that upregulation of GCM1 in this context is strictly related to EVT differentiation. Given the dual role of GCM1 in the placenta of humans, we also assayed the levels of GDF-15, a growth factor secreted by mature SYN, in the supernatant of EVT or TOM organoids (Figure 3). GDF-15 expression was consistently lower in EVT-treated supernatants than in TOM-treated supernatants. This in combination with elevated GCM1 expression suggests that the upregulation observed was indeed a response to the EVT-stimulating conditions. It is also worth noting that a peak of GDF-15 expression was observed in the organoids from days 10-17, which is longer than they would typically be grown before passage. Studying SYN function specifically then, may benefit from slightly older organoids that have more active SYN cells. Further analysis into how, when, and where GCM1 expression occurs in the rhesus placenta may give insight into the mechanism for EVT differentiation in the macaque. Consequently, species-specific features may also betray the nature of human EVT differentiation.
Other genes that were observed to be upregulated in the EVT cohort were ITGA5 and MMP2 (Figure 3). Both of these genes are known markers of human EVTs and are important to the remodeling and migratory functions that EVTs must fulfill in healthy pregnancy [34,38]. The switching from ITGA2 to ITGA5 in EVT differentiation is a notable feature in the human, and RNA-seq data from macaques suggest that this transition may be conserved in primate pregnancy [32]. Further evidence for EVT differentiation in this model comes from the downregulation of CDH1, a marker for cytotrophoblast in the villous compartment. As is expected in a model of EVT differentiation, further cell divisions give rise to EVT cells and a diminishing cytotrophoblast compartment. The EVT differentiation process needs further optimization in our hands to improve the utility of RTOs as an in vitro model system. LDH levels spike sharply after the introduction of EVT #1 to the organoids, before leveling out and falling back to undetectable levels later in differentiation (Figure 3). Morphologically, the organoids take on a dark appearance, which further suggests that they are not in optimum health. Whether this is a feature inherent to EVTs or an unintended result of changes to the media composition are unknown at present.
We also aimed to address the issue of organoid polarity. Achieving proper polarity increases the translational relevance of both HTO and RTO models. To date, several studies have provided solutions to the inverse polarity configuration of HTOs grown in 3D matrices [28,29,39]. Perhaps the simplest solution involves utilizing ultra-low adhesion plates and upon removing organoids from their matrix at passage, they are replaced in a matrix-free environment. We have performed this experiment to investigate whether RTOs are capable of growing in a matrix-free environment and if so, are able to regain physiological polarity observed in vivo. To that end, we leveraged Corning 7007 plates and seeded groups of 1-3 organoids in each well post-passage. Organoids grown in these conditions initially grow slower than their matrix seeded counterparts, but with sufficient time achieved sizes in excess of 400µm in diameter (Figure 4). Along with the increased size, these organoids tend to grow more cystic outgrowths and appear ‘smoother’ than Geltrex embedded organoids. Histological analysis showed that these organoids are starting to revert their polarity to physiological orientation, with SYN marker SDC1 staining observed in part on the outer layers of these organoids. No such staining was observed in the standard culture conditions (Figure 4 D). This suggests that RTOs are capable of growing in the physiological orientation with proper culture conditions. The methodology will be expanded to improve throughput and overall success of SYN maturation. This methodology may allow for a simple way to more effectively assay SYN development and function in early gestational timeframes. In addition, as a result of our endeavors towards polarity manipulation, we trialed Cultrex reduced growth-factor BME type R1 based on recent publications recommending the reagent [40]. All data presented herein are from organoids maintained in Geltrex, but we have found Cultrex to be more effective for establishing and propagating organoids. Cultrex will be the extracellular matrix reagent used in our future RTO work.
The work presented here is somewhat limited in scope and intended to establish the protocol for deriving RTO lines from early gestational samples. More detailed analysis of protein expression and RNA-seq work would strongly benefit the utility of both RTOs and the macaque as a translational model for early placental development studies. Furthermore, in the human, TSC-based approaches to deriving organoids have dramatically expanded accessibility to organoid systems and opened avenues for molecular investigation such as knockout cell lines turned to organoids. Recent work has detailed the derivation and establishment of macaque TSC’s [32,41] but to our knowledge no organoids have yet been derived or characterized from these cells. It has been established in human work that while very similar, trophoblast organoids derived from TSC’s are not identical to primary organoids [21,42]. The lack of conserved EVT markers between macaques and humans also obfuscates the translational utility of the model as many pregnancy diseases are suspected to arise from defective EVT development. Going one step further removed from TSC are organoids that are derived from induced pluripotent stem cells. Expanding the available modes of derivation for RTOs will greatly improve their potential as a translational model.
We believe that the model system offered in this report will expand the use and further strengthen the translational value of the rhesus macaque by facilitating in vivo studies that are strongly supported by in vitro data. The efficacy of the RTO model resource for early placenta research offers exciting potential to expand mechanistic studies in this difficult to study timeframe.
Supplementary Materials
The following supporting information can be downloaded at: Preprints.org, Figure S1: Primer validation by agarose gel electrophoresis. Figure S2: Negative controls for Organoid Immunofluorescence. All raw images are available in a supplementary zip file.
Author Contributions
Conceptualization, V.H.J.R.; Methodology, V.H.J.R., B.M.W. and B.P.S.; Validation, V.H.J.R., B.M.W., H.F.H and J.N.C.; Investigation, V.H.J.R., B.M.W., H.F.H and J.N.C.; Resources, V.H.J.R., M.C.W. and M.K.B.; Data Curation, V.H.J.R., B.M.W., H.F.H and J.N.C.; Writing – Original Draft Preparation, V.H.J.R., B.M.W., H.F.H and J.N.C.; Writing – Review & Editing, B.P.S., M.C.W. and M.K.B.; Supervision, V.H.J.R.; Project Administration, V.H.J.R.; Funding Acquisition, V.H.J.R.
Funding
This work was primarily supported by the National Institutes of Health (NIH), National Institute of Child Health and Development, R21HD104797 (VHJR) and NIH Office of the Director, P51-OD-011092. Additional support from the NIH National Genome Research Institute, HG012483, the OHSU Women’s Reproductive Health Research K12 Program, K12HD085809 (MKB), and the Integrated Pathology Core at the ONPRC by NIH Award S10RR024585. The content is solely the responsibility of the authors and does not necessarily represent the official views of the National Institutes of Health.
Institutional Review Board Statement
All experimental protocols were approved by the Institutional Animal Care and Use Committee (IACUC, protocol # IP00004029) of the ONPRC, and all procedures contributing to this work complied with the ethical standards of the relevant national guides on the care and use of laboratory animals from the Animal Welfare Act and enforced by the United States Department of Agriculture.
Data Availability Statement
The original contributions presented in this study are included in the article/supplementary material. Further inquiries can be directed at the corresponding author.
Acknowledgments
We gratefully acknowledge the staff within the Division of Comparative Medicine, the Surgical Services Unit and the Pathology Services Unit at the ONPRC. We also acknowledge the generous support of Sudeshna Tripathy in providing RT-qPCR primers for CDH1, KRT7 and MMP2.
Conflicts of Interest
The authors declare no conflicts of interest.
Abbreviations
The following abbreviations are used in this manuscript:
| Acronym | Definition |
| SYN | Syncytiotrophoblast |
| EVT | Extravillous Trophoblast |
| TSC | Trophoblast Stem Cell |
| NHP | Nonhuman Primate |
| TO | Trophoblast Organoid |
| RTO | Rhesus Trophoblast Organoid |
| HTO | Human Trophoblast Organoid |
| TOM | Trophoblast Organoid Media |
| TMB | Time-Mated Breeding |
| RBC | Red Blood Cell |
| CRS | Cell Recovery Solution |
| LDH | Lactate Dehydrogenase |
| IACUC | Institutional Animal Care and Use Committee |
Appendix A
Table A1.
Buffers used for immunostaining.
| Buffer Name | Reagents | Manufacturer & Catalog Number |
|---|---|---|
| Phosphate Buffered Saline | NaCl 137mM, KCl 2.7mM, Na2HPO4 10mM, KH2PO4 1.8mM | Sigma Aldrich, S9888-1KG, P3911-500G, S9763-500G, P0662-500G |
| Permeabilization Buffer | PBS 0.5% Triton X-100 |
Sigma Aldrich, T8787-50ML |
| Blocking Buffer | PBS 5% Goat Serum, 0.1% Tween-20 |
Jackson Immunoresearch, 005-000-121 Thermo Fisher, J20605.AP |
| Citrate Buffer, pH 6.0 | 10mM sodium citrate, 0.05% Tween-20, pH 6.0 | Fisher Scientific, S279-500 |
| Tris-EDTA Buffer, pH 9.0 | 10mM Tris, 1mM EDTA, 0.05% Tween-20, pH 9.0 | Thermo Fisher, 15506017 Thermo Fisher, 15576028 |
| Mounting Media | 90% Glycerol, 10mM Tris | Fisher Scientific, G33-1 |
| Prolong Gold Antifade Mounting Media | Thermo Fisher, P36930 |
Table A2.
Primer sequences for quantitative real-time PCR.
| Gene | Primer (5’-3’) | Amplicon Size (bp) |
|---|---|---|
| 18s rRNA | F:TAACGAACGAGACTCTGGCAT | 138 |
| R:CGGACATCTAAGGGCATCACAG | ||
| ITGA5 | F: TTACGGGACTCAACTGCACC | 149 |
| R: CTCCGGGCATTTCAGGATCT | ||
| ACTB | F: CTACCATGAGCTGCGTGTGG | 130 |
| R: GTACATGGCTGGGGTGTTGA | ||
| GCM1 | F: AAGCTGCCACAGAACGTGAA | 98 |
| R: CGCTGTGCATTCTTGTCCTC | ||
| GATA3 | F: CTCTTCGCTACCCAGGTGAC | 93 |
| R: ACTCTGGAATTCTGCGAGCC | ||
| NOTCH1 | F: GACGGCATCAATGGCTTCAC | 140 |
| R: CAGTCGCACTTGTACCCGTT | ||
| KRT7 | F: ACGGGAATGCAGTTGAGGAC | 134 |
| R: CATTACGGAGGTCCCTGGAAG | ||
| MMP2 | F: GAGAAGGCCAAGTGGTCCG | 171 |
| R: AGCCGTACTTGCCATCCTTC |
References
- R. N. Baergen, G. J. Burton, and C. G. Kaplan, Eds., Benirschke’s Pathology of the Human Placenta. Cham: Springer International Publishing, 2022. [CrossRef]
- C. M. Simán, C. P. Sibley, C. J. Jones, M. A. Turner, and S. L. Greenwood, “The functional regeneration of syncytiotrophoblast in cultured explants of term placenta,” Am. J. Physiol. Regul. Integr. Comp. Physiol., vol. 280, no. 4, pp. R1116-1122, Apr. 2001. [CrossRef]
- D. L. Bloxam, C. M. Bax, and B. E. Bax, “Culture of syncytiotrophoblast for the study of human placental transfer. Part I: Isolation and purification of cytotrophoblast,” Placenta, vol. 18, no. 2–3, pp. 93–98, 1997. [CrossRef]
- P. V. Mohanan, Microfluidics and Multi Organs on Chip. Springer Nature, 2022.
- M. Knöfler, S. Haider, L. Saleh, J. Pollheimer, T. K. J. B. Gamage, and J. James, “Human placenta and trophoblast development: key molecular mechanisms and model systems,” Cell. Mol. Life Sci. CMLS, vol. 76, no. 18, pp. 3479–3496, Sep. 2019. [CrossRef]
- A. E. Guttmacher, Y. T. Maddox, and C. Y. Spong, “The Human Placenta Project: placental structure, development, and function in real time,” Placenta, vol. 35, no. 5, pp. 303–304, May 2014. [CrossRef]
- A. E. Guttmacher and C. Y. Spong, “The human placenta project: it’s time for real time,” Am. J. Obstet. Gynecol., vol. 213, no. 4 Suppl, pp. S3-5, Oct. 2015. [CrossRef]
- N. Andescavage and C. Limperopoulos, “Emerging placental biomarkers of health and disease through advanced magnetic resonance imaging (MRI),” Exp. Neurol., vol. 347, p. 113868, Jan. 2022. [CrossRef]
- M. C. Schabel et al., “Quantitative longitudinal T2* mapping for assessing placental function and association with adverse pregnancy outcomes across gestation,” PloS One, vol. 17, no. 7, p. e0270360, 2022. [CrossRef]
- S. Haider et al., “Self-Renewing Trophoblast Organoids Recapitulate the Developmental Program of the Early Human Placenta,” Stem Cell Rep., vol. 11, no. 2, pp. 537–551, Aug. 2018. [CrossRef]
- S. Ramani, S. E. Crawford, S. E. Blutt, and M. K. Estes, “Human organoid cultures: Transformative New Tools for Human Virus Studies,” Curr. Opin. Virol., vol. 29, pp. 79–86, Apr. 2018. [CrossRef]
- M. Y. Turco et al., “Trophoblast organoids as a model for maternal-fetal interactions during human placentation,” Nature, vol. 564, no. 7735, pp. 263–267, Dec. 2018. [CrossRef]
- K. Benirschke, “Placentation,” J. Exp. Zool., vol. 228, no. 2, pp. 385–389, 1983. [CrossRef]
- E. M. Ramsey, M. L. Houston, and J. W. Harris, “Interactions of the trophoblast and maternal tissues in three closely related primate species,” Am. J. Obstet. Gynecol., vol. 124, no. 6, pp. 647–652, Mar. 1976. [CrossRef]
- A. E. Frias et al., “Using dynamic contrast-enhanced MRI to quantitatively characterize maternal vascular organization in the primate placenta,” Magn. Reson. Med., vol. 73, no. 4, pp. 1570–1578, Apr. 2015. [CrossRef]
- V. H. J. Roberts et al., “Adverse Placental Perfusion and Pregnancy Outcomes in a New Nonhuman Primate Model of Gestational Protein Restriction,” Reprod. Sci. Thousand Oaks Calif, vol. 25, no. 1, pp. 110–119, Jan. 2018. [CrossRef]
- V. H. J. Roberts, J. E. Gaffney, T. K. Morgan, and A. E. Frias, “Placental adaptations in a nonhuman primate model of gestational protein restriction,” J. Dev. Orig. Health Dis., vol. 12, no. 6, pp. 908–914, Dec. 2021. [CrossRef]
- M. C. Schabel et al., “Functional imaging of the nonhuman primate Placenta with endogenous blood oxygen level–dependent contrast,” Magn. Reson. Med., vol. 76, no. 5, pp. 1551–1562, 2016. [CrossRef]
- J. L. Rosenkrantz, J. E. Gaffney, V. H. J. Roberts, L. Carbone, and S. L. Chavez, “Transcriptomic analysis of primate placentas and novel rhesus trophoblast cell lines informs investigations of human placentation,” BMC Biol., vol. 19, no. 1, p. 127, Jun. 2021. [CrossRef]
- F. King, “Ultrastructural differentiation of stromal and vascular components in early macaque placental villi,” Am. J. Anat., vol. 178, no. 1, pp. 30–44, Jan. 1987. [CrossRef]
- M. A. Sheridan et al., “Establishment and differentiation of long-term trophoblast organoid cultures from the human placenta,” Nat. Protoc., vol. 15, no. 10, pp. 3441–3463, Oct. 2020. [CrossRef]
- P. Wolf et al., “In vitro fertilization and embryo transfer in the rhesus monkey,” Biol. Reprod., vol. 41, no. 2, pp. 335–346, Aug. 1989. [CrossRef]
- P. Wolf, S. Thormahlen, C. Ramsey, R. R. Yeoman, J. Fanton, and S. Mitalipov, “Use of assisted reproductive technologies in the propagation of rhesus macaque offspring,” Biol. Reprod., vol. 71, no. 2, pp. 486–493, Aug. 2004. [CrossRef]
- V. H. J. Roberts, J. N. Castro, B. M. Wessel, D. F. Conrad, A. D. Lewis, and J. O. Lo, “Rhesus macaque fetal and placental growth demographics: A resource for laboratory animal researchers,” Am. J. Primatol., vol. 85, no. 8, p. e23526, 2023. [CrossRef]
- P. S. Aranda, D. M. LaJoie, and C. L. Jorcyk, “Bleach gel: a simple agarose gel for analyzing RNA quality,” Electrophoresis, vol. 33, no. 2, pp. 366–369, Jan. 2012. [CrossRef]
- “Protocol for qPCR analysis that corrects for cDNA amplification efficiency.” Accessed: Aug. 07, 2025. [Online]. Available: https://star-protocols.cell.com/protocols/1813.
- J. Schindelin et al., “Fiji: an open-source platform for biological-image analysis,” Nat. Methods, vol. 9, no. 7, pp. 676–682, Jun. 2012. [CrossRef]
- J. Zhou et al., “Development of apical out trophoblast stem cell derived organoids to model early human pregnancy,” iScience, vol. 28, no. 3, p. 112099, Mar. 2025. [CrossRef]
- L. (杨利恒) Yang, P. Liang, H. Yang, and C. B. Coyne, “Trophoblast organoids with physiological polarity model placental structure and function,” J. Cell Sci., vol. 137, no. 5, p. jcs261528, Sep. 2023. [CrossRef]
- Y.-T. Zeng, W.-F. Liu, P.-S. Zheng, and S. Li, “GDF15 deficiency hinders human trophoblast invasion to mediate pregnancy loss through downregulating Smad1/5 phosphorylation,” iScience, vol. 26, no. 10, p. 107902, Sep. 2023. [CrossRef]
- M. A. Sheridan et al., “Characterization of primary models of human trophoblast,” Development, vol. 148, no. 21, p. dev199749, Nov. 2021. [CrossRef]
- J. K. Schmidt et al., “Placenta-derived macaque trophoblast stem cells: differentiation to syncytiotrophoblasts and extravillous trophoblasts reveals phenotypic reprogramming,” Sci. Rep., vol. 10, no. 1, Art. no. 1, Nov. 2020. [CrossRef]
- R. Vento-Tormo et al., “Single-cell reconstruction of the early maternal–fetal interface in humans,” Nature, vol. 563, no. 7731, pp. 347–353, Nov. 2018. [CrossRef]
- A. Arutyunyan et al., “Spatial multiomics map of trophoblast development in early pregnancy,” Nature, vol. 616, no. 7955, Art. no. 7955, Apr. 2023. [CrossRef]
- Baczyk, A. Satkunaratnam, B. Nait-Oumesmar, B. Huppertz, J. C. Cross, and J. C. P. Kingdom, “Complex patterns of GCM1 mRNA and protein in villous and extravillous trophoblast cells of the human placenta,” Placenta, vol. 25, no. 6, pp. 553–559, Jul. 2004. [CrossRef]
- J. Schreiber et al., “Placental Failure in Mice Lacking the Mammalian Homolog of Glial Cells Missing, GCMa,” Mol. Cell. Biol., vol. 20, no. 7, pp. 2466–2474, Apr. 2000. [CrossRef]
- M. J. Jeyarajah et al., “The multifaceted role of GCM1 during trophoblast differentiation in the human placenta,” Proc. Natl. Acad. Sci. U. S. A., vol. 119, no. 49, p. e2203071119, Dec. 2022. [CrossRef]
- C. H. Damsky et al., “Integrin switching regulates normal trophoblast invasion,” Development, vol. 120, no. 12, pp. 3657–3666, Dec. 1994. [CrossRef]
- T. Hori et al., “Trophoblast stem cell-based organoid models of the human placental barrier,” Nat. Commun., vol. 15, no. 1, p. 962, Feb. 2024. [CrossRef]
- B. B. van Rijn, D. Van Opstal, van Koetsveld, Nicole, Knapen, Maarten, J. Gribnau, and O. J. Schaffers, “Generation of Trophoblast Organoids from Chorionic Villus Sampling,” Organoids, vol. 3, no. 1, pp. 54–66. [CrossRef]
- S. Matsumoto et al., “Establishment of macaque trophoblast stem cell lines derived from cynomolgus monkey blastocysts,” Sci. Rep., vol. 10, no. 1, p. 6827, Apr. 2020. [CrossRef]
- R. M. Karvas et al., “Stem-cell-derived trophoblast organoids model human placental development and susceptibility to emerging pathogens,” Cell Stem Cell, vol. 29, no. 5, pp. 810-825.e8, May 2022. [CrossRef]
Figure 1.
First trimester rhesus macaque fetus and placenta delivered by cesarean surgery at gestational days (a) G34 and (b) G50. Note the bi-discoid nonhuman primate placenta anatomy. Scale bar is shown in cm.
Figure 1.
First trimester rhesus macaque fetus and placenta delivered by cesarean surgery at gestational days (a) G34 and (b) G50. Note the bi-discoid nonhuman primate placenta anatomy. Scale bar is shown in cm.
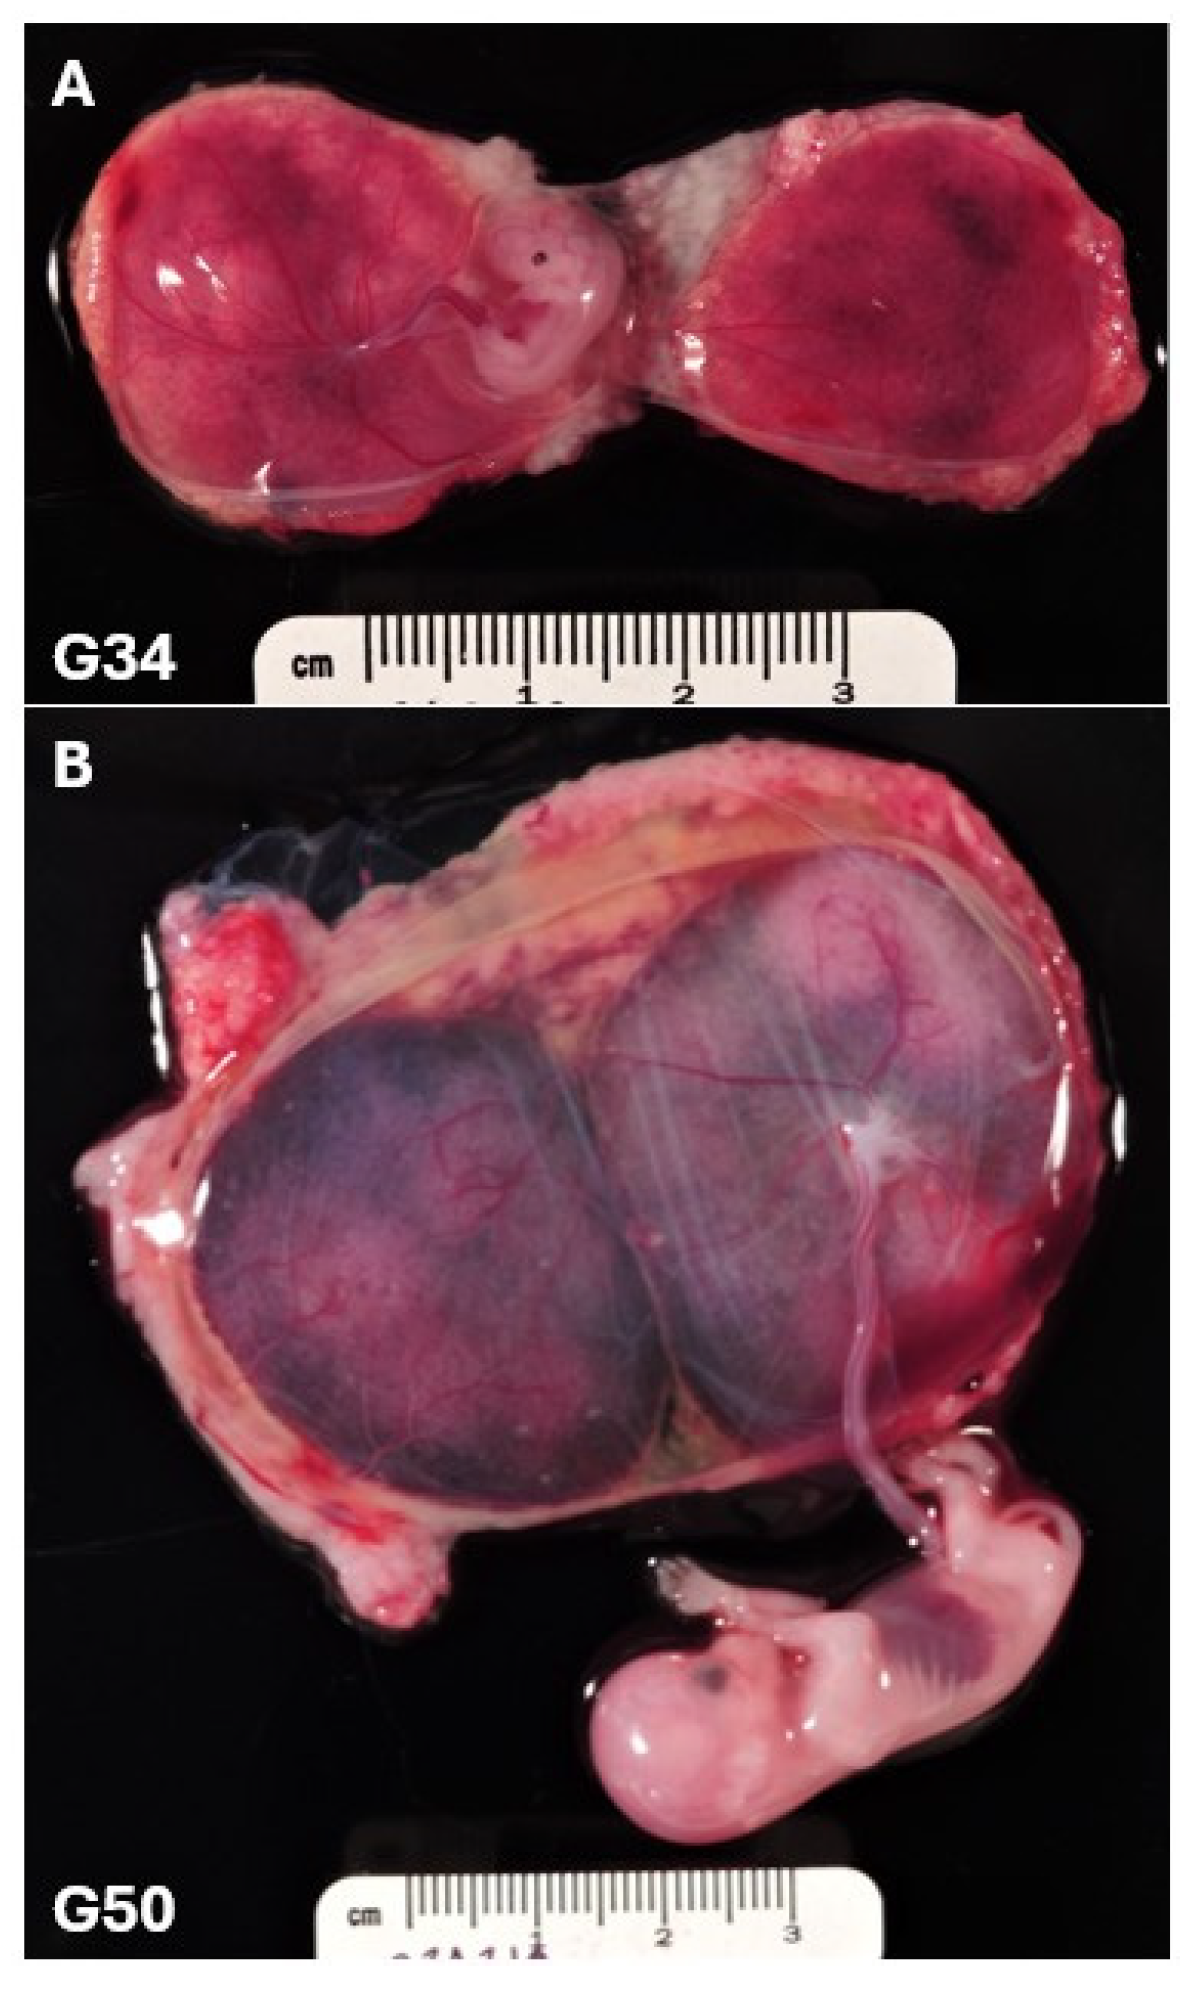
Figure 2.
Characterization of Rhesus Trophoblast Organoids grown in TOM a) Images of RTO6 P10 from day 3, 5, and 7 showing growth to passage-ready size. Scale bar denotes 150µm b) Whole-mount confocal images of G30 derived RTO16 P14D6. Spatial distribution of marker genes shown. A composite is shown first with all channels. Each gene is associated with its respective channel in the image moving from left to right. Scale indicated. c) Whole-mount confocal images of G50 derived RTO17 P9D6. Spatial distribution of marker genes is shown. Scale indicated. P: passage number; D: days in culture.
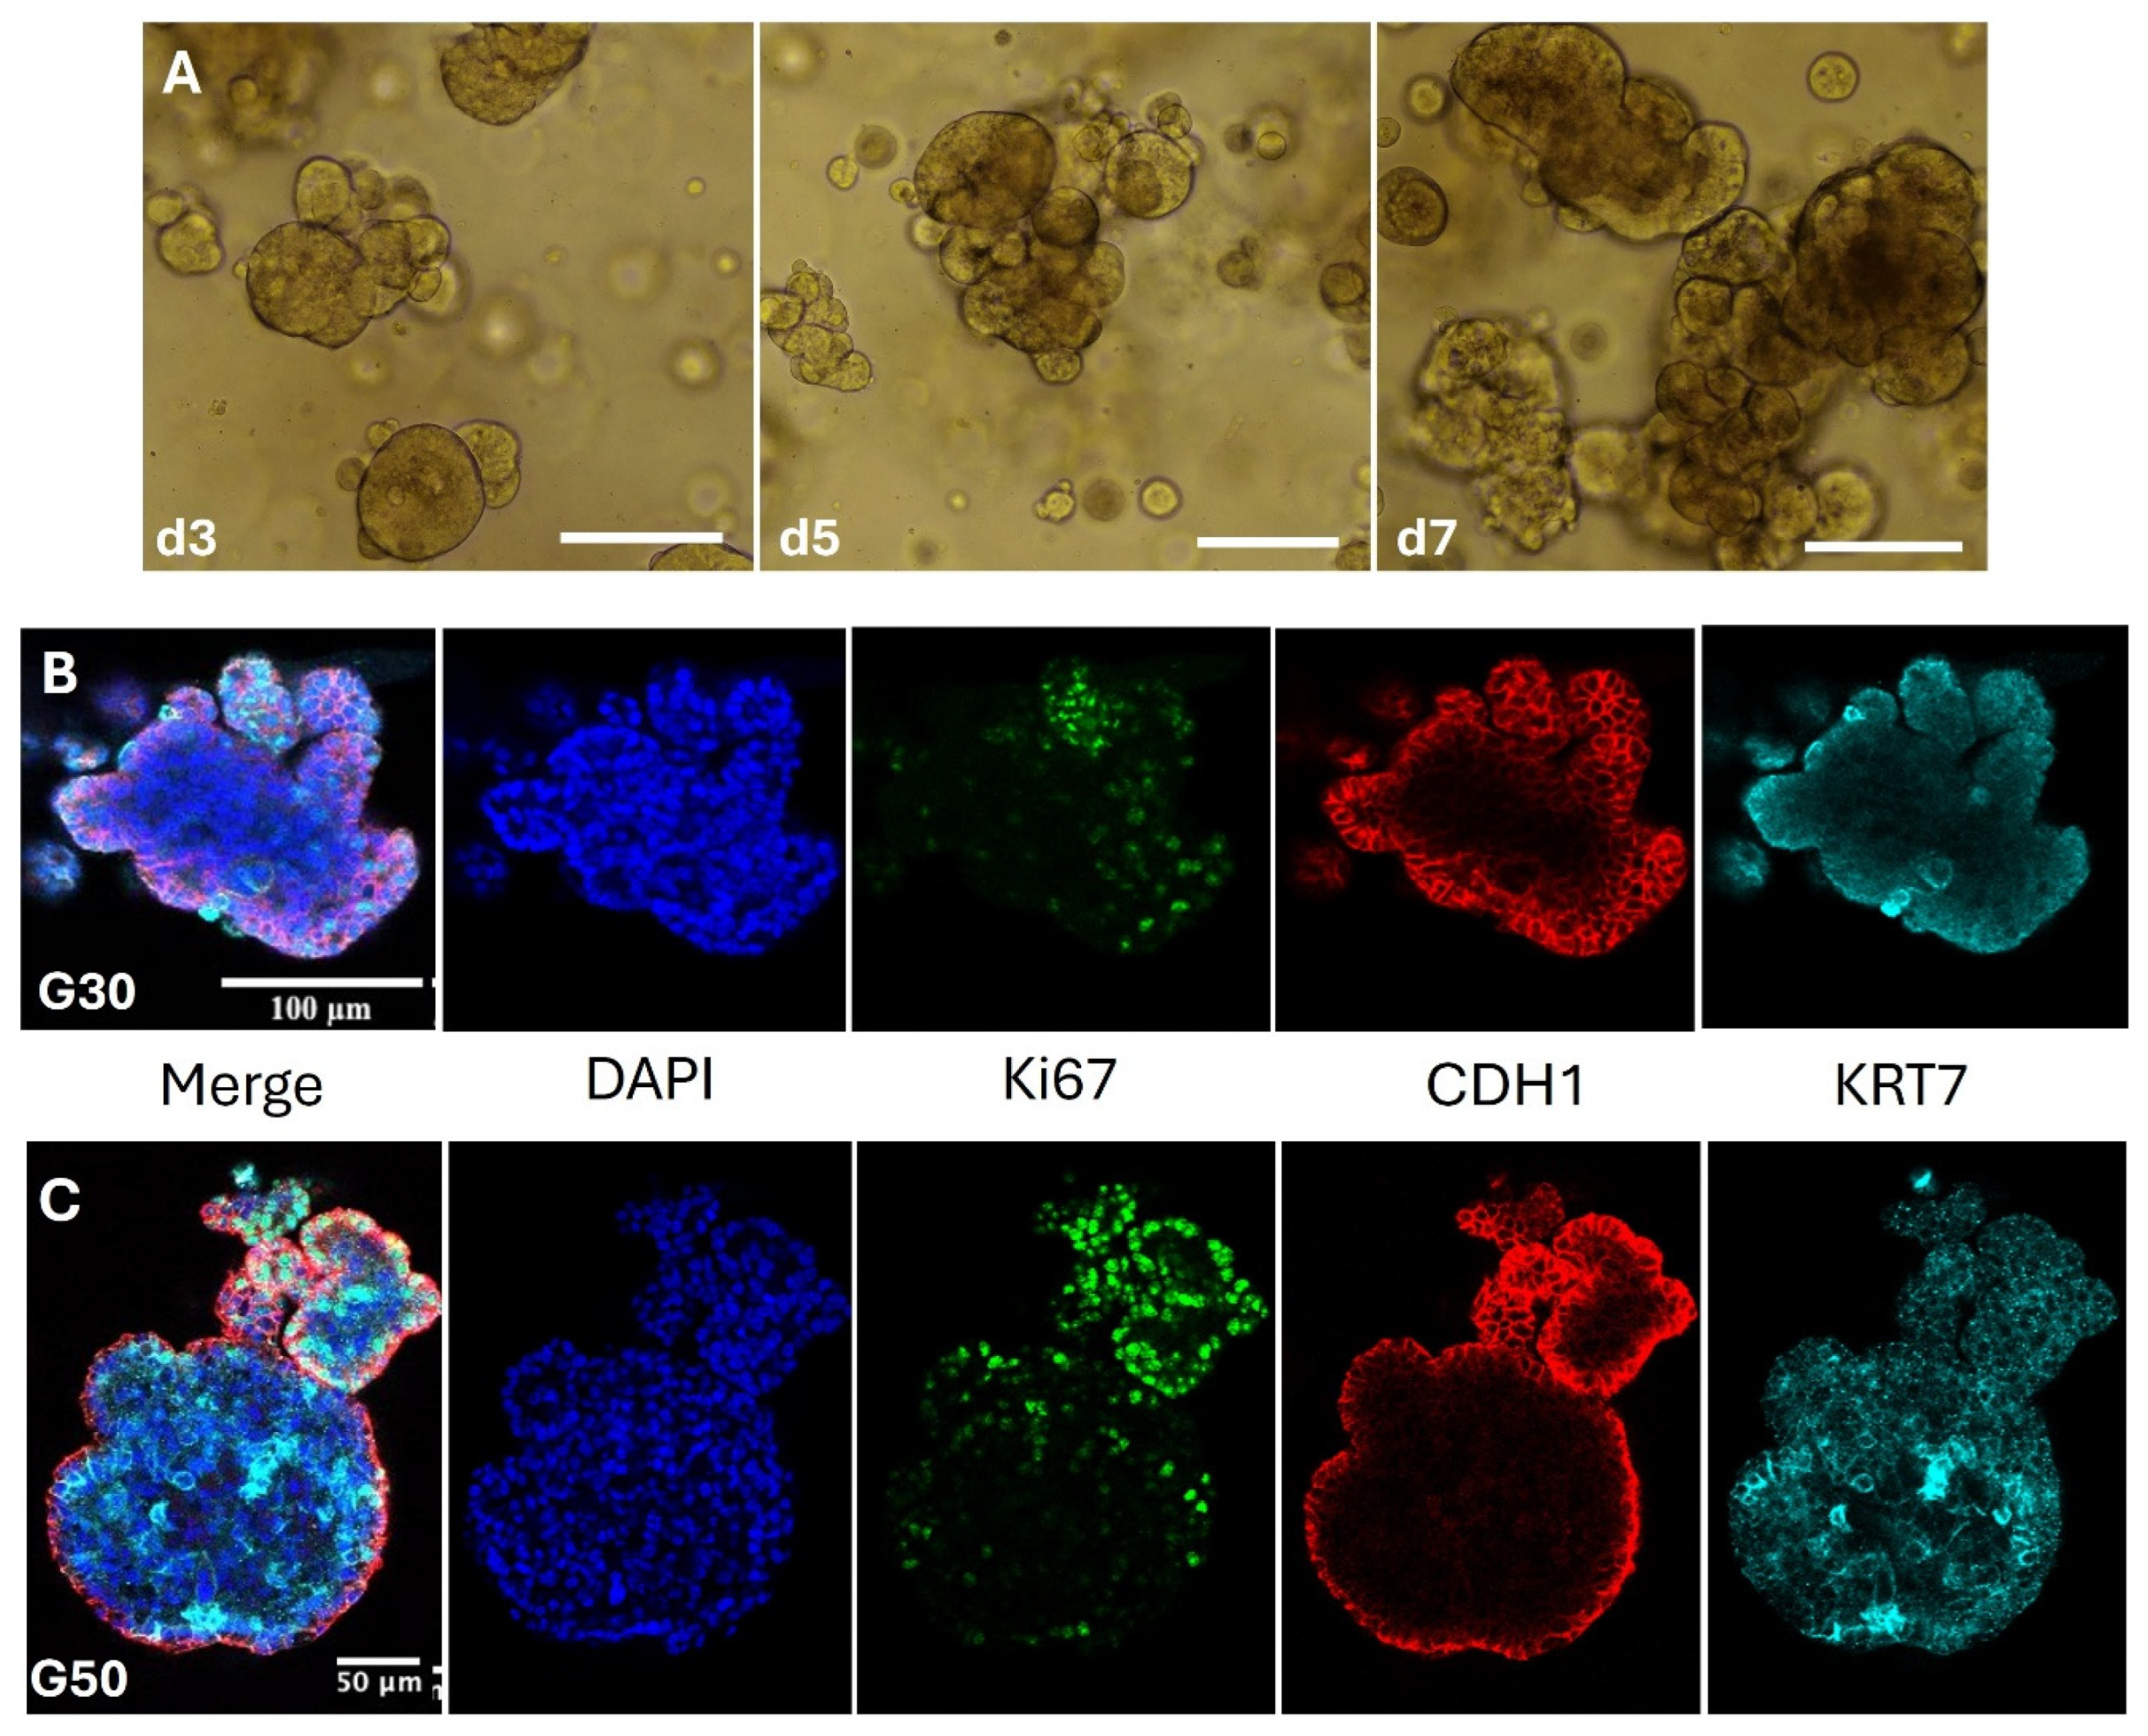
Figure 4.
Polarity Manipulation in Trophoblast Organoids A) Brightfield image of U-bottom well trophoblast organoid, RTO25 P12D12. B) FFPE- generated immunofluorescence of U-bottom well organoids, RTO25 P12D12. DAPI in blue, KI67 in green, CDH1 in red, and SDC1 in cyan. C) FFPE immunofluorescence of U-bottom well organoid, demonstrating growth of syncytiotrophoblast layer on the outside of the organoid (arrow). D) FFPE immunofluorescence of control Geltrex embedded organoids, demonstrating fewer SYN structures and inverse polarity.
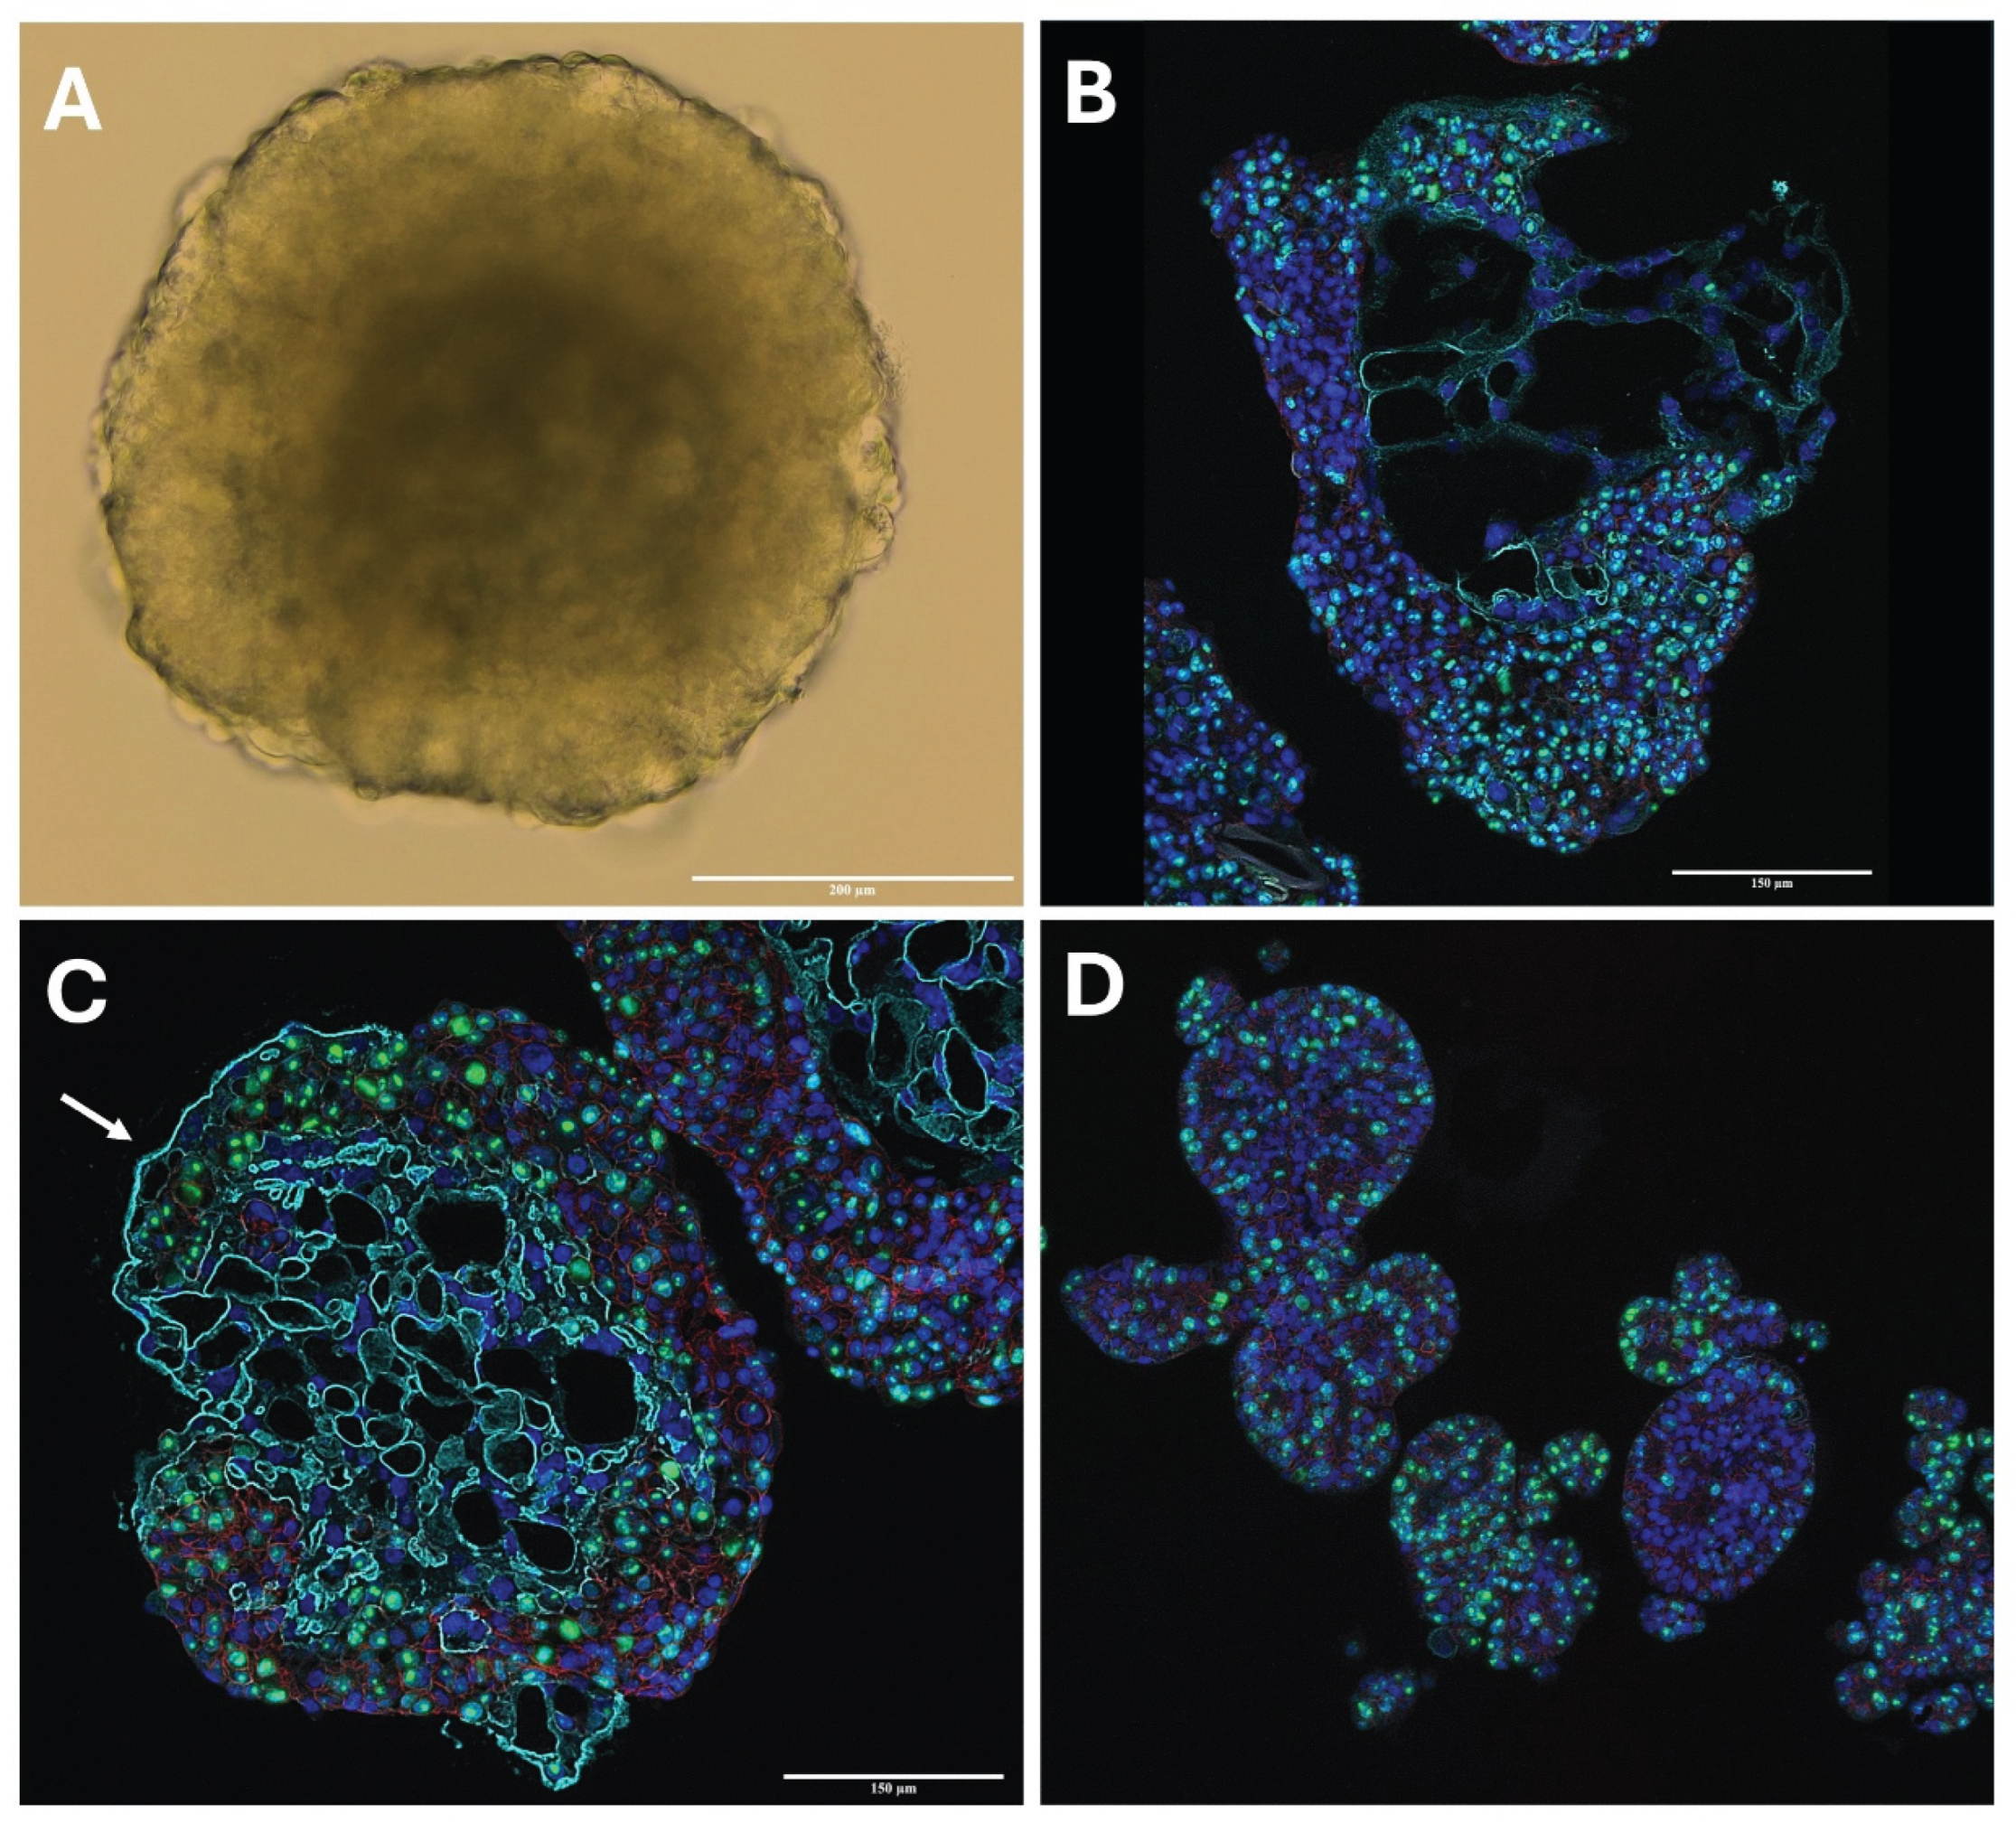
Table 1.
Trophoblast organoid isolation and cryopreservation buffer compositions.
| Buffer Name | Reagents | Manufacturer & Catalog Number |
|---|---|---|
| Wash Buffer #1 (WB #1) | 500ml PBS, 5ml 100X Pen/Strep |
Gibco 10010023 Gibco 15140148 |
| Wash Buffer #2 (WB #2) | 500ml Ham F12, 5ml 100X Pen/Strep |
Gibco 11765054 Gibco 15140148 |
| Red Blood Cell Lysis Buffer | 10X RBC lysis buffer, sterile ddH2O | Biolegend 420301 |
| Digest Buffer | 60ml 0.25% Trypsin-EDTA, 15ml PBS |
Gibco 25200056 Gibco 15140148 |
| Digest Stop Buffer | 80ml WB #2, 20ml FBS |
Gibco A5670701 |
| Collagenase V Buffer | 13.5ml Ham F12, 1.5mL FBS, 15mg collagenase V |
Gibco 11765054 Gibco A5670701 Sigma-Aldrich C9263 |
| Freeze Buffer #1 | 200µl FBS, 300µl TOM | Gibco A5256701 |
| Freeze Buffer #2 | 100µl DMSO, 400µl TOM | Fisher Scientific D128-1 |
Table 2.
Trophoblast organoid media (TOM) components and reagents per 20 mL total media volume.
| Media Component | Volume | Stock Concentration |
Final Concentration |
Manufacturer / Catalog Number |
|---|---|---|---|---|
| Advanced DMEM/F-12 | 18.5mL | N/A | N/A | ThermoFisher 12634028 |
| N-2 Supplement | 200µl | 100X | 1X | Fisher Scientific A1370701 |
| B-27 Supplement | 400µl | 50X | 1X | Fisher Scientific 17504044 |
| L-Glutamine | 200µl | 200mM | 2mM | Fisher Scientific 25-030-149 |
| Antibiotic/Antimycotic | 200µl | 100X | 1X | Fisher Scientific 15-240-096 |
| NALC | 200µl | 125mM | 1.25mM | Millipore Sigma A9165-5G |
| A83-01 | 2µl | 5mM | 500nM | Millipore Sigma SML0788-5MG |
| CHIR99021 | 6.98µl | 4.3mM | 1.5µM | Millipore Sigma SML1046-5MG |
| EGF | 10µl | 0.1 µg/µl | 50 ng/mL | ThermoFisher AF-100-15-500UG |
| FGF2 | 200µl | 0.01 µg/µl | 100 ng/mL | ThermoFisher 100-18B-50UG |
| HGF | 100µl | 0.01 µg/µl | 50 ng/mL | ThermoFisher 100-39H-25UG |
| R-Spondin 1 | 20µl | 0.08 µg/µl | 80 ng/mL | ThermoFisher 120-38-20UG |
| Prostaglandin E2 | 20µl | 2.5 mM | 2.5µM | Cayman Chemical NC1775238 |
| Y-2 | 8µl for initial isolation 20µl for maintenance |
5 mM | 2.5µM initial 5µM maintenance |
STEMCELL Technologies 72304 |
Table 4.
Primary and secondary antibodies for immunostaining.
| Antigen/Clone # (if applicable) |
Cell Marker | Dilution | Host Species |
Manufacturer & Catalog Number |
|---|---|---|---|---|
| SDC1/Polyclonal | SYN | 1:500-1000 | Rabbit | Proteintech, 10593-1-AP |
| CDH1/ 6B11F11 | CTB | 1:400-800 | Mouse | Proteintech, 60335-1-Ig |
| KI67/ B56 | CTB | 1:500 | Mouse | BD Biosciences, 550609 |
| KRT7/ D1E4 | Pan-Trophoblast | 1:500-1000 | Rabbit | Cell Signaling Technologies, 4465 |
| Phalloidin | Actin | 1:10,000 | N/A | ThermoFisher R415 |
| DAPI | Nuclei | 1ug/ml | N/A | Thermo Fisher D3571 |
| Anti-Mouse IgG1 CF488 | N/A | 1:1000 | Goat | Biotium, 20246 |
| Anti-Mouse IgG2b CF564 | N/A | 1:1000 | Goat | Biotium, 20268 |
| Anti-Rabbit IgG Coralite 488 | N/A | 1:1000 | Goat | Proteintech, SA00013-2 |
| Anti-Rabbit IgG CF637 | N/A | 1:1000 | Goat | Biotium, 20122 |
Disclaimer/Publisher’s Note: The statements, opinions and data contained in all publications are solely those of the individual author(s) and contributor(s) and not of MDPI and/or the editor(s). MDPI and/or the editor(s) disclaim responsibility for any injury to people or property resulting from any ideas, methods, instructions or products referred to in the content. |
© 2025 by the authors. Licensee MDPI, Basel, Switzerland. This article is an open access article distributed under the terms and conditions of the Creative Commons Attribution (CC BY) license (http://creativecommons.org/licenses/by/4.0/).
Copyright: This open access article is published under a Creative Commons CC BY 4.0 license, which permit the free download, distribution, and reuse, provided that the author and preprint are cited in any reuse.


