
Submitted:
18 August 2025
Posted:
19 August 2025
You are already at the latest version
Abstract
Sepsis causes profound microcirculatory dysfunction, where heterogeneous capillary perfusion and abnormal vasomotion contribute to tissue hypoxia and organ failure. Sublingual videomicroscopy is established in large animals and humans to monitor these alterations, but this approach has not been applied in murine models. We developed a method to assess sublingual perfusion and vasomotion in mice using sidestream dark field (SDF) videomicroscopy. Male C57BL/6 mice were anesthetized, and sublingual vessels were imaged for 90 minutes. Perfusion and vasomotion parameters were assessed, and a Fast Fourier Transform was performed on vasomotion data to characterize the frequency components of rhythmic microvessel diameter changes. Another group of animals was administered lipopolysaccharide (LPS) intraperitoneally as a model of systemic inflammation in sepsis. LPS-treated mice exhibited a significant decline in the proportion of perfused vessels at 90 minutes and in the microvascular flow index. Very low-frequency vasomotion (0.005–0.15 Hz) declined in controls but was preserved during endotoxemia, suggesting an active microvascular tone response to inflammatory stress. This study establishes the first murine protocol for sublingual SDF imaging, allowing early detection of perfusion deficits and vasomotor changes in experimental sepsis. The minimal-invasive approach offers a translational platform for mechanistic and therapeutic studies in sepsis.
Keywords:
microcirculation
; sublingual vessels
; vasomotion
; mice
; sidestream dark field imaging
1. Introduction
Sepsis results from a dysregulated host response to infection, combining excessive inflammation with immune suppression that ultimately drives cellular dysfunction and organ failure [1]. Central to this process is the microcirculation, where injury both originates and propagates [2]. Under normal conditions, microvascular perfusion is regulated by neuroendocrine, paracrine, and mechanosensory pathways that match local oxygen delivery to metabolic demand [3].
In sepsis, these regulatory mechanisms fail as the inflammatory cascade and oxidative stress induce profound endothelial dysfunction [4]. Capillary density decreases and perfusion becomes heterogeneous, with intermittent or absent flow creating hypoxic zones and impairing tissue oxygenation even when total organ blood flow appears normal [5]. This heterogeneity compromises oxygen delivery more severely than uniform hypoperfusion and actively drives organ dysfunction rather than merely reflecting disease severity [6,7].
An important component of this regulation is vasomotion, defined as the rhythmic contraction and relaxation of small vessels that modulate blood flow and play a central role in tissue perfusion and oxygen delivery [8,9,10]. Hemodynamic oscillations resulting from vascular tone variations have been proposed as a tool to evaluate microcirculatory function [11,12,13]. Frequency analysis separates these oscillations into distinct bands linked to specific physiological mechanisms, including cardiac and respiratory activity, myogenic tone, neurogenic input, and endothelial-dependent regulation [14]. In rodent sepsis models, intravital videomicroscopy studies have demonstrated that early microcirculatory impairment is accompanied by enhanced low frequency vasomotion, reflecting dysregulated local vascular control [11,13].
Clinical studies using bedside sublingual videomicroscopy, employing orthogonal polarization spectral (OPS), sidestream dark field (SDF), and incident dark field (IDF) handheld devices, have consistently linked sepsis-induced microvascular alterations to patient outcomes [15,16,17,18]. Rapid recovery of microcirculatory function occurs in survivors of septic shock, while persistent microvascular alterations, independent of systemic hemodynamics, are strongly associated with multiple organ failure and poor outcomes [19,20]. Importantly, changes in capillary perfusion often precede abnormalities in vital signs or laboratory results, highlighting sublingual microcirculation as a sensitive early marker of systemic dysfunction [21]. Consequently, improving microcirculation through infection control, fluid resuscitation, and vasoactive support remains a mainstay of sepsis therapy [1,4].
In preclinical research, various in vivo techniques exist to assess microcirculation, each with distinct advantages and limitations depending on the experimental goals. In larger animal models such as pigs [22,23], rats [24,25], sheep [26,27,28], and rabbits [29,30,31,32], handheld videomicroscopy devices, the same technology used at the bedside in septic patients, are well established in sepsis research. These methods offer key benefits: they require no vascular catheterization or dye injection, enable rapid and straightforward setup, and provide high translational value due to their clinical applicability [33,34,35].
By contrast, murine models predominantly rely on intravital microscopy (IVM), which allows high-resolution imaging of well-vascularized tissues such as the mesentery [36] or exposed muscle [37] over short durations in anesthetized animals. IVM facilitates detailed visualization of blood flow, leukocyte–endothelial interactions, vascular permeability, and molecular dynamics using fluorescent dyes or transgenic reporter mice [33]. It also enables quantitative assessment of perfusion and flow velocity beyond surface vessels [38]. However, IVM’s invasive nature, requiring surgical exteriorization of organs or muscle, introduces mechanical stress that can disrupt physiological conditions and compromise translational relevance [39,40]. Moreover, IVM is technically demanding, costly, and less reflective of clinical monitoring practices [41].
Given these challenges, our choice of SDF imaging in this study is strategically motivated. SDF provides a non-invasive, rapid, and reproducible method that avoids surgical manipulation, thereby better preserving physiological conditions [33,34,35]. Crucially, SDF utilizes clinically established technology [33], creating a direct translational bridge that enhances the relevance of our findings to human sepsis. Additionally, SDF allows the measurement of blood flow in microvessels for perfusion assessment and the detection of diameter oscillations for vasomotion evaluation [42,43]. This combination of practicality, physiological fidelity, and clinical applicability makes SDF the optimal approach for our preclinical investigation.
Despite its translational importance, sublingual microcirculation assessment has not yet been performed in mice. While mice are prized for their low cost, genetic tractability, and wide availability [44,45], the small size of the mouse tongue and technical challenges in stabilizing it for precise imaging have hindered adoption of this approach. To overcome these challenges, we developed a minimally invasive method to evaluate systemic microcirculatory changes via the sublingual vascular bed using a lipopolysaccharide (LPS)-induced endotoxemia mouse model, one of the most widely used preclinical models of sepsis [46]. This method enabled the assessment of both perfusion and vasomotion parameters under inflammatory stress, while minimizing experimental artifacts, reducing animal burden, and enhancing the translational relevance of murine microcirculatory research.
2. Materials and Methods
2.1. Animals
All experimental procedures adhered to Canadian Council for Animal Care Guidelines and were approved by the Dalhousie University Committee on Laboratory Animals. Six male C57BL/6 mice (25–30 g; 6–8 weeks old) were housed in the Carlton Animal Care Facility at Dalhousie University’s Faculty of Medicine. Animals had ad libitum access to water and rodent chow and were maintained under standard 12-hour light/dark cycles.
2.2. Mouse Preparation for In Vivo Imaging
General anesthesia was induced using 3.5% isoflurane in an induction chamber. Once anesthetized, the mouse was positioned on a heating pad to maintain a stable body core temperature of 37.5 °C, continuously monitored via a rectal probe. The limbs were secured to the pad using tape. Anesthesia was maintained throughout the experiment with 2% isoflurane delivered via a nose cone.
The study included two experimental groups: a control group (n = 3) composed of healthy animals with no intervention, and an endotoxemia group (n = 3) that received an intraperitoneal injection of lipopolysaccharide (LPS) (5mg/kg; Escherichia coli, serotype O26:B6, potency 3.000.000 EU/mg, Sigma-Aldrich, Oakville, ON, Canada) following anesthesia induction.
The lower surface of the tongue was prepared for microscopic imaging (Figure 1). To facilitate sublingual access and optimize camera alignment, the lower incisors were trimmed at the base using surgical scissors. The tongue was carefully extended with tweezers and secured to a holding plate using a 5-0 polyester suture placed approximately 2 mm from the apex. The suture thread was then taped to a plate positioned cranially to the mouse, orienting the lower surface of the tongue upward for imaging. Special care was taken to avoid excessive tension or pressure and to preserve physiological blood flow. To maintain tissue hydration, ophthalmic gel was applied to the tongue mucosa prior to coupling with the imaging device.
2.3. Setup and Image Acquisition
Live imaging of sublingual microcirculation was performed using side-stream dark-field (SDF) videomicroscopy (MicroScan, MicroVision Medical, Amsterdam, The Netherlands). This system features miniature microscope optics surrounded by light-emitting diodes (LEDs) that emit stroboscopic green light at a wavelength of 530 nm, which is selectively absorbed by hemoglobin in red blood cells while being transmitted through the surrounding tissue, thereby generating intrinsic contrast [47]. This allows for real-time visualization of the sublingual microcirculation and blood flow without the need for fluorescent dyes or exogenous contrast agents.
A modified, adjustable stereotaxic holder was used to mount the SDF probe, allowing precise positioning and mechanical stability when the probe was brought into contact with the lower surface of the tongue. During recordings, illumination and focus were continuously optimized under low ambient light to ensure high-quality visualization.
Control animals were recorded continuously for 90 minutes. In the LPS group, animals were recorded for 5 minutes to establish a baseline prior to LPS injection, followed by continuous recording for an additional 90 minutes post-injection.
Video output was displayed on a monitor and simultaneously routed through a FireWire signal converter (IEEE 1394) to a Windows computer, allowing direct digital recording in WinDV (http://windv.mourek.cz/, Czech Republic) of the images as AVI files on the hard drive for subsequent offline analysis.
2.4. Image Analysis
Microcirculatory images were analyzed for perfusion using AVA 3.0 (Automated Vascular Analysis, Academic Medical Center, University of Amsterdam, The Netherlands). Following perfusion assessment, vasomotion was analyzed to capture rhythmic microvessel diameter changes, which are known to be altered in early sepsis [11,13,48]. Vasomotion analysis was performed using FIJI (version 1.54p) [49] with the VasoMetrics plugin [50].
For perfusion analysis using AVA 3.0, 3 second segments were selected per animal. In control animals, recordings were analyzed at the beginning, at 45 minutes, and at 90 minutes. In LPS-injected animals, segments were analyzed prior to injection (baseline), at 45 minutes, and at 90 minutes, post-injection.
The parameters selected to analyze perfusion in AVA 3.0 software included total vessel density (TVD), the proportion of perfused vessels (PPV), and the microvascular flow index (MFI). Blood flow in each small vessel was characterized into four categories: (0) absent, (1) intermittent (flow absent ≥50% of the time), (2) sluggish, and (3) continuous [51]. TVD accounted for all visible vessels, independent of flow characteristics. PPV reflected vessels exhibiting either continuous or sluggish flow. The MFI was calculated by dividing each image into four quadrants, identifying the predominant flow type within each (continuous, sluggish, intermittent, or absent), and then averaging the flow scores across all quadrants. All perfusion analyses were performed by a single investigator.
For vasomotion assessment using the VasoMetrics plugin in FIJI, a midline was first drawn along a selected vessel segment. The plugin then automatically generated perpendicular cross-lines and measured the distance between vessel walls at each point. Vessel diameter was recorded for every video frame, and the resulting data were exported to an Excel spreadsheet. This produced a detailed time series of diameter fluctuations, capturing vasomotion dynamics across experimental conditions.
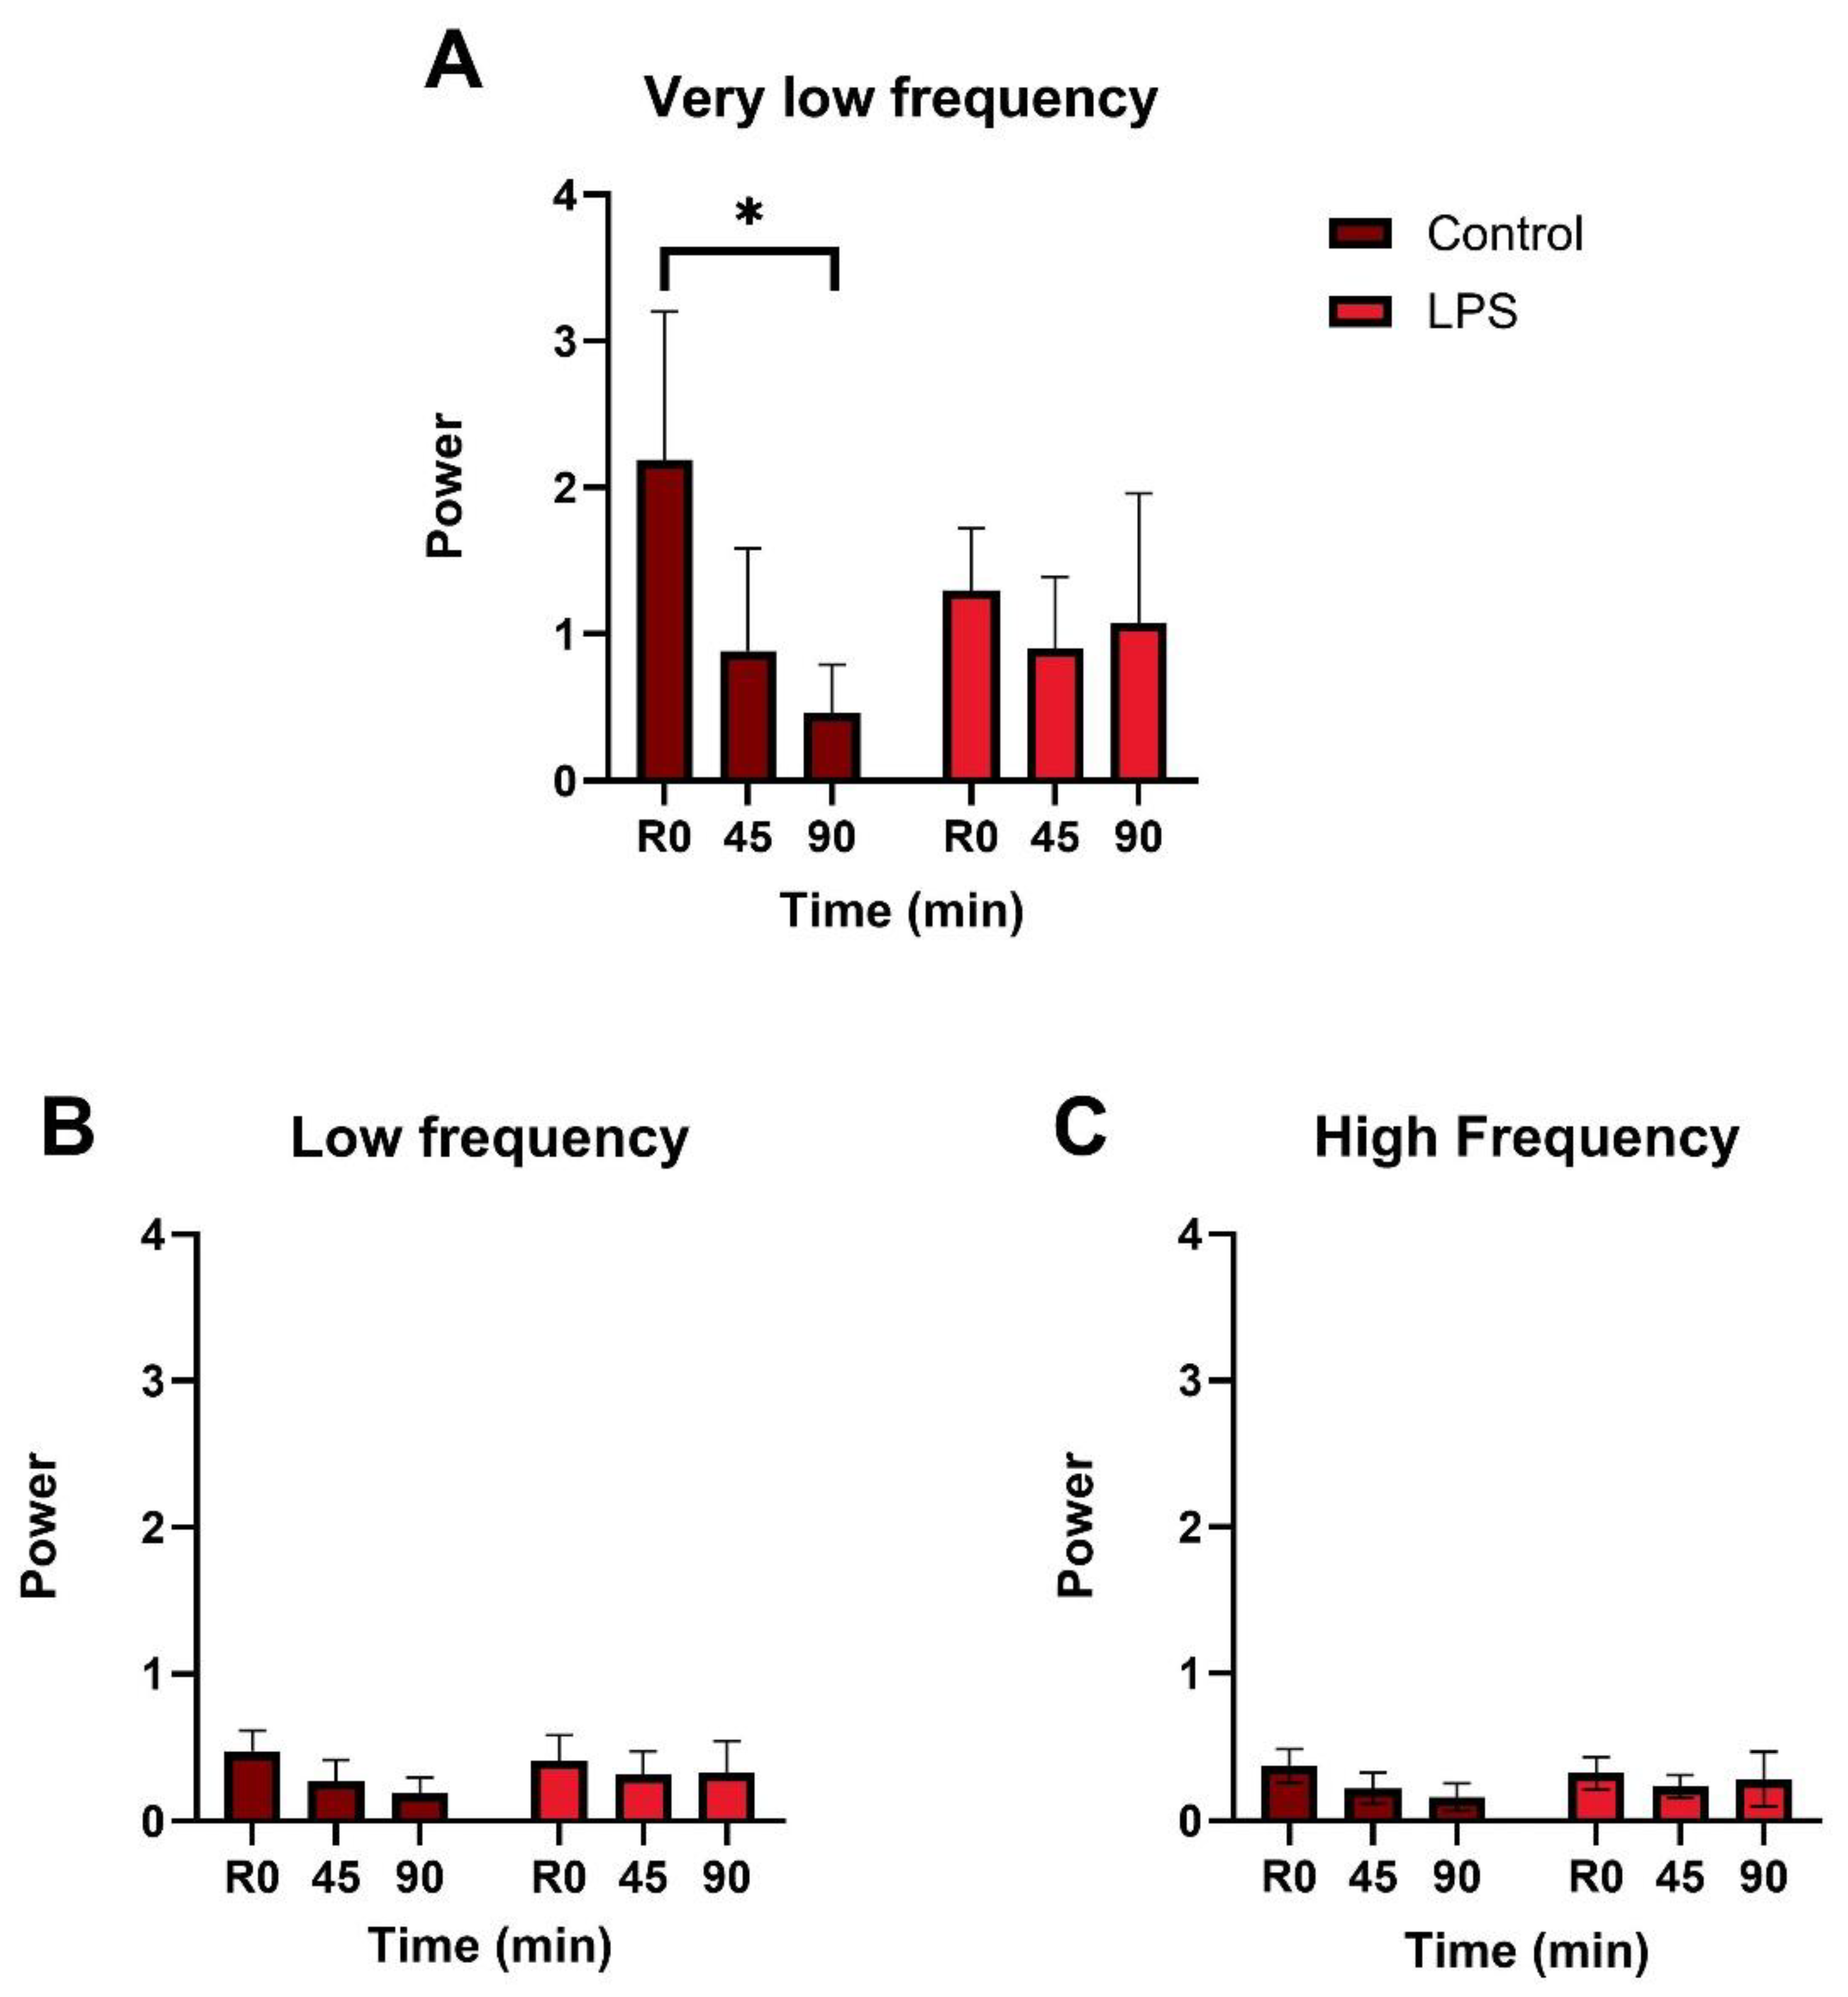
To analyze the frequency characteristics of vessel diameter oscillations, Fast Fourier Transform (FFT) was performed using Python (Supplementary Script S1). At each time point (baseline, 45 minutes, and 90 minutes), 5-minute recordings were processed with the VasoMetrics plugin to extract time-series vessel diameter data. These data were imported into Python and transformed into the frequency domain via FFT. For each frequency band, the mean spectral magnitude of oscillations was calculated from the modulus of the FFT coefficients. In line with previous vasomotion literature [12,14], these values will hereafter be referred to as spectral power, although they represent spectral magnitude rather than true power (squared magnitude). This approach enabled visualization of vasomotion across frequency bands associated with distinct physiological mechanisms in mice: very low frequency (VLF; 0.005–0.15 Hz), linked to endothelial, sympathetic, and myogenic activity; low frequency (LF; 0.15–2 Hz), related to respiratory influences; and high frequency (HF; 2–8 Hz), corresponding to cardiac activity [52].
2.5. Statistics
Normality of the data was assessed using the Shapiro-Wilk test and confirmed for TVD and vasomotion power. Comparisons of vasomotion power and TVD between the control and LPS-injected groups were performed using one-tailed unpaired t-tests with Welch’s correction. As MFI and PPV did not follow a normal distribution, group comparisons at each time point were conducted using the non-parametric Mann-Whitney test. Statistical significance was set at p ≤ 0.05. All statistical analyses and graph generation were performed using GraphPad Prism version 10.3.1 (GraphPad Software Inc., MA, USA).
3. Results
3.1. Microcirculatory Perfusion
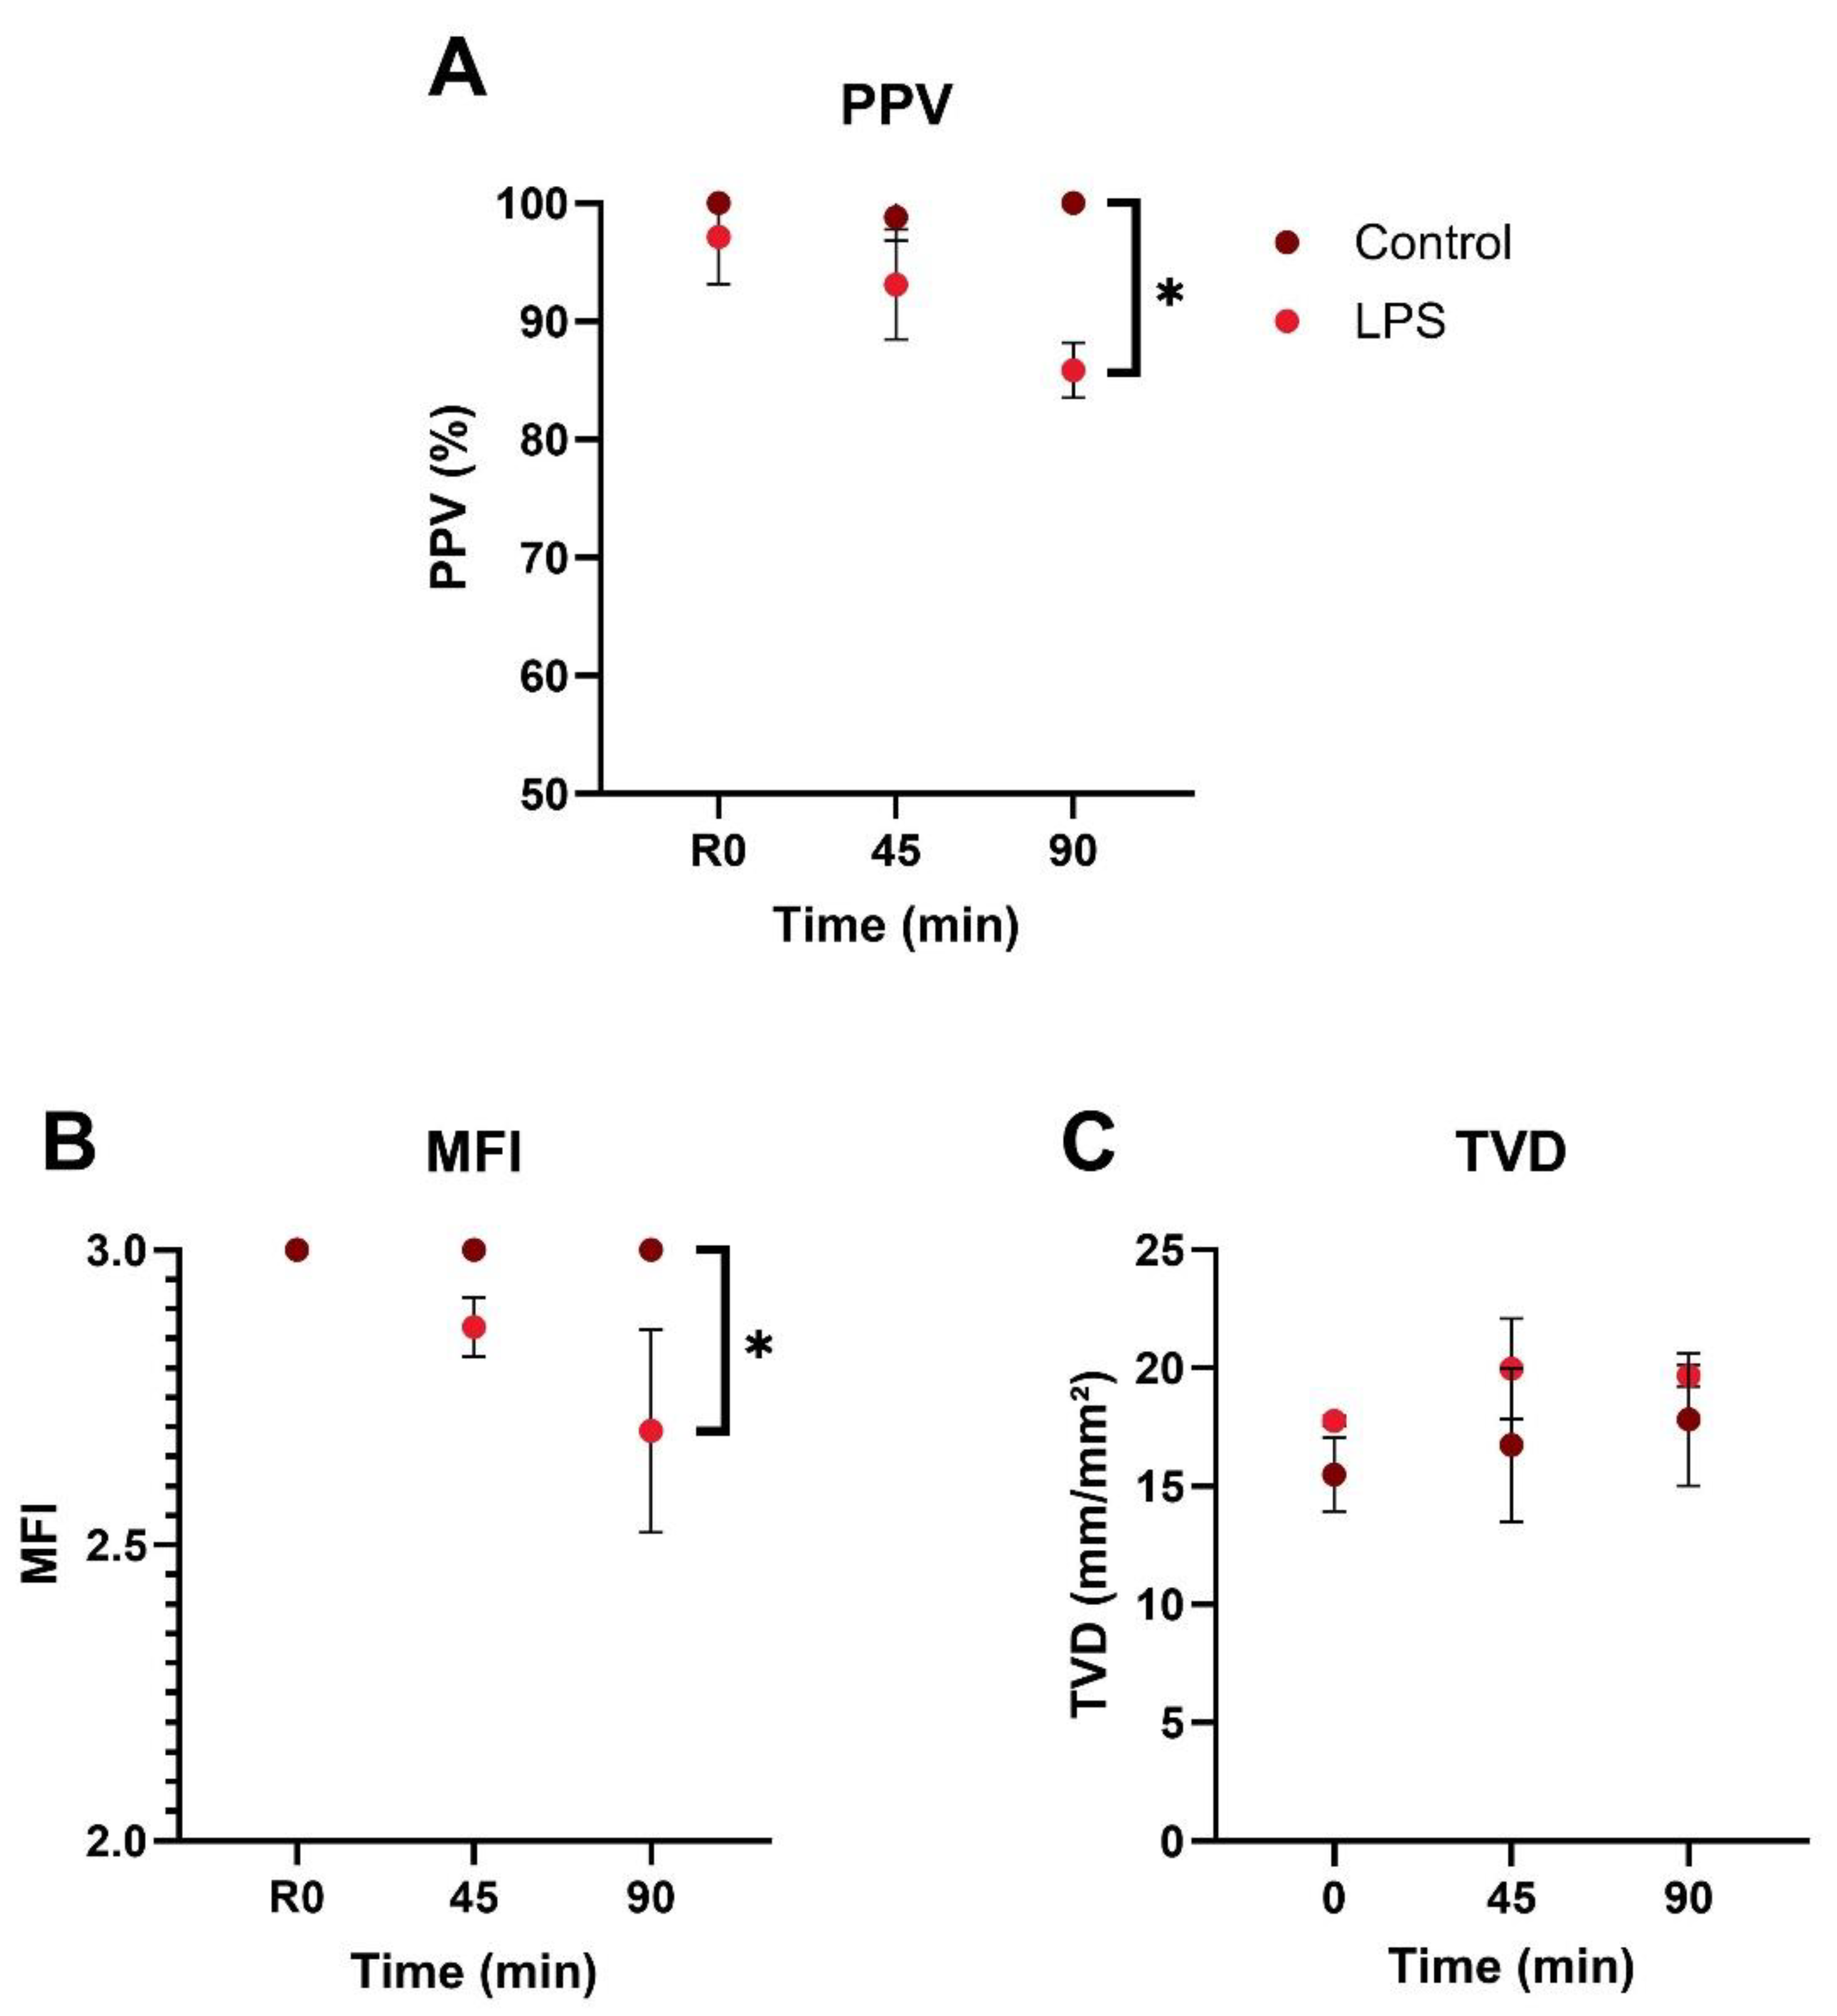
Throughout the 90-minute observation period, PPV in the control group remained close to 100%, whereas LPS-injected animals exhibited a decline beginning at 45 minutes, reaching a mean of 85.8% at 90 minutes (Figure 2A). At 90 minutes post-injection, the LPS group showed a significantly lower PPV compared to controls (p = 0.0045), while the difference at 45 minutes was not statistically significant (p = 0.0772). Supplementary Videos S1 and S2 show sublingual microcirculation recordings at baseline and 90 minutes after LPS injection, respectively.
The MFI in control animals remained constant at the maximum score of 3.0 throughout the 90-minute observation period, indicating continuous blood flow in all four quadrants (Figure 2B). In contrast, LPS-injected animals exhibited a significant decline in MFI, reaching a mean of 2.69 ± 0.17 at 90 minutes (p = 0.0500).
TVD values remained comparable between groups throughout the 90-minute observation period, with no significant differences at baseline (p = 0.0626), 45 minutes (p = 0.1171), or 90 minutes (p = 0.1839) (Figure 2C).
3.2. Vasomotion
In the control group, vasomotion power in the very low frequency band progressively declined, reaching less than half of its initial value by the end of the 90-minute observation period and showing a significant difference from baseline (p = 0.0426) (Figure 3A). In contrast, in the LPS group, vasomotion power in this band remained consistently close to baseline throughout the experiment, with no significant difference between baseline and 90 minutes. For the other frequency bands, vasomotion power at 90 minutes was comparable between groups in both the low frequency (p = 0.1974; Figure 3B) and high frequency (p = 0.1956; Figure 3C) bands.
Figure 3.
Average spectral power of vasomotion per frequency band. (A) Very low frequency: 0.005–0.15 Hz. (B) Low frequency: 0.15 – 2 Hz. (C) High frequency: 2 - 8Hz. LPS – lipopolysaccharide. * Indicates p ≤ 0.05.
Figure 3.
Average spectral power of vasomotion per frequency band. (A) Very low frequency: 0.005–0.15 Hz. (B) Low frequency: 0.15 – 2 Hz. (C) High frequency: 2 - 8Hz. LPS – lipopolysaccharide. * Indicates p ≤ 0.05.
4. Discussion
In this study, we evaluated the utility of a minimally invasive SDF videomicroscopy technique targeting sublingual vessels to detect early microcirculatory alterations in murine endotoxemia as an experimental model of sepsis. Our results offer valuable insights into how perfusion and vasomotion are affected during systemic inflammation.
Significant perfusion changes were observed in the LPS group compared to controls by 90 minutes post-injection, with the proportion of PPV beginning to decline at 45 minutes and reaching a mean of 85.8%, consistent with findings from both clinical [20,53] and experimental studies [30,54,55]. A decrease in MFI was also observed in the LPS group, in contrast to the preserved flow seen in controls. The absence of significant changes in TVD over the 90-minute period is consistent with studies showing that reductions in vascular density often require longer durations to become evident, typically around 4 hours after sepsis induction [56].
Microcirculatory perfusion impairment is an early hallmark of sepsis and has been closely linked to organ failure [21]. This dysfunction frequently precedes detectable changes in systemic hemodynamics and is characterized by the coexistence of well-perfused and poorly perfused capillaries in close proximity, a phenomenon known as perfusion heterogeneity [57]. Mechanistically, microcirculatory dysfunction in the early stages of sepsis arises from a combination of nitric oxide (NO) dysregulation, impaired intercellular signaling, and disrupted interactions among circulating blood components [21,57]. The endotoxemia model used in this study effectively reproduces key early pathophysiological events underlying microcirculatory disturbances driven by an exaggerated inflammatory response [58,59,60]. Upon binding to Toll-like receptor 4 (TLR4), endotoxin activates signaling pathways leading to the release of proinflammatory mediators such as NF-κB, IL-2, and TNF-α, initiating a cascade that destabilizes vascular homeostasis [58,61].
One of the earliest consequences is dysregulated NO production [62]. Excessive NO synthesis via inducible nitric oxide synthase (iNOS) results in loss of vascular tone, with heterogeneous vasodilation promoting inappropriate shunting of blood away from hypoxic tissues [63,64]. Concurrently, endothelial cells lose their ability to regulate arteriolar smooth muscle tone, while the smooth muscle cells themselves become less responsive to adrenergic stimulation and lose contractile control [65,66,67]. Red blood cells also fail to perform their adaptive role in oxygen sensing and vasodilation, becoming less deformable and more adhesive, further compromising capillary perfusion [21,68,69]. Collectively, these mechanisms account for the early microcirculatory alterations induced by LPS [66,70], aligning with the timeframe investigated in this study and explaining the observed reductions in PPV and MFI.
In later stages of sepsis, sustained inflammation promotes leukocyte and platelet activation, microthrombosis, and capillary plugging [13,57]. However, these processes do not fully account for the early-phase microcirculatory impairment, which appears to be primarily driven by inflammation-induced vascular dysfunction rather than mechanical obstruction [13,57]. Although the LPS model lacks features of clinical sepsis such as ongoing infection and host-pathogen interactions, it remains a valuable and reproducible tool for investigating early immune and microvascular alterations characteristic of sepsis.
In this context, we examined dynamic changes in vasomotion, a key feature of microvascular regulation that may reflect early functional disturbances in the absence of structural damage. Two observations regarding vasomotion were particularly noteworthy. First, in the control group, the average spectral power in the very low frequency band progressively declined over the 90-minute period, falling to less than half of its initial value and showing a significant decrease from baseline. We hypothesize that the progressive decline in very low frequency power in the control group may reflect reduced endothelial or neurovascular tone over time. This could indicate recovery from initial stress due to anesthesia [71] and tongue manipulation, which may transiently enhance vasomotion through endothelial dysfunction and vasoactive mediators [72].
Second, in the LPS group, spectral power in the very low frequency band remained consistently close to baseline throughout the experiment, indicating relatively elevated vasomotion compared to the control group at both 45 and 90 minutes. Given the established association of this frequency range with endothelial, sympathetic, and myogenic activity [52], such preservation suggests that LPS sustains or enhances local microvascular regulatory mechanisms in response to systemic inflammation. During sepsis, initial peripheral vasoconstriction reduces blood flow, potentially leading to hypoxia in arteriolar vascular smooth muscle cells and impairing their ability to maintain tone [21]. As iNOS expression increases, elevated NO levels promote vasodilation, restoring red blood cell flow and oxygenation, and enabling the reinitiation of constriction [21]. This alternating pattern of vasoconstriction and vasodilation gives rise to pseudo-periodic vasomotion, a phenomenon thought to enhance local oxygen delivery and optimize tissue perfusion under critically hypoperfused conditions [9,73]. Although this compensatory mechanism may help improve microvascular flow, particularly near the arteriolar network, it comes at a cost. By lowering systemic vascular resistance, it can contribute to the persistent hypotension that characterizes septic shock, often refractory to fluid resuscitation [9,74,75].
Notably, the low-frequency (0.15–2 Hz) and high-frequency (2–8 Hz) bands, linked to respiratory and cardiac influences, respectively, remained stable across groups, indicating that systemic cardiorespiratory modulation of vasomotion was not significantly impacted by LPS in the 90 minutes of the experiment. These findings align with previous reports that local microvascular activity, particularly endothelial-driven oscillations, may respond more sensitively to pathophysiological stimuli than systemic vital signs alone [14,76].
To the best of our knowledge, this is the first study to assess microcirculation and vasomotion in the sublingual vessels of mice, introducing a novel and minimally invasive approach to evaluate systemic microcirculatory parameters in an easily accessible vascular bed. The use of the same handheld videomicroscopy technique applied in larger animal models and humans enhances the translational potential of preclinical research by enabling direct cross-species comparisons and improving clinical relevance.
This study has several limitations. First, although animal models are essential for understanding the pathophysiology of sepsis, they do not fully replicate human physiology. Specifically, the use of LPS induces sepsis-like changes much more rapidly than occurs in the natural progression of human disease. Additionally, our model did not include any therapeutic interventions, such as antibiotics or fluid resuscitation, which limits its translational relevance to the complex clinical management of sepsis in hospitalized patients. Technical limitations related to intravital imaging must also be acknowledged. Factors such as a restricted field of view, motion artifacts, pressure sensitivity, and limited frame rate may influence the accuracy and reproducibility of microcirculatory measurements, even when bias-reducing strategies are employed. Finally, while the specific SDF imaging device used in this study is no longer commercially available, comparable tools such as the incident dark field (IDF) video microscopy (CytoCam, Braedius Medical, Huizen, Netherlands) continue to offer viable alternatives for microcirculatory assessment [77].
Although this study utilized an SDF camera to visualize real-time microvascular flow, the setup can be adapted for other imaging modalities, such as optical and two-photon fluorescence microscopy. These techniques, previously applied to the dorsal tongue to study taste bud physiology [78,79] and tumor invasion [80], could allow for simultaneous visualization of vascular and immune responses under various stressors. The procedure could also be refined to enable brief survival imaging by avoiding tooth trimming, gently positioning the tongue with tweezers, and replacing sutures with suction-based fixation.
Finally, future work should integrate additional microhemodynamic parameters, such as tissue oxygenation, hemoglobin content, blood pressure, and lactate levels, to better characterize their relationship with sublingual perfusion and vasomotion during early sepsis. Validation of these techniques against established methods will also be essential to confirm their accuracy and define meaningful metrics for assessing sublingual microvascular function.
5. Conclusions
This study demonstrated the feasibility of using a minimally invasive SDF videomicroscopy technique to assess sublingual microcirculation and detect early microcirculatory impairment during LPS-induced endotoxemia in mice. It also revealed that sublingual vasomotion dynamics may exhibit increased power following immune challenge with LPS, potentially reflecting early compensatory mechanisms of microvascular regulation.
Supplementary Materials
The following supporting information can be downloaded at: https://www.mdpi.com/article/doi/s1, Script S1: Fast Fourier Transform analysis script and related files (analysis script, configuration, example data, README); Video S1: Baseline video available in MP4 and AVI formats (Video1.zip); Video S2: After LPS injection video available in MP4 and AVI formats (Video2.zip).
Author Contributions
Conceptualization, C. L. and J. Z.; methodology, C. L., U. B. and J. Z.; formal analysis, E. D. and M. D.; writing—original draft preparation, E. D.; writing—review and editing, M. D., J. Z. and C. L..; supervision, C. L.; project administration, J. Z..; funding acquisition, C. L. All authors have read and agreed to the published version of the manuscript.
Funding
This first author received funding from MITACS (Globalink Research Internship). The research project was funded by an unrestricted grant from Deutsche Schutzgemeinschaft Schall (Germany).
Institutional Review Board Statement
The animal study protocol was approved by the University Committee on Laboratory Animals of Dalhousie University (protocol code 24-085; date of approval: 1 November 2024).
Data Availability Statement
The raw data supporting the conclusions of this article will be made available by the authors on request.
Acknowledgments
We gratefully acknowledge Marcel Bremekamp and Bernhard Scherzinger from Rrumba Electronic GmbH (Germany) for their technical assistance in developing the Python code for FFT, and Kayle Dickson for creating the figure using BioRender.
Conflicts of Interest
The authors declare no conflicts of interest.
References
- M. Singer et al. The Third International Consensus Definitions for Sepsis and Septic Shock (Sepsis-3). JAMA 2016, 315, 801. [Google Scholar] [CrossRef]
- D. De Backer, D. O. D. De Backer, D. O. Cortes, K. Donadello, and J. L. Vincent Pathophysiology of microcirculatory dysfunction and the pathogenesis of septic shock. 2014, Taylor and Francis Inc. [CrossRef]
- G. Guven, M. P. Hilty, and C. Ince Microcirculation: Physiology, Pathophysiology, and Clinical Application. Blood Purif 2020, 49, 143–150. [Google Scholar] [CrossRef]
- E. Damiani et al. Microcirculation-guided resuscitation in sepsis: the next frontier?. 2023, Frontiers Media SA. [CrossRef]
- D. De Backer, F. D. De Backer, F. Ricottilli, and G. A. Ospina-Tascón Septic shock: A microcirculation disease. Apr. 01, 2021, Lippincott Williams and Wilkins. [CrossRef]
- C. Lelubre and J. L. Vincent Mechanisms and treatment of organ failure in sepsis. Jul. 01, 2018, Nature Publishing Group. [CrossRef]
- C. G. Ellis, R. M. C. G. Ellis, R. M. Bateman, M. D. Sharpe, W. J. Sibbald, and R. Gill Effect of a maldistribution of microvascular blood flow on capillary O 2 extraction in sepsis. 2002. [Online]. Available: www.ajpheart.
- H. Nilsson Vasomotion: Mechanisms and Physiological Importance. Mol Interv 2003, 3, 79–89. [Google Scholar] [CrossRef]
- C. Aalkjær, D. C. Aalkjær, D. Boedtkjer, and V. Matchkov Vasomotion – what is currently thought?. 2011, Blackwell Publishing Ltd. [CrossRef]
- M. Intaglietta Vasomotion and flowmotion: physiological mechanisms and clinical evidence. Vascular Medicine Review 1990, 1, 101–112. [Google Scholar]
- P. M. Kowalewska et al. Spectroscopy detects skeletal muscle microvascular dysfunction during onset of sepsis in a rat fecal peritonitis model. M. Kowalewska et al. Spectroscopy detects skeletal muscle microvascular dysfunction during onset of sepsis in a rat fecal peritonitis model. Sci Rep 2022, 12. [Google Scholar] [CrossRef]
- A. Mendelson et al. Dynamic tracking of microvascular hemoglobin content for continuous perfusion monitoring in the intensive care unit: pilot feasibility study. J Clin Monit Comput 2021, 35, 1453–1465. [Google Scholar] [CrossRef]
- R. Eskandari et al. Non-invasive point-of-care optical technique for continuous in vivo assessment of microcirculatory function: Application to a preclinical model of early sepsis. FASEB Journal, 2024; 23. [CrossRef]
- Fredriksson, M. Larsson, T. Strömberg, and F. Iredahl Vasomotion analysis of speed resolved perfusion, oxygen saturation, red blood cell tissue fraction, and vessel diameter: Novel microvascular perspectives. Skin Research and Technology 2022, 28, 142–152. [Google Scholar] [CrossRef] [PubMed]
- V. Yajnik and R. Maarouf Sepsis and the microcirculation: The impact on outcomes. Apr. 01, 2022, Lippincott Williams and Wilkins. [CrossRef]
- Tang, *!!! REPLACE !!!*; et al. Prognostic Value of Sublingual Microcirculation in Sepsis: A Systematic Review and Meta-analysis. J Intensive Care Med 2024, 39, 1221–1230. [Google Scholar] [CrossRef] [PubMed]
- V. S. K. Edul, C. Enrico, B. Laviolle, A. R. Vazquez, C. Ince, and A. Dubin Quantitative assessment of the microcirculation in healthy volunteers and in patients with septic shock. Crit Care Med 2012, 40, 1443–1448. [Google Scholar] [CrossRef]
- D. De Backer et al. The effects of dobutamine on microcirculatory alterations in patients with septic shock are independent of its systemic effects. Crit Care Med 2006, 34, 403–408. [Google Scholar] [CrossRef] [PubMed]
- M. J. Massey et al. Microcirculatory perfusion disturbances in septic shock: Results from the ProCESS trial. Crit Care, 2018; 1. [CrossRef]
- D. De Backer et al. Microcirculatory alterations in patients with severe sepsis: Impact of time of assessment and relationship with outcome. Crit Care Med 2013, 41, 791–799. [Google Scholar] [CrossRef]
- R. M. Bateman, M. D. R. M. Bateman, M. D. Sharpe, and C. G. Ellis Bench-to-bedside review: Microvascular dysfunction in sepsis - Hemodynamics, oxygen transport, and nitric oxide. Oct. 2003. [CrossRef]
- R. Lala, R. Homes, S. Pratt, W. Goodwin, and M. Midwinter Comparison of sublingual microcirculatory parameters measured by sidestream darkfield videomicroscopy in anesthetized pigs and adult humans. Animal Model Exp Med 2023, 6, 499–503. [Google Scholar] [CrossRef]
- S. Bar et al. EARLY AND CONCOMITANT ADMINISTRATION OF NOREPINEPHRINE AND ILOMEDIN IMPROVES MICROCIRCULATORY PERFUSION WITHOUT IMPAIRING MACROCIRCULATION IN AN INTESTINAL ISCHEMIA-REPERFUSION INJURY SWINE MODEL: A RANDOMIZED EXPERIMENTAL TRIAL. Shock 2025, 63, 606–613. [Google Scholar] [CrossRef] [PubMed]
- C. Wang et al. Effects of Methylprednisolone on Myocardial Function and Microcirculation in Post-resuscitation: A Rat Model. Front Cardiovasc Med, 2022. [CrossRef]
- W. Ge et al. Effects of Polyethylene Glycol-20k on Coronary Perfusion Pressure and Postresuscitation Myocardial and Cerebral Function in a Rat Model of Cardiac Arrest. J Am Heart Assoc, 2020. [CrossRef]
- G. Ferrara et al. Intestinal and sublingual microcirculation are more severely compromised in hemodilution than in hemorrhage. J Appl Physiol 2016, 120, 1132–1140. [Google Scholar] [CrossRef]
- Takala and S., M. Jakob Shedding light on microcirculation? Mar. 2009. [CrossRef]
- M. Hessler et al. Monitoring of Conjunctival Microcirculation Reflects Sublingual Microcirculation in Ovine Septic and Hemorrhagic Shock. Shock 2019, 51, 479–486. [Google Scholar] [CrossRef]
- D. Astapenko et al. Effect of acute hypernatremia induced by hypertonic saline administration on endothelial glycocalyx in rabbits. Clin Hemorheol Microcirc 2019, 72, 107–116. [Google Scholar] [CrossRef] [PubMed]
- H. Zhang et al. Time of dissociation between microcirculation, macrocirculation, and lactate levels in a rabbit model of early endotoxemic shock. Chin Med J (Engl) 2020, 133, 2153–2160. [Google Scholar] [CrossRef]
- V. Dostalova et al. The Effect of Fluid Loading and Hypertonic Saline Solution on Cortical Cerebral Microcirculation and Glycocalyx Integrity. J Neurosurg Anesthesiol 2019, 31, 434–443. [Google Scholar] [CrossRef]
- D. M. J. Milstein, R. Helmers, S. Hackmann, C. N. W. Belterman, R. A. van Hulst, and J. de Lange Sublingual microvascular perfusion is altered during normobaric and hyperbaric hyperoxia. Microvasc Res 2016, 105, 93–102. [Google Scholar] [CrossRef]
- P. T. Goedhart et al. Imaging systems; (110.0180) Microscopy; (170.5380). 1977.
- Jiang, *!!! REPLACE !!!*; et al. Imaging and observation of microcirculation in bowel mucosa using sidestream dark field imaging. J Microsc 2025, 297, 203–214. [Google Scholar] [CrossRef]
- T. Xu et al. Real-time semi-quantitative assessment of anastomotic blood perfusion in mini-invasive rectal resections by Sidestream Dark Field (SDF) imaging technology: a prospective in vivo pilot study. Langenbecks Arch Surg, 2023; 1. [CrossRef]
- B. W. Zweifach Direct observation of the mesenteric circulation in experimental animals. Anat Rec 1954, 120, 277–291. [Google Scholar] [CrossRef]
- F. N. E. Gavins and B. E. Chatterjee Intravital microscopy for the study of mouse microcirculation in anti-inflammatory drug research: Focus on the mesentery and cremaster preparations. J Pharmacol Toxicol Methods 2004, 49, 1–14. [Google Scholar] [CrossRef]
- Coste, M. H. Oktay, J. S. Condeelis, and D. Entenberg Intravital Imaging Techniques for Biomedical and Clinical Research. , 2020, Wiley-Liss Inc. 01 May. [CrossRef]
- J. Pittet and R. Weissleder Intravital imaging. Nov. 23, 2011, Elsevier B.V. [CrossRef]
- Choi, S. J. J. Kwok, and S. H. Yun In vivo fluorescence microscopy: Lessons from observing cell behavior in their native environment. Jan. 01, 2015, American Physiological Society. [CrossRef]
- Mota-Silva, M. A. R. B. Castanho, and A. S. Silva-Herdade Towards Non-Invasive Intravital Microscopy: Advantages of Using the Ear Lobe Instead of the Cremaster Muscle. Life. [CrossRef]
- T. Kurata, Z. Li, S. Oda, H. Kawahira, and H. Haneishi Impact of vessel diameter and bandwidth of illumination in sidestream dark-field oximetry. Biomed Opt Express 2015, 6, 1616. [Google Scholar] [CrossRef]
- S. M. Jansen et al. Applicability of quantitative optical imaging techniques for intraoperative perfusion diagnostics: a comparison of laser speckle contrast imaging, sidestream dark-field microscopy, and optical coherence tomography. J Biomed Opt, 2017; 08. [CrossRef]
- L. D. Shultz, F. L. D. Shultz, F. Ishikawa, and D. L. Greiner Humanized mice in translational biomedical research. Feb. 2007. [CrossRef]
- Gengenbacher, M. Singhal, and H. G. Augustin Preclinical mouse solid tumour models: Status quo, challenges and perspectives. Dec. 01, 2017, Nature Publishing Group. [CrossRef]
- S. Seemann, F. S. Seemann, F. Zohles, and A. Lupp Comprehensive comparison of three different animal models for systemic inflammation. J Biomed Sci, 2017; 1. [Google Scholar] [CrossRef]
- C. M. Treu, O. C. M. Treu, O. Lupi, D. A. Bottino, and E. Bouskela Sidestream dark field imaging: The evolution of real-time visualization of cutaneous microcirculation and its potential application in dermatology. Mar. 2011. [CrossRef]
- M. D. Wood et al. The Use of Near-Infrared Spectroscopy and/or Transcranial Doppler as Non-Invasive Markers of Cerebral Perfusion in Adult Sepsis Patients With Delirium: A Systematic Review. J Intensive Care Med 2022, 37, 408–422. [Google Scholar] [CrossRef] [PubMed]
- Schindelin, *!!! REPLACE !!!*; et al. Fiji: An open-source platform for biological-image analysis. Jul. 2012. [CrossRef] [PubMed]
- P. McDowell, A. A. Berthiaume, T. Tieu, D. A. Hartmann, and A. Y. Shih VasoMetrics: Unbiased spatiotemporal analysis of microvascular diameter in multi-photon imaging applications. Quant Imaging Med Surg 2021, 11, 969–982. [Google Scholar] [CrossRef]
- E. C. Boerma, K. R. E. C. Boerma, K. R. Mathura, P. H. J. van der Voort, P. E. Spronk, and C. Ince Quantifying bedside-derived imaging of microcirculatory abnormalities in septic patients: a prospective validation study. Crit Care, 2005; 6. [Google Scholar] [CrossRef]
- Q. Wang et al. Tumor-Derived Exosomes Promote Tumor Growth Through Modulating Microvascular Hemodynamics in a Human Ovarian Cancer Xenograft Model. Microcirculation, 2024; 7. [CrossRef]
- Spanos, S. Jhanji, A. Vivian-Smith, T. Harris, and R. M. Pearse Early microvascular changes in sepsis and severe sepsis. Shock 2010, 33, 387–391. [Google Scholar] [CrossRef] [PubMed]
- S. Inoue, K. S. Inoue, K. Suzuki-Utsunomiya, K. Suzuki-Utsunomiya, T. Sato, T. Chiba, and K. Hozumi Impaired innate and adaptive immunity of accelerated-aged Klotho mice in sepsis. Crit Care, 2012; S1. [Google Scholar] [CrossRef]
- F. S. Taccone et al. Cerebral microcirculation is impaired during sepsis: An experimental study. Crit Care, 2010; 4. [CrossRef]
- C. L. Verdant et al. Evaluation of sublingual and gut mucosal microcirculation in sepsis: A quantitative analysis. Crit Care Med 2009, 37, 2875–2881. [Google Scholar] [CrossRef]
- D. Secor et al. Impaired microvascular perfusion in sepsis requires activated coagulation and P-selectin-mediated platelet adhesion in capillaries. Intensive Care Med 2010, 36, 1928–1934. [Google Scholar] [CrossRef]
- Bhardwaj, R. Patil, S. Mani, M. R, and H. R. Vasanthi Refinement of LPS induced Sepsis in SD Rats to Mimic Human Sepsis. Biomedical and Pharmacology Journal 2020, 13, 335–346. [Google Scholar] [CrossRef]
- T. T. Cornell, P. Rodenhouse, Q. Cai, L. Sun, and T. P. Shanley Mitogen-activated protein kinase phosphatase 2 regulates the inflammatory response in sepsis. Infect Immun 2010, 78, 2868–2876. [Google Scholar] [CrossRef]
- Higashiyama, *!!! REPLACE !!!*; et al. P-selectin-dependent monocyte recruitment through platelet interaction in intestinal microvessels of LPS-treated mice. Microcirculation 2008, 15, 441–450. [Google Scholar] [CrossRef]
- S. F. Liu, A. B. Malik, and S. F. Liu NF-B activation as a pathological mechanism of septic shock and inflammation. Am J Physiol Lung Cell Mol Physiol 2006, 290, 622–645. [Google Scholar] [CrossRef]
- G. Hernandez, A. Bruhn, and C. Ince Microcirculation in Sepsis: New Perspectives. Curr Vasc Pharmacol 2013, 11, 161–169. [Google Scholar] [CrossRef]
- C. Ince and M. Sinaasappel Microcirculatory oxygenation and shunting in sepsis and shock. Crit Care Med 1999, 27, 1369–1377. [Google Scholar] [CrossRef] [PubMed]
- S. Trzeciak et al. Resuscitating the microcirculation in sepsis: The central role of nitric oxide, emerging concepts for novel therapies, and challenges for clinical trials. 08. 20 May. [CrossRef]
- D. Lidington, Y. Ouellette, F. Li, and K. Tyml Conducted vasoconstriction is reduced in a mouse model of sepsis. J Vasc Res 2003, 40, 149–158. [Google Scholar] [CrossRef]
- C. Ince The microcirculation is the motor of sepsis. Aug. 2005. [CrossRef]
- K. Tyml, X. K. Tyml, X. Wang, D. Lidington, and Y. Ouellette Our recent in vitro study (Lidington et al. 2001. [Online]. Available: www.ajpheart.
- R. Condon, J. E. Kim, E. A. Deitch, G. W. Machiedo, and Z. Spolarics Downloaded from journals.physiology.org/journal/ajpheart at Dalhousie Univ DAL 11762. Am J Physiol Heart Circ Physiol 2003, 284, 2177–2184. [Google Scholar] [CrossRef]
- D. J. Singel and J. S. Stamler Chemical physiology of blood flow regulation by red blood cells: The role of nitric oxide and S-nitrosohemoglobin. 2005. [CrossRef]
- M. Miranda, M. Balarini, D. Caixeta, and X. Eliete Bouskela Microcirculatory dysfunction in sepsis: pathophysiology, clinical monitoring, and potential therapies. Am J Physiol Heart Circ Physiol 2016, 311, 24–35. [Google Scholar] [CrossRef] [PubMed]
- J. Nyvad et al. Intravital investigation of rat mesenteric small artery tone and blood flow. Journal of Physiology 2017, 595, 5037–5053. [Google Scholar] [CrossRef] [PubMed]
- R. Kvietys and D. N. Granger Role of reactive oxygen and nitrogen species in the vascular responses to inflammation. Feb. 01, 2012. [CrossRef]
- D. Goldman and A. S. Popel A computational study of the effect of vasomotion on oxygen transport from capillary networks. J Theor Biol 2001, 209, 189–199. [Google Scholar] [CrossRef]
- R. P. Dellinger et al. Surviving sepsis campaign: International guidelines for management of severe sepsis and septic shock, 2012. Intensive Care Med 2013, 39, 165–228. [Google Scholar] [CrossRef] [PubMed]
- C. Roger et al. Time course of fluid responsiveness in sepsis: The fluid challenge revisiting (FCREV) study. Crit Care, 20 May; 1. [CrossRef]
- E. Farkas and P. G. M. Luiten Cerebral microvascular pathology in aging and Alzheimer’s disease. 2001. [Online]. Available: www.elsevier.
- S. D. Hutchings, J. S. D. Hutchings, J. Wendon, S. Watts, and E. Kirkman The Cytocam video microscope. A new method for visualising the microcirculation using incident dark field (IDF) technology. 2015, SpringerOpen. [CrossRef]
- J. Han, P. J. Han, P. Choi, and M. Choi µTongue: A Microfluidics-Based Functional Imaging Platform for the Tongue In Vivo. Journal of Visualized Experiments, 2021. [Google Scholar] [CrossRef]
- M. Choi, W. M. M. Choi, W. M. Lee, and S. H. Yun Intravital microscopic interrogation of peripheral taste sensation. Sci Rep, 2015. [Google Scholar] [CrossRef]
- S. M. Hammoudeh et al. Tongue orthotopic xenografts to study fusion-negative rhabdomyosarcoma invasion and metastasis in live animals. Cell Reports Methods 2024, 4, 100802. [Google Scholar] [CrossRef] [PubMed]
Figure 1.
Schematic diagram of the experimental workflow. Created in BioRender. Dickson, K. (2025) https://BioRender.com/3w0wphl.
Figure 1.
Schematic diagram of the experimental workflow. Created in BioRender. Dickson, K. (2025) https://BioRender.com/3w0wphl.
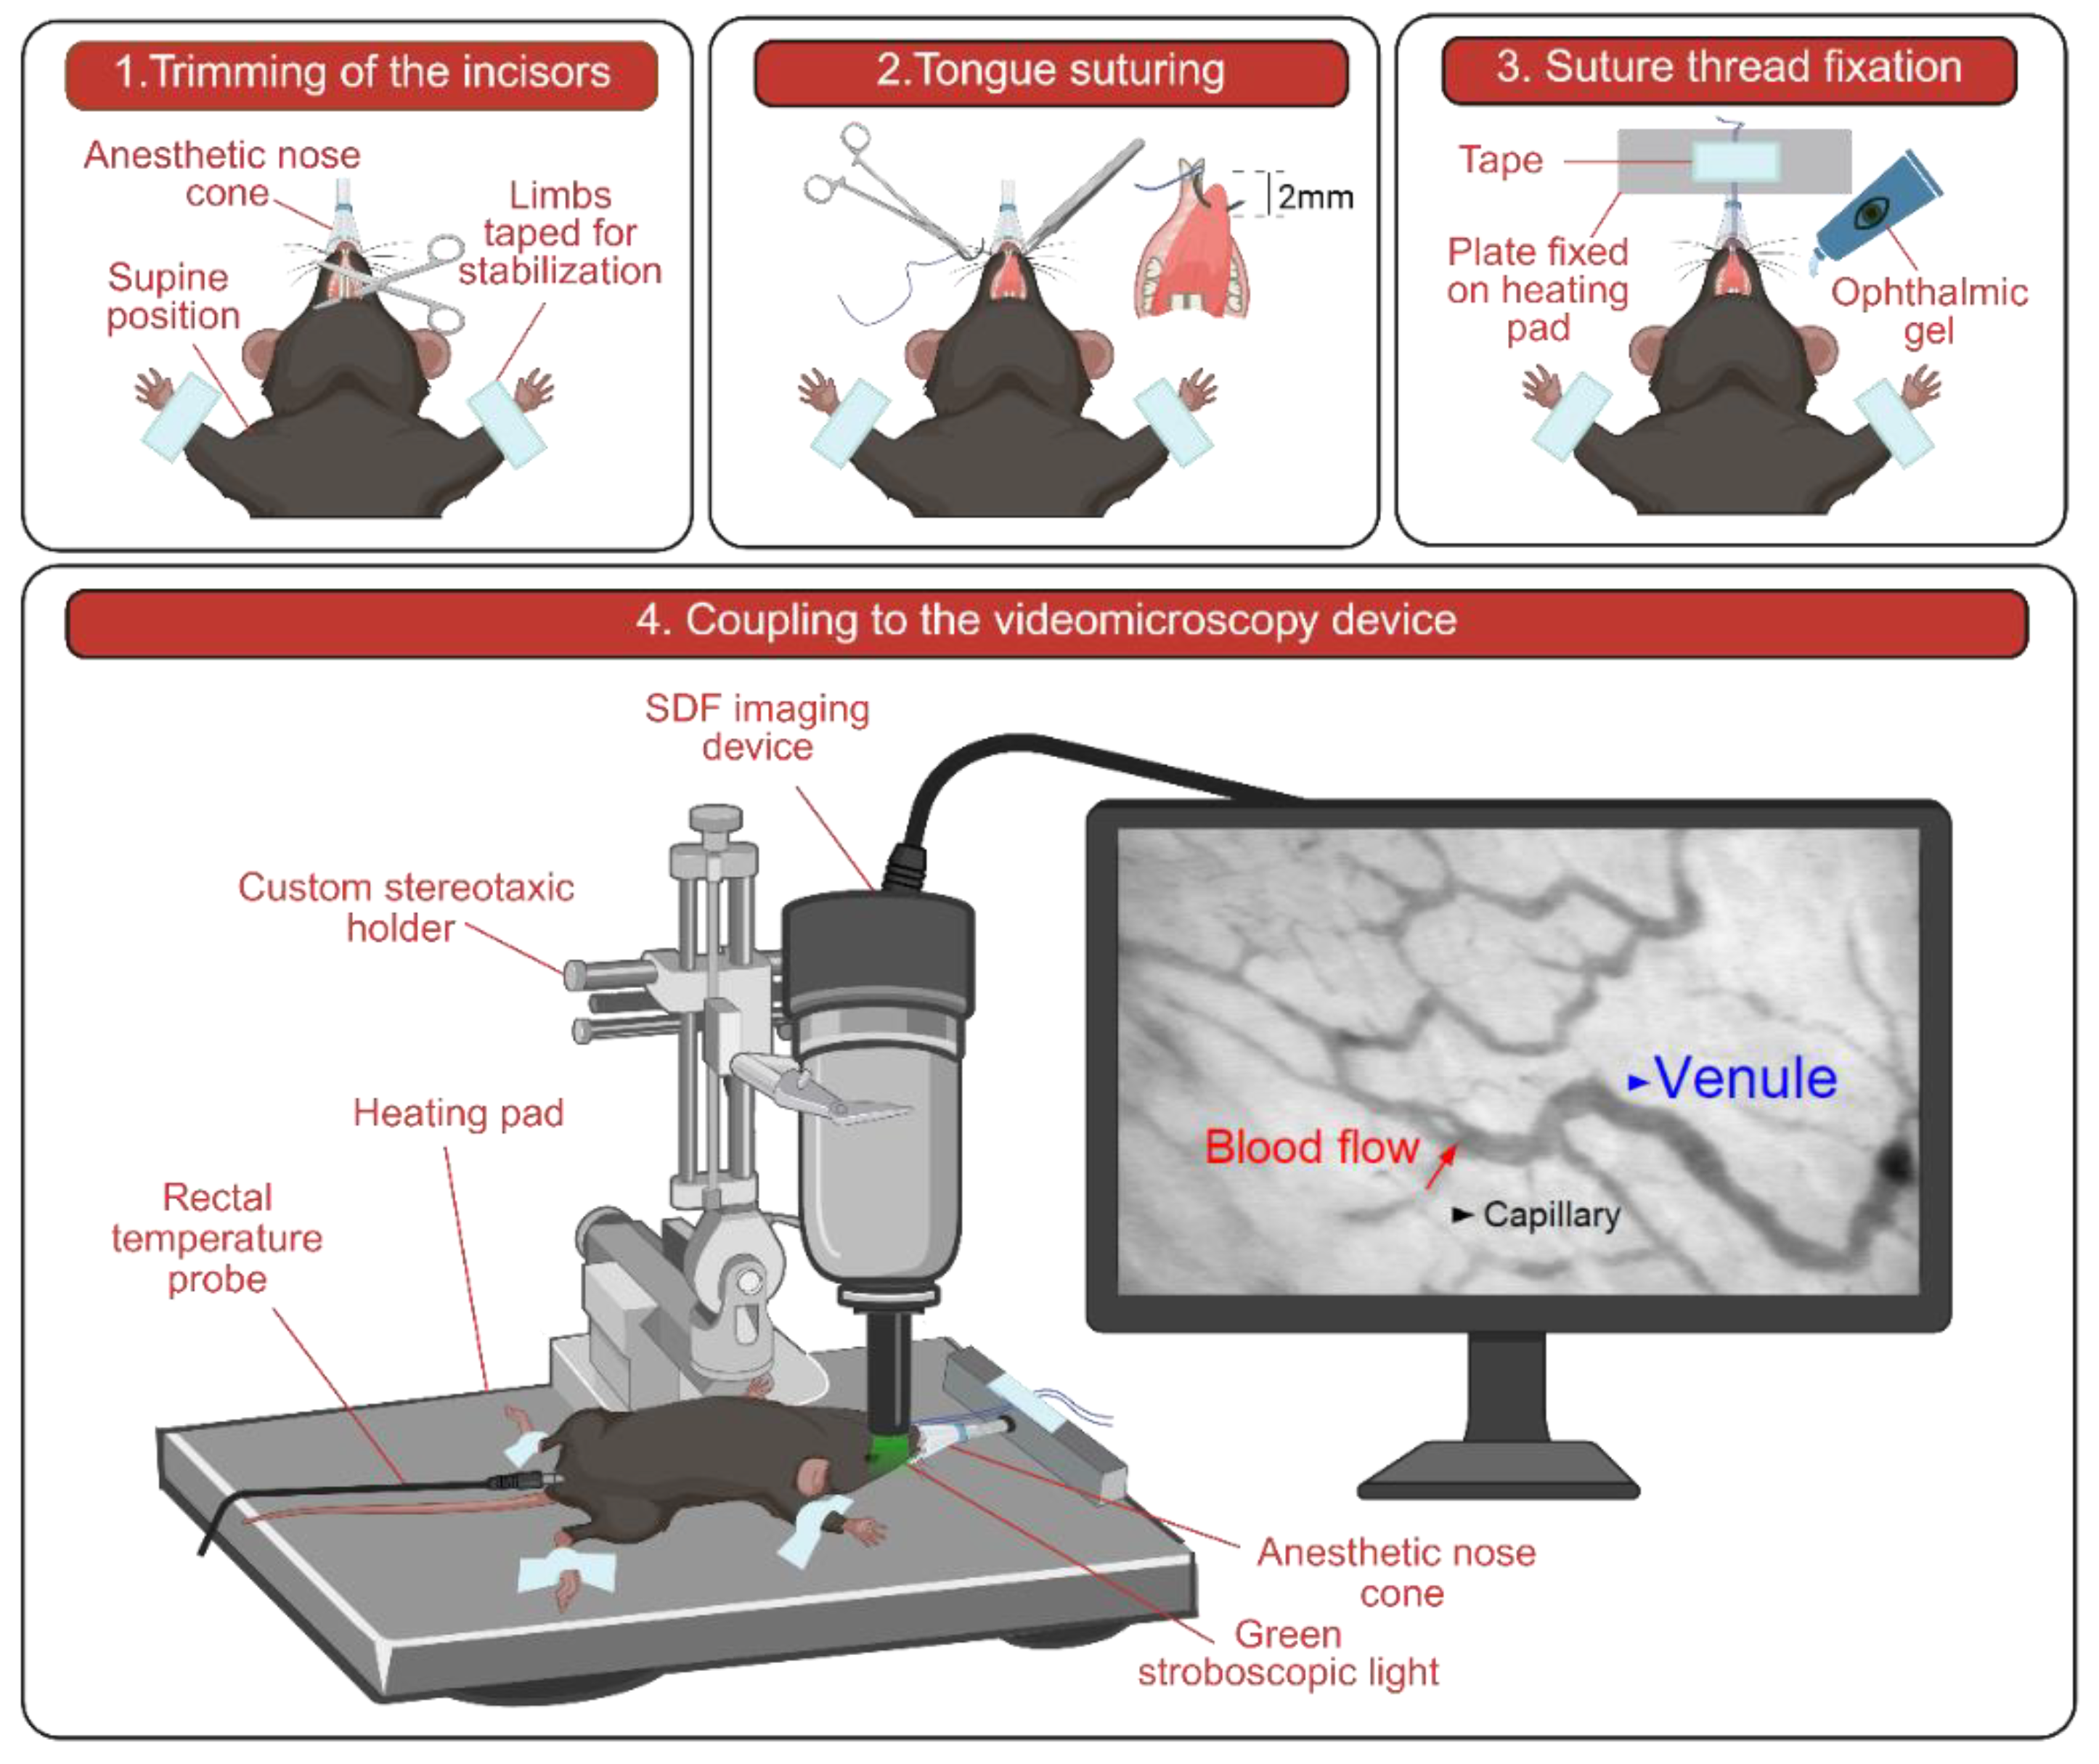
Figure 2.
Perfusion parameters. (A) PPV over time in control and LPS-injected groups. (B) MFI over time in control and LPS-injected groups. (C) TVD over time in control and LPS-injected groups. PPV – proportion of perfused vessels; MFI – microvascular flow index; LPS – lipopolysaccharide. * Indicates p ≤ 0.05.
Disclaimer/Publisher’s Note: The statements, opinions and data contained in all publications are solely those of the individual author(s) and contributor(s) and not of MDPI and/or the editor(s). MDPI and/or the editor(s) disclaim responsibility for any injury to people or property resulting from any ideas, methods, instructions or products referred to in the content. |
© 2025 by the authors. Licensee MDPI, Basel, Switzerland. This article is an open access article distributed under the terms and conditions of the Creative Commons Attribution (CC BY) license (http://creativecommons.org/licenses/by/4.0/).
Copyright: This open access article is published under a Creative Commons CC BY 4.0 license, which permit the free download, distribution, and reuse, provided that the author and preprint are cited in any reuse.


