Submitted:
13 August 2025
Posted:
15 August 2025
You are already at the latest version
Abstract
Global wine standards often require product descriptions to be based on both analyti-cal and sensory criteria, despite the subjective nature of sensory perceptions, especially sensory features. The present study focused, as far as possible, on tasting pairs of ‘Blanc de noir’ and red wines made from the same grape variety, produced by the same win-ery, and from the same vintage. On one hand, the aim was to investigate whether the grape variety consistently imparts perceptible characteristics, regardless of the wine-making method. On the other hand, the research aimed to assess the influence of the absence of visual stimuli on the olfactory and gustatory senses. This approach differs from earlier studies, which mainly examined how visual context affects sensory per-ceptions across a wider range of wines with different colours. Tastings were conducted under various conditions, using either opaque or transparent glasses, and sensory at-tributes were assessed and recorded by experienced tasters. The data collected by tast-ers were analysed with XLSTAT–Student, a statistical analysis tool. A Lyza 5000 wine analyser was used to measure basic physicochemical properties, ensuring that com-mercial samples met wine quality standards. It was found that making assumptions based on visual cues influences tasters' sensory experiences during a tasting. At statis-tically significant levels, wine tasters could distinguish between white and red wines. Furthermore, the sensory descriptors linked to wines produced through red winemak-ing techniques - such as the presence of a maceration stage, perceived intensity, or flavours of red or opaque fruits, or astringency - were directly correlated with physi-cochemical parameters, including pH, lactic acid, glycerol, and volatile acidity. At the same time, an indirect correlation with malic acid content and titratable acidity was observed.
Keywords:
blind tasting
; organoleptic study
; food choice
; consumer perception
; maceration
1. Introduction
Organoleptic sensory aspects can lead to conflicting perceptions, as how wine is perceived during tasting varies greatly depending on the taster's prior experiences and the tasting environment. For instance, the tasting environment is vital, since people can accurately identify about one–third of familiar orthonasal odours when these cues are alone [1].
Among the pioneering studies on olfactory perceptions related to wine colour are those conducted by a research group led by Jordi Ballester at the Université de Bourgogne [2]. In 2009, a sensory study was conducted on eighteen premium–range wines (six white, six rosé, and six red), all sourced from French vineyards with grapes harvested in 2015, obtained through retail commercial markets. The main findings showed that, regardless of taster expertise, the olfactory profiles of white and red wines were correctly identified, regardless of visual cues. However, rosé wines posed significant identification challenges [2]. Additional studies, among the limited research on this topic, have shown that visual impact, especially chromatic features, can be a crucial factor in the olfactory and gustatory perceptions of food products or beverages. This is because the initial sensory impressions are created at the moment of first encounter [3]. Another example of sensory perception overlap is the link between olfactory and gustatory attributes, where many distinct characteristics of specific odours are given qualitative gustatory labels [4]. Furthermore, many individuals who have experienced temporary anosmia have also reported partial or complete dysgeusia [5].
Both olfactory and gustatory perceptions are activated when the concentration of a substance surpasses a specific detection threshold. However, under different conditions with mixed samples, orthonasal detection thresholds can be lower compared to thresholds for individual substances or stimuli when the test sample is exposed to both olfactory and gustatory senses simultaneously [6].
Attempting to predict the overall odour profile of a wine solely based on its chemical composition is like facing Sisyphus's challenge, as the overall sensory experience is influenced by a complex interplay of factors beyond the simple summation of individual component perceptions. The balance between volatile and non–volatile components plays a crucial role, as certain compounds may dominate or suppress others depending on their relative concentrations and interactions. Additionally, external variables such as temperature can significantly impact the volatility, release, and perception of aromatic compounds, altering the overall olfactory profile. Furthermore, matrix effects, such as the presence of ethanol, sugars, and other macromolecules, can modulate the availability and delivery of volatile compounds, further complicating the relationship between chemical composition and sensory perception. These dynamics underscore the multifactorial nature of odour perception in alcoholic beverages, where equilibrium among components and environmental conditions collectively shape the final sensory experience.
Over one thousand organic and inorganic components, identified as present in wine, continuously interact with each other in pursuit of a perpetual dynamic equilibrium [7]. This entire ‘storm’ of interconnected compounds, grouped into several main categories, generally follows this structure: water / 86%, ethanol / 12%, glycerol / 4–10 g/L, higher alcohols / 300–600 mg/L, polysaccharides / 1%, organic acids / 0.4%, polyphenols / 1–5 g/L in red wines or 0.2–0.5 g/L in white wines [8], minerals / 1.5–3 g/L, volatile compounds and other compounds – 0.5% [9], and, in effect, creates a sensory flux that is perceived differently during organoleptic evaluation, depending on the tasting context and the sensory memory of each individual taster.
Beyond the inherent complexity of the clear link between sensory perceptions and physicochemical parameters—stemming from the dynamic balance of over a thousand components—there is also the variability of conditions at the moment of tasting. Previous research shows that when visual stimuli conflict with olfactory cues, the odour components of wine have little effect on olfactory discrimination. Studies at the University of Bordeaux have even demonstrated that visual cues can replace perceived olfactory sensations. Specifically, when a wine made using the ‘white winemaking’ method was artificially coloured with an odourless red dye, it was described using terminology typical of wines produced by the ‘red winemaking’ method, especially among those with some oenological knowledge [10].
Furthermore, although a consensus model remains the main approach in much of wine sensory analysis, emerging research shows that individual differences among tasters (shaped by their unique physiology, past experiences, and knowledge) are not incidental but may be vital to the sensory evaluation process [11]. In particular, emotionally meaningful experiences and their associated scents, such as the distinctive aroma of one’s childhood home, have been shown to play a vital role in shaping how individuals perceive, categorise, and respond to odours, both analytically and hedonic. This influence is particularly strong for odours experienced in early life, which become deeply embedded in an individual's sensory memory [12]. As a result, the practice of training tasters to assign a standardised, consensus–based name to a specific odour is questioned. Although such training may promote linguistic consistency, it does not necessarily ensure conceptual uniformity, since the perceptual and cognitive associations with particular odours remain highly individual [13].
A key factor with significant implications for wine sensory evaluation is the conclusion of a 2014 study, which indicates that olfactory–induced influences (specifically, behavioural changes triggered by exposure to odours) can affect individuals even when they are not consciously aware of the odour's presence or its impact on their behaviour. This suggests that our sensory and cognitive responses to wine are shaped not only by consciously perceived aromas but also by implicit olfactory cues that operate beyond our awareness. Consequently, individuals may be unable to explicitly recognise, articulate, or even identify the specific odour-related influences underpinning their perception, appreciation, and judgment of a wine. These findings challenge traditional assumptions about sensory objectivity in wine evaluation and emphasise the complexity of olfactory perception in shaping subjective experiences [14].
Conceptualising all the results of previously published research, which were consulted during the documentation of the working hypotheses of the present study, the main objective was to identify how sensory perceptions, induced by various organoleptic parameters, vary across wines produced through different winemaking methods, which imply specific physicochemical properties of the wine parameters. More specifically, the study's starting point was the hypothesis that different winemaking methods cause varying physicochemical changes in wines made from the same grape bunch. Furthermore, after analysing research from Bourgogne University [2], which examined different white, rosé, and red wines, the question arises of what would happen if wines were produced from the same black grape variety. In this way, the effects of the winemaking method can be more precisely isolated in the sensory profile of the wines. Furthermore, the study aims to determine whether sensory traits typically associated with red wines can be recognised in white wines made from the same grape variety when visual cues are absent. Moreover, considering the EU regulation that mandates the sensory description of wines registered as ‘Protected Designation of Origin’, it also seeks to explore the hypothesis that certain fundamental sensory perceptions do not depend on visual cues.
2. Materials and Methods
2.1. Wine Samples
Thirteen commercial wine samples were purchased online from authorised sellers over several months during the first semester of 2023. Efforts were made to minimise variability unrelated to the winemaking process, both in the physicochemical parameters and sensory perception of the wines, by selecting a ‘flight’ in which the wines were vinified as similarly as possible, originating from the same grape varieties, sourced from the same winery, and harvested in the same year. Each wine sample was provided with three bottles. The bottles had been checked before pouring to ensure they were free from faults. Wines produced in two styles were selected: ‘Blanc de noir’, made using white winemaking methods from black-skinned grapes, and ‘Red’, characterised mainly by features developed during the maceration stage of red winemaking. One of the samples was a ‘Rosé’ wine, made from the same black grapes used for ‘Blanc de noir’ and red wines, through direct pressing.
Most of the wine samples were monovarietal, except for those with conventional ID V12 and V13, which were produced by blending 95% Touriga Franca and 5% Syrah grapes, as shown in Table 1. ID represents a conventional number assigned to each sample, which remains the same across all tasting sessions and does not indicate the order of serving for the tasters' analysis. In the Region column, the first two letters denote the country of origin code of the winery (and implicitly the wine) in Alpha-2 format (ISO 3166), followed by the name of the DOP region, which covers all wines of that quality level.
Beyond simply identifying by labels, the wine samples were analysed from a physicochemical perspective using a multi–parameter wine analyser Lyza 5000 (Anton Paar, Graz, Austria) [15]. Infrared spectroscopy provides an economical method for analysing grapes and wines. The original goals of infrared spectroscopy in relation to wines were to determine the alcohol and sugar content [16]. In this study, the typical physicochemical parameters of wines were analysed, highlighting the presence of specific and sharp absorption bands, such as alcohol content (%/vol), total glucose and fructose (g/L), titratable acidity (g/L, tartaric acid equivalents), volatile acidity (g/L, acetic acid), malic acid (g/L), tartaric acid (g/L), lactic acid (g/L), pH, density (g/mL), total dry extract (g/L), glycerol (g/L), and total polyphenols (mg/L) [17].
2.2. Tasters panel
Twenty-one qualified tasters were identified, of whom 11 were female and willing to participate in the study. The term ‘qualified’ was used based on their involvement in the wine sector, with job duties including teaching university courses in oenology and viticulture, conducting scientific research in the beverage industry, holding accreditation as Romanian authorised tasters or sommeliers, or possessing at least a Wine & Spirit Education Trust, Level 2 certification [18]. Some of them graduated from the master's programme in beverages at Iasi University of Life Sciences. The tasters were informed beforehand that they would be sampling alcoholic beverages, and all of them were over the legal drinking age at the time of the tasting sessions. All the tasters adhere to an ethical informing and consignment process in accordance with the ethical code of the Iasi University of Life Sciences.
2.3. Design of the experiment
To ensure a proper progression of the study and to maintain a consistent focus on the objectives, a flowchart was developed. The processes of the experiment are illustrated in Figure 1.
After defining the main parameters of the experiments, the next step was to acquire the resources needed. The design of the tasting sheet was based on the Wine & Spirits Education Trust (Level 4) Systematic Approach [19], adapted with specific features necessary to reflect the quantified intensity of the maceration stage. In pursuit of an optimal synthesis (both representative and statistically interpretable) of the sensory data quantified by the tasters, the following organoleptic characteristics were selected and refined, as shown in Table 2.
The design of the tastings was arranged to reduce the risk of arbitrary influence on the research outcomes [21] and aimed to ensure full anonymisation of the tasters by assigning random IDs. This approach aimed to prevent the perception that the tasting sessions were tests of the tasters’ knowledge or the panel members’ ability to interpret or recall instructions. When critically evaluating wines, withholding information such as varietal, stylistic, or regional origin, price, or producer is essential to avoid bias in assessments, whether positive or negative [22]. The sensory analysis followed the OIV recommendations [23]. The tasting sessions were conducted under conditions where tasters were unaware of the wines’ origins or other identifying features. Before each session, all bottles were fully anonymised and randomly mixed; only one person, not among the tasters, who poured into the glasses, knew the true identity of each wine sample. Regarding the serving sequence, the white and red wine samples were combined. This method was used to prevent guesswork about the type of wine and to minimise sensory bias, which could be influenced solely by the sample's general aspects category. Additionally, the preferred order, within the limits of what is possible, followed the increasing levels of alcohol concentration and ageing period. Therefore, the chosen sequence was: (1) Rosé (13% ABV, 2022), (2) White (12% ABV, 2021), (3) White (13% ABV, 2021), (4) Red (13% ABV, 2021), (5) Red (11,5% ABV, 2019), (6) Red (14,5% ABV, 2020), (7) White (12,5% ABV, 2021), (8) White (12% ABV, 2019), (9) White (13% ABV, 2021), (10) White (12,5% ABV, 2021), (11) Red (14% ABV, 2017), (12) Red (14,5% ABV, 2019), (13) Red (14% ABV, 2020).
During the initial tasting sessions, opaque glasses were used to prevent any visual bias, and the lighting was maintained at the minimum necessary to note sensory details on the tasting sheet. Tasters were unaware of the shape of the bottles. Red napkins were employed to hide the colour of the drink, while plain water, slices of natural bread, and Granny Smith apple pieces served as palate cleansers. The tasting sessions began at 10 a.m. and lasted approximately two hours. At the end of each session, the true identity of the samples was not disclosed to ensure tasters’ impartial perception and to maintain the integrity of the tasting environment.
Considering the sample numbers and the multiple sensory attributes to be evaluated, a five–point Likert scale was implemented to quantify the intensity of sensory perceptions. This methodological decision was based on the scale's accessibility and efficiency in data collection procedures. The selected instrument facilitates the generation of quantitative data suitable for statistical analysis, despite the potential response biases manifesting as central tendency error or extreme response style that may influence participant response evaluations.
2.4. Data analysis
To interpret the data statistically, XLSTAT–Student, a statistical and data analysis solution (Lumivero, Denver, CO, USA), was used. Since fewer than 50 unique experimental data observations were collected, deviations from a normal distribution could have a significant impact, primarily leading to false positive results, as the Central Limit Theorem—which states that the distribution of the mean tends towards normality regardless of the initial distribution—could not be applied. For this reason, significance testing of the ‘P-value’ for the wines as a source of variance was first conducted using a Shapiro–Wilk’s test. The ‘W’ statistic from Shapiro–Wilk’s test indicates that, the closer it is to one, the more the data resemble a normal distribution. The ‘P–value’ represents the probability of obtaining such data under the null hypothesis (H0), which states that the residuals are normally distributed. The higher its value than a conventional significance threshold (α = 0.05), the less evidence there is to reject the null hypothesis. Subsequently, a univariate analysis of variance (ANOVA) was performed for each attribute using a one–way model, with the descriptors as fixed variables and random wine effects. The descriptors were analysed separately in the two different tasting contexts, using opaque and transparent glasses.
To assess the relationships between sensorial descriptors, Kendall correlation tests were conducted on attribute values noted by tasters, specifically in tasting sessions with opaque glasses and in sessions with transparent glasses. Kendall’s correlation was deemed the most suitable method for analysing the relationship between sensory descriptors because of the limited amount of unique experimental data collected.
Representations of the wines in various tasting contexts were generated using Principal Component Analysis (PCA) applied to the covariance matrices of the mean ratings for descriptor intensities, calculated across the entire panel of tasters for each wine. The selection of principal components was primarily based on their factor loadings and the proportion of variance explained. Due to the smaller size of the experimental dataset, it was considered optimal to utilise an Agglomerative Hierarchical Clustering technique to identify homogeneous sample groups based on sensory characteristics and/or physicochemical parameters. The optimal number of clusters was determined using the elbow method on the within–cluster inertia plot, specifically at the point where the reduction rate shows a clear slowdown. Additionally, a linear regression analysis was performed between the set of sensory descriptors and several of the physicochemical parameters of the samples, considered to be directly related to the winemaking methods. Statistical tests were selected based on Jackson [22] and Qannari & and Schlich [24].
3. Results
3.1. Physicochemical parameters
For all tastings, 0.75 L bottles purchased from the same source were used, in groups of three for each wine sample, prepared for the tasting flight. All samples were analysed, and the measured values of the physicochemical parameters are listed in Table 3. The physicochemical parameters were measured in triplicate, and the results are presented as the mean and standard deviation. The values shown are consistent with OIV standards for determining physicochemical parameters. Regarding density, the OIV-MA-AS2-01B : R2009 method, Type IV, was used [25].
3.2. Data concerning the context of tasting sessions, whether using opaque or transparent glasses
As shown in Table 4, for tasting sessions with suppressed visual stimuli, all sensory descriptor values, except for the ‘General Evaluation’ (D19_b), which has a ‘W’ of 0.924 but a ‘p-value’ less than 0.05, fall within the normal distribution range. This indicates a low chance of false positive results or missing genuine differences. Furthermore, in the same Table 4, for tasting sessions with transparent glasses, the descriptors green/fresh/citrus fruit, acidity/sourness, and unctuousness yielded p-values below 0.05 for the Shapiro–Wilk W coefficient. This suggests a significant risk of false positive results or failure to detect real differences, leading us to dismiss these findings.
In Table 4, Dx_b, x=1–19, represent statistical values calculated for sensory descriptors (listed in Table 2) recorded during tasting sessions with opaque glasses, while Dx, x=1–19, have the same meaning but for tasting sessions with transparent glasses. R2 – reflects, within the ANOVA model, the proportion of the variability in the dependent variable explained by the model. The closer R2 is to 1, the better the model; F_statistic – measures the explanatory power of the model, with a higher F indicating that the model explains more variation than expected by chance; Pr > F – indicates the probability of obtaining the observed F value under the null hypothesis. When this value is very small (<0.0001), the model is highly statistically significant.
For the tasting sessions with opaque glasses, six sensory descriptors (existence of a maceration stage and its perceived intensity of it, red fruits, berries/forest fruits, Maillard–type notes, astringency and other specific notes) showed a very high probability rate (Pr > F less than 0.0001) for higher F-statistic values. These values serve as a reliable ‘second opinion’ of R², showing the proportion of variance that the statistical model explains in the dependent variable, which ranges from 75.3% to 91.7%. The higher the F_statistic value, the better the model accounts for the data. Additionally, seven other sensory descriptors (overall olfactory intensity, vegetal/herbal notes, green/fresh/citrus fruits, exotic fruits/stone fruits/tropical fruits, overripe fruits, spice notes, and bitterness) recorded Pr > F values below 0.05, which is the significance threshold. Therefore, it is concluded that the statistical model effectively explains the variation of the dependent variable. Overall, in the model parameter equations, the sum of the sample variance multiplication coefficients is mostly negative. For descriptors with a very high probability rate (Pr > F less than 0.0001) for the F-statistic value, the negative coefficients are clearly evident.
When tasting with transparent glasses, the data recorded by the tasters, compiled as statistical values, shows that five sensory descriptors (existence and perceived intensity of a maceration stage, red fruits, berries/forest fruits, spice notes, and astringency) have a very high probability (Pr > F less than 0.0001) of obtaining high F–statistic values. This can be seen as a strong confirmation of the R² values, which represent the proportion of variance in the dependent variable explained by the model, ranging from 72.3% to 94.1%. The higher the F_statistic value, the better the model explains the data. Additionally, four other sensory descriptors (floral notes, Maillard–type notes, other specific notes, and bitterness) yielded Pr > F values below the 0.05 significance threshold, indicating that the statistical model reliably describes the variation of the dependent variable. Overall, in the model parameter equations, the sum of the values of the samples’ variants multiplication coefficients is mainly negative, and for descriptors with a very high probability rate (Pr > F less than 0.0001) for the F_statistic value, the negative coefficients are clearly dominant.
The overall view of the correlation matrix of sensory descriptors related to tastings with opaque and transparent glasses, respectively, is shown in Figure 2.
During tasting sessions with opaque glasses, a top ten list of positive correlation pairs includes the existence and perceived intensity of the maceration stage with berries/forest fruits, spice notes, astringency, and finish/post–taste persistence. Other strong positive correlations were observed between red fruits and berries/forest fruits, berries/forest fruits and astringency, spice notes and Maillard–type notes. Additionally, correlations were found between spice notes and finish/post–taste persistence. Lastly, a notable positive correlation was identified between bitterness and astringency. The top ten inverse correlation pairs include the presence and perceived intensity of the maceration stage with green/fresh/citrus fruits. Negative correlations were also identified between vegetal/herbal notes and red fruits or berries/forest fruits, as well as between green/fresh/citrus fruits and red fruits, berries/forest fruits, spice notes, Maillard–type notes, other specific notes, and astringency. Additionally, an inverse correlation was observed between exotic fruits/stone fruits/tropical fruits and bitterness.
When tasting with transparent glasses, the top ten positive correlations include: the presence and perceived intensity of a maceration stage with red fruits and berries/forest fruits; floral notes with green/fresh/citrus fruits and exotic fruits/stone fruits/tropical fruits; green/fresh/citrus fruits with exotic fruits/stone fruits/tropical fruits; red fruits with berries/forest fruits; spice notes with other specific notes and astringency; and Maillard-type notes with other specific notes and bitterness. The top ten negative correlations include: existence and perceived intensity of a maceration stage with green/fresh/citrus fruits and exotic fruits/ stone fruits/ tropical fruits; floral notes with red fruits and berries/forest fruits; green/fresh/citrus fruits with other specific notes, bitterness, and astringency; exotic fruits/ stone fruits/ tropical fruits with astringency; red fruits with sweetness; and berries/forest fruits with sweetness.
Furthermore, the details of the intrinsic relationship between pairs formed by any two descriptors are illustrated in Figure 3.
To enhance the separation of samples illustrating winemaking techniques, a principal components analysis was conducted based on variables including sensory attributes outlined by the descriptors. The numerous sensory descriptors gathered during tastings, which were performed with opaque glasses, were condensed into two main explanatory factors, accounting for approximately 76% of the total variance, as shown in Figure 4.
The main factor, which explains about 56% of the data’s variability, is strongly positively linked with the following descriptors: existence and perceived intensity of a maceration stage, red fruits, berries/forest fruits, spice notes, Maillard–type notes, other specific notes, bitterness, and astringency. This factor also shows a strong negative correlation with green/fresh/citrus fruits and exotic fruits/ stone fruits/ tropical fruits. These relationships were determined through the contribution of existence and perceived intensity of a maceration stage, green/fresh/citrus fruits, exotic fruits/ stone fruits/ tropical fruits, red fruits, berries/forest fruits, spice notes, Maillard–type notes, other specific notes, bitterness, and astringency. The second factor, accounting for about 20% of the data’s variability, is strongly positively correlated with overall olfactory intensity, floral notes, unctuousness, finish/post–taste persistence, and overall evaluation. These correlations mainly arise from the contributions of sensory descriptors, including overall olfactory intensity, floral notes, exotic fruits, stone fruits, tropical fruits, spice notes, Maillard–type notes, acidity/sourness, sweetness, unctuousness, finish/post-taste persistence, and overall evaluation. The third factor, which increases the overall explained variability to 83% when combined with the first two, is strongly positively linked acidity/sourness and finish/post–taste persistence, while showing a strong negative correlation with overall olfactory intensity, overripe fruits, and unctuousness. This final factor is mainly shaped by contributions from overall olfactory intensity, floral notes, vegetal/herbal notes, red fruits, berries/forest fruits, overripe fruits, other specific notes, acidity/sourness, unctuousness, and finish/post–taste persistence.
From a different perspective, it was observed that the contribution of each wine sample to the defined explanatory factors is distributed across a broad range. For the first factor, the top five wine samples that stood out had IDs, according to Table 2, V4, V10, V13, V11 and V7. The second factor was largely influenced by the wine samples with the IDs V9, V3, V1, V12, and V8. Not least, the third explanatory power factor was found to have the highest contribution to the wine samples with IDs V1, V4, V3, V2 and V8.
According to the clustering structure revealed by the principal components analysis, as shown in Figure 4, the agglomerative hierarchical clustering method identifies the same pairs of relationships between samples. In Figure 5, the two main clusters are clearly visible. Optimal segmentation is based on the ‘elbow’ rule, which determines the best number of clusters by identifying the point at which within–cluster inertia decreases significantly.
To ensure consistency, the information collected from the tasting with transparent glasses was also organised. As shown graphically in Figure 6, the clustered pattern of the wine samples is clearly emphasised. The factor F1, which accounts for approximately 53% of the data variability, is represented by the horizontal axis, and the F2 factor, explaining around 19% of the data variability, is represented by the vertical axis.
The main factor, which accounts for approximately 53% of the data’s variability, is strongly positively correlated with the following descriptors: existence and perceived intensity of a maceration stage, red fruits, berries/forest fruits, overripe fruits, spice notes, Maillard-type notes, other specific notes, bitterness, and astringency. This factor also shows strong negative correlations with floral notes, green/fresh/citrus fruits, and exotic fruits/stone fruits/tropical fruits. This primary factor mainly benefits from the contribution of the following sensory descriptors: existence and perceived intensity of a maceration stage, floral notes, green/fresh/citrus fruits, exotic fruits/stone fruits/tropical fruits, red fruits, berries/forest fruits, overripe fruits, spice notes, bitterness, and astringency.
The second factor, accounting for about 19% of the variability, is strongly positively correlated with overall olfactory intensity, acidity/sourness, unctuousness, finish/post-taste persistence, and overall evaluation. In terms of explanatory power, this second factor mainly seems to be influenced by descriptors such as overall olfactory intensity, floral notes, green/fresh/citrus fruits, exotic fruits/ stone fruits/ tropical fruits, spice notes, acidity/sourness, sweetness, unctuousness, finish/post-taste persistence, and overall evaluation.
Along with the previous two factors, the third increases the total explained variance to 81%. This factor is strongly positively associated with vegetal/herbal notes, Maillard-type notes, other specific notes, sweetness, and unctuousness, while showing strong negative correlations with overall olfactory intensity, red fruits, and overall evaluation. Notably, this third factor is characterised by the following descriptors: the existence and perceived intensity of a maceration stage, overall olfactory intensity, vegetal/herbal notes, red fruits, Maillard-type notes, other specific notes, sweetness, bitterness, and unctuousness. Although visual stimuli from tasting in transparent glasses are presented, the visual cues already clearly reveal the grouping of samples based on the colour of the wines, as shown in Figure 7. The other perceived sensory descriptors grouped the samples into slightly different pairs, even though the ‘clusters’ identified by 'elbow' rules are similar to those associated with the tastings in opaque glasses.
For sensory descriptors that showed a statistically significant probability (<0.0001) of obtaining the F statistic value under the null hypothesis, a Principal Components Analysis model was used to verify, by comparing the statistical contexts related to the two types of tastings – without and with visual stimuli – the biplot representations of the tasters' notes. As shown in Figure 8, the tasters were not significantly misled by the absence of visual stimuli. The factor F1, which describes roughly 77% of the data variability, is represented by the horizontal axis, while the F2 factor, which accounts for 10% of the data variability, is represented by the vertical axis.
3.3. Data related to the context of the winemaking method
To ensure considerable variability among the analysed samples, wines produced using different vinification methods were selected. The difference between a ‘Blanc de noir’ and a red wine, both made from the same harvest of black grapes, is evident. The main physicochemical factors affecting the sensory differences between these wines mainly arise from the transfer of compounds from the grape skin to the wine via must during maceration. Finally, the variability of sensory descriptors related to physicochemical parameters was confirmed using a linear regression model for each key parameter determined through instrumental analysis. To provide a comprehensive view of how the main physicochemical parameters influence the sensory descriptors highlighted in the sensory sheet, the graphical representation was limited to the values where Pr > F is less than 0.05. Figure 9 illustrates the explanatory power of the influence of the independent physicochemical parameter on the dependent variable (sensory descriptors).
Moreover, an image showing the distinctive grouping of the ‘Blanc de noir’ and red wine samples used in the current study, based on the determined physicochemical parameters, can be seen in Figure 10. The F1 factor, which accounts for approximately 49% of the data variability, is represented on the horizontal axis, while the F2 factor, explaining about 28% of the data variability, is represented on the vertical axis.
In Figure 10, the isolated position of the coordinates related to wine sample V4 can be observed, which results from the high level of total glucose and fructose, 6.8 g/L, compared to the other samples, which had an average of 0.42 g/L with a standard deviation of 0.35 g/l. It is clear that red wines are directly correlated with F1, which explains approximately 49% of the variability, while white wines are inversely correlated with F1.
4. Discussion
4.1. Effects of winemaking method on sensory perception
In this study, one main research goal was to establish whether a consistent pattern exists in the language and sensory knowledge employed by experts when describing the sensory characteristics of different wine types made from the same grape varieties. Some interactions were clearly identified, while others remain intuitive. For example, glucose can increase volatility, while ethanol can decrease it [22]. Mannoproteins can suppress the volatility of flavour compounds such as β-ionone, ethyl hexanoate, and octanal, while encouraging the release of others, including ethyl octanoate and ethyl decanoate [26]. Other examples related to the branched influences of wine’s compounds on volatility can be illustrated by the suppressive action of polyphenolics [27], glycerol [28] and polysaccharides [29].
Olfactory and gustatory sensory associations, including those from synesthetic aspects, can be amplified or diminished depending on vinification methods or technological processes used in grape processing workflows. This variability arises from the different vinification techniques and processes, which naturally involve a broad range of compounds extracted from grape berry components or produced during maceration, alcoholic fermentation, malolactic conversion, and ultimately, maturation and/or ageing.
The extraction of grape aroma compounds—chemical substances present in both free and glycosidically bound forms within the mesocarp vacuoles and the pericarp (immediately beneath the berry skin)—is primarily governed by diffusion and leaching processes. The rate and extent of this extraction depend on factors such as the nature of the compound, its concentration, localisation within the grape berry, and the specific processing conditions employed. Furthermore, factors affecting the extraction processes include temperature, duration, and intensity of maceration; the degree of clarification; and the solubility of the compound in the water–alcohol mixture. In addition to everything mentioned earlier, the concentration gradient between grape solids and wine, along with the chemical equilibria and reactions that occur during the fining process [29], can be encapsulated under the term ‘winemaking method’.
Brochet & Dubourdieu [30] argued that wine descriptions are inherently personalised and primarily meaningful to the taster, with experts showing limited ability to identify wines solely based on descriptions provided by others. Although about 3% of the estimated ten thousand volatiles in food products contribute to the volatile stimulus space across various food and beverage categories, it has been found that as few as forty key odourants in a food item significantly influence its primary odour [31]. This observation also applies to alcoholic beverages. These roughly forty key odourants can be divided into two main groups. The first group, known as the ‘aroma buffer’[32], comprises twenty–seven components containing aroma molecules derived from alcoholic fermentation, such as isoamyl alcohol, isovaleric acid, and ethyl hexanoate [33]. These components display sensory traits mainly linked to fruity and floral qualities. The second group of key odourants, labelled ‘aroma vectors’, consists of molecules or groups of molecules that disrupt the ‘aroma buffer’ effect. They can be seen as the fundamental ‘aroma units’ responsible for transmitting specific aroma nuances [33]. ‘Aroma vectors’ can be understood as olfactory stimuli that can be clearly identified and classified based on their characteristic odour profile [34]. The ‘aroma buffer’ is consistently present in both white and red wines, with only certain ‘vector molecules’ or their structural analogues able to influence this aromatic buffer [35]. Without these vector molecules, wines may exhibit olfactory neutrality, making it difficult to distinguish between different grape cultivars.
The alignment of individual sensory perceptions can be understood by recognising recurring patterns, as human cognition naturally compares new stimuli with existing frameworks shaped by past experiences. These cognitive schemas serve as mechanisms to reduce uncertainty, improve predictability, and foster a sense of control over subsequent interpretations. In practice, tasters tend to structure their interactions with wine samples more on sensations than perceptions. Sensation, in contrast to perception, functions to detect stimuli, while perception assigns a meaning to them [36]. Sensation refers to the conscious or neurological response triggered by the stimulation of a sensory organ, nerve, or brain region. It encompasses the physiological process by which sensory organs (eyes, ears, nose, tongue, and skin) respond to external stimuli, producing a perceived experience. Furthermore, sensation includes the mental processes (such as seeing, hearing, or smelling) that result from direct external stimulation of the sensory organs [36].
One of the main aspects of sensory parameter analysis is that the sense of smell accounts for 75%–95% of the influence that flavours have. This is further explained by the fact that around 75% of human emotions are triggered by odours associated with pleasure, well–being, emotion, and memory [36]. One of the findings of the present study, as shown in Figure 8, supports the conclusion that the sense of smell can override the absence of visual cues, especially for tasters with extensive experience.
Even when tastings were conducted with either opaque or transparent glasses, the tasters' notes grouped the red wines based on descriptors related to the presence and perceived intensity of a maceration stage, red fruits, berries, or forest fruits, along with other specific notes, bitterness, and astringency. Additionally, the values linked to these descriptors correlated with those associated with overripe fruits and spicy notes. All statistical data for these descriptors indicate a direct relationship with wines produced using red winemaking techniques. Given the blind tasting conditions where participants were unaware of the samples' origins, and considering Lesschaeve's findings that experts can effectively utilise their cognitive faculties—though when they know the wines beforehand, they can more precisely articulate sensory perceptions, even when specific components are not detected [37]—the grouped values of the tasters' notes suggest that sensory features are connected to winemaking methods.
The sensory language used by experts in wine description is organised within a framework defined by typological classifications. A wine evaluator does not conduct a separate analysis of individual sensory traits but instead makes a comparative assessment of the overall cognitive associations evoked by the sample. Terminological conventions used by connoisseurs maintain a consistent connection with the wine's colour properties; the complex organoleptic profile is then expressed through descriptors typically associated with objects of a similar nature or shades [38]. The sensory detection of green fruit, citrus notes, and stone fruit components (qualities strongly associated with yellow hues) showed statistically significant improvement in the evaluation of white wines. In contrast, the perception of red fruit, anthocyanin–rich fruit, and woody characteristics (factors linked with violet and ruby hues) exhibited notable enhancement in the organoleptic assessment of red wine samples [39].
In the white wine group, the main separation criterion identified was an inverse relationship with the F1 factor, which represents the influence of physicochemical parameters and is strongly associated with volatile acidity, lactic acid, and pH levels. Sample V4 shows a notable deviation from both wine colour groups, driven by the F2 factor, which has strong correlations with parameters related to residual sugars.
Based on the structured olfactory framework and integrative cognitive associations in the case of white wines, the identification of the olfactory characteristics of monoterpenes, which have a strong aroma and low sensory thresholds [40], can trigger the entire sensory evaluation process.
4.2. The influence of tasting context on sensory perception
Besides differences caused by the winemaking method, the effects of visual stimulus suppression were examined. The statistical values from tasters' impressions recorded in the sensory sheets indicate that primarily the absence of certain features influences the sensory matrix used in evaluating the white wine samples. The descriptors with significant statistical values, which account for a large part of the variation, are those directly related to wines produced using the red vinification method.
As clearly shown in Figure 7, the values associated with the tasting sessions using opaque (Di_b) and transparent glasses (Di), respectively, for each of the sensory descriptors, including the existence of a maceration stage and its perceived intensity, red fruits, forest fruits, spicy notes, Maillard notes, other specific notes, and astringency, are located in the same quadrant. The grouping pattern of red wines, in direct correlation with the respective descriptors, and white wines in inverse correlation with the same descriptors, was also maintained.
Among primates broadly, and humans in particular, visual processing is the primary sensory modality, guiding overall perceptual integration. In gustatory perception, this visual dominance is particularly significant, as visual input—especially chromatic information—substantially influences both our perceptual interpretation and identification of edible and drinkable substances [41]. Consistent with the hypothesis that oenological knowledge structures may be organised according to chromatic dimensions, a white wine artificially tinted red elicited significantly more red wine olfactory descriptors in participant evaluations than did the identical wine in its natural, uncoloured state [42].
According to current research, statistical data revealed a strong positive correlation between the values quantifying the presence of a sensory descriptor during the maceration stage and its perceived intensity, which was assessed solely through olfactory evaluation. This includes descriptors such as berries/forest fruits as well as astringency, even when visual cues were excluded from the sensory evaluation protocol. Both descriptors show a high direct correlation with the group of red wines in Principal Component Analysis (Figure 3). Furthermore, a strong inverse correlation was identified between the values associated with vegetable notes and green/fresh/citrus fruits, and those associated with red fruits and berries/forest fruits.
Some studies have indicated that recognising wine colours as either white or red by smell alone, without visual cues, generally does not perform well. The descriptors used to describe a wine’s aroma are mostly influenced by its colour, with colour associations often embedded in descriptive narratives, even if not explicitly mentioned. Empirical evidence shows that when the colour of white wine is artificially changed to resemble that of red wine, it triggers olfactory perceptions typically linked to red wine. These findings suggest that a wine’s colour qualities carry important sensory information, which can then influence individuals’ objective assessment of its taste features. Furthermore, this perceptual bias becomes more noticeable when visual access to the wine’s colour is available, compared to situations where such visual information is absent [42]. Conversely, other studies have shown that tasters, regardless of their oenological expertise, demonstrated a statistically significant ability to distinguish between red and white wines using only olfactory sensory input, while failing to reliably identify rosé varieties under the same sensory restriction conditions [2].
Summarising the results of this study, it is reasonable to argue that, in the absence of wine colour indicators, tasters generally demonstrate a fair ability to identify the group to which the sample belongs. For red wines, this discrimination seems to be based on direct correlations with specific descriptors, especially those associated with glycerol, phenols, volatile acidity, and ph. Conversely, white wine separation appears to be achieved through inverse correlations with these same physicochemical parameters, where lower values seem to help identify white wines. A slight increase in the strength of positive or negative correlations between pairs of descriptors indicating a colour concept is observed. This aligns with previous research suggesting that the sequence of wine presentation, with transparent glasses followed by opaque ones, may have affected judges' assessments, leading to higher scores for aroma intensity, possibly due to expectations. Furthermore, when wines were served in transparent glasses, descriptors containing terms that inherently imply colour were rated at higher intensities [39].
5. Conclusions
In the current study, it was observed that a panel of experts could successfully distinguish between white and red wine samples—produced from the same grape variety and with visual cues intentionally minimised—with statistically significant accuracy. For red wines, it was found that the sensory perceptions induced by the notable presence of glycerol, phenols, volatile acidity, and a higher pH level, characteristic of the related winemaking process, are the factors that lead to correct identification. In the case of white wines, a negative correlation among the descriptors indicated that the same physicochemical parameters maintain their essential role, even if through an indirect mechanism characterised by their non-detection. Important sensory parameters such as the existence of a maceration stage and perceived intensity of it, berries/ forest fruits, astringency, and red fruits, which tasters use during blind tastings to distinguish the characteristic profiles of red wines from those of white wines, were found to be identical. However, identifying these parameters indicates the likelihood that a sample originates from red wine vinification, while their absence suggests it is from white wine vinification. Reducing the visual cues to zero doesn’t alter the specific features of either white or red wines to such an extent that the taster cannot distinguish them. Therefore, it can be considered that if the choice of a wine is based on its colour and the sensory perceptions do not meet expectations, the likelihood of it being consumed again is lower.
Contributions
Conceptualization, G.S.C. and C.E.L.; methodology, C.E.L.; validation, V.C.; formal analysis, G.S.C. and E.C.S.; investigation, G.S.C. and C.E.L.; resources, V.C.; data curation, G.S.C. and E.C.S.; writing—original draft preparation, G.S.C.; writing—review and editing, G.S.C., E.C.S. and C.E.L.; visualization, C.E.L.; supervision, V.C.
Funding
This research is supported by the doctoral grants program of Iasi University of Life Sciences, Romania.
Data Availability Statement
Not applicable.
Conflicts of Interest
The authors declare no conflicts of interest.
References
- D. A. Zellner; A. M. Bartoli; R. Eckard. Influence of Color on Odor Identification and Liking Ratings. The American Journal of Psychology 1991, vol. 104, pp. 547—561.
- J. Ballester; A. Hervé; J. Langlois; D. Peyron; D. Valentin. The Odor of Colors: Can Wine Experts and Novices Distinguish the Odors of White, Red, and Rosé Wines?. Chemosensory Perception 2009, vol. 2, pp. 203—213.
- Cardello. Consumer expectations and their role in food acceptance. In Measurement of food preferences. MacFie, H., Thomson, D. London, Eds.; Elsevier: London, 1994; pp. 253—297.
- E. Voirol; N. Daget. Comparative study of nasal and retronasal olfactory perception. Lebensmittel-Wissenschaft + Technologie 1986, vol. 19, no. 4, pp. 316—319.
- M. Auvray; C. Spence. The multisensory perception of flavor. Consciousness and Cognition 2008, vol. 17, pp. 1016—1031.
- P. Dalton; N. Doolitle; H. Nagata; P. Breslin. The merging of the senses: Integration of subthreshold taste and smell. Nature Neuroscience 2000, vol. 3, pp. 431—432.
- Z. Temerdashev; A. Abakumov; A. Kaunova; O. Shelud'ko; T. Tsyupko. Assessment of Quality and Region of Origin of Wines. Journal of Analytical Chemistry 2023, vol. 78, no. 12, pp. 1724—1740.
- R. Gutiérrez-Escobar; M. J. Aliaño—González; E. Cantos—Villar. Wine Polyphenol Content and Its Influence on Wine Quality and Properties: A Review. Molecules—MDPI 2021, vol. 26, no. 3, p. 718.
- B. Nemzer; D. Kalita; A. Y. Yashin; Y. I. Yashin. Chemical Composition and Polyphenolic Compounds of Red Wines: Their Antioxidant Activities and Effects on Human Health—A Review. Beverages 2022, vol. 8, no. 1.
- J. A. Gottfried; R. J. Dolan. The Nose Smells What the Eye Sees: Crossmodal Visual Facilitation of Human Olfactory Perception. Neuron 2003, vol. 39, pp. 375—386.
- W. V. Parr. Application of cognitive psychology to advance understanding of wine sensory evaluation and wine expertise. In Applied Psychology Research Trends. K.Kiefer, Ed.; Nova Science Publishers: New York, 2008; pp. 55—76.
- S. Chu; J. J. Downes. Odour—evoked Autobiographical Memories: Psychological Investigations of Proustian Phenomena. Chemical Senses 2000, vol. 25, no. 1, pp. 111—116.
- W. V. Parr. Demystifying wine tasting: Cognitive psychology's contribution. Food Research International 2019, vol. 124, pp. 230—233.
- E. P. Köster; P. Møller; J. Mojet. A “Misfit” Theory of Spontaneous Conscious Odor Perception (MITSCOP): reflections on the role and function of odor memory in everyday life. Frontiers in Psychology 2014, vol. 5.
- Anton Paar GmbH, https://www.anton-paar.com/corp-en/. Available online: https://www.anton-paar.com/corp-en/products/details/lyza-5000-wine/?srsltid=AfmBOoqXMtI_gxrWSnnbZ17Ctq2qVJP9loLK4y5QEAybcCYa6_EZl8XX. (Accessed on 02 05 2025).
- D. Cozzolino; R. Dambergs; L. Janik; W. Cynkar; M. Gishen. Analysis of grapes and wine by near infrared spectroscopy. Journal of Near Infrared Spectroscopy 2006, vol. 14, pp. 279—289.
- C. Patz; A. Blieke; R. Ristow; H. Dietrich. Application of FT—MIR spectrometry in wine analysis. Analytica Chimica Acta 2004, vol. 513, p. 81—89.
- WSET, Wine & Spirit Education Trust. Available online: https://www.wsetglobal.com/. (Accessed 04 May 2025).
- WSET, Wine & Spirit Education Trust, WSET Level 4 Systematic Approach to Tasting Wine® (2023, Issue 1.2). Available online: https://www.wsetglobal.com/knowledge-centre/wset-systematic-approach-to-tasting-sat/. (Accessed 16 April 2025).
- J. Harding; J. Robinson; T. Q. Thomas. The Oxford Companion to Wine, 5th ed.; Oxford University Press: Oxford, United Kingdom, 2023.
- H. Lawless; M. P. Schlegel. Direct and Indirect Scaling of Sensory Differences in Simple Taste and Odor Mixtures. Journal of Food Science 1984, vol. 49, no. 1, pp. 44—46.
- R. S. Jackson. Wine tasting - A professional handbook, 4th ed.; Nikki Levy: Chennai, India, 2023; p. 59.
- www.oiv.int, Available online: http://20.216.173.16/sites/default/files/import/tecnical_documents/ review-on-sensory-analysis-of-wine_en.pdf. (Accessed 01 May 2025).
- E. Qannari; P. Schlich; Matching sensory and instrumental data. Flavour in Food; Andree Voilley, Patrick Etievant, Eds; Woodhead Publishing Limited: Cambridge, England, 2006; pp. 98—116.
- International Organisation of Vine and Wine. Available online: https://www.oiv.int/standards/compendium-of-international-methods-of-wine-and-must-analysis/annex-a-methods-of-analysis-of-wines-and-musts/section-2-physical-analysis. (Accessed 15 May 2025).
- S. Lubbers; A. Voilley; M. Feuillat; C. Charpentier. Influence of Mannaproteins from Yeast on the Aroma Intensity of a Model Wine. Lebensmittel-Wissenschaft & Technologie 1994, vol. 27, pp. 108—114.
- M. Cameleyre; C. Monsant; S. Tempere; G. Lytra; J.-C. Barbe. Toward a Better Understanding of Perceptive Interactions between Volatile and Nonvolatile Compounds: The Case of Proanthocyanidic Tannins and Red Wine Fruity Esters—Methodological, Sensory, and Physicochemical Approaches. Journal of agricultural and food chemistry 2021, vol. 69, pp. 9895—9904.
- L. Robinson; S. E. Ebeler; H. Heymann; P. K. Boss; P. S. Solomon; R. D. Trengove. Interactions between wine volatile compounds and grape and wine matrix components influence aroma compound headspace partitioning. Journal of agricultural and food chemistry 2009, vol. 57, pp. 10313—10322.
- Voilley; V. Beghin; C. Charpentier; D. Peyron. Interactions between aroma substances and macromolecules in a model wine. Lebensmittel - Wissenschaft + Technologie 1991, vol. 24, pp. 469—472.
- J. Marais; C. Van Wyk. Effect of grape maturity and juice treatments on terpene concentrations and wine quality of Vitis vinifera L. cv. Weisser Riesling and Bukettraube. South African Journal of Enology & Viticulture 1986, vol. 7, no. 1, pp. 26—35.
- Dunkel; M. Steinhaus; M. Kotthoff; B. Nowak; D. Krautwurst; P. Schieberle; T. Hofmann. Nature’s Chemical Signatures in Human Olfaction: A Foodborne Perspective for Future Biotechnology. Angewandte Chemie 2014, vol. 53, pp. 7124—7143.
- V. Ferreira; A. De La Fuente-Blanco; M. P. Saénz-Navajas. A New Classification of Perceptual Interactions between Odorants to Interpret Complex Aroma Systems. Application to Model Wine Aroma. Foods 2021, vol. 10, 1627.
- V. Ferreira; A. De La Fuente; M. P. Saénz-Navajas. Wine aroma vectors and sensory attributes. In Managing Wine Quality, 2nd ed; Woodhead Publishing Series: Cambridge, UK, 2022; vol. 1 Viticulture and Wine Quality, pp. 3—39.
- Y. Ma; Y. Xu; K. Tang. Olfactory perception complexity induced by key odorants perceptual interactions of alcoholic beverages: Wine as a focus case example. Food Chemistry 2025, vol. 463.
- G. Reynolds. Managing Wine Quality, Woodhead Publishing Series: Cambridge, UK, 2022, vol. 1 Viticulture and Wine Quality.
- J. Moini; A. Logalbo; R. Ahangari. Sensation and Perception. Foundations of the Mind, Brain, and Behavioral Relationships Understanding Physiological Psychology 1st ed.; Nikki P. Levy: London, 2024, p. 115.
- Lesschaeve. Sensory Evaluation of Wine and Commercial Realities: Review of Current Practices and Perspectives. American Journal of Enology and Viticulture 2007, vol. 58, pp. 252—258.
- F. Brochet; D. Dubourdieu. Wine Descriptive Language Supports Cognitive Specificity of Chemical Senses. Brain and Language 2001, vol. 77, pp. 187—196.
- T. H. Nguyen; D. Durner. Sensory evaluation of wine aroma: Should color—driven descriptors be used?. Food Quality and Preference 2023, vol. 107.
- Mateo; M. Jiménez. Monoterpenes in grape juice and wines. Journal of Chromatography 2000, vol. 881, no. 1—2, pp. 557—567.
- Delwiche. The impact of perceptual interactions on perceived flavor. Food Quality and Preference 2004, vol. 15, pp. 137—146.
- G. Morrot, F. Brochet and D. Dubourdieu. The Color of Odors. Brain and Language 2001, vol. 79, no. 2, pp. 309—320.
Figure 1.
Graphical representation of the experimental design.
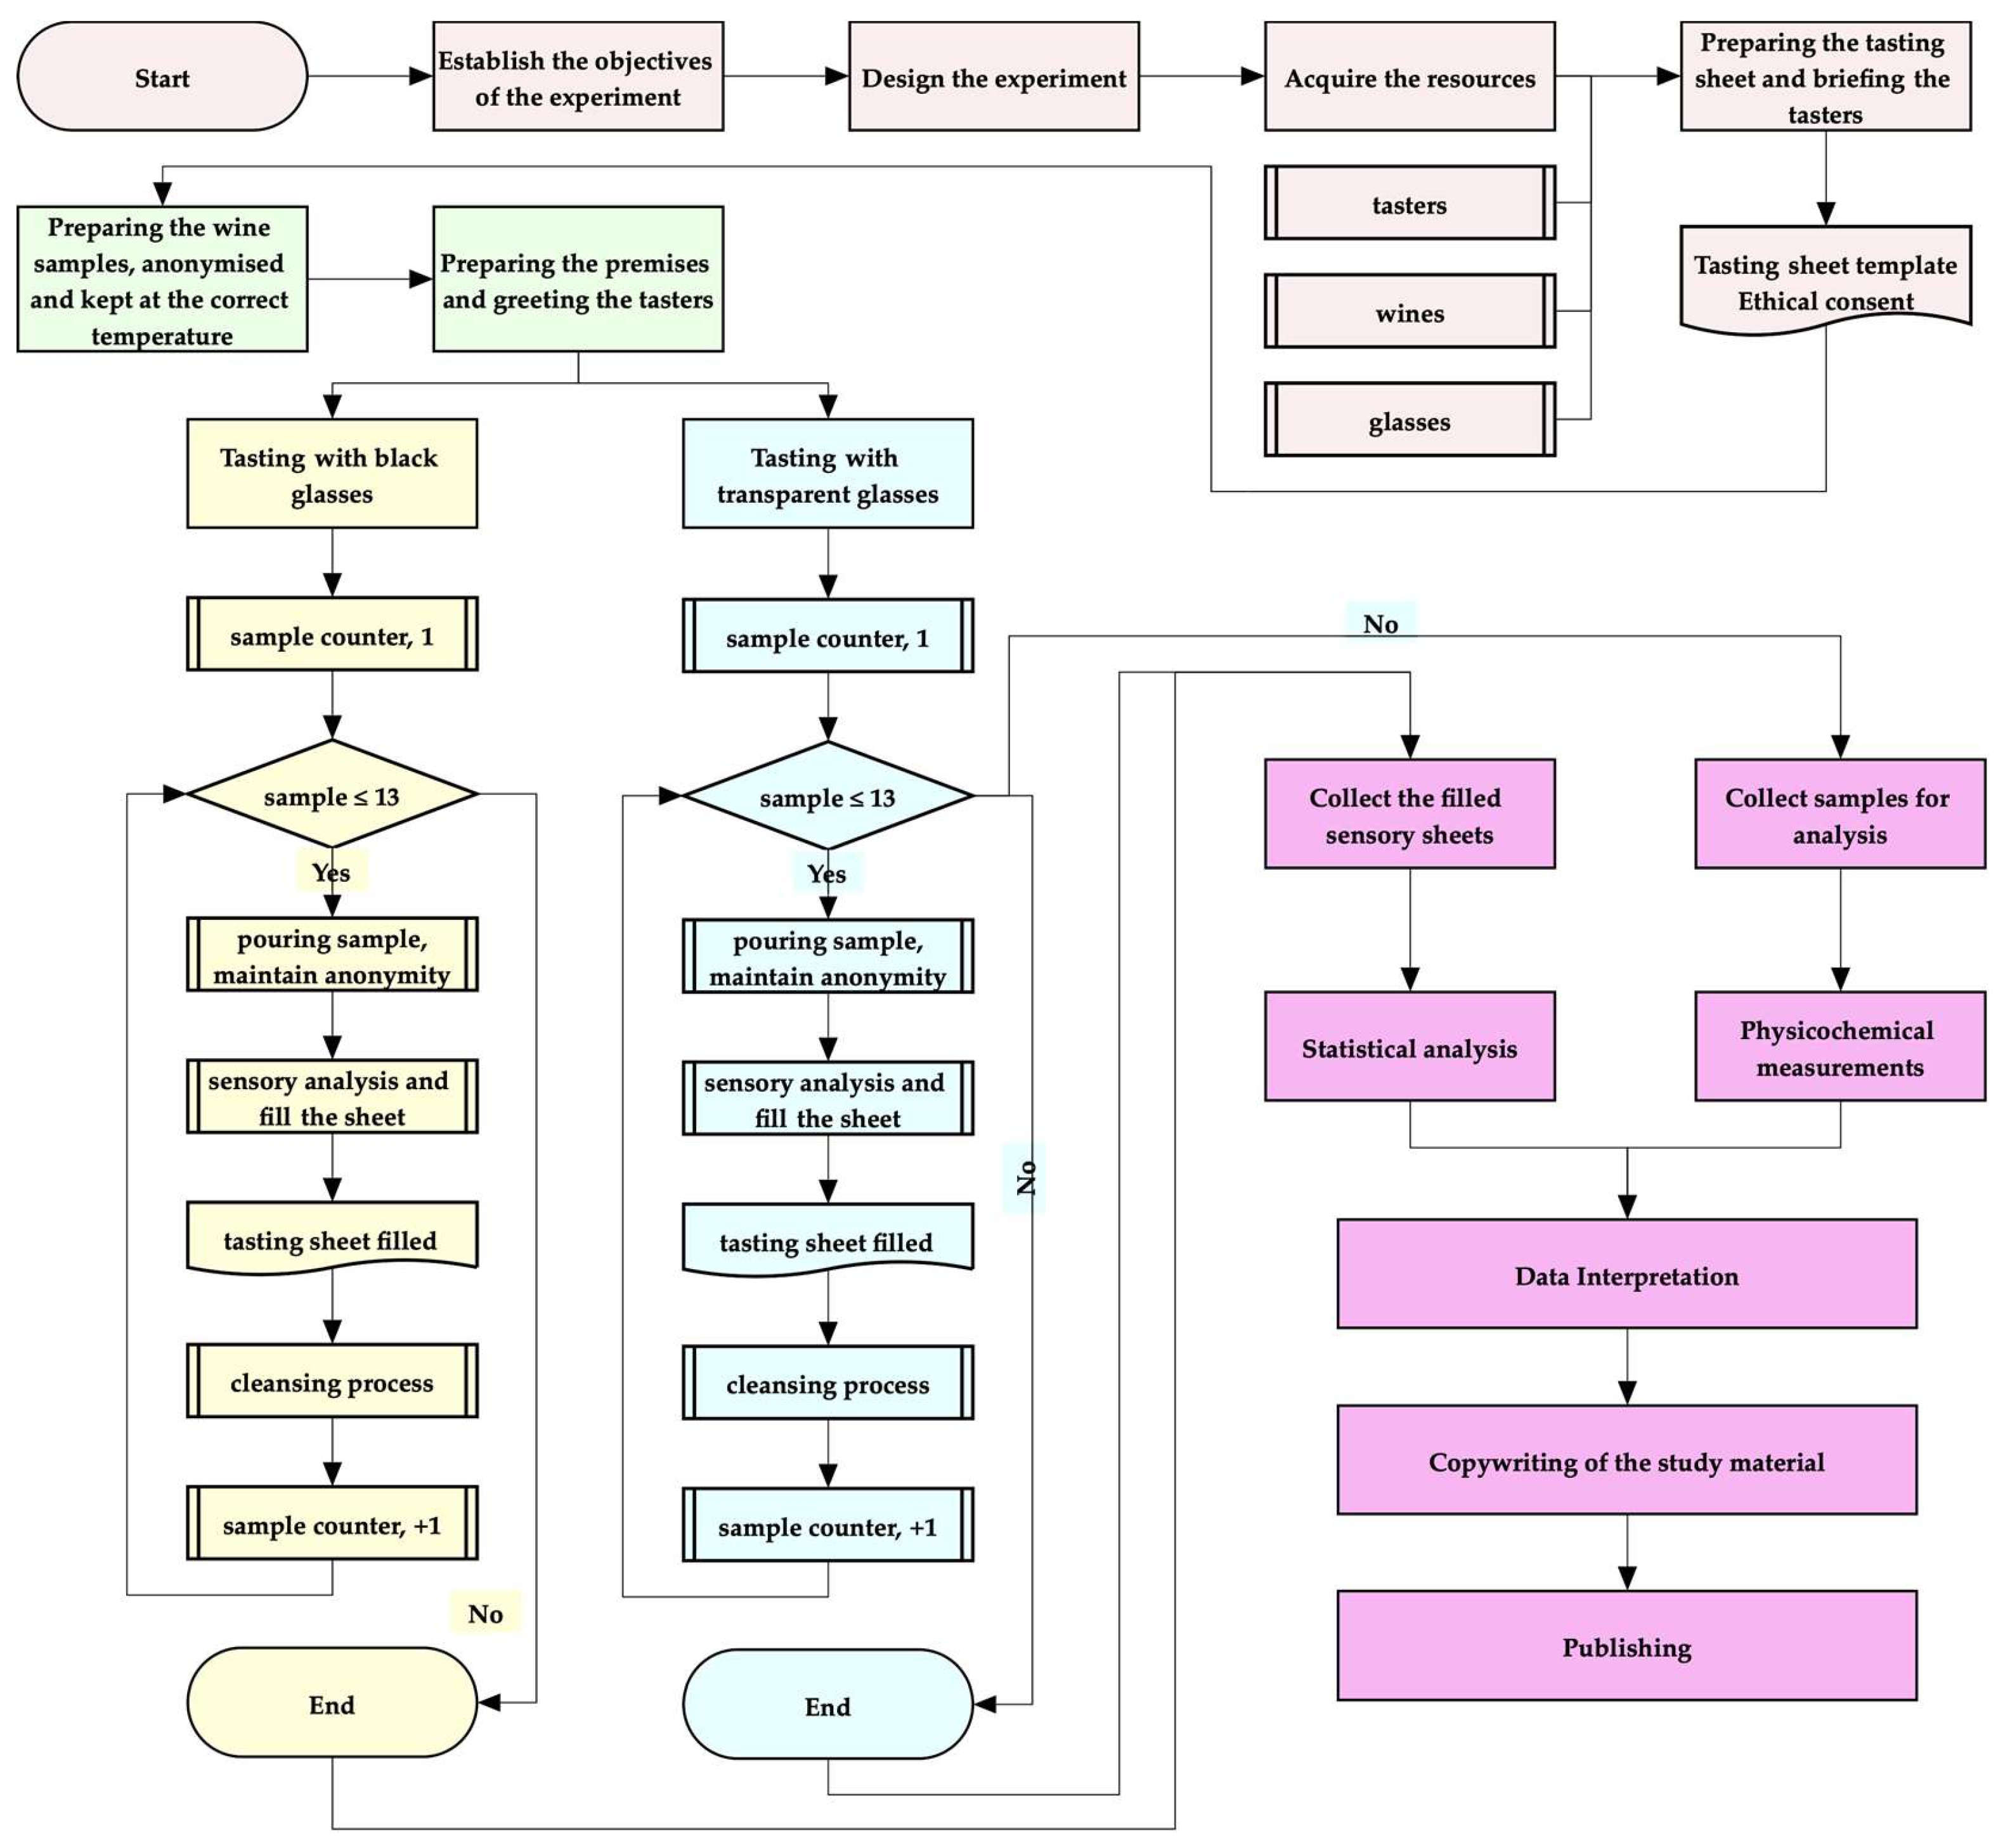
Figure 2.
Image of the correlation matrix for sensory descriptors. (a) Tasting session with opaque glasses; (b) Tasting sessions with transparent glasses. Dx_b, x=1–19, represents statistical values for sensory descriptors (broken down in Table 2) recorded during tasting sessions with opaque glasses, while Dx, x=1–19, has the same meaning but for tasting sessions with transparent glasses.
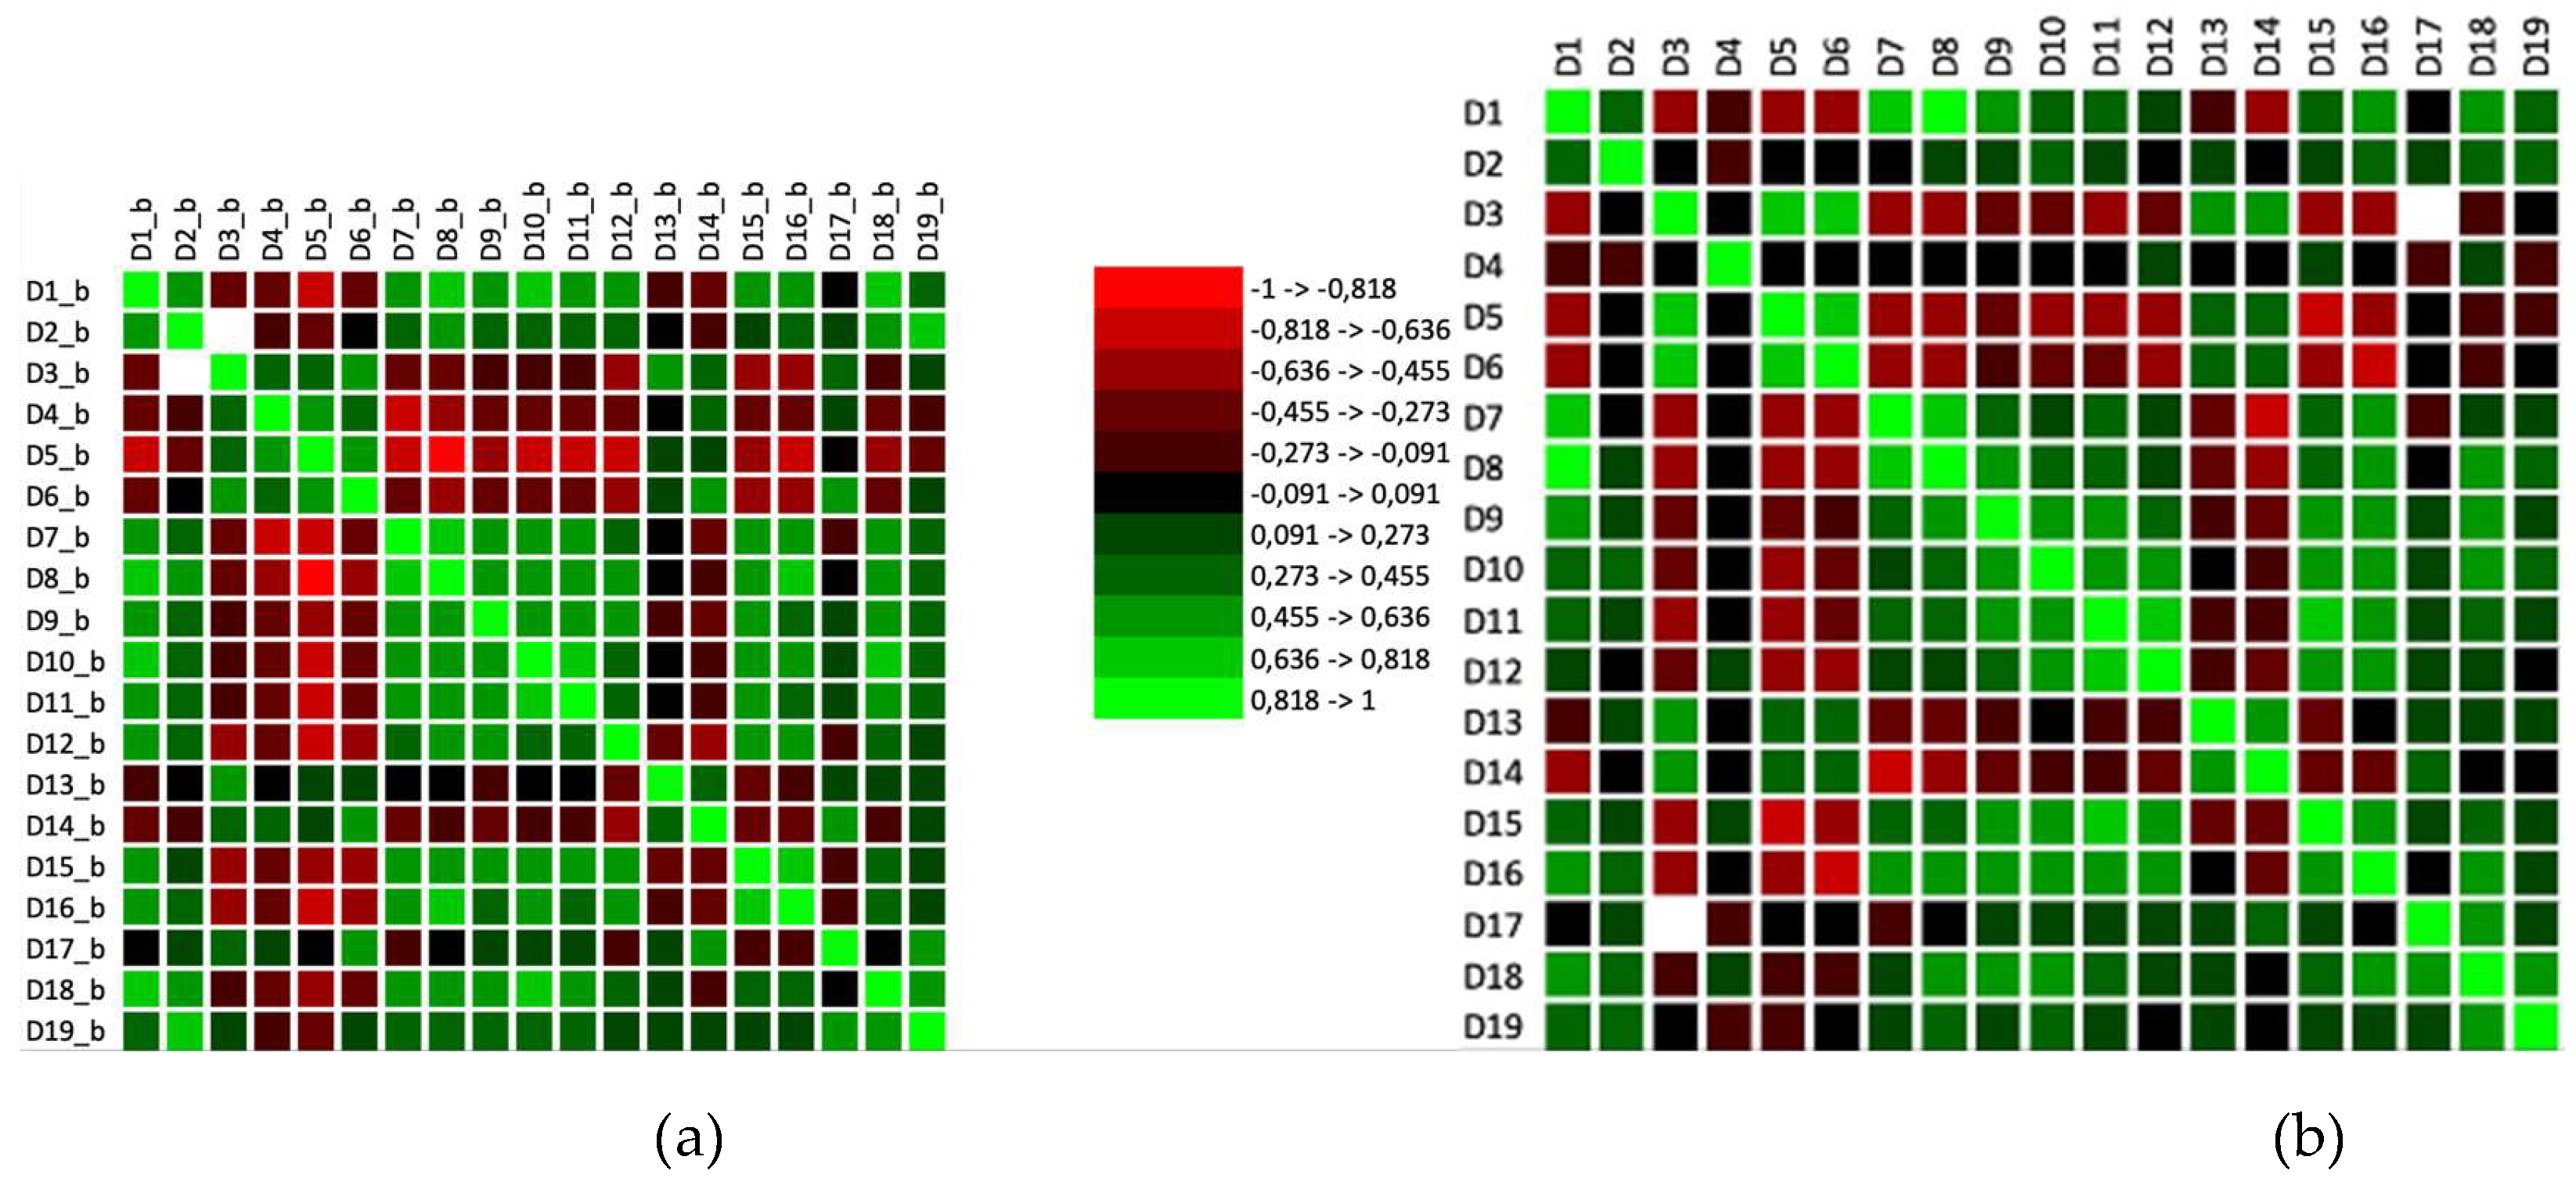
Figure 3.
Image of the matrix of coefficients of determination (Kendall) for sensory descriptors related to tasting with opaque glasses. (a) Tasting session with opaque glasses; (b) Tasting sessions with transparent glasses. Dx_b, x=1–19, represents statistical values obtained for sensory descriptors (listed in Table 2) recorded during tasting sessions with opaque glasses, whereas Dx, x=1–19, has the same meaning but pertains to tasting sessions with transparent glasses.
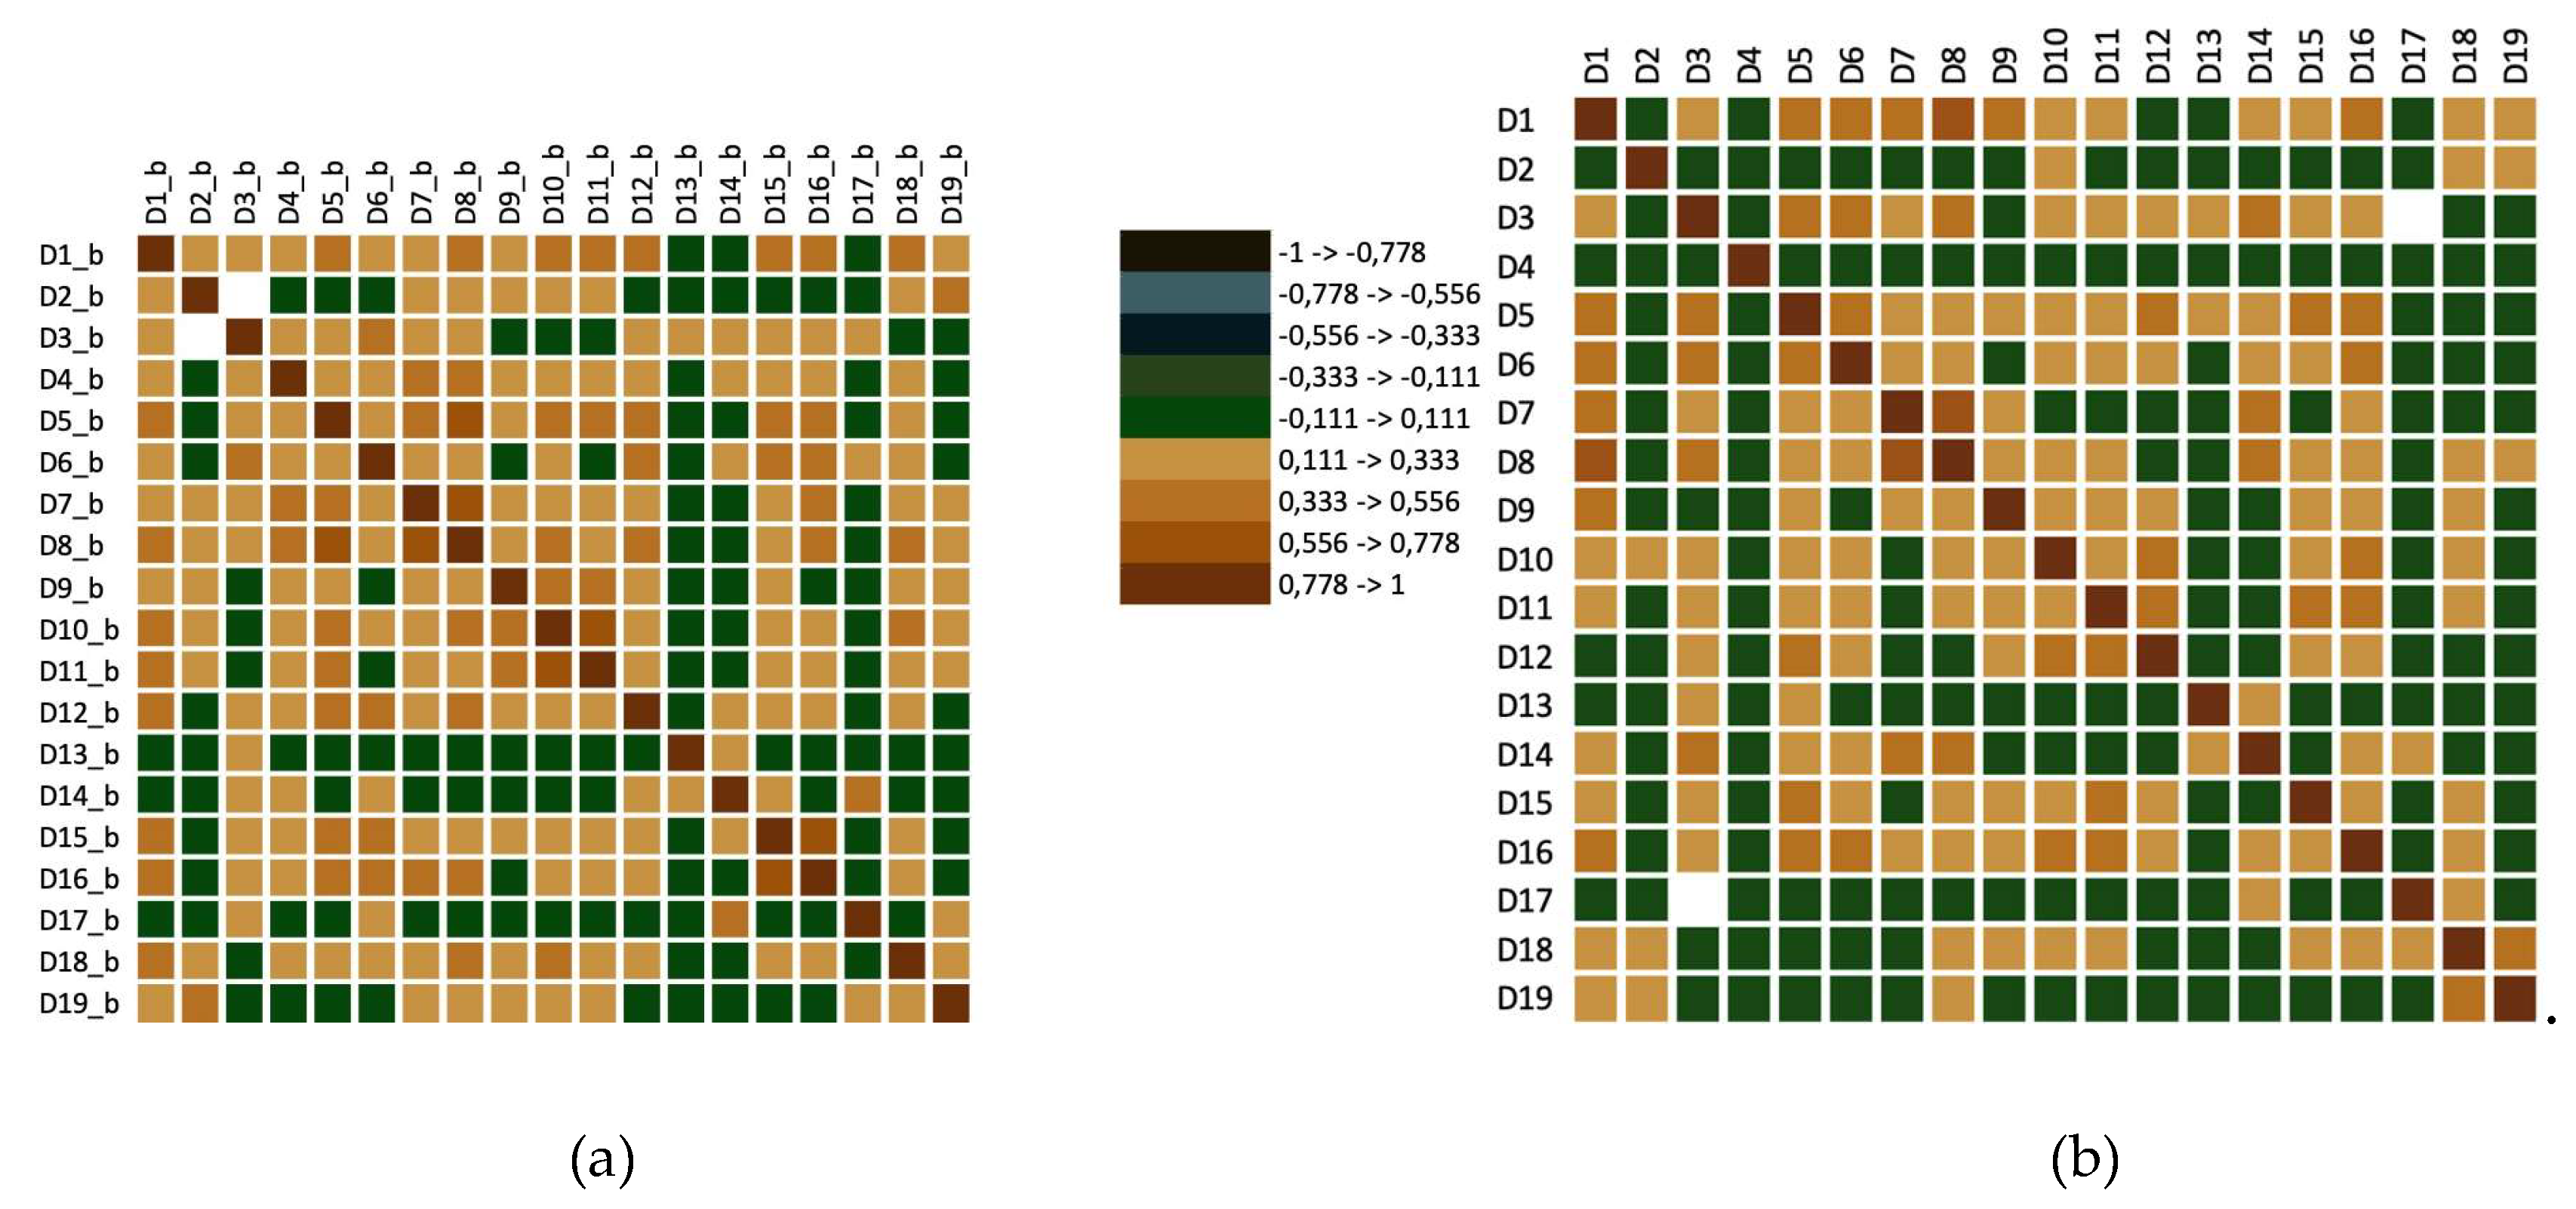
Figure 4.
Principal Component Analysis during opaque glasses tasting sessions. Dx_b, x=1–19, denotes statistical values obtained for sensory descriptors (detailed in Table 2) recorded throughout tasting sessions with opaque glasses. Vi, i=1-13, indicates the ID parameters of the samples according to the breakdown shown in Table 2.
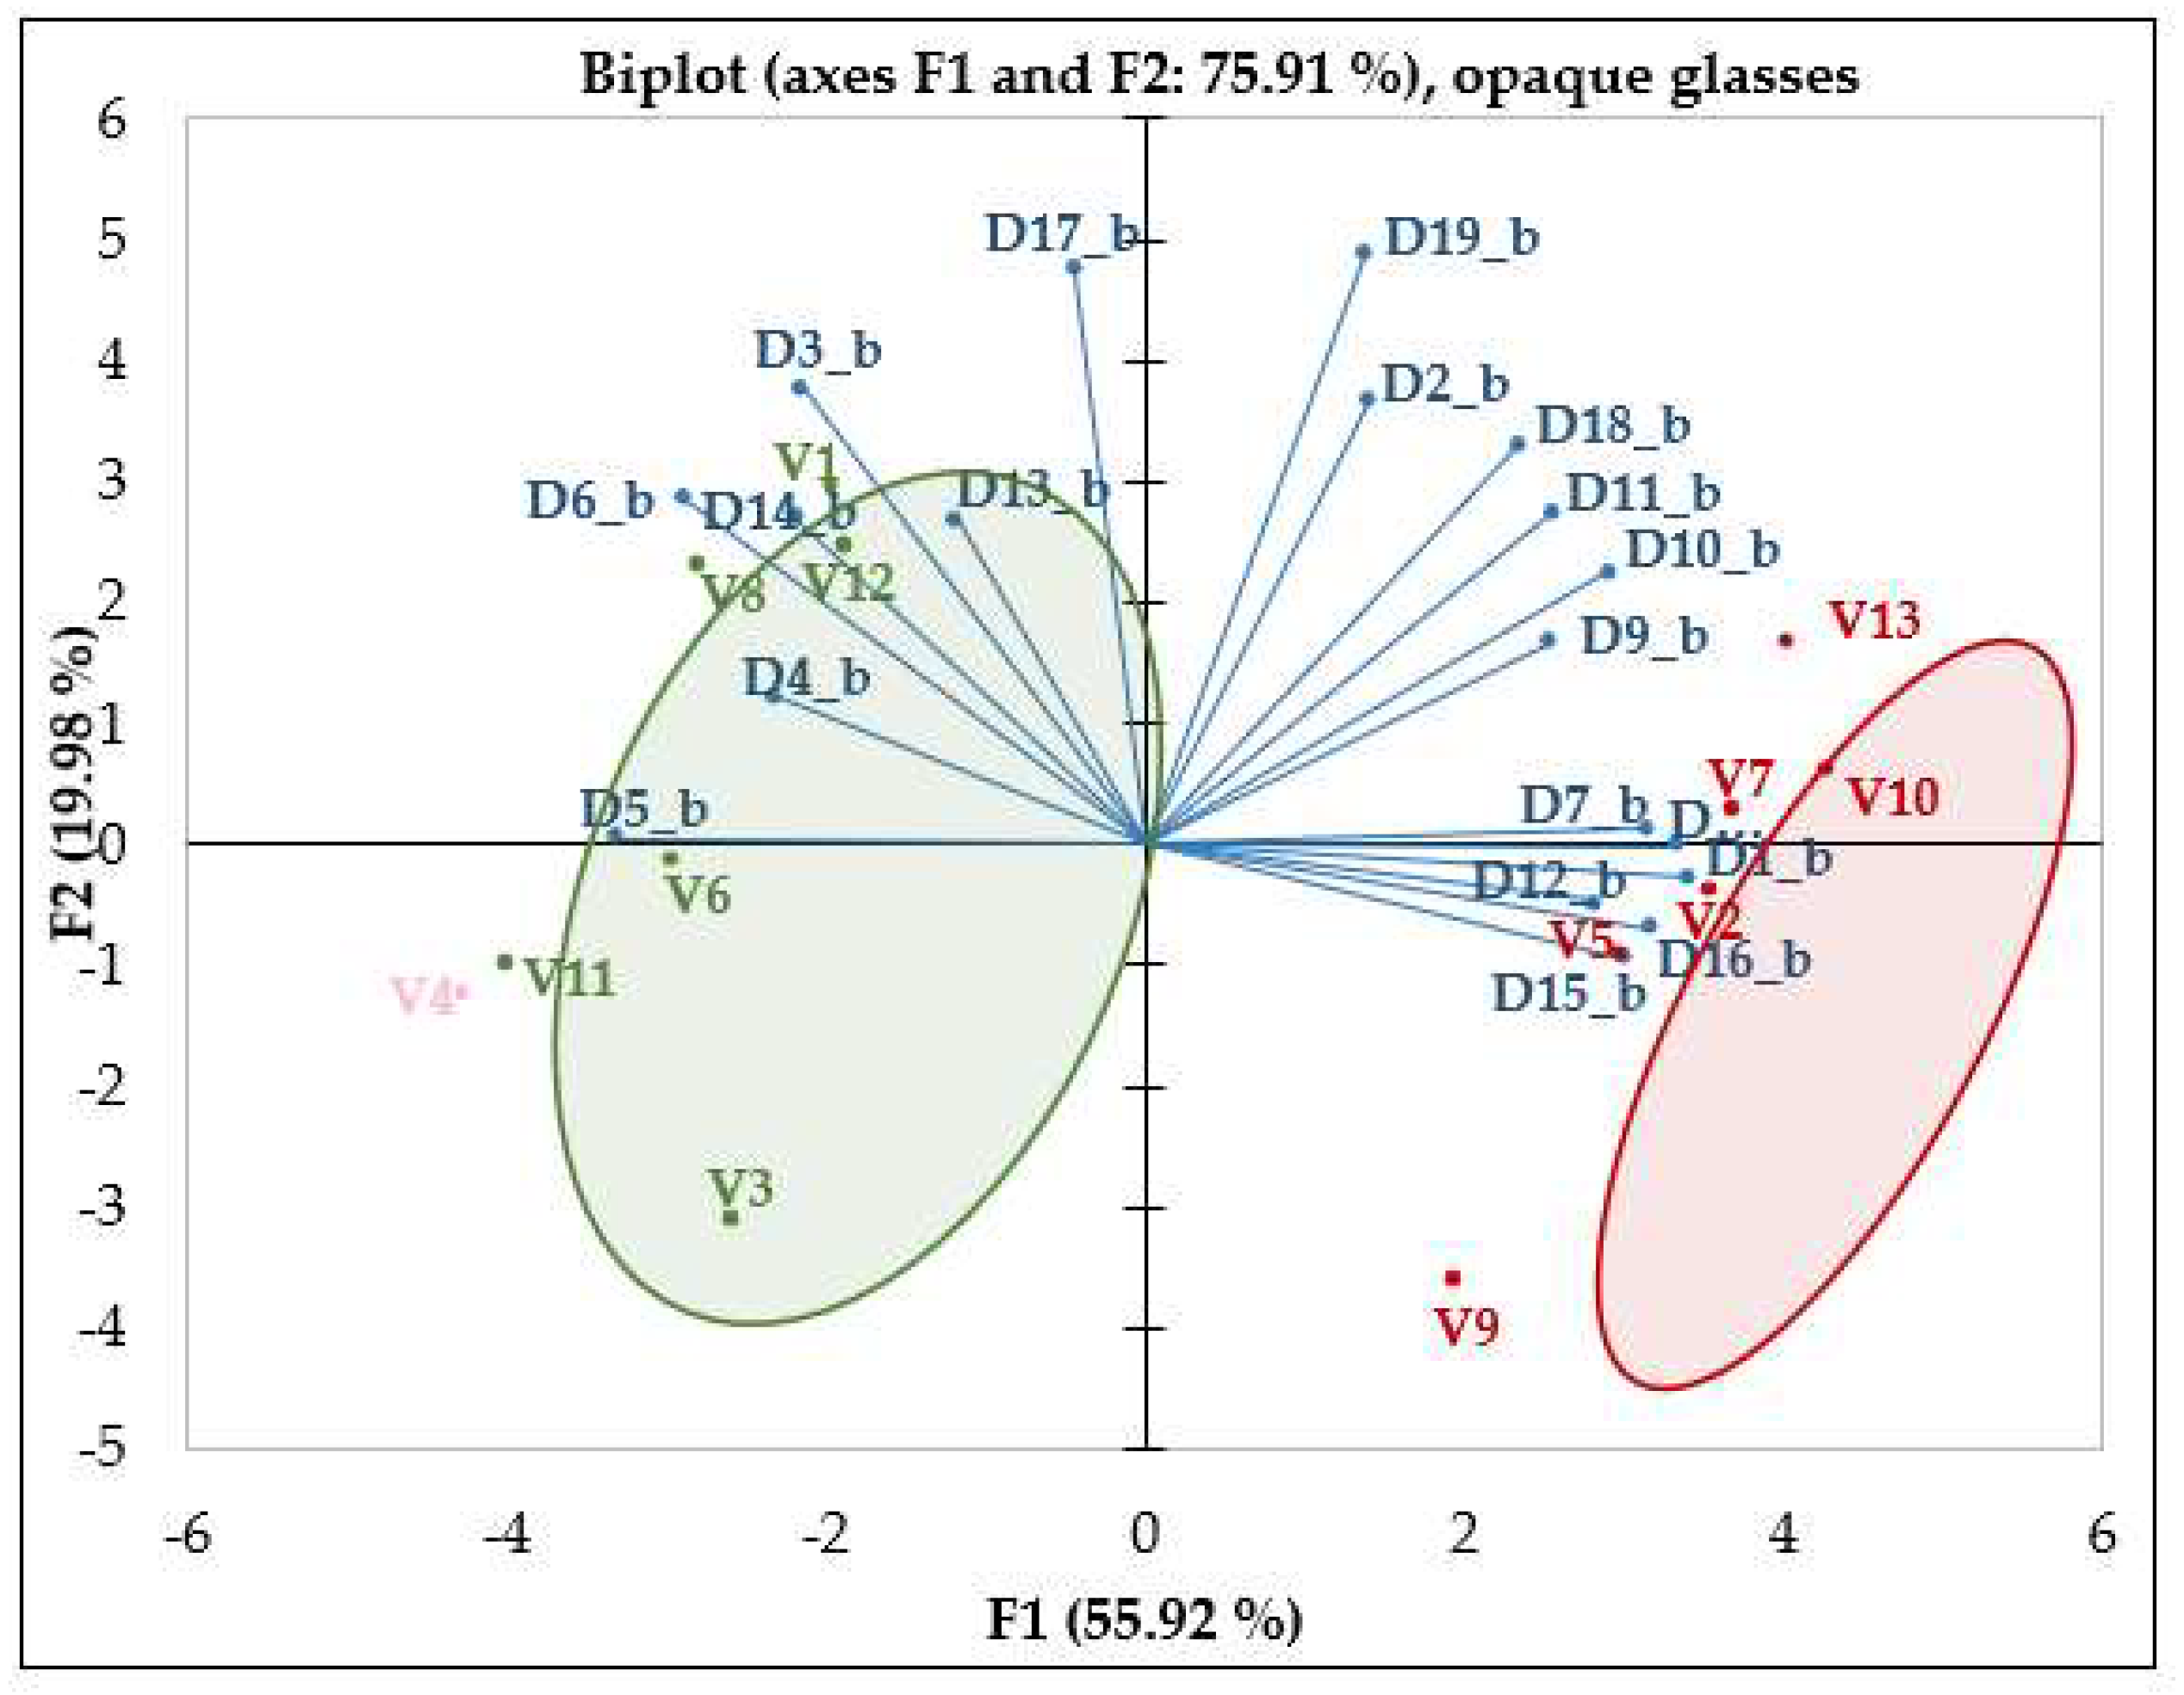
Figure 5.
Dendrogram drawn for opaque glasses tasting sessions. C1–cluster 1, mainly white wines; C2–cluster 2, exclusively red wines; Vk, k=1-13, represent the ID of the wine sample used, with the details provided in Table 1.
Figure 5.
Dendrogram drawn for opaque glasses tasting sessions. C1–cluster 1, mainly white wines; C2–cluster 2, exclusively red wines; Vk, k=1-13, represent the ID of the wine sample used, with the details provided in Table 1.
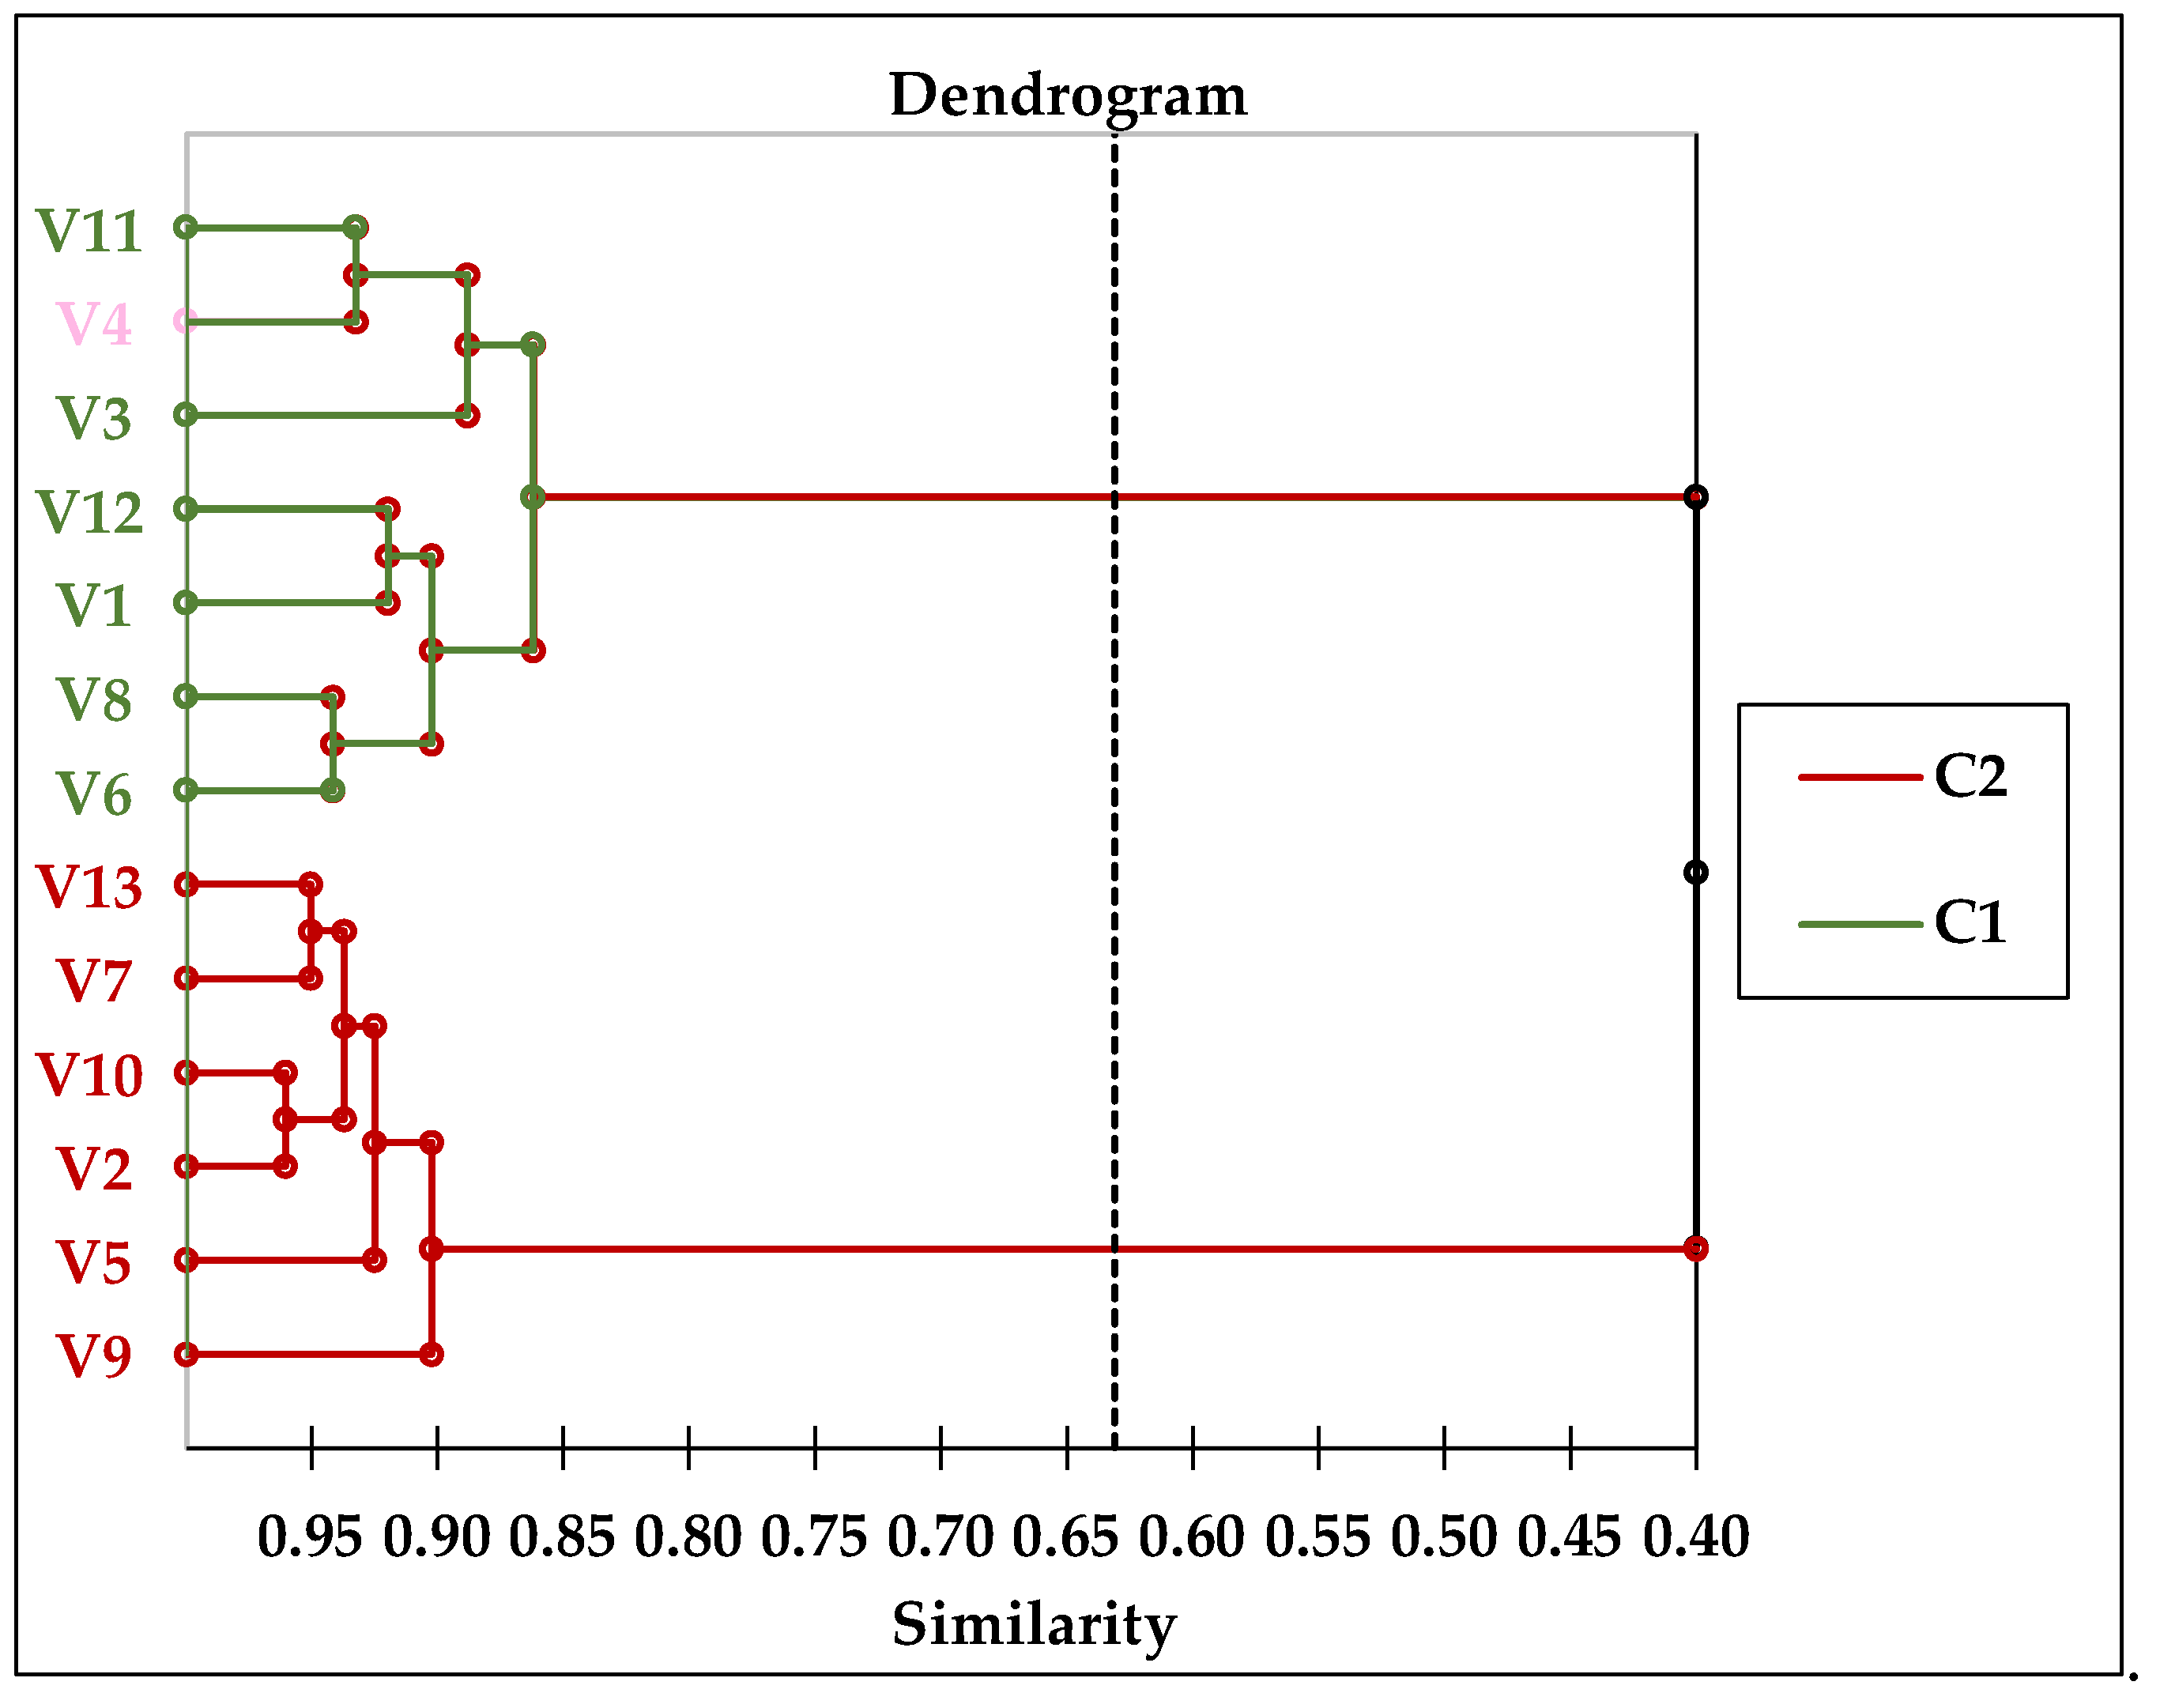
Figure 6.
Principal Component Analysis in transparent glasses tasting sessions.
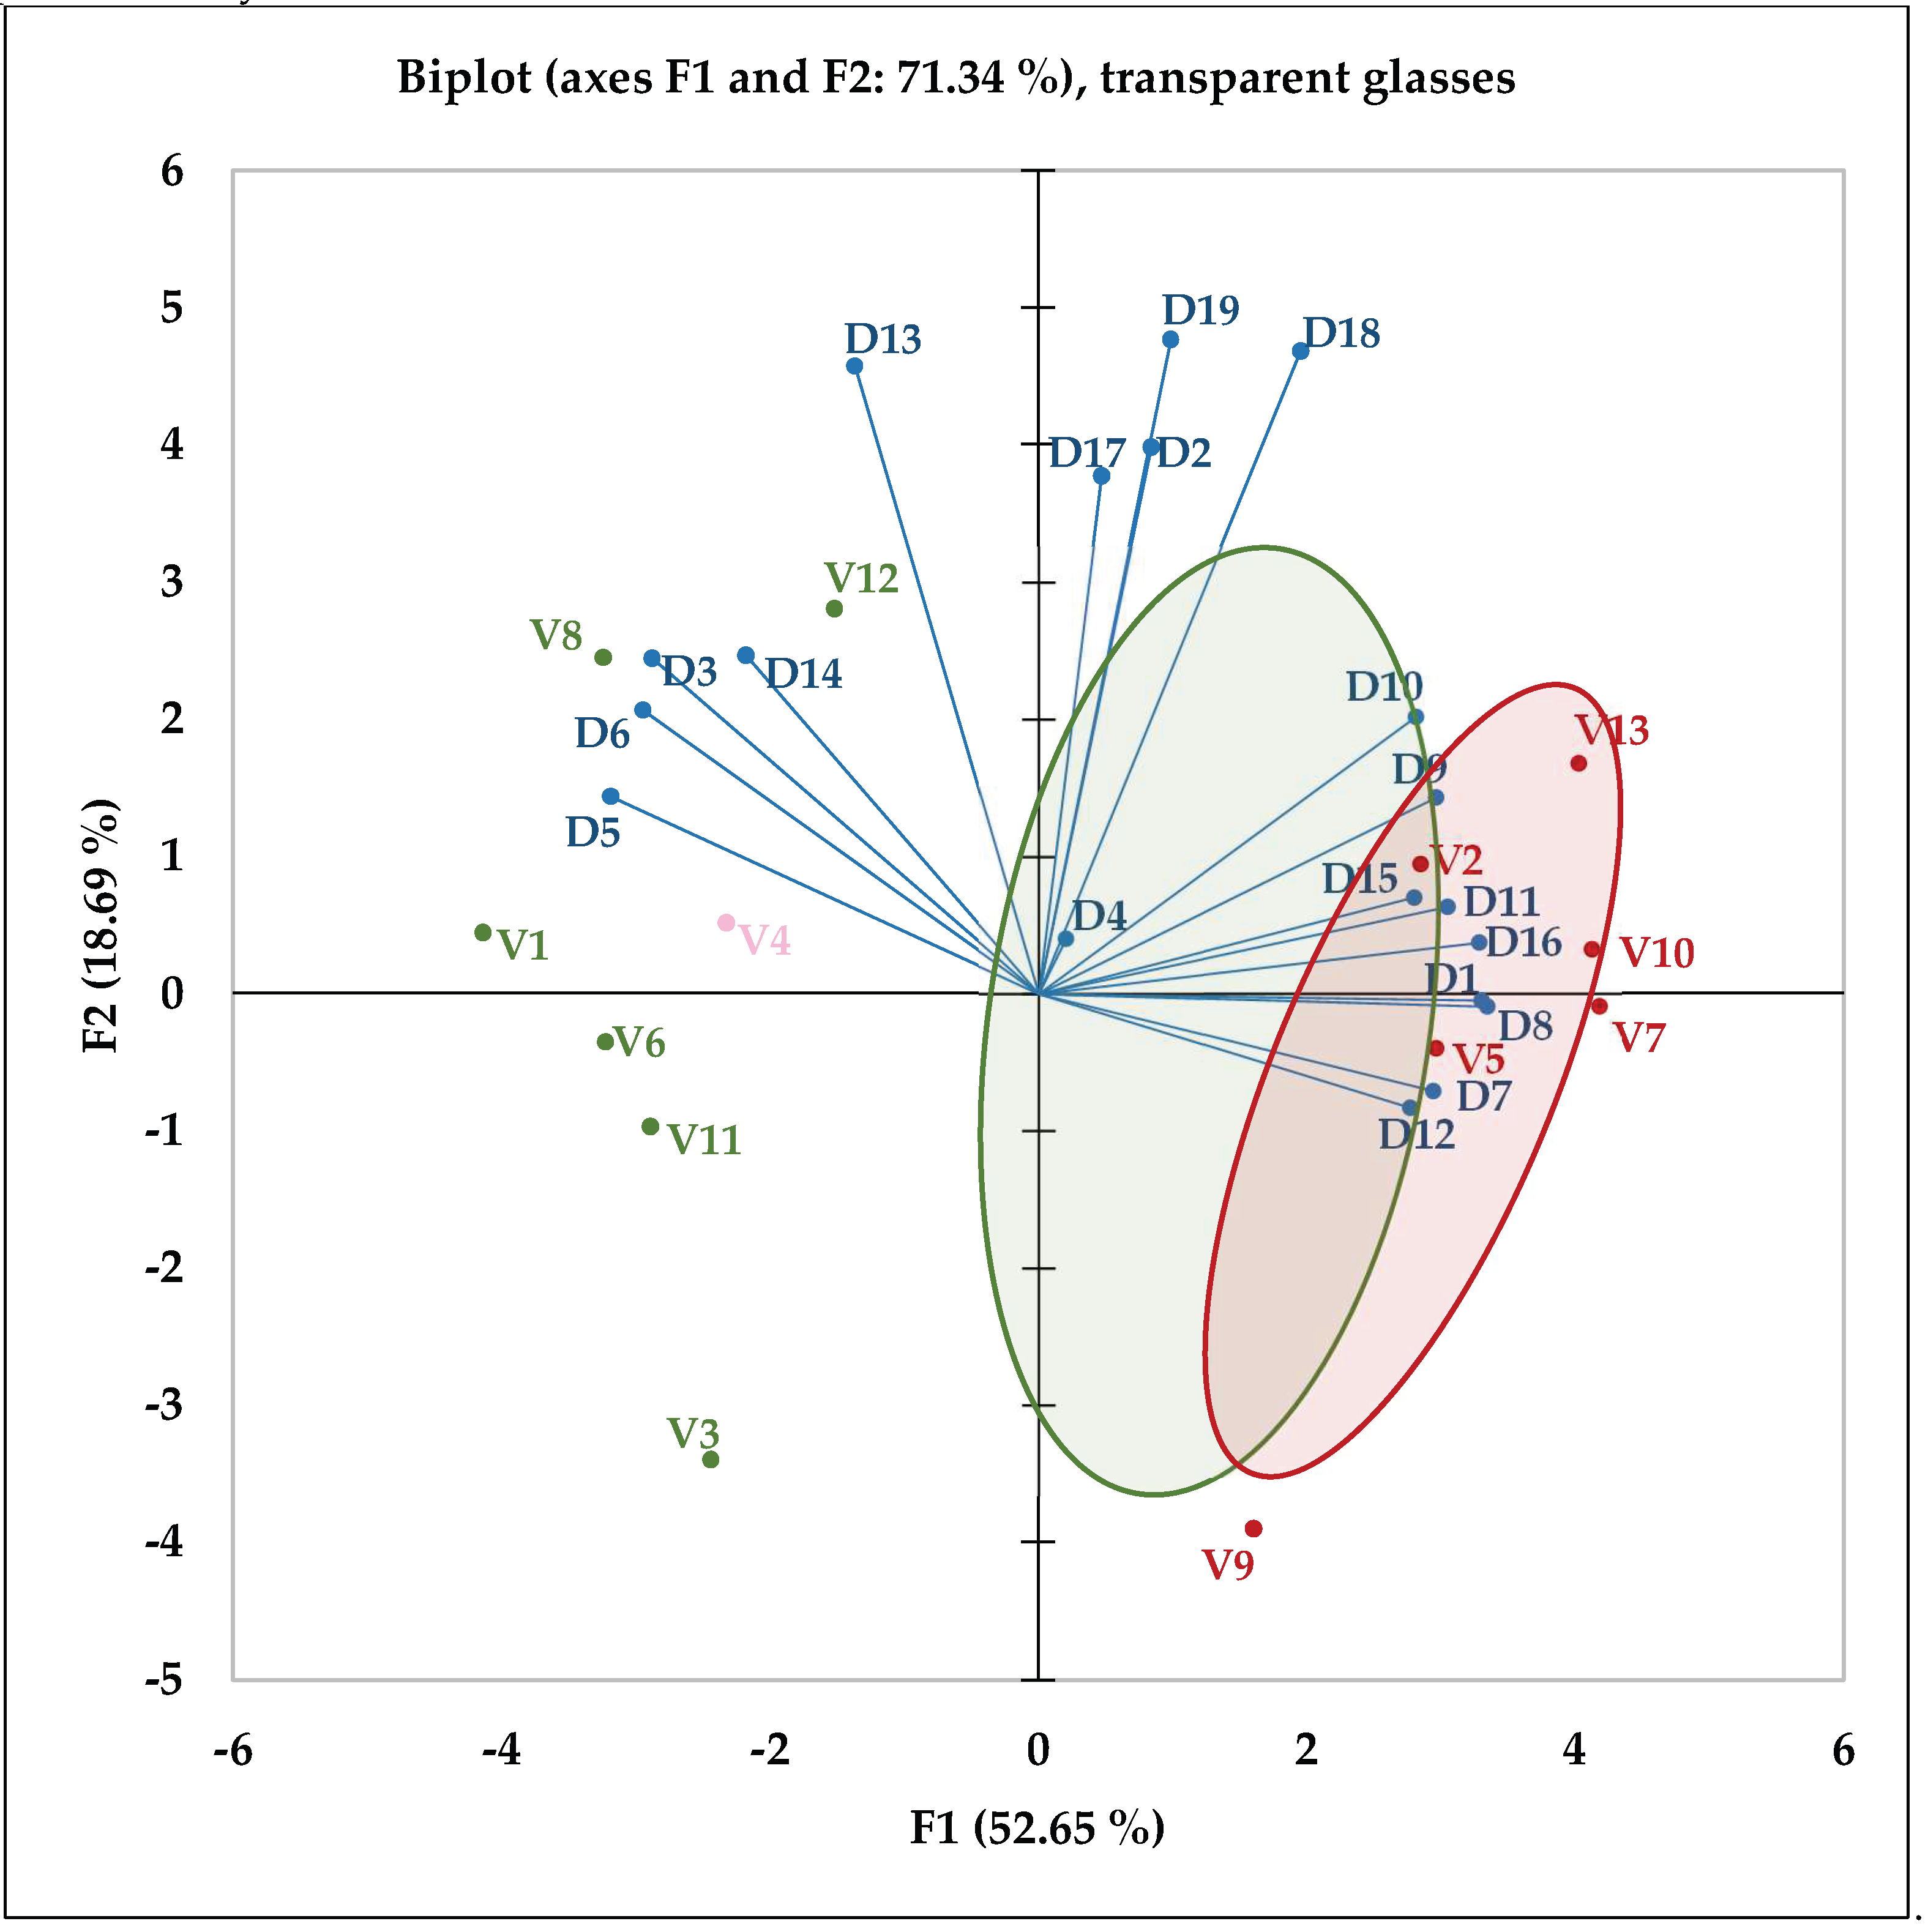
Figure 7.
A dendrogram was plotted for opaque glasses tasting sessions. C1–cluster 1, containing only white wines; C2–cluster 2, comprising exclusively red wines; C3–cluster 3, consisting solely of rosé wine; Vk, k=1-13, represents the ID of the wine sample used, with the meaning detailed in Table 1.
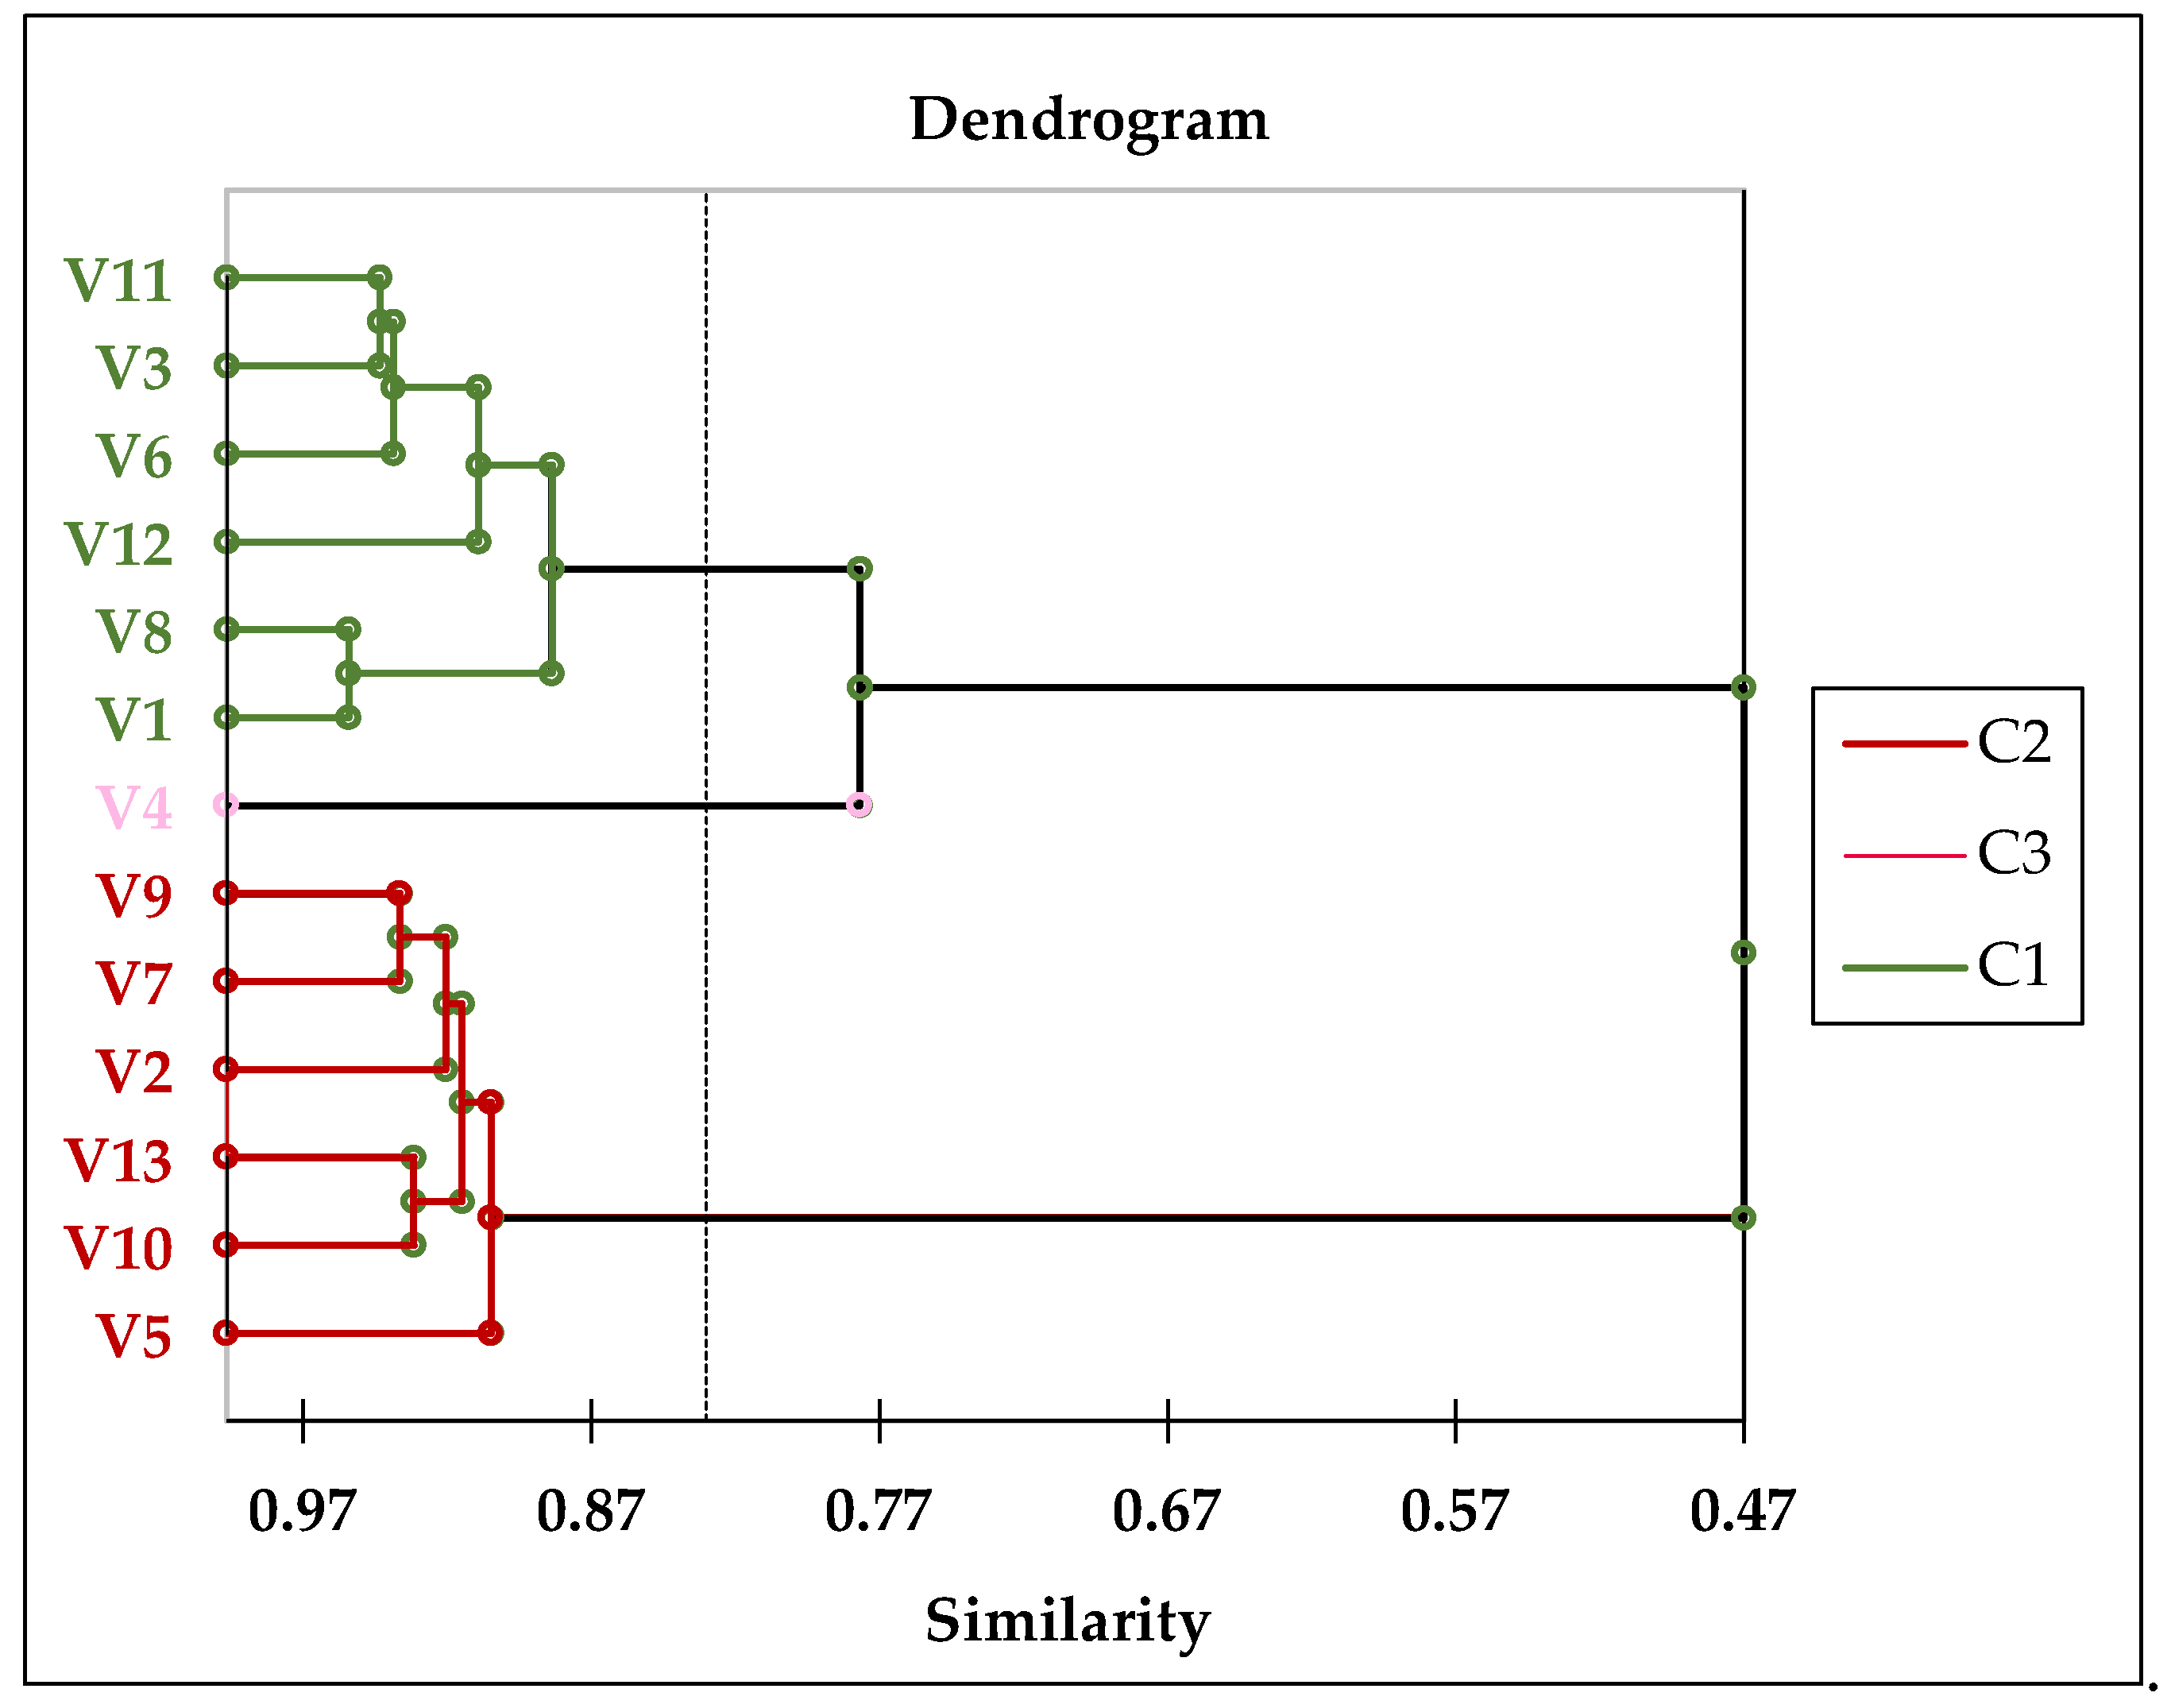
Figure 8.
Principal Component Analysis based on the overlapped tasting contexts, including opaque and transparent glasses.
Figure 8.
Principal Component Analysis based on the overlapped tasting contexts, including opaque and transparent glasses.
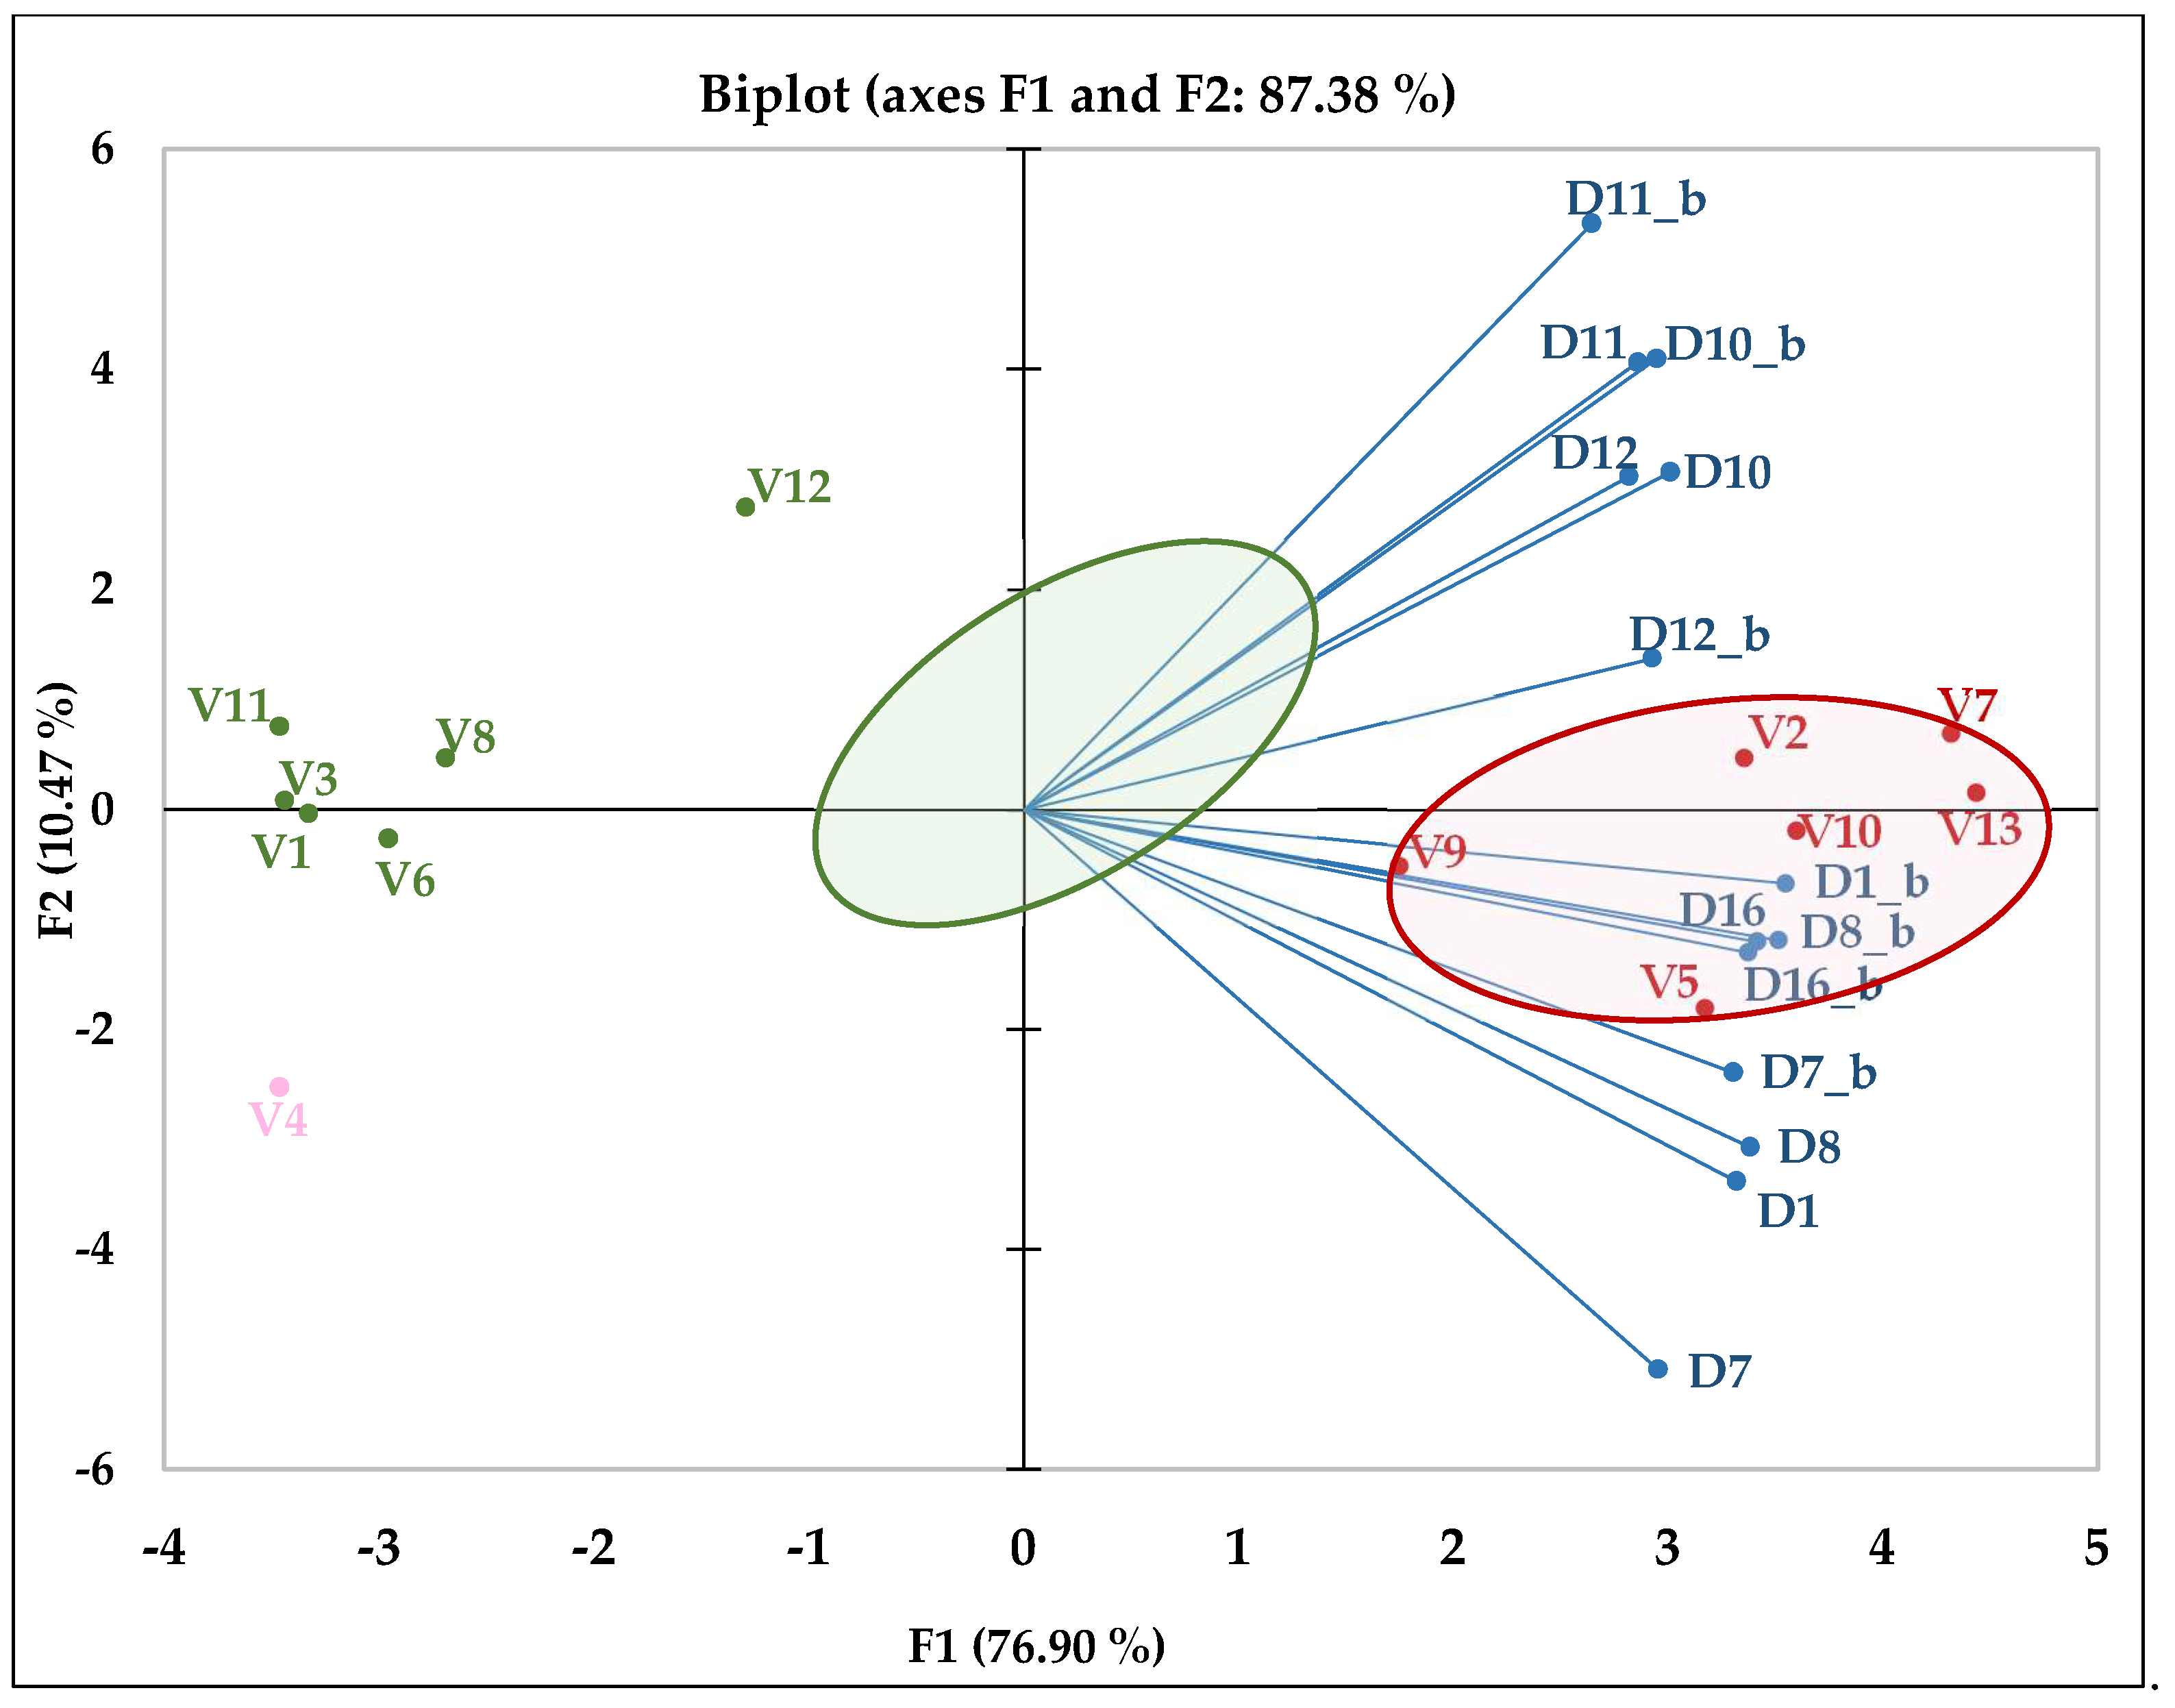
Figure 9.
The R² coefficient of determination for the significant p–value. The dependent variable, the sensory descriptors – marked with Di_b – are shown on the x-axis, where the meanings of i=1–19 are those listed in Table 2, and the y-axis indicates the level of explanatory power of the influence of the independent physicochemical parameter on each dependent variable. Only for Pr > F is it less than 0.05, the closer to 1, the more relevant.
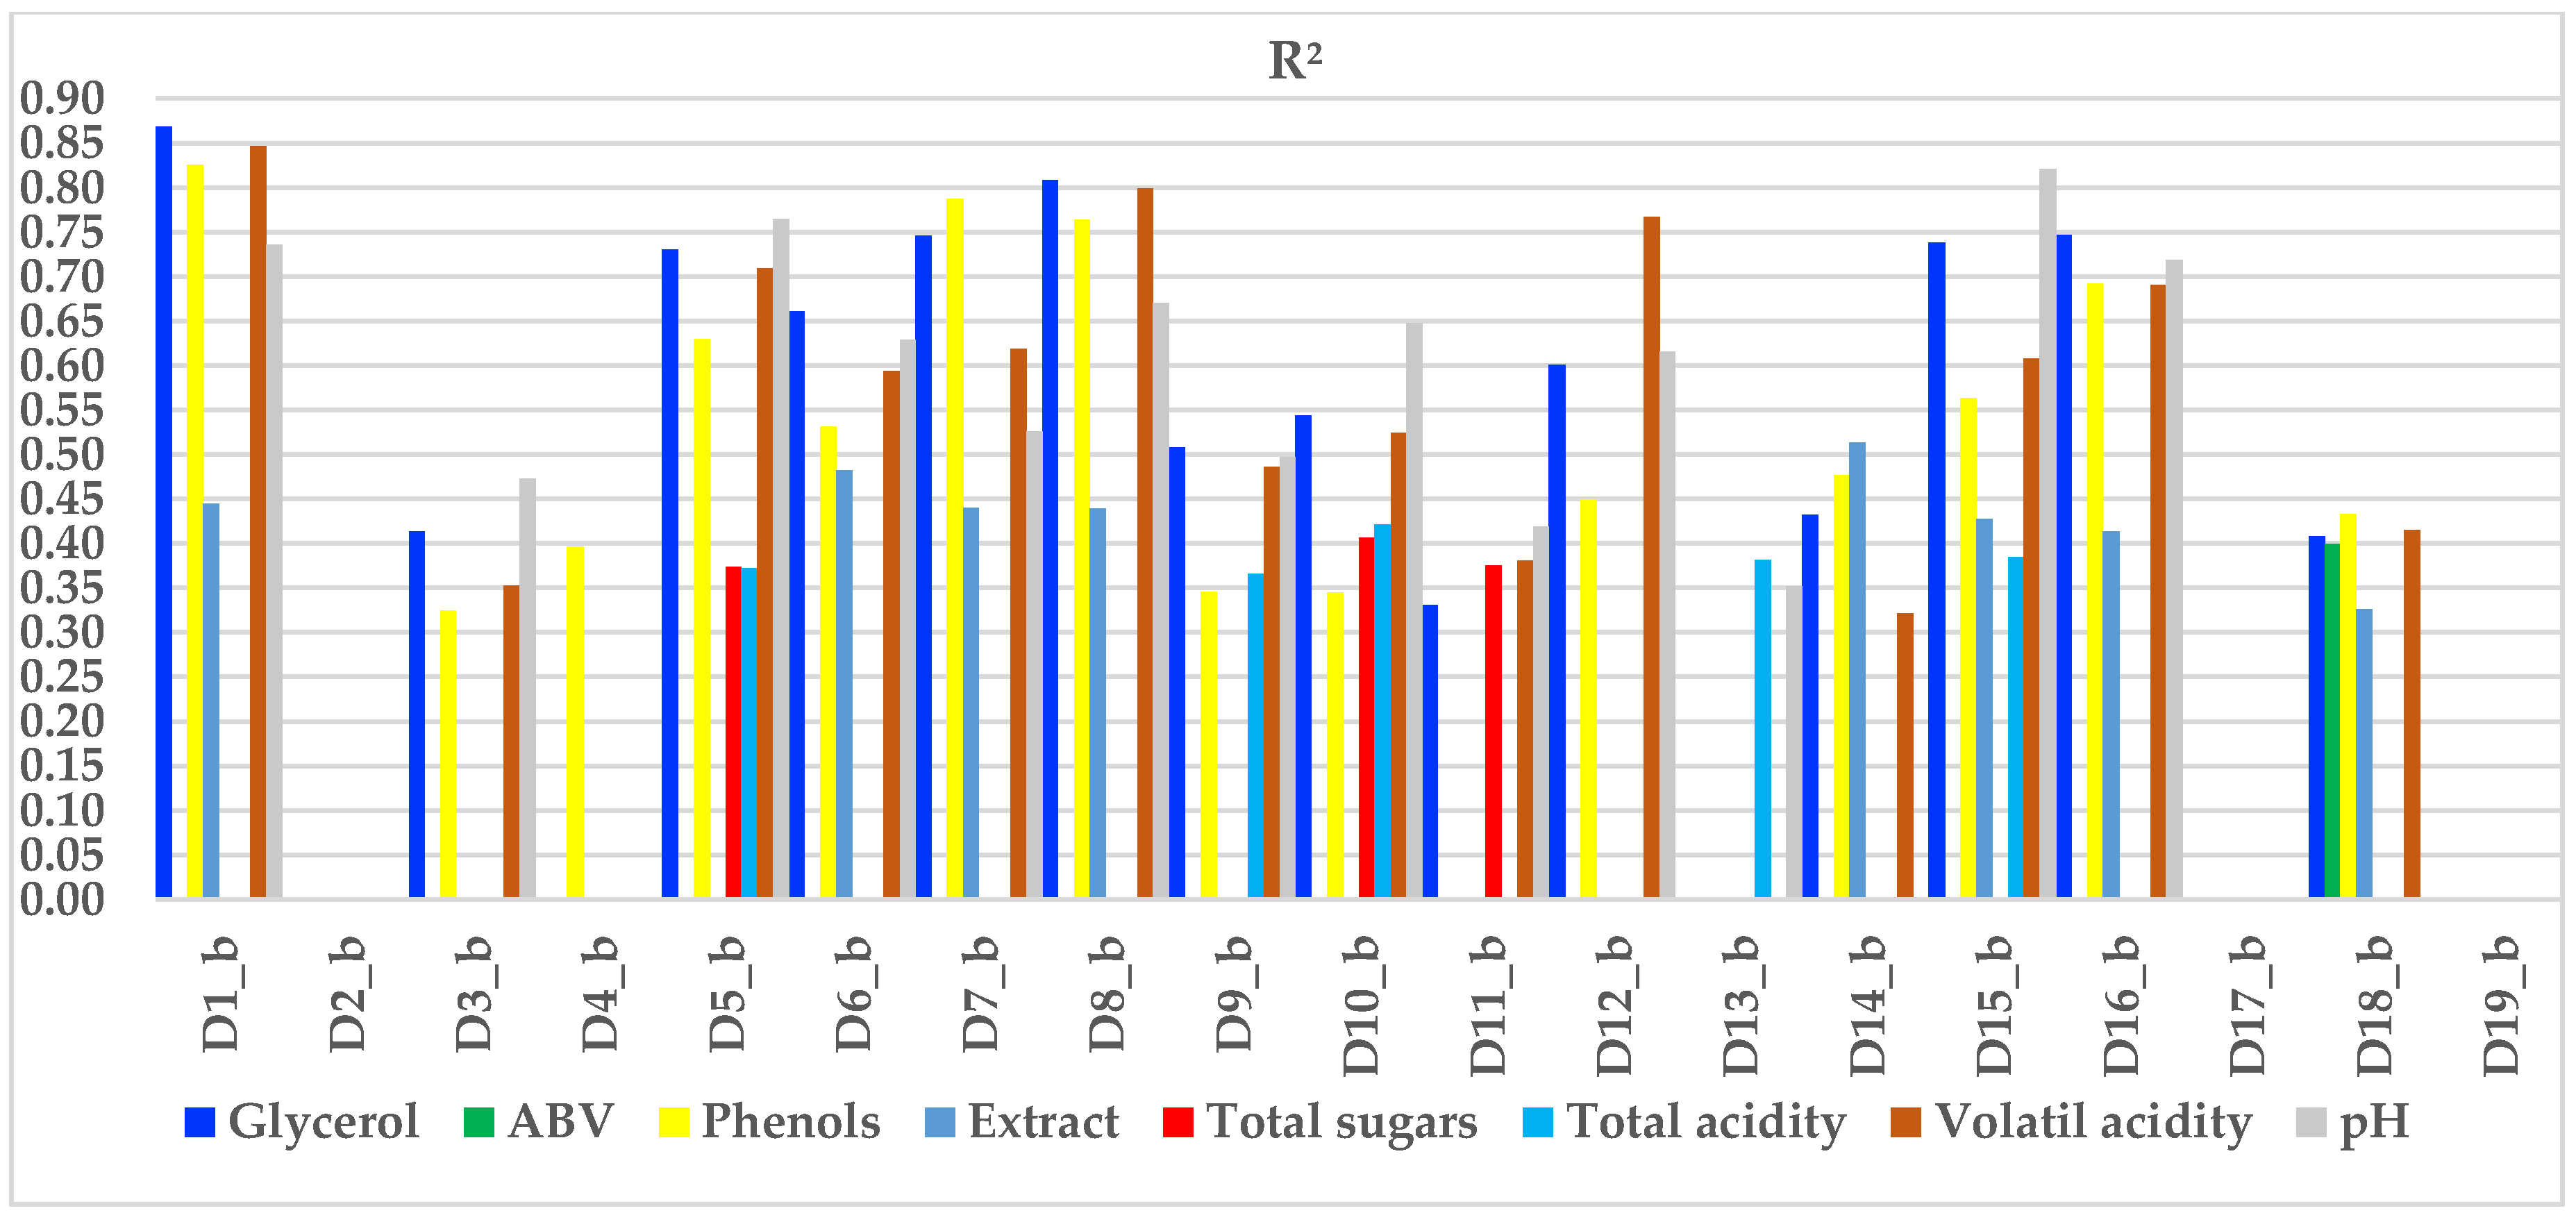
Figure 10.
Principal component analysis based on physicochemical parameters.
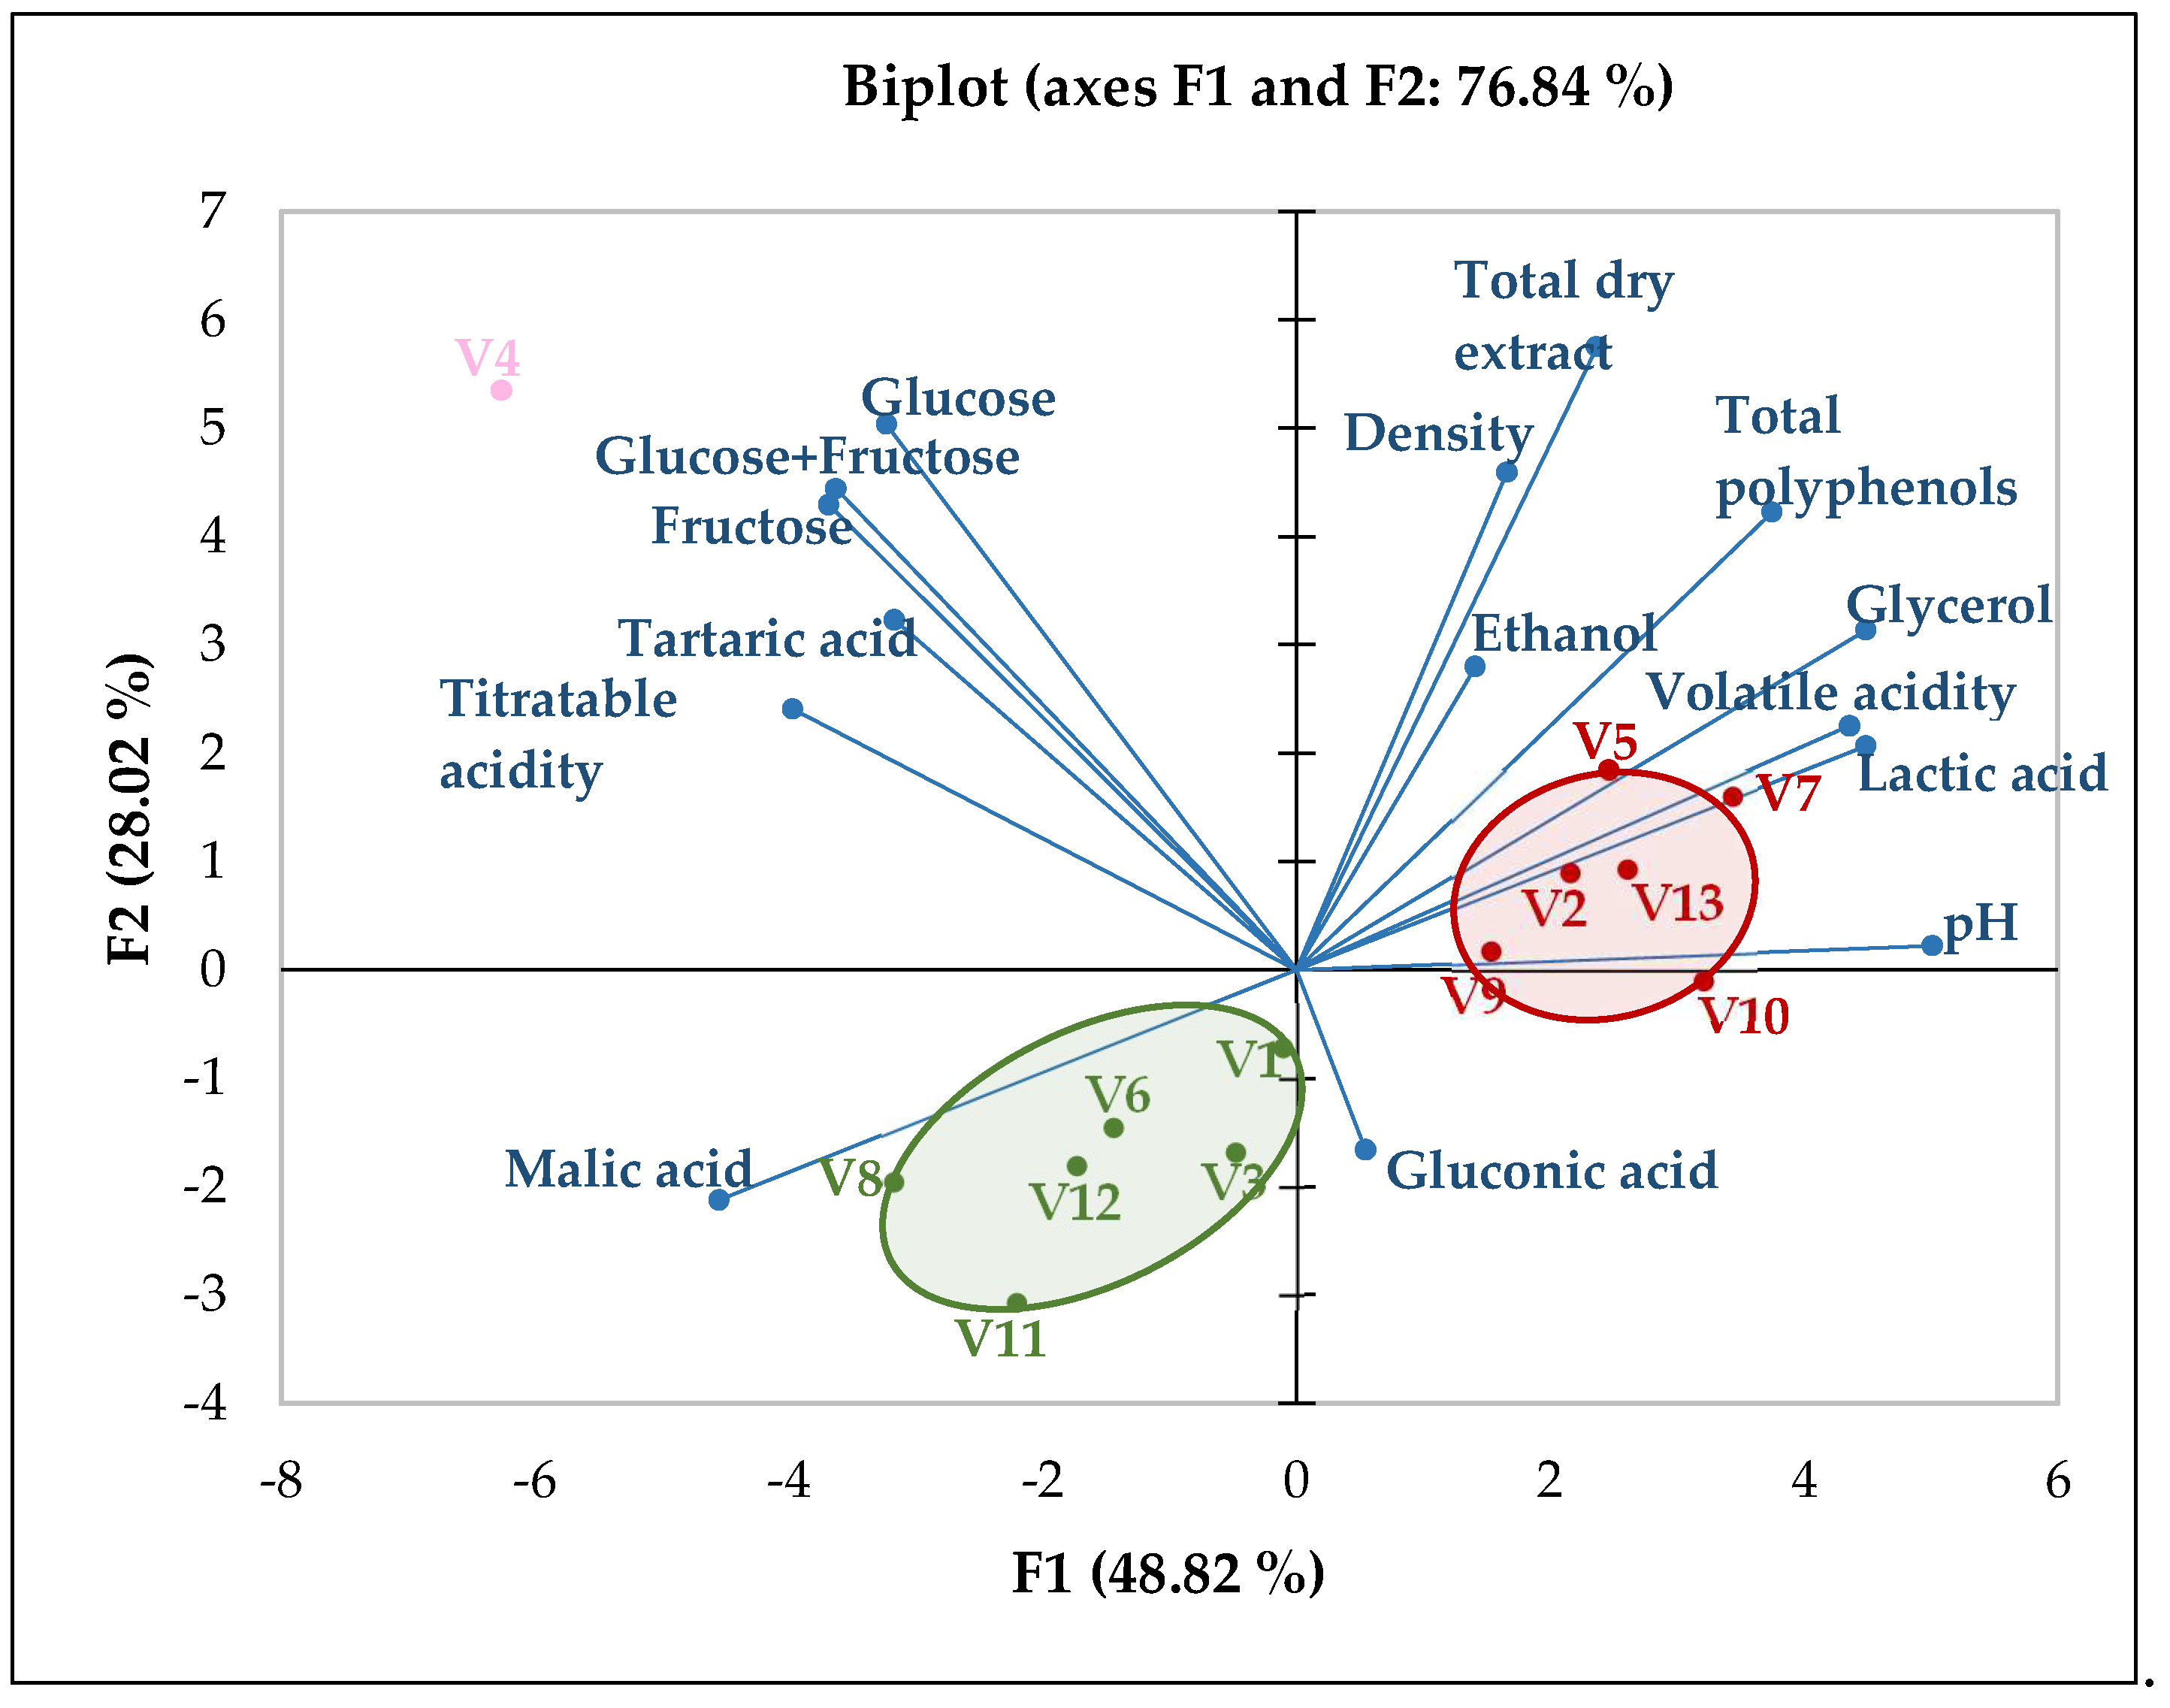

Table 1.
Breakdown of wine samples from the ‘line–up’ used in the study.
| ID | Vintage | Grape Variety | Vinified | Winery | Region |
| V1 | 2021 | Bobal | Blanc de noir | Vicente Gandia | ES–Utiel Requena |
| V2 | 2020 | Bobal | Red | Vicente Gandia | ES–Utiel Requena |
| V3 | 2021 | Cabernet Sauvignon | Blanc de noir | Rojevas Agroinvest | RO–Târgu Bujor |
| V4 | 2022 | Cabernet Sauvignon | Rosé | Rojevas Agroinvest | RO–Târgu Bujor |
| V5 | 2021 | Cabernet Sauvignon | Red | Rojevas Agroinvest | RO–Târgu Bujor |
| V6 | 2021 | Cabernet Sauvignon | Blanc de noir | Domaine Vinarte | RO–Sâmburești |
| V7 | 2017 | Cabernet Sauvignon | Red | Domaine Vinarte | RO–Sâmburești |
| V8 | 2019 | Tinta Negra | Blanc de noir | Diana Silva Wines | PT–Madeira |
| V9 | 2019 | Tinta Negra | Red | Diana Silva Wines | PT–Madeira |
| V10 | 2019 | Tinta Roriz | Red | Quinta do Vallado | PT–Douro |
| V11 | 2021 | Tinta Roriz | Blanc de noir | Quinta Nova | PT–Alto Douro |
| V12 | 2021 | Touriga Franca (95%) | Blanc de noir | Ravasqueira | PT–Alentejo |
| V13 | 2020 | Touriga Franca (95%) | Red | Ravasqueira | PT–Alentejo |
Table 2.
Monitored organoleptic characteristics of wine samples.
| Conventional ordinal number allocated in the representation of statistical values* | Descriptor title | Description of the specific features / notes appraised by descriptor |
References |
| 1 | Existence of a maceration stage and perceived intensity of it | Presumed exclusively based on orthonasal olfactory stimuli in tasting sessions with opaque glasses. | – |
| 2 | Overall olfactory intensity | Exclusively based on orthonasal olfactory stimuli. | – |
| 3 | Floral notes | Blossom notes, consisting in elderflower, honeysuckle, jasmine, rose, violet, acacia, chamomile, linden, honey, geranium odors/aromas | [19] |
| 4 | Vegetal/herbal notes | Eucalyptus, mint, fennel, dill, dried herbs thyme, oregano, lavender odors/aromas | [19] |
| 5 | ‘Green’/fresh/citrus fruits | Apple, pear, gooseberry, grape–fruit, orange, grape odors/aromas | [19] |
| 6 | Exotic fruits/ stone fruits/ tropical fruits | Peach, apricot, nectarine, plum_banana, melon, watermelon, passion fruit, pineapple odors/aromas | [19] |
| 7 | Red fruits | Redcurrant, cranberry, raspberry, strawberry, red cherry, red plum, pomegranate odors/aromas | [19] |
| 8 | Berries/forest fruits | Opaquecurrant, opaqueberry, blueberry, opaque cherry, opaque plum, sour–cherry odors/aromas | [19] |
| 9 | Overripe fruits | Figs, dried plums, raisins, prune, jam odors/aromas | [19] |
| 10 | Spice notes | Cinnamon, pepper, cloves, saffron, vanilla, coconut, liquorice, cedar, nutmeg, anise odors/aromas | [19] |
| 11 | Maillard–type notes | Roasted hazelnut/walnut, almond, coal smoke, cocoa, coffee, caramel, chocolate, toast, resins, tobacco odors/aromas. | – |
| 12 | Other specific notes | Leather, tanned leather, mushrooms, wet stone, flint, red earth, eucalyptus odors/aromas | [19] |
| 13 | Acidity/sourness | Fresh or sour taste produced by the natural organic acids, one of the primary tastes sensed by tastebuds on the tongue | [20] |
| 14 | Sweetness | One of the primary tastes involved in tasting, mainly because of the amount of residual sugar they contain | [20] |
| 15 | Bitterness | Among primary tastes which can be detected via taste buds mainly on the tongue , often confused with the quite different tactile sensation caused by astringency | [20] |
| 16 | Astringency | A complex tactile response resulting from shrinking, drawing, or puckering of the tissues of the mouth, based in principle by binding between tannins with proteins | [20] |
| 17 | Unctuousness | More a perceptual descriptor to describe the physical property of viscosity understood as the quality sensed by the human palate in the form of resistance as the solution is rinsed around the mouth | [20] |
| 18 | Finish/post–taste persistence |
Somehow derided tasting term to appraise the persistency of flavour and the impact of the wines on the palate, supposed to be direct proportional with some colloids | [20] |
| 19 | Overall evaluation | Based on summarizing all previous personal sensory judgments | – |
* In related statistical analyses and interpretations, each ordinal number assigned to a descriptor title is preceded by the letter ‘D’ to indicate that the value reflects the aggregated statistical parameters of the entire tasters’ panel for that specific descriptor perceived during tasting sessions with transparent glasses. Similarly, the same concept applies to values summarising the statistical parameters of the whole tasters’ panel in tasting sessions with opaque glasses, which is denoted by ‘D_b’ placed before the ordinal number assigned to each descriptor title.
Table 3.
Physicochemical parameters.
| Parameter | V1 | V2 | V3 | V4 | V5 | V6 | V7 | ||||||
| Ethanol (% vol) | 12.24±0,00 | 14.42±0,01 | 12.08±0,00 | 13.84±0,01 | 11.36±0,00 | 12.8±0,00 | 14.32±0,00 | ||||||
| Glucose+Fructose (g/L) | 0.90±0.02 | 0.10±0.01 | 0.80±0.03 | 6.80±0.02 | n/d±0.00 | 0.90±0.00 | 0.50±0.02 | ||||||
| Titratable acidity (g/L*) | 4.73±0.00 | 4.64±0.00 | 4.57±0.00 | 6.85±0.01 | 5.5±0.01 | 4.79±0.00 | 4.69±0.00 | ||||||
| Volatile acidity (g/L**) | 0.46±0.01 | 0.69±0.01 | 0.38±0.00 | 0.33±0.00 | 0.78±0.01 | 0.37±0.01 | 1.13±0.01 | ||||||
| Malic acid (g/L) | 1.09±0.01 | n/d±0.00 | 1.33±0.02 | 1.78±0.02 | n/d±0.00 | 0.68±0.01 | n/d±0.01 | ||||||
| Tartaric acid (g/L) | 1.11±0.00 | 1.58±0.01 | 0.99±0.00 | 2.62±0.02 | 1.81±0.00 | 1.69±0.00 | 1.13±0.00 | ||||||
| Lactic acid (g/L) | 0.63±0.00 | 1.22±0.01 | 0.65±0.00 | n/d±0.00 | 1.93±0.00 | 0.26±0.00 | 1.53±0.01 | ||||||
| pH | 3.40±0.01 | 3.56±0.01 | 3.47±0.01 | 3.11±0.00 | 3.56±0.01 | 3.34±0.02 | 3.67±0.01 | ||||||
| Density (g/mL) | 0.9915±0.01 | 0.9910±0.00 | 0.9913±0.00 | 0.9922±0.01 | 0.9950±0.01 | 0.9887±0.00 | 0.9919±0.01 | ||||||
| Total dry extract (g/L) | 24.50±0.01 | 29.60±0.02 | 23.40±0.00 | 30.80±0.00 | 30.70±0.00 | 18.90±0.01 | 31.60±0.01 | ||||||
| Glycerol (g/L) | 8.00±0.00 | 9.30±0.00 | 7.00±0.01 | 6.70±0.00 | 9.30±0.02 | 6.60±0.01 | 9.90±0.01 | ||||||
| Polyphenols–total (mg/L) | 1.28±0.00 | 2.08±0.00 | 0.49±0.00 | 1.22±0.00 | 2.64±0.00 | 0.87±0.00 | 2.27±0.00 | ||||||
| Parameter | V8 | V9 | V10 | V11 | V12 | V13 | |||||||
| Ethanol (% vol) | 11.66±0,00 | 11.44±0,01 | 14.43±0,01 | 12.55±0,00 | 12.43±0,01 | 14.58±0,00 | |||||||
| Glucose+Fructose (g/L) | 0.30±0.02 | n/d±0.00 | n/d±0.00 | 0.40±0.01 | 0.70±0.02 | 0.40±0.01 | |||||||
| Titratable acidity (g/L*) | 6.37±0.00 | 5.09±0.00 | 4.19±0.00 | 5.33±0.01 | 5.13±0.01 | 4.66±0.00 | |||||||
| Volatile acidity (g/L**) | 0.43±0.01 | 0.74±0.01 | 0.77±0.01 | 0.41±0.00 | 0.38±0.01 | 0.88±0.00 | |||||||
| Malic acid (g/L) | 2.11±0.02 | n/d±0.00 | 0.15±0.00 | 1.95±0.01 | 1.22±0.01 | n/d±0.00 | |||||||
| Tartaric acid (g/L) | 2.11±0.01 | 1.77±0.01 | 0.51±0.00 | 1.12±0.00 | 1.49±0.01 | 1.30±0.00 | |||||||
| Lactic acid (g/L) | n/d±0.00 | 2.08±0.01 | 1.55±0.00 | 0.05±0.00 | 0.22±0.00 | 1.45±0.00 | |||||||
| pH | 3.20±0.01 | 3.47±0.01 | 3.66±0.00 | 3.35±0.01 | 3.33±0.01 | 3.62±0.02 | |||||||
| Density (g/mL) | 0.9895±0.02 | 0.9920±0.01 | 0.9902±0.00 | 0.9883±0.00 | 0.9891±0.01 | 0.9905±0.01 | |||||||
| Total dry extract (g/L) | 17.50±0.01 | 23.30±0.01 | 27.40±0.02 | 17.10±0.00 | 18.80±0.01 | 28.80±0.01 | |||||||
| Glycerol (g/L) | 5.70±0.00 | 8.30±0.00 | 9.60±0.00 | 5.70±0.01 | 6.30±0.00 | 9.70±0.01 | |||||||
| Polyphenols–total (mg/L) | 0.64±0.00 | 1.80±0.00 | 2.00±0.00 | n/d±0.00 | 0.75±0.00 | 1.90±0.00 | |||||||
The results are shown as mean and standard deviation. *as tartaric acid equivalents to pH 7.0; **expressed in acetic acid; n/d means non-detectable value. Vi, i=1-13, represents the ID parameters of the samples according to the breakdown displayed in Table 2.
Table 4.
Shapiro–Wilk’s test and ANOVA relate to tasting sessions, either with opaque glasses to suppress visual cues or with transparent glasses.
Table 4.
Shapiro–Wilk’s test and ANOVA relate to tasting sessions, either with opaque glasses to suppress visual cues or with transparent glasses.
| ID Parameter | W | p–value | R² | F_statistic | Pr > F | Signification |
| D1_b | 0.984 | 0.843 | 0.842 | 11.537 | <0.0001 | *** |
| D1 | 0.959 | 0.162 | 0.885 | 16.745 | <0.0001 | *** |
| D2_b | 0.984 | 0.835 | 0.579 | 2.978 | 0.010 | ** |
| D2 | 0.970 | 0.383 | 0.311 | 0.978 | 0.493 | ∞ |
| D3_b | 0.977 | 0.585 | 0.489 | 2.070 | 0.059 | . |
| D3 | 0.981 | 0.750 | 0.500 | 2.167 | 0.048 | * |
| D4_b | 0.967 | 0.306 | 0.592 | 3.138 | 0.007 | ** |
| D4 | 0.958 | 0.148 | 0.249 | 0.720 | 0.720 | ∞ |
| D5_b | 0.954 | 0.110 | 0.645 | 3.943 | 0.002 | ** |
| D5 | 0.944 | 0.050 | 0.657 | 4.154 | 0.001 | ** |
| D6_b | 0.962 | 0.201 | 0.595 | 3.180 | 0.007 | ** |
| D6 | 0.990 | 0.971 | 0.353 | 1.184 | 0.344 | ∞ |
| D7_b | 0.986 | 0.907 | 0.815 | 9.533 | <0.0001 | *** |
| D7 | 0.989 | 0.966 | 0.867 | 14.140 | <0.0001 | *** |
| D8_b | 0.984 | 0.858 | 0.917 | 23.878 | <0.0001 | *** |
| D8 | 0.986 | 0.890 | 0.941 | 34.266 | <0.0001 | *** |
| D9_b | 0.962 | 0.203 | 0.564 | 2.804 | 0.013 | * |
| D9 | 0.955 | 0.126 | 0.306 | 0.954 | 0.513 | ∞ |
| D10_b | 0.966 | 0.278 | 0.578 | 2.963 | 0.010 | ** |
| D10 | 0.967 | 0.301 | 0.723 | 5.649 | 0.000 | *** |
| D11_b | 0.983 | 0.818 | 0.767 | 7.130 | <0.0001 | *** |
| D11 | 0.956 | 0.134 | 0.576 | 2.943 | 0.010 | * |
| D12_b | 0.981 | 0.756 | 0.753 | 6.614 | <0.0001 | *** |
| D12 | 0.983 | 0.794 | 0.531 | 2.451 | 0.027 | * |
| D13_b | 0.984 | 0.829 | 0.276 | 0.827 | 0.623 | ∞ |
| D13 | 0.939 | 0.036 | 0.164 | 0.426 | 0.939 | ∞ |
| D14_b | 0.962 | 0.201 | 0.448 | 1.759 | 0.111 | ∞ |
| D14 | 0.968 | 0.315 | 0.246 | 0.708 | 0.730 | ∞ |
| D15_b | 0.972 | 0.430 | 0.623 | 3.583 | 0.003 | ** |
| D15 | 0.979 | 0.677 | 0.516 | 2.307 | 0.036 | * |
| D16_b | 0.970 | 0.370 | 0.828 | 10.401 | <0.0001 | *** |
| D16 | 0.979 | 0.653 | 0.886 | 16.831 | <0.0001 | *** |
| D17_b | 0.976 | 0.553 | 0.231 | 0.651 | 0.780 | ∞ |
| D17 | 0.910 | 0.004 | 0.200 | 0.543 | 0.866 | ∞ |
| D18_b | 0.965 | 0.262 | 0.481 | 2.009 | 0.066 | . |
| D18 | 0.971 | 0.401 | 0.381 | 1.333 | 0.260 | ∞ |
| D19_b | 0.924 | 0.012 | 0.704 | 5.159 | 0.000 | *** |
| D19 | 0.968 | 0.315 | 0.460 | 1.842 | 0.093 | . |
Table 5.
Classification of some white varieties based on monoterpene contents.
|
Muscat varieties > 6 mg/L |
Non–Muscat, aromatic varieties 1 – 4 mg/L |
Neutral varieties < 1 mg/L |
| Canada Muscat | Traminer | Bacchus |
| Gewürztraminer | Huxelrebe | Chardonnay |
| Muscat of Alexandria | Kerner | Chasselas |
| Muscat blanc à petits grains | Morio–Muskat | Chenin blanc |
| Moscato Bianco | Müller–Thurgau | Clairette |
| Muscat Ottonel | Riesling | Nobling |
| Moscato Italiano | Scheurebe | Rkatsiteli |
| Siegerrebe | Sauvignon blanc | |
| Sylvaner | Sémillon | |
| Würzer | Sultana | |
| Italian Riesling | Trebbiano | |
| Verdelho | ||
| Viognier | ||
| Vidal blanc |
Disclaimer/Publisher’s Note: The statements, opinions and data contained in all publications are solely those of the individual author(s) and contributor(s) and not of MDPI and/or the editor(s). MDPI and/or the editor(s) disclaim responsibility for any injury to people or property resulting from any ideas, methods, instructions or products referred to in the content. |
© 2025 by the authors. Licensee MDPI, Basel, Switzerland. This article is an open access article distributed under the terms and conditions of the Creative Commons Attribution (CC BY) license (http://creativecommons.org/licenses/by/4.0/).
Copyright: This open access article is published under a Creative Commons CC BY 4.0 license, which permit the free download, distribution, and reuse, provided that the author and preprint are cited in any reuse.


