Submitted:
11 August 2025
Posted:
12 August 2025
You are already at the latest version
Abstract
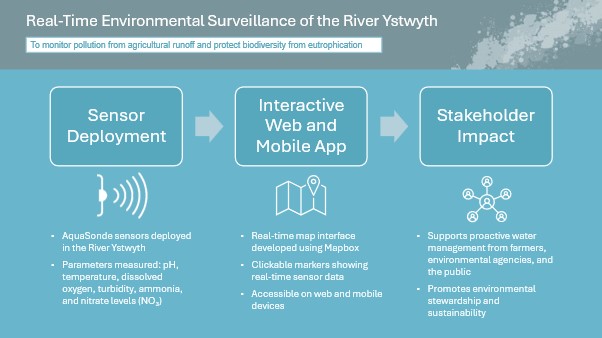
Monitoring water quality in Welsh rivers has become a critical public concern, particularly in efforts to address pollution and protect the environment. This study presents the development and assessment of an interactive web and mobile application, featuring a real-time mapping interface built using the Mapbox framework. The platform provides stakeholders, including farmers, environmental agencies, and the public, with easy access to real-time water quality data for the Ystwyth River in Mid-Wales. Users can click on map markers to view sensor readings for key water quality parameters, including pH, electrical conductivity (EC), temperature, dissolved oxygen (DO), total dissolved solids (TDS) and nutrient levels such as nitrate (NO₃). This paper focuses on the feasibility of combining in-situ sensor technology with a user-friendly mobile app to enable stakeholders to visualise the impact of land management practices and make informed decisions. The system aims to enhance environmental surveillance, increase transparency, and promote sustainable agricultural practices by providing critical water quality information in an accessible format. Future developments will explore the integration of artificial intelligence (AI) for predictive modelling and satellite data for broader spatial coverage, with the goal of scaling up the system to other catchments and improving proactive water quality management.
Keywords:
water quality monitoring
; river Ystwyth
; sensors
; interactive web-based map
; environmental surveillance
; real-time data
1. Introduction
The increasing need for effective management of inland river water quality has underscored the importance of real-time, rapid, and continuous monitoring, particularly in addressing the challenges posed by river eutrophication. Excess phosphorus and nitrogen contribute to eutrophication, resulting in a decline in water quality and adversely affecting aquatic biodiversity [1,2]. The Ystwyth River is a 25-mile-long river that flows through Ceredigion, Wales and faces significant risks of eutrophication due to multiple sources of nutrient pollution. The river originates in the Cambrian Mountains, where several tributaries, notably the River Diliw, flow from the western slopes of Pumlumon, situated on the border between Ceredigion and Powys. Its catchment area of 76 square miles encompasses diverse land covers, including coniferous forests, woodlands, historic mines (silver, lead, and zinc), and agricultural activities such as mixed livestock farming and silage production [3].
Among these nutrient sources, agricultural runoff is a considerable contributor to pollution within river systems. Livestock farming constitutes a predominant land use in Wales, and its environmental impact on river systems is a significant concern [4]. Runoff from livestock defecating near streams, influenced by stocking density and soil compaction, can introduce phosphorus and nitrogen into the water [5]. Additionally, silage production on lower pastures often requires the application of inorganic fertilizers, which are prone to leaching during rainfall events, particularly on clay soils [6]. These agricultural practices increase the risk of eutrophication, compounding the effects of other land covers such as historic mines and coniferous forests [7]. To mitigate these impacts, strategies include implementing riparian buffers, where vegetation near the stream filters nutrients before they enter the water [8], and adopting controlled grazing strategies, such as restricting grazing during winter in saturated areas near waterways [5].
To streamline data collection for water quality monitoring and test a system for delivering real-time data visualization, an AquaSonde sensor was installed in the Ystwyth River for real-time environmental monitoring. This test case focused on developing an interactive map and app that provide stakeholders with real-time water quality data. Traditional water quality monitoring methods, which rely on on-site measurements, sample collection, and laboratory analysis, are resource-intensive in terms of labor, materials, and costs [9]. In contrast, real-time monitoring offers a more efficient and immediate means of assessing water quality, allowing stakeholders such as environmental agencies, local authorities, farmers, and conservation groups to respond more quickly to potential environmental threats.
The process of monitoring and evaluating the River Ystwyth’s water quality using sensor technology involved several key steps and considerations:
- Site visitation and survey – identifying a suitable deployment location based on factors such as ease of access, water flow, sediment accumulation, and surrounding land use
- Requirement analysis – determining the parameters to monitor, balancing functionality and resources
- Sensor acquisition – procuring a robust multiparameter probe and any additional sensors necessary for long-term deployment
- Sensor calibration – preparing the sensors for deployment by calibrating them according to the manufacturer’s instructions
- Sensor deployment – installing the sensors securely at the selected site, ensuring they were submerged in a protective casing
- Data collection – gathering continuous, high-resolution data with a logging interval of 15 minutes
- Web service and app development – developing a user-friendly mobile and web application to help stakeholders visualise and access water quality data in real-time.
This test case demonstrates how real-time data collection and visualization tools can provide continuous, high-resolution information on various water quality parameters. By offering real-time insights through an interactive map, this system empowers stakeholders to manage and mitigate nutrient pollution more effectively. Ultimately, this approach supports the sustainable management of rural river systems and the preservation of biodiversity in Wales.
1.1. Contribution to Environmental Conservation and Agricultural Sustainability
The integration of real-time water quality monitoring into farming practices supports agricultural sustainability by enabling farmers to manage water usage more effectively and minimize the impact of pollution on their crops and livestock. By addressing these issues, farmers can enhance both the economic and environmental sustainability of their enterprises. Additionally, this approach helps prepare them for evolving governmental regulations, such as the Sustainable Farming Scheme commencing in 2026 [10]. Real-time monitoring contributes to broader environmental conservation efforts by protecting local ecosystems and promoting sustainable farming techniques.
A major factor affecting water quality is land use. Human-induced changes in land use and land cover (LULC), including agriculture, deforestation, and urban development, are significant contributors to water quality degradation [11]. Agricultural activities often lead to increased nutrient runoff, sedimentation, and the introduction of pollutants such as fertilizers and pesticides into water bodies. These substances significantly alter water quality, causing issues like eutrophication, which depletes oxygen levels and threatens aquatic ecosystems [12,13]. For example, runoff from agricultural land can elevate concentrations of nitrates, phosphates, and other harmful chemicals in rivers and streams, disrupting ecosystems and rendering the water unsuitable for human consumption and agricultural use without treatment [12,14]. Further, land clearing for agricultural expansion exacerbates soil erosion, leading to higher sediment loads in rivers, further degrading water quality [15].
To mitigate these impacts, sustainable land management practices are essential. Measures such as implementing riparian buffers, maintaining natural vegetation, and adopting precision farming techniques can significantly reduce the adverse effects of agricultural activities on water quality [13,16]. Protecting and restoring vegetation in watershed areas helps intercept and filter runoff before it enters water bodies, preserving water quality and promoting a more balanced interaction between farming and environmental conservation [17].
Given the crucial role land use plays in water quality [18], addressing these issues is especially important in rural Wales, where agricultural practices and environmental conservation intersect. Over 80% of the land in Wales is used for agriculture, and studies in North Wales have shown that intensive farming in high-quality agricultural areas contributes to elevated nitrates, phosphorus, and bacterial coliform in rivers [7,19]. This relationship between land use and water quality underscores how intensive agriculture practices increase nutrient loads, leading to degradation of river ecosystems.
River quality in Wales remains under ongoing scrutiny, with only about 44.5% of rivers currently meeting good ecological status, highlighting the need for further improvements in water quality across the region [20]. Key contributors to river pollution in the region include agricultural runoff, nutrient pollution – particularly phosphorus – and mismanaged wastewater from combined sewer overflows (CSOs). The Wales Better River Quality Taskforce has emphasized the importance of real-time surveillance to address these challenges, especially for managing CSO discharges and agricultural pollutants. Real-time monitoring enables rapid responses to emerging issues, facilitating proactive water management, ensuring compliance with environmental standards and helping to preserve river ecosystems [20,21].
The real-time water quality monitoring capabilities offered by the app and interactive map developed in this project align closely with these objectives. These tools deliver up-to-date data on key water quality parameters, which is particularly important in Wales, where rivers are highly susceptible to pollution from both agricultural runoff and urban development [13,19]. Early detection of pollution through real-time mapping allows users to manage risks more effectively, ensure regulatory compliance, and protect both local ecosystems and agricultural productivity. By offering real-time insights, the system empowers stakeholders to adjust their practices in response to emerging issues, ultimately safeguarding Welsh water bodies from long-term environmental degradation.
In response to the growing need for better water management, the Water Resources (Control of Agricultural Pollution) Regulations introduced in Wales in 2021 specifically target nitrate pollution from agricultural sources. These regulations complement River Basin Management Plans (RBMPs) developed under the EU Water Framework Directive (WFD), which aim to mitigate pollution in river basins across the country, ensuring that Welsh rivers meet environmental objectives for good water quality [19].
2. Materials and Methods
2.1. Study Area
The AquaSonde was deployed for a period of two months (May to end of June) in the Ystwyth River, just downstream from the adjoining tributary Nant Pant-yr-haidd, which flows past Aberystwyth University’s Ty Gwyn farm (Figure 1). The River Ystwyth flows through varied topography within a 193 km² catchment area, extending from the Cambrian Mountains to Cardigan Bay at Aberystwyth Harbour. Hydrographs indicate that the upper catchment is characterized by flashy hydrology, meaning flow can fluctuate both frequently and rapidly [22], and have short lag times under two and a half hours with significant seasonal variability [23]. Tributaries such as Nant Pant-yr-haidd flow through adjacent improved grasslands in the lower river valley, contributing water and potentially agricultural runoff.
The upper river valley consists predominantly of peat bogs, unimproved grassland, and semi-improved grassland used for sheep grazing. The surrounding valley sides are covered by extensive coniferous plantations, which contribute organic materials and may cause acidification in upstream sections (Evans et al., 2014). In the lower valley plain, there is a mixture of livestock activities on improved grasslands (Figure 2). Here, the application of fertilizers and slurry, combined with higher stocking densities and mechanical operations like silage cultivation, may lead to nutrient loss and increased sediment loads entering the River Ystwyth and its tributaries.
The probe deployment site was selected due to its proximity to the tributary, which flows directly through a farming enterprise on improved grassland, and for its ease of access. Weather conditions, including rainfall and temperature, were recorded throughout the deployment period to contextualize variations in the collected data.
2.2. Sensor Selection
Selecting the appropriate sensors was essential for accurate and reliable data collection. Sensors needed to be durable, dependable, and capable of operating effectively in the specific environmental conditions of the River Ystwyth. The primary sensor types considered for this study include:
- Multiparameter sondes: Devices can simultaneously measure various parameters, including pH, dissolved oxygen (DO), temperature, electrical conductivity (EC), and turbidity.
- Nutrient sensors: Specialized sensors designed to detect concentrations of nitrates and phosphates.
- To effectively monitor the water quality of the River Ystwyth, the following key parameters were identified:
- Temperature: Influences DO levels and overall aquatic life.
- pH: Indicates the acidity or alkalinity of the water, affecting chemical solubility and biological availability.
- Dissolved Oxygen (DO): Essential for the survival of aquatic organisms.
- Electrical Conductivity (EC): Reflects the amount of dissolved salts and other chemicals.
- Turbidity: Measures water clarity, which can be affected by suspended particles.
- Nutrient levels: Including nitrates (NO₃) and ammonia, which can contribute to eutrophication when present in excess.
A multiparameter sonde (Figure 3), the AquaSond-2000 water quality monitoring sonde (AS-2000), was selected for continuous water quality monitoring. The AS-2000 features onboard data logging with a memory capacity of 150,000 datasets and can be deployed for up to 180 days. The device comes equipped with a range of standard sensors and offers customization options for additional sensors. Standard parameters measured by the AS-2000 include DO, specific electrical conductivity, absolute EC, pH, oxidation-reduction potential (ORP), total dissolved solids, resistivity, salinity, seawater specific gravity, and temperature. The AS-2000 also features two auxiliary sockets for additional sensors—one Ion Selective Electrode (ISE) socket and one optical electrode socket—enhancing its versatility for comprehensive water quality monitoring.
2.3. Sensor Setup and Calibration
Prior to deployment, the AS-2000 was set up according to the manufacturer’s instructions to ensure proper assembly and calibration. All calibration solutions were provided by the manufacturer. The calibration procedures for the standard and optional sensors were conducted to enable accurate measurement of pH, DO, EC, turbidity, and nutrients (nitrates and ammonia):
- pH calibration: The pH electrode required a three-point calibration using standardized solutions at pH 7, 4, and 10 (provided by Aquaread). Calibration was performed at approximately 25 °C, as recommended by the manufacturer, to ensure optimal results.
- DO calibration: The DO electrode was calibrated at both 0% and 100% oxygen. For the 0% calibration, a sodium sulfite solution was used. For the 100% calibration, “damp air” was created by wrapping a damp paper towel around the probe.
- EC calibration: The EC electrode was calibrated using the Aquaread RapidCal solution for single-point calibration, following the manufacturer’s instructions.
- Nitrate and ammonia calibration: The optional nitrate and ammonia sensors were calibrated at three points: 100 ppm and two 10 ppm solutions. The 100 ppm and first 10 ppm solutions were calibrated at the same temperature, while the second 10 ppm solution was calibrated at 10 °C lower. All calibration solutions were supplied pre-diluted by Aquaread.
During deployment, the probe was regularly inspected to ensure that the sensors remained submerged under varying rainfall conditions and that the protective sleeve remained free from sediment buildup, which could affect accuracy. The mean river flow rate was also recorded. The electrodes’ temperature compensation technology ensured consistent data by adjusting for minor fluctuations. However, no significant temperature variations were observed during the sampling period.
2.4. Website and Mobile Application Development
The web application was developed using Next.js (version 14), providing a robust and scalable foundation for the front end. NextAuth was implemented to ensure secure user authentication, supporting multiple login providers including GitHub, Apple, and Google. This multi-provider setup enhances security while offering users the flexibility to choose their preferred sign-in method.
For the mobile application, Android Studio (a widely used Integrated Development Environment, IDE, for Android applications) was utilized to facilitate real-time water quality monitoring of the River Ystwyth. The app was primarily designed for stakeholders who rely on Android smartphones to access real-time environmental data. Android was selected due to its extensive adoption, particularly in rural and agricultural regions where cost-effective and versatile mobile devices are essential for daily operations.
Android Studio supports two official programming languages: Java and Kotlin. Java, the original language for Android development, offers a well-established ecosystem and strong community support. Known for its reliability and performance in large-scale applications, Java is a statically typed language. Kotlin, a newer addition, addresses some of Java’s limitations (such as verbosity and null-pointer exceptions). Its modern syntax, enhanced type safety, and seamless interoperability with Java make it increasingly popular for Android development, enabling developers to write more concise and maintainable code.
The core component of an Android application is the activity, which represents a single screen with a user interface. The water quality monitoring app consists of multiple interconnected activities, each serving a specific function such as real-time data visualization, historical data comparison, and user notifications. These activities are connected using Intents, an Android feature that facilitates smooth transitions between screens and the exchange of data.
For mapping functionality, the Mapbox API was integrated to create an interactive map. This allows users to toggle between various map views (such as street or satellite) for a customizable experience based on their needs. The map displays dynamically generated markers representing real-time data gathered from sensors. These sensor readings are stored and managed in the Firestore database, ensuring that the displayed data remains accurate and up to date.
To enhance user interaction and improve data interpretation, the application incorporates dynamic map layers, color-coded symbology, and interactive widgets. This combination of technologies ensures a seamless user experience, enabling stakeholders to effectively monitor water quality in real time.
By integrating these technologies, the project delivers a robust solution that meets the technical and practical needs of stakeholders while promoting sustainability and accessibility in environmental monitoring.
2.5. Sensor Data Collection
Calibration procedures for each sensor on the AS-2000 were established to account for variations in environmental conditions and sensor drift over time. Following calibration, the probe was deployed in the Ystwyth River at the selected site (Figure 1) for continuous data collection over the sampling period. Using the SondeLink software provided by Aquaread, data logging intervals were set to 15 minutes to optimize battery life while maintaining a sufficient level of detail across the data capture period. This setting is appropriate for continuous data collection over extended periods. Prior to deployment, the probe and sensors were tested in situ to confirm that the equipment was functioning correctly and recording data accurately.
The probe was securely installed in the Ystwyth River within a protective plastic housing to minimize the chance of physical damage and sediment build-up, without interfering with the operation of the probe (Figure 4). The probe was anchored in a fixed position with the sensors fully submerged. Regular site visits were conducted to ensure that sediment had not accumulated on the sensors, the probe remained in its correct position, and data was still being recorded.
Data collected by the AS-2000 was stored in its internal memory. On-site manual downloads were performed using a laptop and the SondeLink software. During each download, the probe was temporarily removed from its protective housing and connected to the laptop via a USB cable to transfer the data in CSV format. After the data was successfully downloaded, the probe was returned to its original position in the river to continue data collection.
3. Results and Discussion
3.1. Web and Mobile Application
A web and mobile application was developed for real-time water quality monitoring in the Ystwyth River, offering dynamic visualisation of the key water quality parameters. By providing transparent access to critical data, the application has been designed to empower stakeholders—including farmers, the public, and water-related organisations—to address environmental pollution risks, optimise resource use, and foster greater agricultural sustainability.
To enhance user engagement and interactivity, the app features an intuitive map interface. As shown in Figure 5, the map view on a tablet displays the precise locations (longitude and latitude) of farms where sensors have been deployed. Each marker represents a water monitoring station along the river. By selecting a marker, users can access detailed data on water quality parameters such as pH, nitrate, ammonia, temperature, and DO levels. Figure 6 demonstrates the mobile application’s cross-platform design on Android devices, ensuring accessibility across various screen sizes and devices commonly used by farmers.
This map-based interface, as illustrated in Figure 5 and Figure 6, allows users to quickly assess the environmental status at specific points along the river, facilitating informed decision-making for both agricultural management and regulatory oversight.
The application leverages Android’s native capabilities, such as GPS location tracking, real-time notifications, and background data synchronization. These features ensure that farmers and environmental stakeholders receive timely alerts about potential water quality issues, even when the app is running in the background.
3.2. Data Analysis Results for Sensor Data
In addition to the interactive map, the application provides time-series visualizations of critical water quality parameters. Continuous monitoring of the river demonstrated the fluctuations of key water quality parameters over time (Figure 7), showing data for total dissolved solids (TDS), electrical conductivity (EC), ammonia, dissolved oxygen (DO), pH, and temperature. The TDS concentration describes the presence of inorganic salts and minor concentrations of organic substances, which demonstrates a linear relationship with the EC measurement (the capacity of the water to conduct electrical current). A higher proportion of dissolved solids leads to a higher EC, which can arise from agricultural inputs, among other sources. Increased water temperature tends to lead to a higher concentration of ammonia, which can leach into watercourses as a result of agricultural activity and impact water ecosystems. Although nitrate concentrations were measured during this period, results showed negligible levels present. The average river flow rate during the monitoring period was 0.73 m/s, the average atmospheric temperature was 12.84 °C, and the average daily precipitation was 0.33 mm.
These dynamic plots enable users to visualize fluctuations over the monitoring period and explore temporal variations by scrolling through the data. The ability to identify potential anomalies or outliers, such as sudden drops in DO, is crucial for detecting early signs of river pollution and prompting timely investigations. This dynamic visualisation tool, therefore, enhances user engagement and supports real-time analysis, facilitating more informed decisions regarding water quality management.
4. Future Work
While this study has demonstrated the feasibility of real-time environmental monitoring for river pollution in Mid-Wales through interactive web and mobile applications, several future directions will expand and enhance the system’s capabilities:
- Pilot deployment and user feedback: The applications developed in this test case have yet to be deployed to farmers and other stakeholders. A pilot deployment phase will focus on introducing the system to end-users (such as farmers, environmental agencies, and local authorities). Collecting feedback on usability, functionality, and effectiveness will help refine the app’s features and user interface. This iterative approach will ensure the system better meets the needs of those who rely on accurate and timely water quality data for decision-making.
- Large dataset mining and machine learning: To enhance the predictive capabilities of the system, future work will incorporate large dataset mining and machine learning algorithms. By leveraging existing historical data and real-time sensor readings, these techniques can identify patterns and predict potential pollution events. Developing predictive models will enable stakeholders to anticipate water quality issues and take proactive measures before significant pollution occurs, ultimately improving the effectiveness of environmental monitoring.
- Integration with satellite technology: Incorporating satellite data (such as imagery from Landsat) will complement ground-based sensor data by providing a broader spatial context. Satellite-derived water quality metrics, such as turbidity and chlorophyll concentrations, can be compared with on-site sensor readings to enhance monitoring accuracy. This integration will be particularly beneficial for identifying pollution sources across larger catchment areas and remote regions, offering a more comprehensive approach to environmental monitoring.
- Enhanced map features and resource integration: Future iterations of the application will expand map marker functionality to display site-specific pollutant information and provide links to additional resources (such as best practices for pollution mitigation, regulatory guidelines, and educational materials). These enhancements will offer stakeholders context-specific information, fostering a deeper understanding of pollution dynamics and supporting a more informed decision-making process.
5. Conclusion
This paper explored the development and application of interactive mapping and data analysis for environmental monitoring of river pollution, focusing on the Ystwyth River in Mid-Wales. By deploying AquaSonde sensors to measure key water quality indicators, we developed both web and mobile applications that provide an intuitive platform for stakeholders to access real-time sensor readings. This test case demonstrated the feasibility of using real-time monitoring systems to support informed decision-making for water management—particularly regarding pollution risks—while helping to safeguard the environment and enhance agricultural sustainability. Although the web and mobile applications have been successfully developed and tested, the system has not yet been deployed to farmers for field use. Future phases of this project will focus on piloting the app with farmers and other stakeholders to gather feedback on usability, functionality, and effectiveness. This iterative process will help refine the app to better meet the needs of end-users and enhance its impact on water quality management.
Looking ahead, the success of this test case lays the groundwork for scaling up the system to larger catchment areas and broader applications. Future developments will focus on integrating artificial intelligence (AI) to analyze real-time data trends and predict pollution events. AI-driven models can identify patterns, anticipate potential water quality issues, and enable stakeholders to implement proactive measures before significant pollution occurs. Additionally, incorporating satellite technology (such as data from Landsat) will complement ground-based sensors by providing a broader spatial context. This integration will allow users to compare satellite-derived water quality metrics with on-site sensor readings, enhancing monitoring accuracy and coverage.
These advancements hold significant potential for improving environmental surveillance, particularly for farmers and water authorities in remote areas. By providing accessible and transparent water quality data, this system fosters a sense of environmental stewardship among stakeholders. Empowering farmers, policymakers, and community members with real-time insights encourages collective responsibility for maintaining water quality. This approach supports not only regulatory compliance but also a culture of sustainable land and water management, which is essential for protecting aquatic ecosystems and ensuring long-term agricultural viability.
Abbreviations
- CSC – Client-Side Components
- CSOs – Combined Sewer Overflows
- DO – Dissolved Oxygen
- EC – Electrical Conductivity
- IDE – Integrated Development Environment
- ISE – Ion Selective Electrode
- LULC – Land Use and Land Cover
- ORP – Oxidation-Reduction Potential
- RBMPs – River Basin Management Plans
- SEO – Search Engine Optimisation
- WFD – Water Framework Directive
Author Contributions
All authors contributed significantly to the design and implementation of the research. All authors have read and agreed to the published version of the manuscript.
Funding
This project was supported by funding from Aberystwyth University’s Research Fund, which enabled the development of the water quality monitoring application and the deployment of AquaSonde sensors along the Ystwyth River.
References
- Neal, C. and Jarvie, H.P. (2005) Agriculture, community, river eutrophication and the Water Framework Directive. Hydrological Processes, 19(9), pp. 1895–1901. [CrossRef]
- Jarvie, H.P. et al. (2010) Streamwater phosphorus and nitrogen across a gradient in rural–agricultural land use intensity. Agriculture, Ecosystems & Environment, 135(4), pp. 238–252. [CrossRef]
- .
- Withers, P.J.A. et al. (2022) Re-focusing Phosphorus use in the Wye Catchment. RePhoKUs Project Report, p. 31. Available at: https://councillors.herefordshire.gov.uk/documents/s50101856/RePhoKUs_Wye_Report_310522.pdf.
- Cournane, F.C. et al. (2011) Effects of cattle, sheep and deer grazing on soil physical quality and losses of phosphorus and suspended sediment in surface runoff. Agriculture, Ecosystems & Environment, 140(1–2), pp. 264–272. [CrossRef]
- Mahmud, K., Panday, D., Mergoum, A. and Missaoui, A. (2021) Nitrogen losses and potential mitigation strategies for a sustainable agroecosystem. Sustainability, 13(4), p. 2400.
- Crooks, E.C., Harris, I.M. and Patil, S.D. (2021) Influence of Land Use Land Cover on River Water Quality in Rural North Wales, UK. JAWRA Journal of the American Water Resources Association, 57(3), pp. 357–373. [CrossRef]
- Mayer, P.M. et al. (2007) Meta-Analysis of Nitrogen Removal in Riparian Buffers. Journal of Environmental Quality, 36(4), pp. 1172–1180. [CrossRef]
- Bai, X. et al. (2024) Research progress of inland river water quality monitoring technology based on unmanned aerial vehicle hyperspectral imaging technology. Environmental Research, 257, p. 119254. [CrossRef]
- Welsh Government (2024) Sustainable Farming Scheme: proposed scheme outline (2024). Available at: https://www.gov.wales/sustainable-farming-scheme-proposed-scheme-outline-2024-html (Accessed: 14 December 2024).
- Gomes, E. et al. (2021) Future land-use changes and its impacts on terrestrial ecosystem services: A review. Science of The Total Environment, 781, p. 146716. [CrossRef]
- Camara, M., Jamil, N.R. and Abdullah, A.F.B. (2019) Impact of land uses on water quality in Malaysia: a review. Ecological Processes, 8(1), p. 10. [CrossRef]
- Locke, K.A. (2024) Impacts of land use/land cover on water quality: A contemporary review for researchers and policymakers. Water Quality Research Journal, 59(2), pp. 89–106. [CrossRef]
- Wang, S.-W. and Fan, C. (2023) Challenges of Water Quality Management for Agricultural Development. Water, 15(10), p. 1816. [CrossRef]
- Issaka, S. and Ashraf, M.A. (2017) Impact of soil erosion and degradation on water quality: a review. Geology, Ecology, and Landscapes, 1(1), pp. 1–11. [CrossRef]
- Siqueira, T. da S. et al. (2023) Evaluating land use impacts on water quality: perspectives for watershed management. Sustainable Water Resources Management, 9(6), p. 192. [CrossRef]
- Shannon, P.D. et al. (2019) Adaptation strategies and approaches for forested watersheds. Climate Services, 13, pp. 51–64. [CrossRef]
- Lintern, A. et al. (2018) Key factors influencing differences in stream water quality across space. WIREs Water, 5(1), p. e1260. [CrossRef]
- Watts, O. (2023) Water Quality in Wales: Research Briefing. Senedd Commission (Welsh Parliament). Available at: https://senedd.wales/media/v3fl5zes/23-12-water-quality-in-wales.pdf (Accessed: 11 October 2024).
- Dŵr Cymru Welsh Water (2022) Improving River Water Quality: a Dŵr Cymru Discussion Paper. Available at: https://corporate.dwrcymru.com/en/community/environment/river-water-quality (Accessed: 11 October 2024).
- Natural Resources Wales (2023) Wales Better River Quality Taskforce. Available at: https://cms.cyfoethnaturiol.cymru/about-us/what-we-do/our-roles-and-responsibilities/water/wales-better-river-quality-taskforce/?lang=en (Accessed: 11 October 2024).
- Olin, B. and Beevers, L. (2024) River Flashiness in Great Britain: A Spatio-Temporal Analysis. Atmosphere, 15(9), p. 1025. [CrossRef]
- Foulds, S.A. et al. (2012) Causes and consequences of a large summer storm and flood in west Wales, 8th–9th June 2012. Fluvio Report 2012/01/73, Aberystwyth University, p. 49. Available at: https://www.aber.ac.uk/en/media/departmental/dges/newsimages/west-wales-floods-(final)-2012-fluvio-and-aberystwyth-university.pdf (Accessed: 14 December 2024).
- Evans, C.D. et al. (2014) Persistent surface water acidification in an organic soil-dominated upland region subject to high atmospheric deposition: The North York Moors, UK. Ecological Indicators, 37, pp. 304–316. [CrossRef]
- Morton, R.D.; Marston, C.G.; O’Neil, A.W.; Rowland, C.S. (2024) Land Cover Map 2023 (10 m classified pixels, GB). NERC Environmental Information Data Centre. [CrossRef]
- Dewangan, S.K. and Srivatava, S.K. (2024) A correlation between EC and TDS in water: A review. IJPREMS, 5, pp. 180–186.
- Melesse, A.M., Khosravi, K., Tiefenbacher, J.P., Heddam, S., Kim, S., Mosavi, A. and Pham, B.T. (2020) River Water Salinity Prediction Using Hybrid Machine Learning Models. Water, 12(10), 2951. [CrossRef]
- Santy, S., Mujumdar, P. and Bala, G. (2022) Increased risk of water quality deterioration under climate change in Ganga River. Frontiers in Water, 4, p. 971623.
- Geels, C., Gyldenkærne, S., Nyord, T., Andersen, H.E., Molina-Navarro, E., Trolle, D., Thodsen, H., Bak, J.L., Konrad, M.T. and Hasler, B. (2023) Manure Acidification and Air Cleaners for Ammonia Abatement: A Holistic Assessment of the Costs and Effects on Terrestrial, Freshwater and Marine Ecosystems. Agronomy, 13, 283 (online).
Figure 1.
Map showing the catchment area for the Ystwyth River (outlined in red), from the Cambrian Mountains to Aberystwyth. The inset highlights the location of the AquaSonde deployment site and its proximity to the tributary Nant Pant-yr-haidd, and Ty Gwyn farm (Aberystwyth University).
Figure 1.
Map showing the catchment area for the Ystwyth River (outlined in red), from the Cambrian Mountains to Aberystwyth. The inset highlights the location of the AquaSonde deployment site and its proximity to the tributary Nant Pant-yr-haidd, and Ty Gwyn farm (Aberystwyth University).
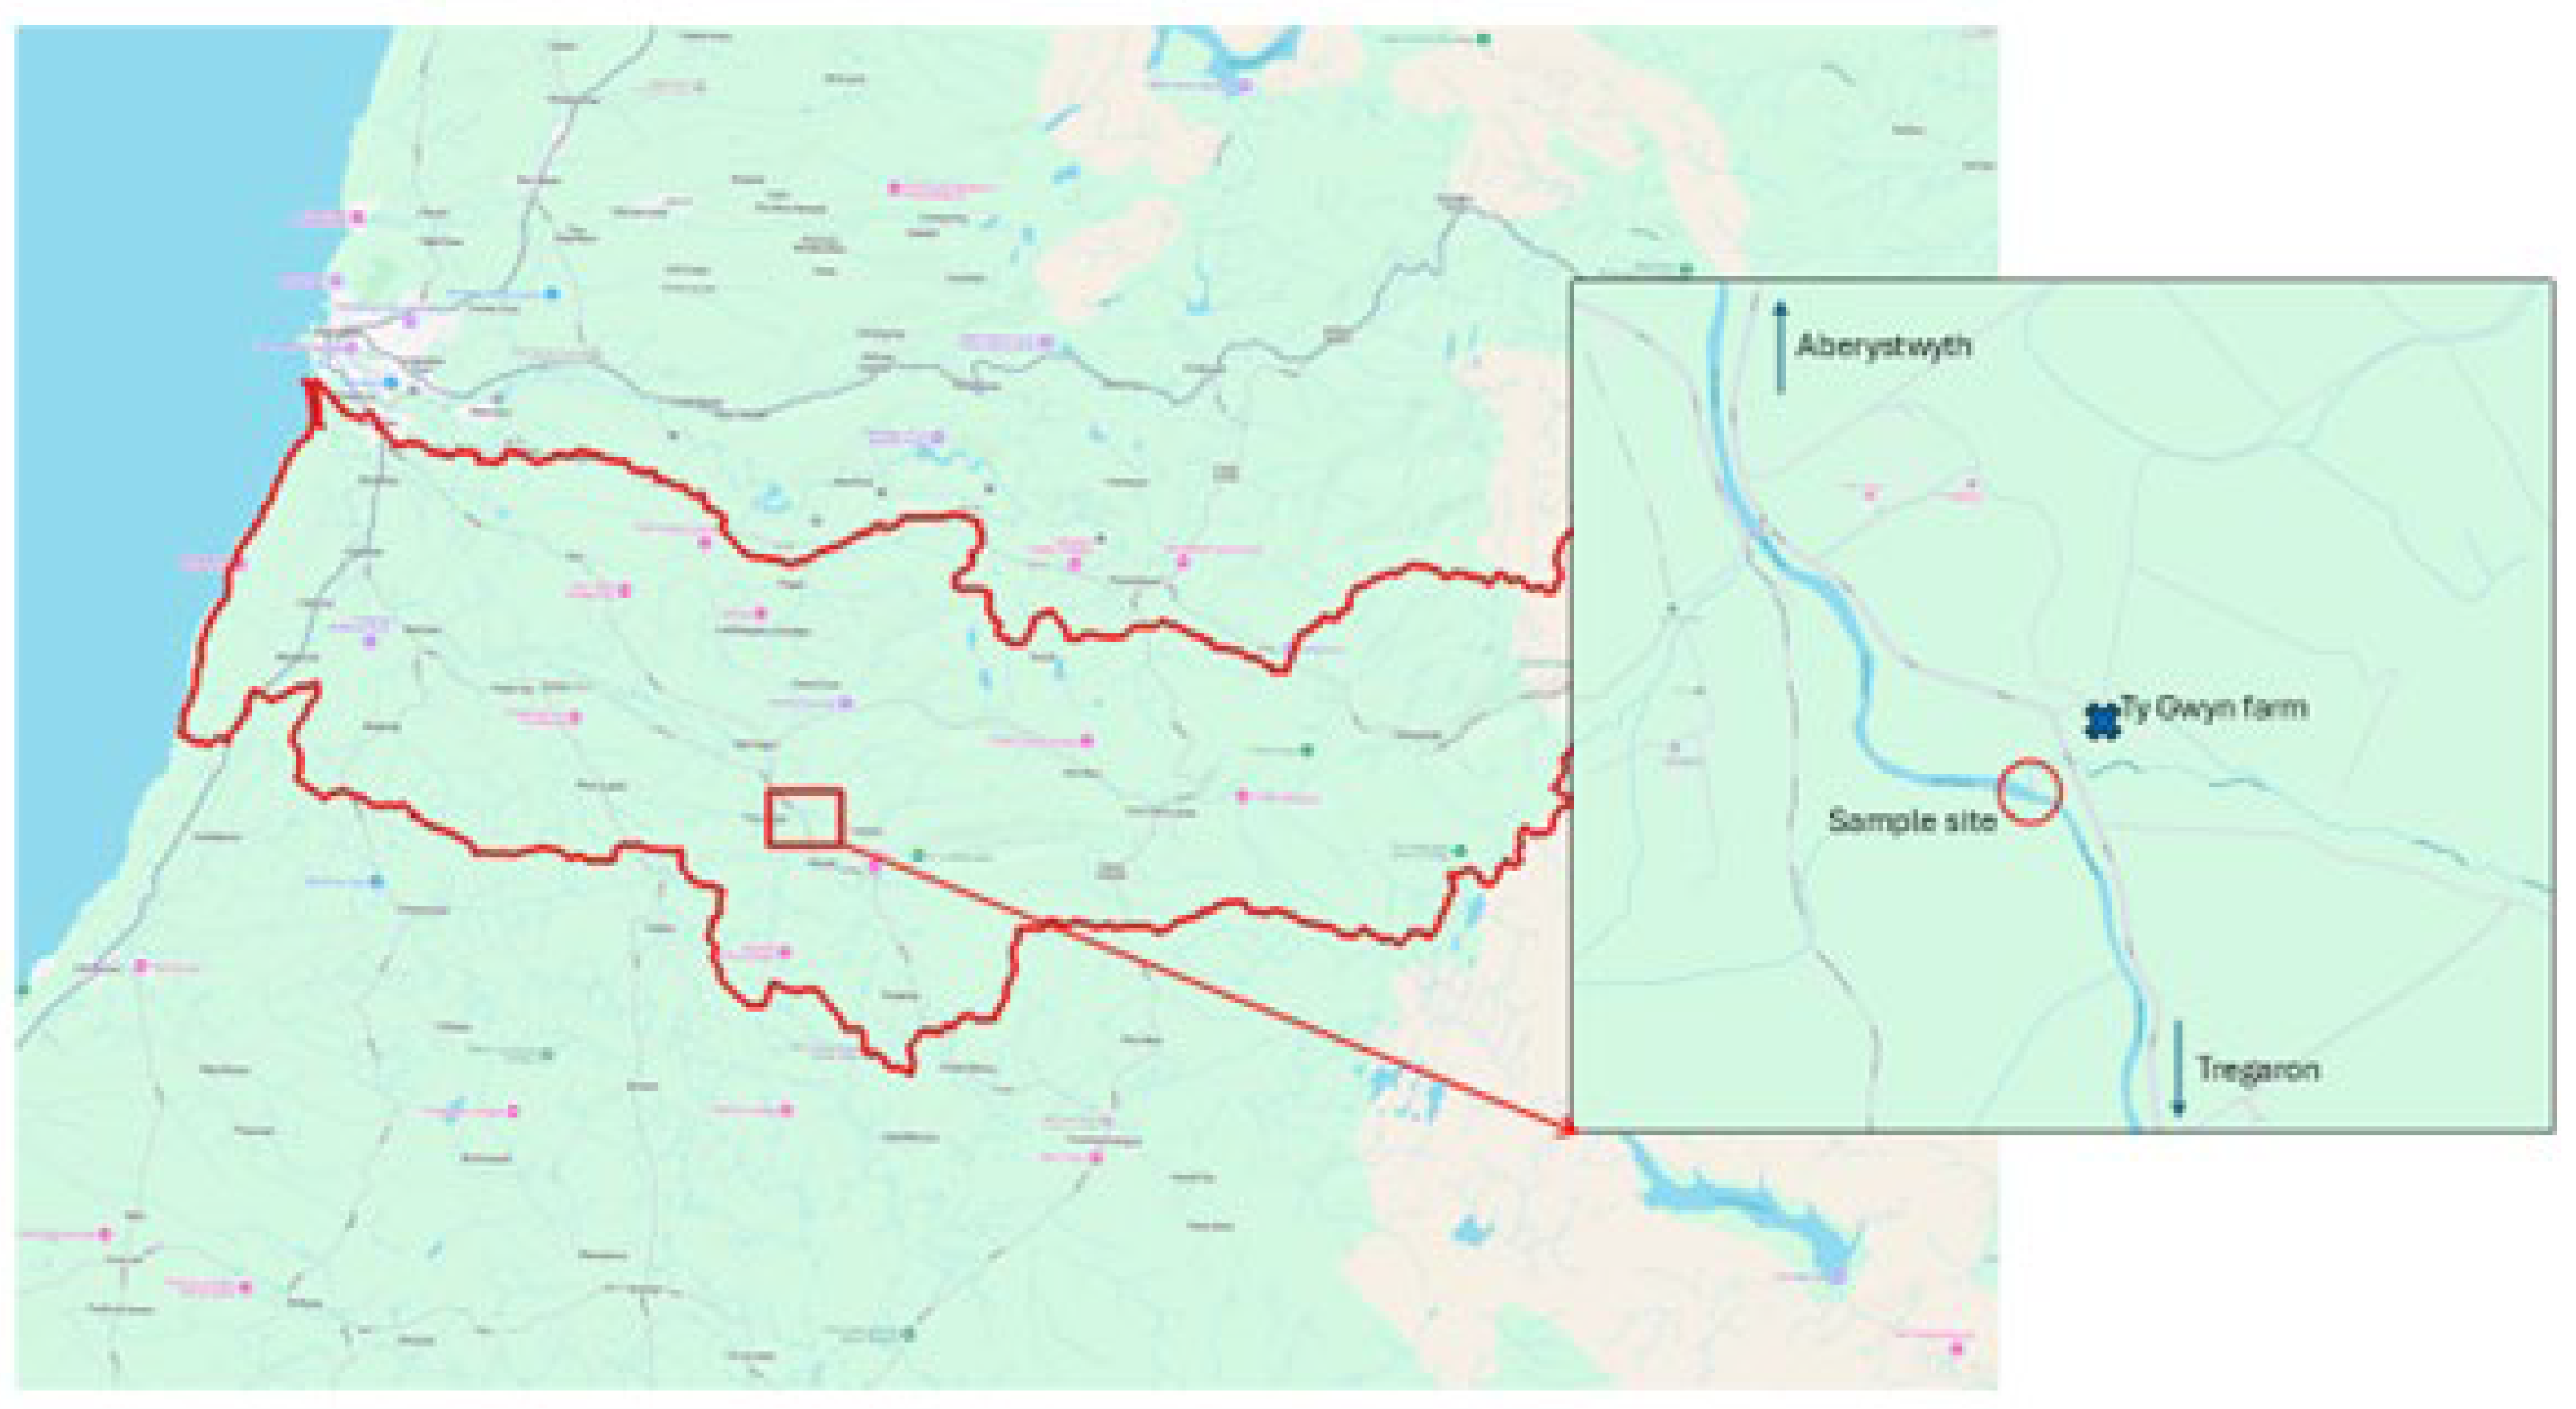
Figure 2.
Land use types within the Ystwyth River catchment as defined by Morton et al. (2024), highlighting the habitats and activities that may influence water quality. The AquaSonde was located within the lowland improved grassland area used for livestock farming.
Figure 2.
Land use types within the Ystwyth River catchment as defined by Morton et al. (2024), highlighting the habitats and activities that may influence water quality. The AquaSonde was located within the lowland improved grassland area used for livestock farming.
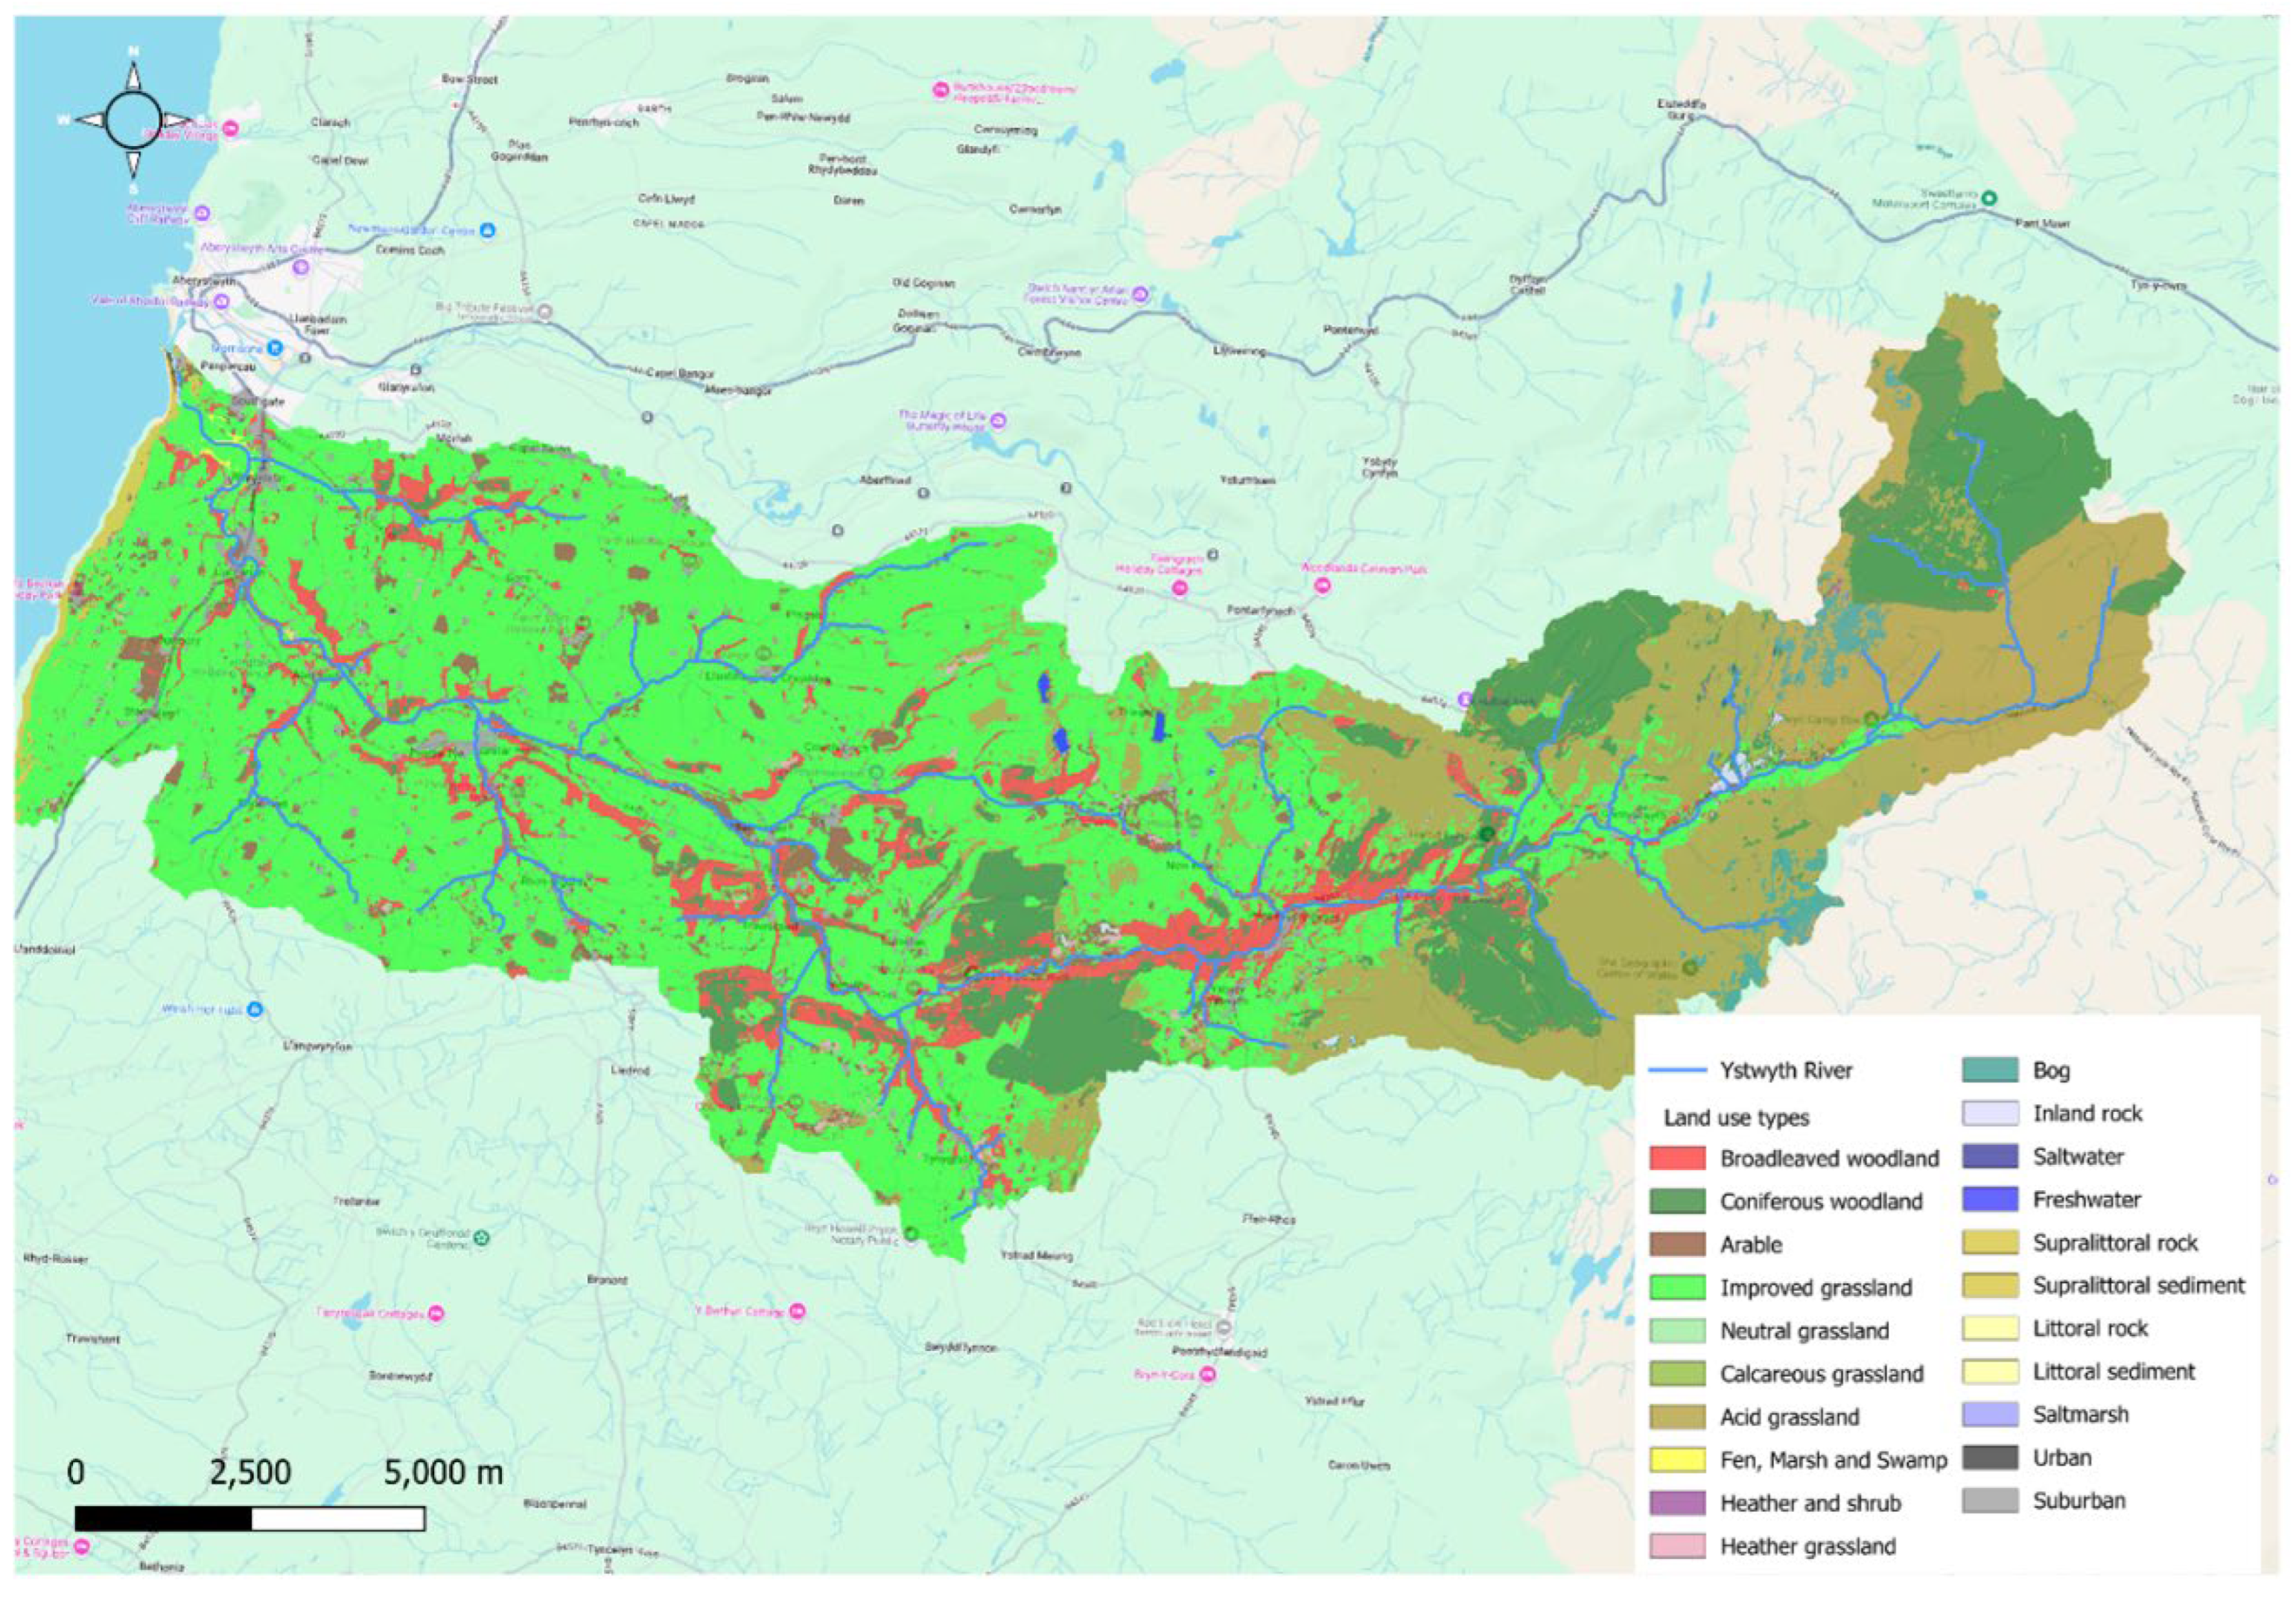
Figure 3.
The AquaSond-2000 (AS-2000) multiparameter water quality monitoring sonde used for continuous monitoring during the study period.
Figure 3.
The AquaSond-2000 (AS-2000) multiparameter water quality monitoring sonde used for continuous monitoring during the study period.
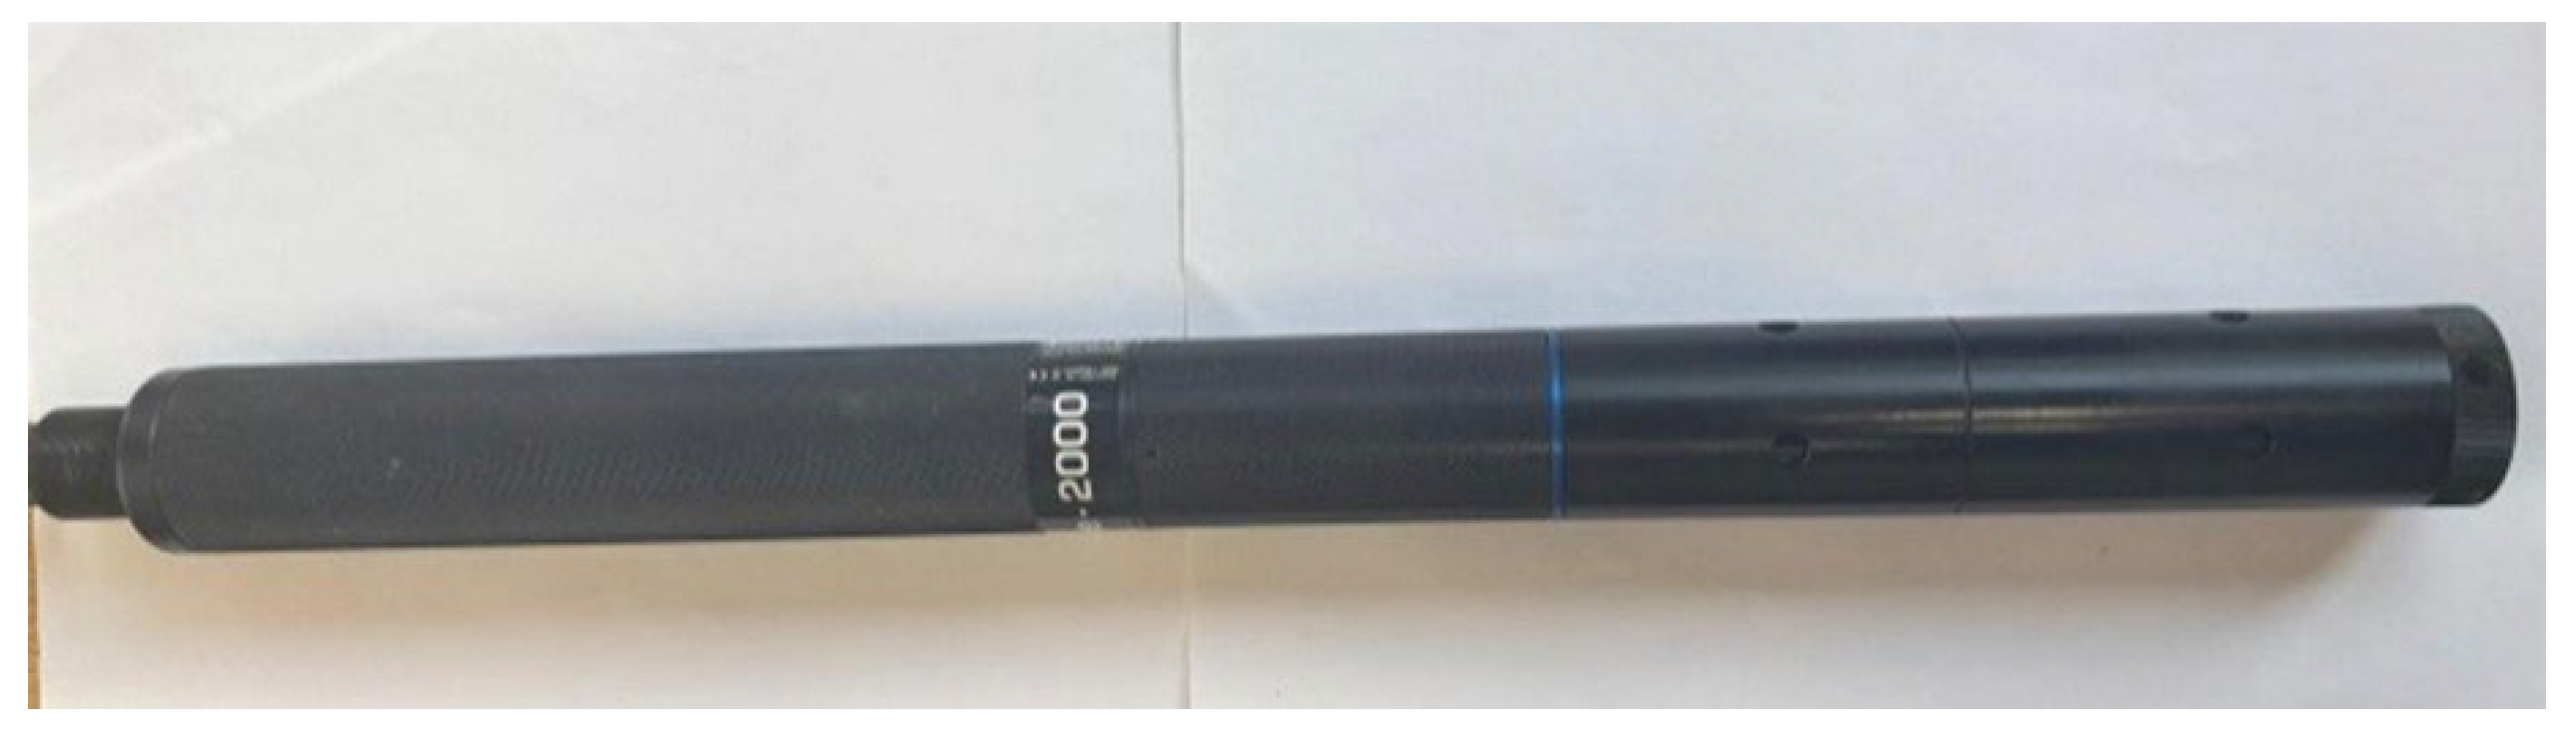
Figure 4.
Deployment setup of the AS-2000 within a protective plastic housing that allowed water to flow freely past the sensors while shielding the device from damage due to debris or sediment build-up. The sonde was anchored at a fixed point to ensure consistent submersion and was routinely checked to ensure continued operation and data quality.
Figure 5.
The interactive map interface within the water monitoring application, which displays water quality data from deployed sensors. Each marker corresponds to a monitoring site (the study sample site is shown here). Key water quality parameters are linked to the relevant marker.
Figure 5.
The interactive map interface within the water monitoring application, which displays water quality data from deployed sensors. Each marker corresponds to a monitoring site (the study sample site is shown here). Key water quality parameters are linked to the relevant marker.
Figure 6.
The mobile application interface as it appears on an Android device, illustrating the log-in page with cross-platform compatibility in a user-friendly format. Users may log in with various third-party accounts, ensuring broad accessibility to the data.
Figure 6.
The mobile application interface as it appears on an Android device, illustrating the log-in page with cross-platform compatibility in a user-friendly format. Users may log in with various third-party accounts, ensuring broad accessibility to the data.

Figure 7.
Time series plots showing the variations in key water quality parameters recorded by the AS-2000 during the monitoring period (May–June 2024). Parameters shown (left to right, top to bottom) are: total dissolved solids (TDS), electrical conductivity (EC), ammonia, dissolved oxygen (DO), pH, and temperature. The plots highlight notable fluctuations which may be influenced by surrounding land conditions.
Disclaimer/Publisher’s Note: The statements, opinions and data contained in all publications are solely those of the individual author(s) and contributor(s) and not of MDPI and/or the editor(s). MDPI and/or the editor(s) disclaim responsibility for any injury to people or property resulting from any ideas, methods, instructions or products referred to in the content. |
© 2025 by the authors. Licensee MDPI, Basel, Switzerland. This article is an open access article distributed under the terms and conditions of the Creative Commons Attribution (CC BY) license (http://creativecommons.org/licenses/by/4.0/).
Copyright: This open access article is published under a Creative Commons CC BY 4.0 license, which permit the free download, distribution, and reuse, provided that the author and preprint are cited in any reuse.


