
Submitted:
08 August 2025
Posted:
08 August 2025
You are already at the latest version
Abstract
Background/Objectives: Dyslipidemia is becoming a significant economic healthcare burden in low- to middle-income countries (LMICs) due to its role in heightening cardiovascular-related mortality. Statins are the first-line treatment for reducing LDL-C levels, thereby minimizing direct costs associated with cardiovascular disease management, with pitavastatin being the newest generation of statins. This research conducts a cost-utility analysis of pitavastatin to determine the economic benefit in Vietnam. Methods: A decision tree model was developed to compare the rate of LDL-C-controlled patients within a 12-week time horizon among patients treated with pitavastatin, atorvastatin, and rosuvastatin. The primary outcome was the Incremental Cost-Effectiveness Ratio (ICER), measured from the healthcare system perspective. Effectiveness was evaluated in terms of quality-adjusted life years (QALYs), using an annual discount rate of 3%. A one-way sensitivity analysis was performed to identify the key input parameters that most influenced the ICER outcomes. Results: Pitavastatin was cost-effective compared to atorvastatin but dominated by rosuvastatin after 3 months. Although pitavastatin gained less QALY than atorvastatin, the ICER was 6,254,017 VND/ QALY, well below Vietnam’s 2024 Willing-to-Pay. Drug cost had the most significant impact on ICERs. Conclusions: Pitavastatin represents an economical short-term alternative to atorvastatin, particularly in resource-constrained settings. Further evaluations over longer horizons are warranted to assess long-term cost-effectiveness.
Keywords:
cost-utility
; cost-effectiveness
; economic evaluation
; pitavastatin
; dyslipidemia
; hypercholesterolemia
; LDL-C reduction
; quality of life
; Vietnam
1. Introduction
Dyslipidemia is characterized by any abnormal blood lipid levels, including four main parameters: elevated total cholesterol (TC), triglycerides (TG), and low-density lipoprotein cholesterol (LDL-C), or persistently low high-density lipoprotein cholesterol (HDL-C) [1]. Among these abnormalities, high LDL-C is recognized as the most significant modifiable risk factor for the development of atherosclerotic plaques, leading to cardiovascular diseases (CVD [2,3,4,5]. CVD remains a global health crisis due to its high mortality rates in both developed and developing nations, with ischemic heart disease being the leading contributor [6]. Approximately one-third of cardiovascular-related conditions are attributed to uncontrolled cholesterol levels [7]. Uncontrolled LDL-C is more concerning in aging populations, particularly among individuals aged 60–89, as they not only face a threefold higher risk of CVD-related death compared to younger adults, but also experience a significant decline in quality of life [8]. The burden is especially severe in low- and middle-income countries (LMICs), where CVD accounts for nearly 80% of deaths according to the World Health Organization (WHO) [6]. From 1990 to 2019, high-income countries saw a drop of 35% in stroke mortality caused by high LDL-C, whereas the rates stayed largely the same or even rose in Asian and African countries [9]. Such rising dyslipidemia prevalences have placed increasing pressure on healthcare systems, straining budgets due to the cost of managing heart-related complications and long-term medication use [10,11,12]. Contributing factors include genetic predisposition, unhealthy diets high in fat, physical inactivity, urbanization, and lifestyle changes that accelerate comorbidities such as diabetes and obesity. Dyslipidemia often progresses silently and is usually detected late through laboratory tests, which delays intervention and results in heavier pressure on the healthcare system, along with increased premature mortality [13].
Reducing LDL-C to the optimal range is the prioritized goal to mitigate the risk of developing CVD and preserve treatment cost, with statins being the most efficient therapy as recommended by guidelines [8]. According to one review estimating the prevalence of hypercholesterolemia in Vietnam from 2010 to 2023, 67.6% of individuals were diagnosed with abnormal lipid profiles, highlighting the need for medical policies to select the most effective lipid-lowering medication to reduce the disease burden [14]. Pitavastatin, a newer-generation statin, is effective in lowering LDL-C even at low doses (1–4 mg/day) and has a favorable safety profile, with a reported rhabdomyolysis rate of only 0.01% [15,16]. Its unique metabolic pathway through glucuronidation, rather than relying heavily on CYP450 enzymes like other statins, helps minimize drug–drug interactions [17]. This metabolic difference also influences hepatic LDL receptor activity, enhancing the lipid-lowering efficacy of pitavastatin even at low doses, making it comparable to high doses of commonly used statins such as atorvastatin or simvastatin [17,18]. Thus, pitavastatin is a promising agent for hypercholesterolemia in the Asian context, particularly in Vietnam, where atorvastatin and rosuvastatin are the most commonly prescribed lipid-lowering agents. However, so far, there have been no economic evaluations to assess the cost-effectiveness of pitavatatin, which makes it difficult for stakeholders to justify its inclusion in national insurance coverage. Moreover, the high cost of Pitavastatin (VND 12,600 for 2 mg and VND 25,200 for 4 mg) compared to Atorvastatin (VND 15,941) and Rosuvastatin (VND 5,350) poses an access barrier for patients in Vietnam. This raises the question of whether its strong LDL-C-lowering effect justifies the high acquisition cost in hospital settings, and at what budget threshold pitavastatin could improve quality of life. This study aims to assess the cost-effectiveness of pitavastatin compared to atorvastatin and rosuvastatin in the treatment of dyslipidemia in Vietnam, based on the capability to achieve target LDL-C levels. The findings aim to inform health policy recommendations, such as including pitavastatin in the national insurance reimbursement list or implementing subsidy programs to optimize healthcare resource allocation and improve access to lipid-lowering therapy.
2. Materials and Methods
2.1. Study Design and Patient Population
This study employed a Cost-Utility Analysis (CUA) approach to evaluate the economic effectiveness of pitavastatin in treating dyslipidemia.
The study population was sourced from an economic analysis conducted in South Korea in 2017 by Jeong et al. [19]. The initial patient cohort consisted of patients aged ≥18 years (either hospitalized or receiving outpatient care) who were diagnosed with dyslipidemia and had no prior history of statin use. The mean age of participants was 61 years. Additionally, the patients must meet inclusion criteria specifying LDL-C levels ≥100 mg/dL. In contrast, patients were excluded if they had a history of prior statin use, were currently taking statins, had undergone dose adjustments within the past 12 weeks, or lacked LDL-C measurement data.
2.2. Perspective, Time Horizon, and Discount Rate
The study adopted a 12-week treatment period as the time horizon, based on clinical trial durations reported in the literature. Additionally, the research assessed the cost-effectiveness from a healthcare perspective, using a 3% annual discount rate.
2.3. Model Structure
To simulate the treatment process and compare statins, a decision tree model was developed following the recommendation from the 2024 Vietnamese Guidelines for the Management of Dyslipidemia issued by the Vietnam National Heart Association (VNHA) [20], in combination with the Korean cholesterol management protocol [19]. Regarding treatment options, the model discussed the three interventions, corresponding with three statins: Pitavastatin, Atorvastatin, and Rosuvastatin (as shown in Figure 1). Each statin was analyzed at two commonly used clinical doses: Pitavastatin 2 mg and 4 mg, Atorvastatin 10 mg and 20 mg, and Rosuvastatin 5 mg and 10 mg.
Patients were initially treated with one of the three statins at starting doses: Pitavastatin 2 mg, Atorvastatin 10 mg, or Rosuvastatin 5 mg for the first 8 weeks, according to VNHA guidelines [21]. LDL-C goal attainment was assessed at the end of this period. Patients who failed to reach the LDL-C target were escalated to double the initial dose during the final 4 weeks, including Pitavastatin 4 mg, Atorvastatin 20 mg, or Rosuvastatin 10 mg. The model then stratified patients into two outcomes: those who achieved or did not achieve the LDL-C target, followed by an assumption of differential cardiovascular event risk (stroke, myocardial infarction, or revascularization), and an estimation of corresponding quality-adjusted life years (QALYs). The model’s process, including the initial dose, assessment interval, and alternative treatment if LDL-C concentration is not controlled, is based on the 2024 Vietnamese Guidelines for the Management of Dyslipidemia by the VNHA [20].
2.4. Model Inputs
2.4.1. Clinical Effectiveness
The clinical effectiveness of each treatment is calculated based on the probability of patients achieving the LDL-C target, which is summarized in Table 1. It is assumed that once patients successfully reduce LDL-C, the efficacy is maintained for the rest of the individual’s lifetime.
2.4.2. Cost
The study employed direct costs only, including medication prices (based on the 2024 bidding report published by the Drug Administration of Vietnam [23]), and healthcare service costs (consultations and laboratory tests) as portrayed in Table 2, according to the Ministry of Health’s circular issued in 2023 [24]. All the monetary value is presented as Vietnam Dong (VND), with the exchange rate in 2024 as 1 USD = 24,164.89 VND [25].
2.4.3. Utility
The baseline utility weights in this study were stratified by age group (as shown in Table S1) and adjusted based on major cardiovascular events, including stroke, myocardial infarction, and revascularization, which are potential complications of poorly controlled dyslipidemia (as demonstrated in Table S2). No specific data were found to reflect changes in utility values following treatment with the pharmaceutical interventions under consideration. Therefore, the utility values for all treatment arms were assumed to be equivalent throughout the entire analysis period. To calculate the utility of each decision, we multiply the utility by the probability of that health state (achieving LDL-C target or not), with the formula as follows:
Utility per branch = Utility Weight x Probability
For example, the utility of participants treated with pitavastatin 2 mg and achieving an LDL-C level was determined by the utility value in Table S1 and the corresponding probability (Table 1) as 0.8255 × 0.717 = 0.59188350. The comprehensive utility of each progress is portrayed in Table 3. The final utility of each intervention is determined by the total utility of that drug, which was further used to translate to the expected QALY (not displayed in Table 3). For example, the final utility of atorvastatin is the sum of atorvastatin 20 mg and atorvastatin 10 mg branches.
2.5. Statistical Analysis
2.5.1. Primary Outcome
Input parameters, including costs, treatment effectiveness, and utility values, were processed through expected cost and QALY calculations. In CUA, the primary outcome is the Incremental Cost-Effectiveness Ratio (ICER). ICER is a ratio of the cost needed in exchange for a specific effectiveness comparing 2 interventions. The ICERs approach allows comparing the economic advantage between the two treatments that have distinct clinical efficacy. In this case, the effectiveness is measured by QALY—a health outcome which ranges from 0 to 1, with one equivalent to perfect health, and any value less than 1 indicates a decreasing health state [26]. The formula is presented as follows:
Regarding cost, the total cost per intervention (which is called the expected total cost) is calculated based on the sum of costs multiplied by the probability of achieving effectiveness, as shown in the formula:
Expected total cost per decision = cost x probability
As each intervention consisted of two doses, the total expected cost of pitavastatin would be measured based on the sum of the cost of pitavastatin 2 mg and pitavastatin 4 mg. A similar calculation would be applied in atorvastatin and rosuvastatin cases.
On the other hand, the expected QALY of each intervention is calculated indirectly from utilities and the life years gained (LYG), with the formula as:
QALY = Utility x LYG
Specifically, LYG is determined by subtracting the mean age of the Vietnam population from the mean age of the study population. Following the 2024 Midterm Population and Housing Census Press Release by the General Statistics Office of Vietnam, the average age of the Vietnamese population is 75 years [27]. The mean age of the study population is 61 years.
Finally, the ICERs were then compared with Vietnam’s willingness-to-pay (WTP) threshold to determine the cost-effectiveness of each treatment strategy. The gross domestic product GDP of Vietnam measures the WTP. As the WHO recommends, the intervention that has ICER surpass x3 times the GDP of the specific nation is deemed “not cost-effective”. The range within 1 to 3 times GDP is “cost-effective” and “very cost-effective” if the ICER falls below x1 GDP. According to the financial report collected from the General Statistics Office (GSO) of Vietnam in 2024 [28]. Vietnam’s GDP per capita was VND 114,000,000; therefore, the WTP threshold used for the analysis in Vietnam was set at VND 342,000,000.
2.6. Sensitivity Analysis
One-way sensitivity analysis was conducted using a Tornado chart to assess the model’s sensitivity to uncertainty in input variables. Each parameter of interest is changed while the other remain constant to evaluate the impact of that factor on the ICERs range [29,30]. The variation is within ± 20%. The results are portrayed in a Tornado chart, which helps researchers identify the most influential factor in the overall ICER value.
3. Results
3.1. Cost, QALY
The total expected cost for each intervention is summarized in Table 4, while a detailed breakdown of cost components per intervention is provided in Table S3. Among the three treatment options, rosuvastatin was the least costly, with a total expected cost of VND 687,707. Pitavastatin incurred nearly twice the price of rosuvastatin but remained slightly less expensive than atorvastatin, with a total anticipated cost of VND 1,407,546.
On the other hand, the calculated QALYs of each intervention are shown in Table 5. Although pitavastatin improved patients’ quality of life, its QALY was slightly lower compared to atorvastatin and rosuvastatin.
3.2. ICERs
3.2.1. Pitavastatin vs. Atorvastatin
The cost-effectiveness of pitavastatin compared to atorvastatin is presented in Table 6. Overall, using pitavastatin resulted in a cost saving of VND 174,250 over three months compared to atorvastatin, albeit with a slight reduction in quality-adjusted life years (QALY). Consequently, the incremental cost-effectiveness ratio (ICER) of pitavastatin was calculated to be VND 6,254,017 per QALY. This figure is less than 10% of Vietnam’s per capita GDP (VND 114,000,000), indicating that pitavastatin is a cost-effective alternative to atorvastatin in the Vietnamese healthcare context.
3.2.2. Pitavastatin vs. Rosuvastatin
The ICER result comparing pitavastatin and rosuvastatin is shown in Table 7. The pitavastatin strategy required a substantially higher financial investment, yielding a lower QALY compared to rosuvastatin. The resulting ICER of –45,868,678 VND/QALY indicates that pitavastatin was dominated by rosuvastatin, suggesting that rosuvastatin is both more effective and less costly in this comparison.
3.3. One-Way Sensitivity Analysis
The result of the one-way sensitivity analysis, illustrating the distribution of ICERs when adjusting input parameters for the comparison between pitavastatin and atorvastatin, is shown in Figure 2. The most influential factors were the drug cost of pitavastatin 2 mg, followed by utility, and the cost of pitavastatin 4 mg. As the drug price of pitavastatin was reduced, the cost-effectiveness improved significantly, with ICERs dropping by 110.02%. In contrast, laboratory test expenses were the least likely to alter the cost-effectiveness of the treatment.
Regarding the DSA result comparing pitavastatin and rosuvastatin in Figure 3, utility and the drug cost of pitavastatin 2 mg were the most impactful parameters. Utility was particularly sensitive, as ICERs dropped substantially regardless of whether the utility increased or decreased. In contrast, medical costs had the least influence on the ICERs.
4. Discussion
4.1. Cost-Effectiveness
The study reveals that pitavastatin is more cost-effective than atorvastatin but more expensive than rosuvastatin over 3 months. Although pitavastatin yielded a slightly lower QALY, the difference was minor and offset by its lower cost compared to atorvastatin. In contrast, when compared to rosuvastatin, pitavastatin yielded a negative ICER (–45,868,678 VND/QALY), signifying that rosuvastatin is both more effective and less costly, thereby establishing it as the dominant strategy in the current model. The divergence in cost-effectiveness trends when comparing pitavastatin to atorvastatin versus rosuvastatin stems primarily from differences in drug pricing, a factor confirmed by one-way sensitivity analysis as having the most significant impact on ICER values. In Vietnam, rosuvastatin is widely available as a generic medication, while pitavastatin remains primarily confined to branded formulations. As a result, the price per tablet of pitavastatin is two to three times higher than that of generic rosuvastatin. Consequently, the total cost of pitavastatin treatment is more than double that of rosuvastatin.
Regarding the comparison with atorvastatin, the ICER of pitavastatin versus atorvastatin was well below Vietnam’s GDP per capita threshold (114 million VND/QALY), strengthening the conclusion that pitavastatin offers greater cost savings as a “very cost-effective” treatment option. However, this conclusion holds only under the condition that the probability of achieving LDL-C targets remains high. In our study, a large proportion of patients successfully achieved LDL-C targets across all three treatment arms, with calculated rates of 94.22% for pitavastatin, 95.91% for atorvastatin, and 95.18% for rosuvastatin. While these figures are consistent with previous estimates from a systematic review in Asia (which reported LDL-C goal attainment with pitavastatin ranging from 75% to 95%) [31]. The values reported in our model are at the upper bound of that range, raising questions about real-world plausibility. Achieving a 95% success rate in LDL-C control would require patients to strictly adhere to the prescribed regimen throughout the entire 12-week treatment period and to sustain that adherence over the subsequent 14 years. In reality, however, non-adherence to statin therapy is common, with many patients discontinuing treatment or missing doses, which could compromise long-term effectiveness and, consequently, the reliability of ICER projections.
Meta-analyses have revealed that adherence to statin therapy for cardiovascular disease prevention remains low, typically ranging between 50% and 60% [32]. Even for well-established statins like atorvastatin, which have been widely circulated in healthcare systems, adherence remains suboptimal, with real-world data showing a compliance rate of only 39%, and even lower (37%) among patients at high risk for cardiovascular disease [33]. Notably, a large-scale 2019 study in Taiwan assessing long-term statin use in over 180,000 patients following hospital discharge demonstrated significant declines in adherence over time. While 71% of patients were considered adherent in the first six months, this rate dropped to 51% at one year, and further declined to 42% by the end of year seven [34]. These findings underscore a substantial gap between the modelled assumption of sustained LDL-C target attainment and real-world treatment dynamics. As a result, the idealized ICER of pitavastatin, although favorable, may lack sufficient credibility to persuade healthcare providers or policymakers to shift from atorvastatin to pitavastatin, particularly when assessing long-term cost-effectiveness. Not to mention, Vietnam is classified as a lower-middle-income country [35], where the government is more likely to allocate its limited healthcare budget to address acute conditions with immediate mortality risks, rather than invest in managing risk factors with delayed or invisible outcomes, such as lipid control. In this context, pitavastatin is a cost-effective option, but it is not affordable to implement on a large scale in clinical practice.
However, the demonstrated cost-effectiveness of pitavastatin over atorvastatin at 12 weeks may still offer value as an alternative treatment option. Our results estimated that patients treated with pitavastatin 2 mg had around a 71.7% chance of achieving the LDL-C target, which is similar to a Japanese study that reported a 60–70% success rate depending on cardiovascular risk levels [36]. One notable benefit of pitavastatin is its high tolerability, as it can avoid metabolism by CYP3A4, a common pathway for many other statins, including atorvastatin [37]. As such, pitavastatin is especially appropriate in clinical scenarios where LDL-C lowering is not the sole therapeutic goal, and patients require polypharmacy to manage conditions such as HIV [38], impaired glucose metabolism in diabetes mellitus [39], reducing CVD events [40], problems with hepatic and renal function [41]. Although transitioning to pitavastatin may slightly reduce QALY, it can save total healthcare costs and reduce the likelihood of complications, making it an economically reasonable choice. On the other hand, Asian populations are known to be more sensitive to statins. Lower doses already show strong LDL-C lowering; however, at the same time, patients are at a higher risk of musculoskeletal side effects [42]. Based on these findings, our analysis can give clinicians and healthcare specialists a viable option for statin-naïve individuals, particularly older adults or those at increased risk of intolerance.
4.2. Strengths and Limitations
The study employed a decision tree model to visualize the progression of health states, a strength when conducting cost–utility analysis in dyslipidemia. Unlike Markov models, the decision tree assumes a one-way progression, where each health state happens only once and does not repeat in cycles. This structure enables simplified assumptions and facilitates precise tracking of intervention effectiveness over a short-term horizon. In addition, the analysis compared pitavastatin with the two most widely used statins in clinical practice, providing clinicians with more insight into choosing the most effective statin for their patients. Regarding cost, the drug prices were taken from Vietnam’s official databases, so the cost-effectiveness of pitavastatin calculated in this evaluation is relevant and applicable to the real-world healthcare context.
On the other hand, this study has several limitations that may affect the generalizability and practical applicability of its findings. First, the analysis was limited to a 12-week time horizon. This relatively short period is insufficient to model major cardiovascular events such as myocardial infarction, stroke, cardiovascular-related mortality, or long-term maintenance treatment costs. Second, most of the input data were derived from international studies (e.g., LDL-C reduction effectiveness, utility weights, and complication probabilities). In contrast, local data from Vietnam remain limited, particularly in terms of cost profiles and patient quality of life. Differences in population characteristics, treatment conditions, and the healthcare system may result in model outcomes that do not accurately reflect real-world clinical practice in Vietnam. Additionally, this study focused solely on direct costs and did not account for indirect costs, such as productivity loss or other societal expenses. These limitations underscore the need for future research that is designed with a longer time horizon and incorporates better integration of real-world Vietnamese data and comprehensive health economic analysis, in order to enhance the reliability and applicability of findings for pharmaceutical policymaking and clinical practice.
5. Conclusions
Pitavastatin is more cost-effective than atorvastatin but not more cost-effective than rosuvastatin in a 12-week treatment. Although choosing pitavastatin would result in lower QALY, it reduces overall cost, with the calculated ICERs being VND 6,254,017 per QALY, substantially below Vietnam’s WTP. In the case of rosuvastatin, the higher cost of pitavastatin led to negative ICERS, indicating that rosuvastatin is the dominant option (lower cost, higher QALY). Drug cost is the main factor driving the ICERs. However, counting on ICERs alone would not be enough to evaluate the real economic effectiveness of pitavastatin, especially in long-term and in LMIC settings. A longer-term economic analysis should be conducted to estimate the real-world cost-benefit of pitavatatin.
Supplementary Materials
The following supporting information can be downloaded at the website of this paper posted on Preprints.org.
Author Contributions
Conceptualization, N.X.V. and T.T.B.; methodology, N.X.V.; software, T.T.B., N.M.P and H.L.P.; validation, N.X.V. and T.T.B.; formal analysis, T.T.B, H.T.M.N and H.L.P.; investigation, N.X.V.; resources, H.L.P., H.T.M.N, N.M.P, T.T.B., and T.T.B.; data curation, H.L.P., H.T.M.N, T.T.B., T.T.B., and N.X.V.; writing—original draft preparation, H.T.M.N, N.M.P, H.L.P., T.T.B., and T.T.B.; writing—review and editing, N.X.V., H.L.P., T.T.B., and T.T.B.; visualization, N.X.V. and T.T.B.; supervision, N.X.V.; project administration, N.X.V. All authors have read and agreed to the published version of the manuscript.
Funding
This research received no external funding.
Institutional Review Board Statement
Not applicable.
Informed Consent Statement
Not applicable.
Data Availability Statement
No new data were created or analyzed in this study.
Conflicts of Interest
The authors declare that they have no conflicts of interest.
References
- Mohamed-Yassin, M.S.; Baharudin, N.; Abdul-Razak, S.; Ramli, A.S.; Lai, N.M. Global prevalence of dyslipidaemia in adult populations: a systematic review protocol. BMJ Open 2021, 11, e049662. [Google Scholar] [CrossRef] [PubMed]
- Baig, Z.A.; Rashid, A.; Majeed, A.; Masood, Z.; Faryal, A.; Khan, Z.A.; Razaq, A. Risk Analysis and Assessment of Lipid Abnormalities as the Earliest Complication in Newly Diagnosed Diabetic and Non-Diabetic Individuals of a Local Population. Healthcare (Basel) 2022, 10. [Google Scholar] [CrossRef] [PubMed]
- Mossavarali, S.; Azizpour, Y.; Golestani, A.; Rezaei, N.; Khosravi, S.; Mirzad, M.; Khashayar, P.; Tabatabaei-Malazy, O. Prevalence of dyslipidemia and its association with blood pressure control in Iranian hypertensive patients: insights from STEPS 2021. Lipids Health Dis. 2025, 24, 232. [Google Scholar] [CrossRef]
- Noubiap, J.J.; Nansseu, J.R.; Bigna, J.J.; Jingi, A.M.; Kengne, A.P. Prevalence and incidence of dyslipidaemia among adults in Africa: a systematic review and meta-analysis protocol. BMJ Open 2015, 5, e007404. [Google Scholar] [CrossRef]
- Maimaitituersun, G.; Jureti, S.; Yi, Z.; Zhou, Y.; Li, M.; Wei, M.; Liu, Z.; Jin, M.; Fu, Z. Trends in dyslipidemia prevalence among Uyghur adults of different genders in China: a retrospective cohort study. PeerJ 2025, 13, e19344. [Google Scholar] [CrossRef]
- Wurie, H.R.; Cappuccio, F.P. Cardiovascular disease in low- and middle-income countries: an urgent priority. Ethn. Health 2012, 17, 543–50. [Google Scholar] [CrossRef]
- Presta, V.; Tocci, G.; Volpe, M. Excess of dyslipidemia in low income countries: The case of Colombia in the PURE study. Int. J. Cardiol. 2019, 290, 152–153. [Google Scholar] [CrossRef]
- Pirillo, A.; Norata, G.D. The burden of hypercholesterolemia and ischemic heart disease in an ageing world. Pharmacol. Res. 2023, 193, 106814. [Google Scholar] [CrossRef]
- Li, C.; Spencer, G.; Husain, M.J.; Nugent, R.; Auzenne, D.; Kostova, D.; Richter, P. Barriers to accessibility of medicines for hyperlipidemia in low- and middle-income countries. PLOS Glob. Public. Health 2024, 4, e0002905. [Google Scholar] [CrossRef] [PubMed]
- Ferrara, P.; Di Laura, D.; Cortesi, P.A.; Mantovani, L.G. The economic impact of hypercholesterolemia and mixed dyslipidemia: A systematic review of cost of illness studies. PLoS One 2021, 16, e0254631. [Google Scholar] [CrossRef]
- Hussein, G.; Albashari, M.S.; Alarfaj, H.M.; Houdane, A.; Wagley, Z.; Alsaleh, A.A.; Alendijani, Y.A. Assessment of the Effective Management of Patients With Severe Primary Hypercholesterolemia Under Care in Family Medicine Clinics at King Faisal Specialist Hospital and Research Centre, Riyadh, Saudi Arabia. Cureus 2022, 14, e30701. [Google Scholar] [CrossRef]
- Mohamed-Yassin, M.S.; Baharudin, N.; Daher, A.M.; Abu Bakar, N.; Ramli, A.S.; Abdul-Razak, S.; Mohamed Noor Khan, N.A.; Mohamad, M.; Yusoff, K. High prevalence of dyslipidaemia subtypes and their associated personal and clinical attributes in Malaysian adults: the REDISCOVER study. BMC Cardiovasc. Disord. 2021, 21, 149. [Google Scholar] [CrossRef]
- Piragine, E.; Malanima, M.A.; Ceccanti, C.; Guidi, L.; Martelli, A.; Lucenteforte, E.; Calderone, V. Alliaceae versus Brassicaceae for Dyslipidemia: State of the Art and Future Perspectives. Systematic Review and Meta-Analysis of Clinical Studies. Phytother. Res. 2024, 38, 5765–5781. [Google Scholar] [CrossRef]
- Le, T.T.L.; Nguyen, V.T.; Duong, T.A.; Tran, L.T.; Dang, C.S.; Nguyen, H.D.; Dang, K.A.; Nguyen, L.T.A.; Le, T.H. A SYSTEMATIC REVIEW OF BLOOD LIPID PROFILES IN VIETNAMESE ADULTS FROM 2010 TO 2023. Tạp chí Y học Việt Nam 2024, 544. [Google Scholar] [CrossRef]
- Jeong, I.K.; Kim, S.R. Efficacy and Safety of Pitavastatin in a Real-World Setting: Observational Study Evaluating SaFety in Patient Treated with Pitavastatin in Korea (PROOF Study). Endocrinol Metab (Seoul) 2020, 35, 882–891. [Google Scholar] [CrossRef]
- Catapano, A.L. Statin-induced myotoxicity: pharmacokinetic differences among statins and the risk of rhabdomyolysis, with particular reference to pitavastatin. Curr. Vasc. Pharmacol. 2012, 10, 257–67. [Google Scholar] [CrossRef] [PubMed]
- Fujino, H.; Nakai, D.; Nakagomi, R.; Saito, M.; Tokui, T.; Kojima, J. Metabolic stability and uptake by human hepatocytes of pitavastatin, a new inhibitor of HMG-CoA reductase. Arzneimittelforschung 2004, 54, 382–8. [Google Scholar] [CrossRef] [PubMed]
- Hoy, S.M. Pitavastatin: A Review in Hypercholesterolemia. Am. J. Cardiovasc. Drugs 2017, 17, 157–168. [Google Scholar] [CrossRef] [PubMed]
- Jeong, Y.J.; Kim, H.; Baik, S.J.; Kim, T.M.; Yang, S.J.; et al. Analysis and comparison of the cost-effectiveness of statins according to the baseline low-density lipoprotein cholesterol level in Korea. J. Clin. Pharm. Ther. 2017, 42, 292–300. [Google Scholar] [CrossRef] [PubMed]
- 2024 Guidelines of the Vietnam National Heart Association on the Management of Dyslipidemia. Available online: https://vnha.org.vn/detail/25536/khuyen-cao-cua-hoi-tim-mach-hoc-viet-nam-ve-dieu-tri-roi-loan-lipid-mau-2024.html (accessed on 6 August 2025).
- Lee, Z.V.; Llanes, E.J.; Sukmawan, R.; Thongtang, N.; Ho, H.Q.T.; Barter, P. Prevalence of plasma lipid disorders with an emphasis on LDL cholesterol in selected countries in the Asia-Pacific region. Lipids Health Dis. 2021, 20, 33. [Google Scholar] [CrossRef]
- Ose, L.; Budinski, D.; Hounslow, N.; Arneson, V. Comparison of pitavastatin with simvastatin in primary hypercholesterolaemia or combined dyslipidaemia. Curr. Med. Res. Opin. 2009, 25, 2755–64. [Google Scholar] [CrossRef]
- Compiled Bioequivalence Study Reports from Reporting Units, updated as of May 16, 2024. Available online: https://dav.gov.vn/tong-hop-bao-cao-kqtt-cua-cac-don-vi-bao-cao-cap-nhat-den-ngay-1652024-n4414.html (accessed on 6 August 2025).
- Circular No. 22/2023/TT-BYT dated November 17, 2023, issued by the Minister of Health, prescribing uniform pricing for medical examination and treatment services covered by health insurance across hospitals of the same classification nationwide, and guiding the application of pricing and reimbursement in certain cases. Available online: https://medinet.gov.vn/chuyen-muc/thong-tu-so-222023tt-byt-ngay-17-thang-11-nam-2023-cua-bo-truong-bo-y-te-quy-di-c4627-69292.aspx (accessed on 6 August 2025).
- Official exchange rate (LCU per US$, period average)—Viet Nam. Available online: https://data.worldbank.org/indicator/PA.NUS.FCRF?locations=VN (accessed on 6 August 2025).
- Prieto, L.; Sacristán, J.A. Problems and solutions in calculating quality-adjusted life years (QALYs). Health Qual. Life Outcomes 2003, 1, 80. [Google Scholar] [CrossRef]
- Press Release: Results of the 2024 Midterm Population and Housing Census. Available online: https://www.nso.gov.vn/du-lieu-va-so-lieu-thong-ke/2025/01/thong-cao-bao-chi-ket-qua-dieu-tra-dan-so-va-nha-o-giua-ky-nam-2024/ (accessed on 6 August 2025).
- The Fourth Quarter and Annual 2024 Socio-Economic Report. Available online: https://www.nso.gov.vn/bai-top/2025/01/bao-cao-tinh-hinh-kinh-te-xa-hoi-quy-iv-va-nam-2024/ (accessed on 6 August 2025).
- Vreman, R.A.; Geenen, J.W.; Knies, S.; Mantel-Teeuwisse, A.K.; Leufkens, H.G.M.; Goettsch, W.G. The Application and Implications of Novel Deterministic Sensitivity Analysis Methods. Pharmacoeconomics 2021, 39, 1–17. [Google Scholar] [CrossRef]
- McCabe, C.; Paulden, M.; Awotwe, I.; Sutton, A.; Hall, P. One-Way Sensitivity Analysis for Probabilistic Cost-Effectiveness Analysis: Conditional Expected Incremental Net Benefit. Pharmacoeconomics 2020, 38, 135–141. [Google Scholar] [CrossRef]
- Vo, N.X.; Pham, H.L.; Bui, T.T.; Bui, T.T. Systematic Review on Efficacy, Effectiveness, and Safety of Pitavastatin in Dyslipidemia in Asia. Healthcare 2024, 13. [Google Scholar] [CrossRef]
- Krüger, K.; Leppkes, N.; Gehrke-Beck, S.; Herrmann, W.; Algharably, E.A.; Kreutz, R.; Heintze, C.; Filler, I. Improving long-term adherence to statin therapy: a qualitative study of GPs’ experiences in primary care. Br. J. Gen. Pract. 2018, 68, e401–e407. [Google Scholar] [CrossRef]
- Tsioufis, K.; Castellano Vázquez, J.M.; Sykara, G.; Mondello Malvestiti, F.; van Vugt, J. Real-world Evidence for Adherence and Persistence with Atorvastatin Therapy. Cardiol. Ther. 2021, 10, 445–464. [Google Scholar] [CrossRef]
- Chen, S.T.; Huang, S.T.; Shau, W.Y.; Lai, C.L.; Li, J.Z.; Fung, S.; Tse, V.C.; Lai, M.S. Long-term statin adherence in patients after hospital discharge for new onset of atherosclerotic cardiovascular disease: a population-based study of real world prescriptions in Taiwan. BMC Cardiovasc. Disord. 2019, 19, 62. [Google Scholar] [CrossRef] [PubMed]
- Viet Nam. Available online: https://data.who.int/countries/704? (accessed on 6 August 2025).
- Mitani, H.; Suzuki, K.; Ako, J.; Iekushi, K.; Majewska, R.; Touzeni, S.; Yamashita, S. Achievement Rates for Low-Density Lipoprotein Cholesterol Goals in Patients at High Risk of Atherosclerotic Cardiovascular Disease in a Real-World Setting in Japan. J. Atheroscler. Thromb. 2023, 30, 1622–1634. [Google Scholar] [CrossRef] [PubMed]
- Fukunaga, K.; Nakagawa, H.; Ishikawa, T.; Kubo, M.; Mushiroda, T. ABCB1 polymorphism is associated with atorvastatin-induced liver injury in Japanese population. BMC Genet. 2016, 17, 79. [Google Scholar] [CrossRef]
- Boettiger, D.C.; Newall, A.T.; Chattranukulchai, P.; Chaiwarith, R.; Khusuwan, S.; et al. Statins for atherosclerotic cardiovascular disease prevention in people living with HIV in Thailand: a cost-effectiveness analysis. J. Int. AIDS Soc. 2020, 23, e25494. [Google Scholar] [CrossRef] [PubMed]
- Seo, W.W.; Seo, S.I.; Kim, Y.; Yoo, J.J.; Shin, W.G.; et al. Impact of pitavastatin on new-onset diabetes mellitus compared to atorvastatin and rosuvastatin: a distributed network analysis of 10 real-world databases. Cardiovasc. Diabetol. 2022, 21, 82. [Google Scholar] [CrossRef] [PubMed]
- Saiki, A.; Watanabe, Y.; Yamaguchi, T.; Ohira, M.; Nagayama, D.; et al. CAVI-Lowering Effect of Pitavastatin May Be Involved in the Prevention of Cardiovascular Disease: Subgroup Analysis of the TOHO-LIP. J. Atheroscler. Thromb. 2021, 28, 1083–1094. [Google Scholar] [CrossRef]
- Kang, W.C.; Kim, M.; Park, S.M.; Kim, B.K.; Lee, B.K.; Kwon, H.M. Preventive Effect of Pretreatment with Pitavastatin on Contrast-Induced Nephropathy in Patients with Renal Dysfunction Undergoing Coronary Procedure: PRINCIPLE-II Randomized Clinical Trial. J. Clin. Med. 2020, 9. [Google Scholar] [CrossRef]
- Thongtang, N.; Sitthananun, C.; Sriussadaporn, S.; Nitiyanant, W. Efficacy of low- and moderate-intensity statins for achieving low- density lipoprotein cholesterol targets in Thai type 2 diabetic patients. J. Diabetes Metab. Disord. 2017, 16, 6. [Google Scholar] [CrossRef] [PubMed]
Figure 1.
Decision tree model illustrating the health states of pitavastatin, atorvastatin, and rosuvastatin.
Figure 1.
Decision tree model illustrating the health states of pitavastatin, atorvastatin, and rosuvastatin.
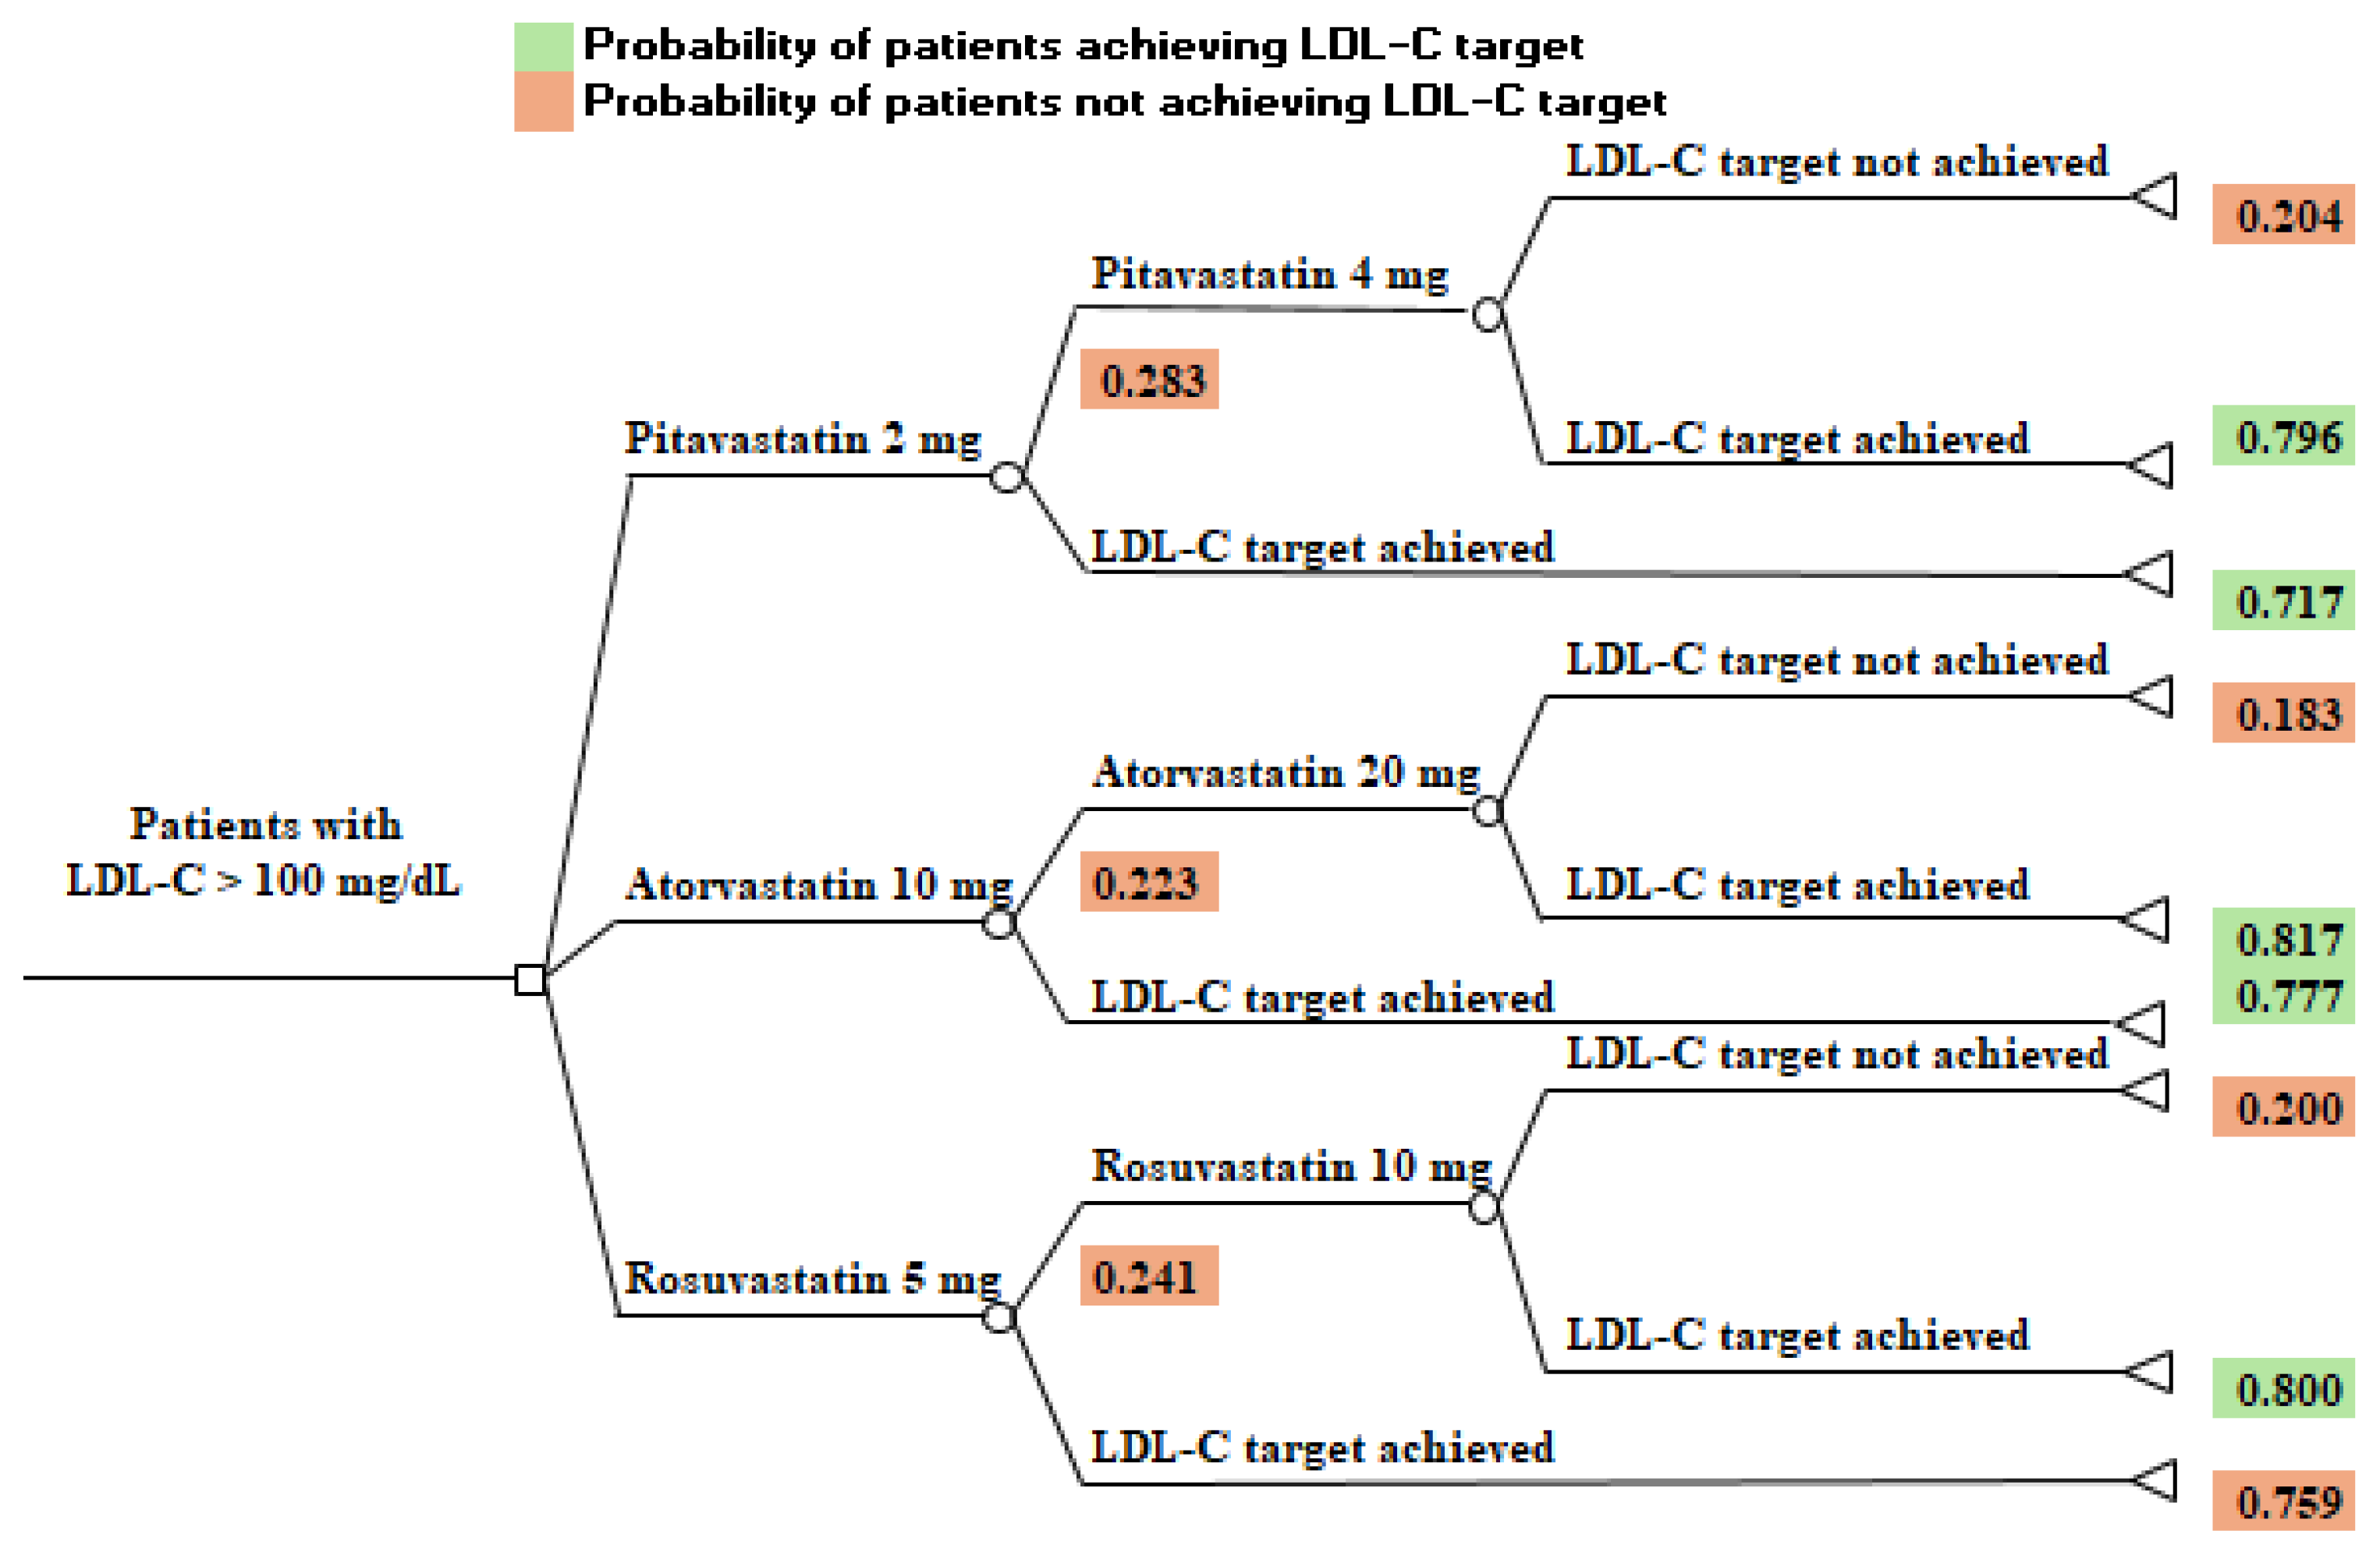
Figure 2.
Tornado diagram comparing pitavastatin versus atorvastatin.
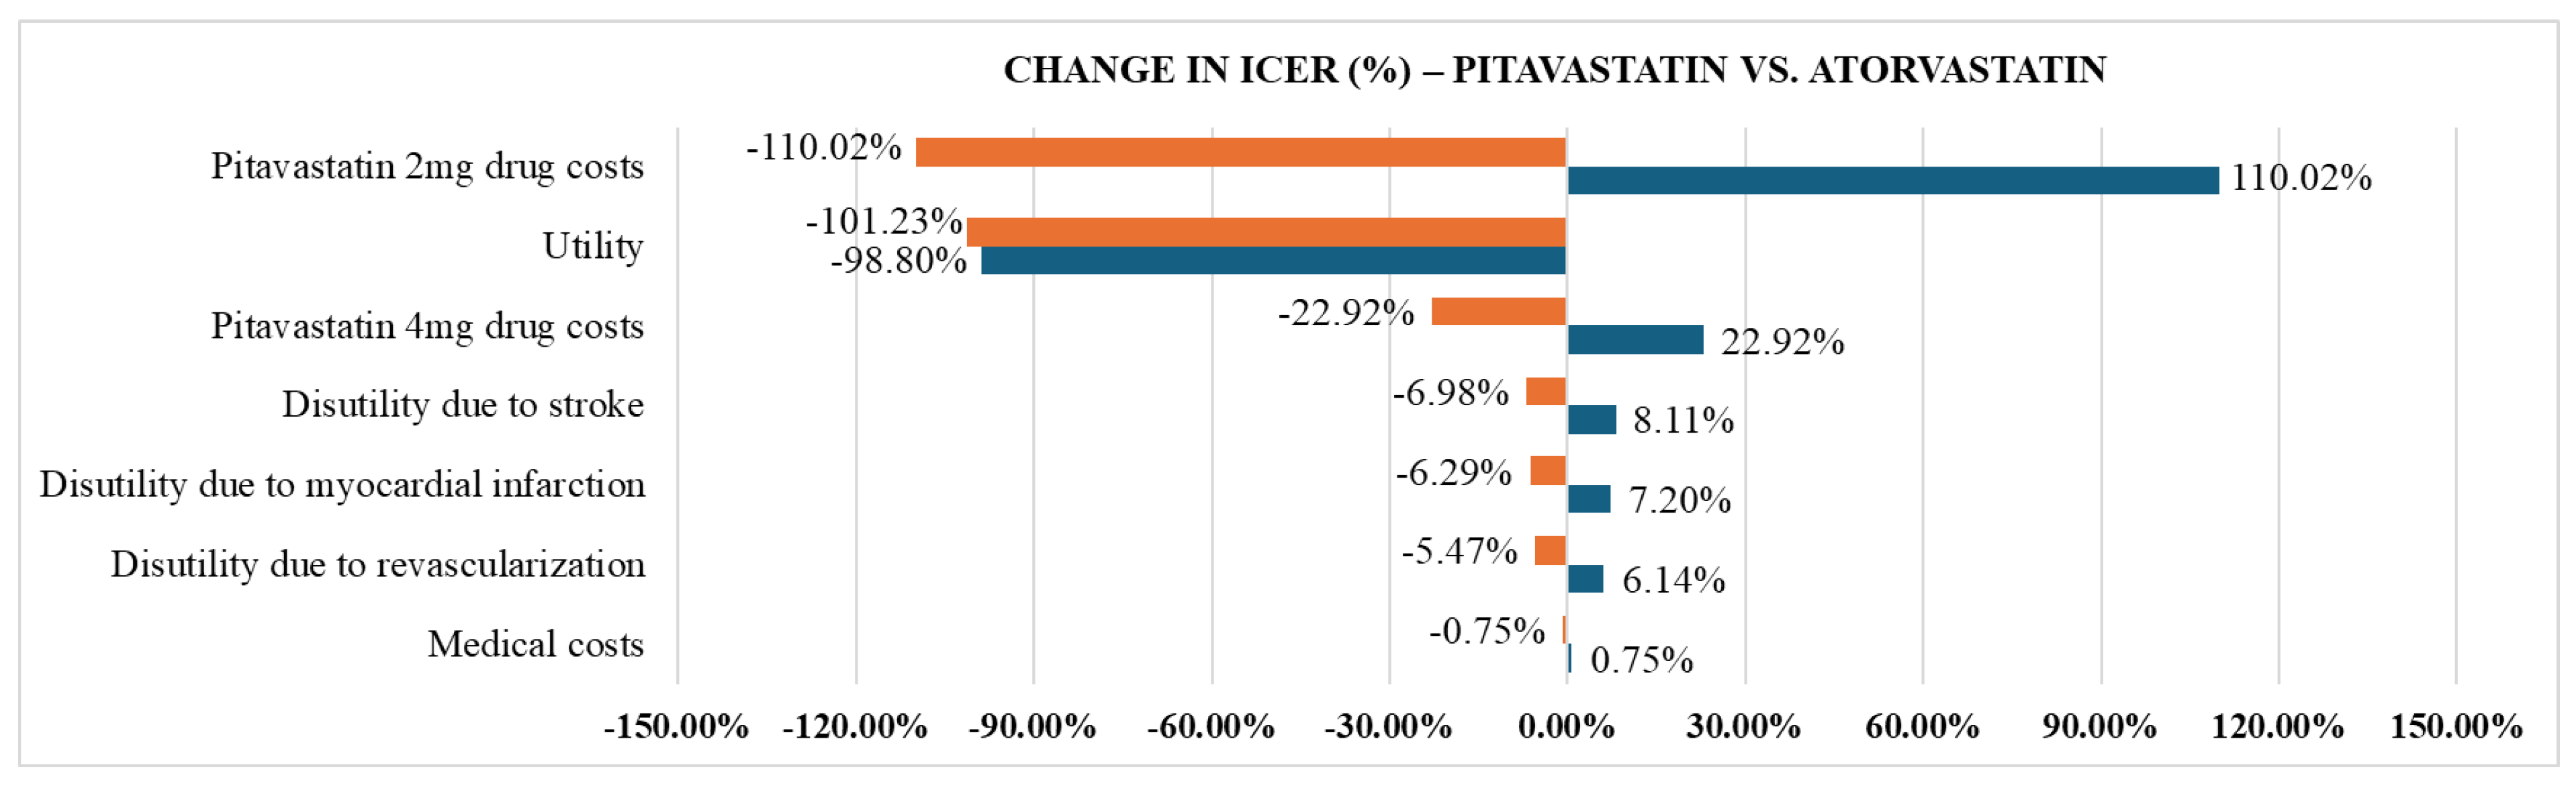
Figure 3.
Tornado diagram comparing pitavastatin versus rosuvastatin.
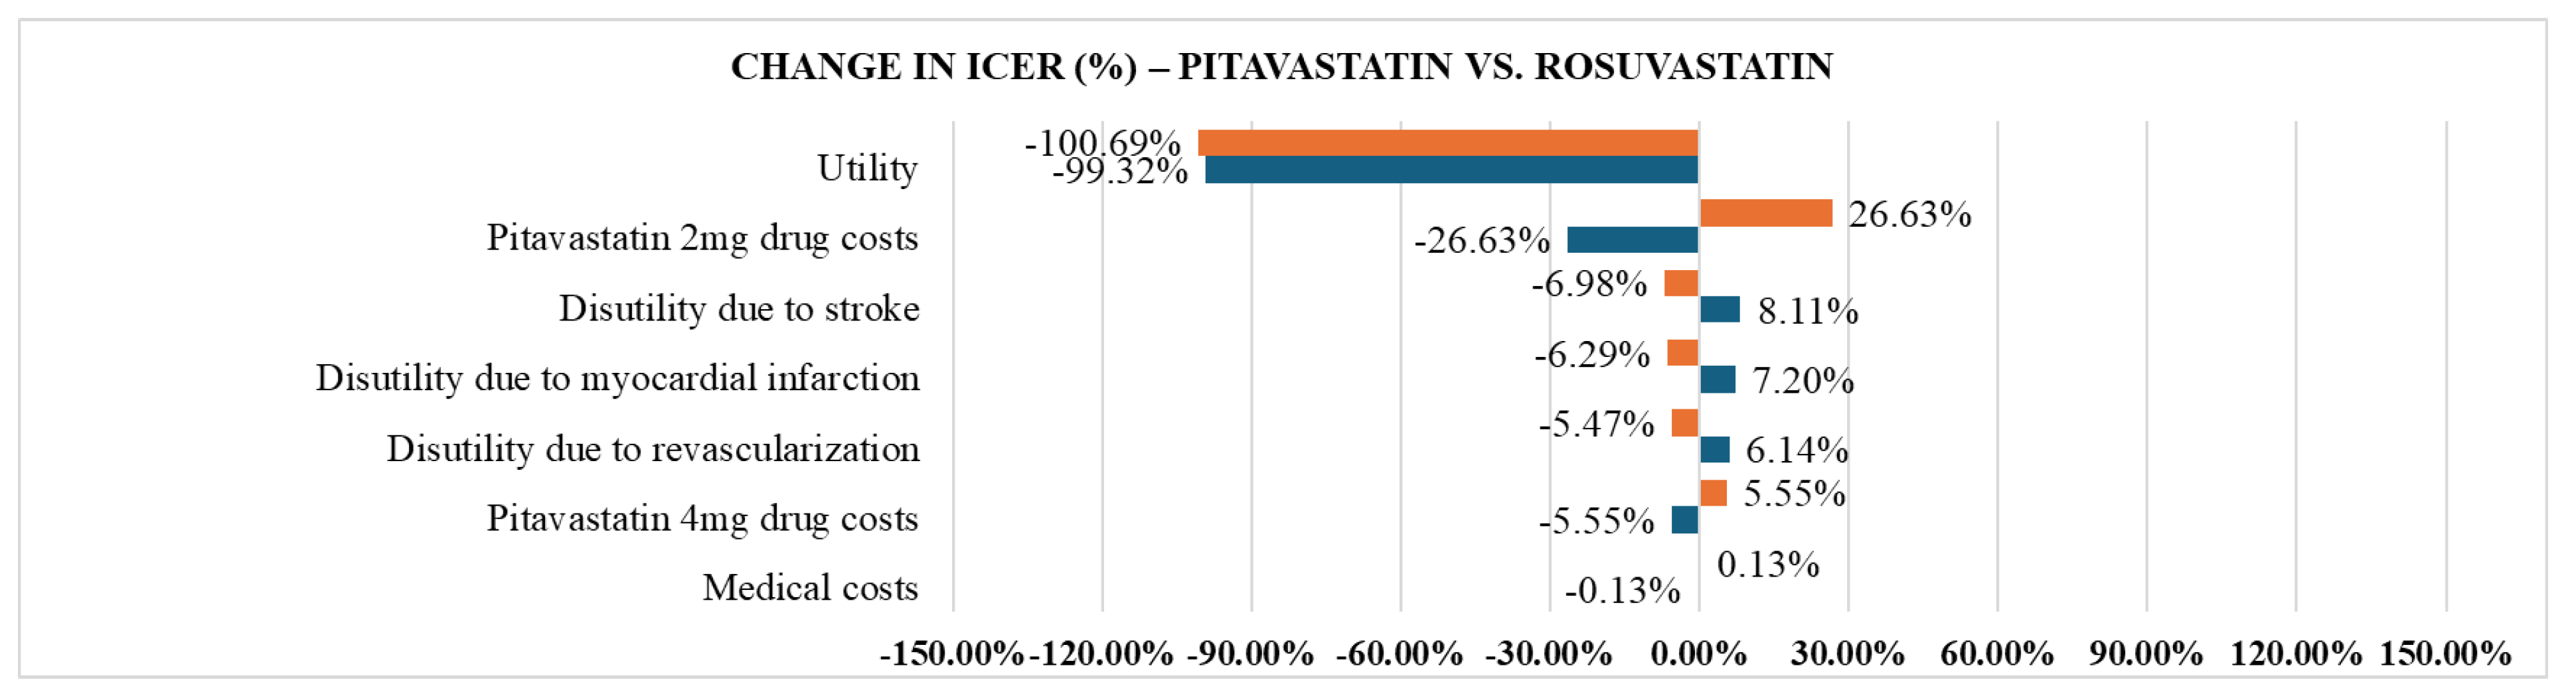

Table 1.
Probability of controlling LDL-C level in the model.
| Events | Probability* | p value | Ref. |
|---|---|---|---|
| Patients achieving LDL-C target when treated with Pitavastatin 2 mg | 0.717 | <0.001 | [19] |
| Patients not achieving LDL-C target when treated with Pitavastatin 2 mg | 0.283 | <0.001 | Caculation |
| Patients achieving LDL-C target when treated with Pitavastatin 4 mg | 0.796 | - | [22] |
| Patients not achieving LDL-C target when treated with Pitavastatin 4 mg | 0.204 | - | Caculation |
| Patients achieving LDL-C target when treated with Atorvastatin 10 mg | 0.777 | <0.001 | [19] |
| Patients not achieving LDL-C target when treated with Atorvastatin 10 mg | 0.223 | <0.001 | Caculation |
| Patients achieving LDL-C target when treated with Atorvastatin 20 mg | 0.817 | <0.001 | [19] |
| Patients not achieving LDL-C target when treated with Atorvastatin 20 mg | 0.183 | - | Caculation |
| Patients achieving LDL-C target when treated with Rosuvastatin 5 mg | 0.759 | <0.001 | [19] |
| Patients not achieving LDL-C target when treated with Rosuvastatin 5 mg | 0.241 | <0.001 | Caculation |
| Patients achieving LDL-C target when treated with Rosuvastatin 10 mg | 0.800 | <0.001 | [19] |
| Patients not achieving LDL-C target when treated with Rosuvastatin 10 mg | 0.200 | - | Caculation |
*: Confidence of 95% CI.
Table 2.
Component of costs.
| Type of cost | Unit cost (VND) | Ref. |
|---|---|---|
| Drug | ||
| Pitavastatin 2 mg | 12,600 | [23] |
| Pitavastatin 4 mg | 25,200 | [23] |
| Atorvastatin 10 mg | 15.941 | [23] |
| Atorvastatin 20 mg | 15,941 | [23] |
| Rosuvastatin 5 mg | 5,350 | [23] |
| Rosuvastatin 10 mg | 4,400 | [23] |
| Healthcare service | ||
| Total cholesterol test | 27,300 | [24] |
| HDL-C test | 27,300 | [24] |
| LDL-C test | 27,300 | [24] |
| Triglyceride test | 27,300 | [24] |
Table 3.
Calculated utilities of each branch.
| Branches | Utility | Ref. |
|---|---|---|
| Pitavastatin 4 mg | 0.22682722 | Caculation |
| Atorvastatin 20 mg | 0.17928736 | Caculation |
| Rosuvastatin 10 mg | 0.19327718 | Caculation |
| Pitavastatin 2 mg | 0.59188350 | Caculation |
| Atorvastatin 10 mg | 0.64141350 | Caculation |
| Rosuvastatin 5 mg | 0.62655450 | Caculation |
Table 4.
Total expected cost of pitavastatin, atorvastatin, and rosuvastatin.
| Intervention | Total cost (VND) | Probability | Expected total cost (VND) |
|---|---|---|---|
| Pitavastatin 4 mg | 1,738,800 | 0.283 | 492,080 |
| Pitavastatin 2 mg | 1,276,800 | 0.717 | 915,466 |
| Pitavastatin: 1,407,546 | |||
| Atorvastatin 20 mg | 1,666,644 | 0.223 | 371,662 |
| Atorvastatin 10 mg | 1,557,444 | 0.777 | 1,210,134 |
| Atorvastatin : 1,581,796 | |||
| Rosuvastatin 10 mg | 750,400 | 0.241 | 180,846 |
| Rosuvastatin 5 mg | 667,800 | 0.759 | 506,860 |
| Rosuvastatin: 687,707 |
Table 5.
Comparison of Utility, LYG, and QALY between pitavastatin, atorvastatin, and rosuvastatin.
| Intervention | Utility | LYG | QALY |
|---|---|---|---|
| Pitavastatin | 0.8187 | 14 | 11.46195004 |
| Atorvastatin | 0.8207 | 14 | 11.48981206 |
| Rosuvastatin | 0.8198 | 14 | 11.47764352 |
Table 6.
Incremental cost, QALY, and ICERs between pitavastatin and atorvastatin.
| Parameter | Pitavastatin | Atorvastatin |
|---|---|---|
| Total cost (VND) | 1,407,546 | 1,581,796 |
| Total QALY | 11.46195004 | 11.48981206 |
| Incremental cost (VND) | -174,250 | |
| Incremental QALY (years) | -0.02786203 | |
| ICERs ( VND/QALY) | 6,254,017 | |
Table 7.
Incremental cost, QALY, and ICERs between pitavastatin and rosuvastatin.
| Parameter | Pitavastatin | Rosuvastatin |
|---|---|---|
| Total cost (VND) | 1,407,546 | 687,707 |
| Total QALY | 11,46195004 | 11.47764352 |
| Incremental cost (VND) | 719,839 | |
| Incremental QALY (years) | -0.01569348 | |
| ICERs ( VND/QALY) | -45,868,678 | |
Disclaimer/Publisher’s Note: The statements, opinions and data contained in all publications are solely those of the individual author(s) and contributor(s) and not of MDPI and/or the editor(s). MDPI and/or the editor(s) disclaim responsibility for any injury to people or property resulting from any ideas, methods, instructions or products referred to in the content. |
© 2025 by the authors. Licensee MDPI, Basel, Switzerland. This article is an open access article distributed under the terms and conditions of the Creative Commons Attribution (CC BY) license (http://creativecommons.org/licenses/by/4.0/).
Copyright: This open access article is published under a Creative Commons CC BY 4.0 license, which permit the free download, distribution, and reuse, provided that the author and preprint are cited in any reuse.


