Submitted:
07 August 2025
Posted:
08 August 2025
You are already at the latest version
Abstract
Background/Objectives: Glioblastoma (GBM) and brain metastases (BMs) are both frequent brain lesions. Their distinction is crucial for suitable therapeutic and follow-up decisions, but difficult to achieve, as it includes clinical, radiological and histopathological correlation. However, non-invasive AI examination of conventional and advanced MRI techniques can overcome this issue. Methods: We retrospectively selected 78 patients with confirmed GBM (39) and single BM (39), with conventional MRI investigations, consisting of T2W FLAIR and CE T1W acquisitions. The MRI images (DICOM) have been evaluated by an AI segmentation tool, comparatively evaluating the tumor heterogeneity and peripheric edema. Results: We found that GBM are less edematous than BM (p=0.04), but have more internal necrosis (p=0.002). Of the BM primary cancer molecular subtypes, NSCCL showed the higher grade of edema (p=0.01). Compared to the ellipsoidal method of volume calculation, the AI machine obtained greater values in measuring lesions of the occipital and temporal lobes (p=0.01). Conclusions: Although extremely useful in radiomics analysis, automated segmentation applied alone could effectively differentiate GBM and BM on conventional MRI, calculating the ratio between their variable components (solid, necrotic and peripheric edema). Other studies applied to a broader set of participants are necessary to further evaluate the efficacy of automated segmentation.
Keywords:
glioblastoma
; brain metastasis
; artificial intelligence
; deep-learning
; segmentation
; differential diagnosis
1. Introduction
Glioblastoma (GBM) and brain metastases (BMs) are the most frequent tumoral pathology of the brain parenchyma [1,2]. GBM is a grade 4 glioma in the World Health Organization classification of Central Nervos System tumors, representing 40 - 50% of the primary brain tumors in adult patients [3,4,5]. BM on the other hand are the most common secondary malignancies in adult patients, being 10 times more frequent than brain parenchyma primary tumors [2]. Secondary lesions affecting the brain parenchyma are in 30-50% of the cases solitary BM [6,7].
The differential diagnosis between solitary BM and GBM is important as they play a pivotal role in determining the prognosis, treatment and the monitoring phase of the diseases [6,8]. For solitary metastases, if their diameter is greater than 3 cm, surgical resection of the entire lesion is preferred and respectively, if the diameter is lesser than 3 cm, stereotactic radiosurgery is opted for. Target therapy is also an option of treatment for patients with BM of known origin and molecular subtype of the primary tumor [9]. For GBM, the debulking of the lesion is chosen, as incomplete resection can decrease the burden of an intra-cranial expansive process and ameliorate the patients’ symptoms [5,6,10].
Regardless of their different nature, being either primary or respectively secondary tumors, they are both classified as intra-cerebral expansive processes [11]. Focal symptoms caused by the tumor itself and intra-cranial hypertension caused by both the lesion and the peripheric edema are the most commonly observed symptoms among patients.
In case of metastatic disease of the brain, if the primary tumor is found or systemic metastases are also present, the diagnosis can be easily concluded as concomitant GBM and systemic neoplasia is quite rare, found in 3% of cases [12]. Patients with solitary BM from an occult primary cancer can be difficult to correctly diagnose solely based on the imaging characteristics of the lesion, as the diagnostic process in both cases requires correlation with clinical and histopathological findings [8].
The aspect on imaging brain protocols, using both Computer Tomography (CT) and Magnetic Resonance Imaging (MRI) can be misleading, as GBM and BM share similar characteristics [8]. On CT they both are inhomogeneous masses of different volumes accompanied by hypodense peripheric edema [13]. On conventional MRI protocols, they both are inhomogeneous lesions, with central necrosis, predominantly peripheric contrast intake and perilesional vascular edema [14]. BMs, more frequently than GBM can show cystic degeneration and intra-lesional hemorrhage (especially hemorrhagic metastases of melanoma and renal cancer). GBM on the other hand, frequently shows invasion of the surrounding brain parenchyma, seen on MRI similar to peripheric edema [14].
A definitive diagnosis is generally established through a biopsy of the lesion or after surgical resection [8]. As these interventions have their own complications, and surgical resection isn’t always possible, in case of eloquent brain tissue being affected, another non-invasive method of diagnosis should be adopted [8].
Since conventional MRI features of both GBMs and BMs are similar, displaying perilesional edema, central necrosis, irregular margins and inhomogeneous contrast intake, differential on MRI imaging alone can be difficult [8,15]. Advanced MRI modalities have therefore emerged, such as perfusion MRI, diffusion tensor imaging (DTI), diffusion weighted imaging (DWI) and magnetic resonance spectroscopy, combined with radiomics or not [6,8,10,15,16,17].
As shown by previous studies, the addition of advanced MRI protocols, as input on machine learning (ML) or deep - learning (DL) programs, provides no further insight compared to the use of only conventional MRI protocols [18]. One particularly important step in radiomics analysis of the extracted features is tumoral segmentation, or the selection of the Region of Interest (ROI). This step was previously executed manually by neuro-radiologists, now semi-automated and automated segmentation can be performed by artificial intelligence (AI) programs [19]. Automated segmentation can be realized by combining two or more MRI acquisition protocols, in order to visualize different portions of the lesions, as they are inhomogeneous and have different signal capacities depending on their composition [13,18].
Our scope is to analyze the different ratios of tumoral volume, peripheric edema and necrosis volumes of GBM and unique BM, calculated using an automated segmentation model, in order to individualize possible significant differences of their values. Another objective of this study is to compare the automated segmentation model to the ellipsoidal manual method of tumoral volume calculation. This method has been previously described as one of the most accurate manual methods of volume calculation [19].
2. Materials and Methods
2.1. Patient Selection
We retrospectively selected patients diagnosed with GBM and BM in our hospital from 2019 to 2023. The inclusion criteria are as follows:
- adult patients (more or equal to 18 years old in age);
- diagnosed with an unique brain lesion;
- with histopathological positive diagnosis of GBM or BM;
- that underwent MRI examination with a protocol consisting on minimum 3D T2-wheighted Fluid Attenuated Inversion Recovery (T2W FLAIR) and contrast-enhanced T1-wheigthed (CE T1W), effectuated prior any local treatment.
We excluded patients that did not meet the inclusion criteria and that also:
- had more than one lesion in the brain parenchyma, active or not for example with stroke sequelae;
- patients without any histopathological confirmation;
- those who underwent MRI investigation after local treatment or biopsy.
2.2. MRI Protocols
The patients underwent MRI examinations during their hospital stay, executed with a General Electric Medical Systems – Signa explorer MRI machine of 1.5 Tesla. The MRI protocol consisted of sagittal 3D T2 FLAIR with acquisition parameters of repetition time (TR) = 6502-7002, echo time (TE) = 118.597-122.618, with a slice thickness of 1.8 mm and spacing between slices of 0.9 mm; 3D Fast Spoiled Gradient Echo (FSPGR) T1W post-contrast intake with acquisition parameters of TR = 19.892, TE = 4.2, or 3D T1W post contrast intake, with TR = 9.464, TE = 4.2, both with a slice thickness of 1.8 mm and spacing between slices of 0.9 mm. The difference of the TR value is normal for FSPGR T1W and non-FSPGR T1W, the first acquisition is usually preferred after contrast intake because the vascular signal is lower and small lesions can be easily seen [20]. The images where anonymized and then sent to the AI team in order to be analyzed.
2.3. Manual Calculation of Tumoral Volume
The manual method that we used to calculate the volume of the lesions was the ellipsoidal method. The first step consists in correctly positioning the T1W 3D CE acquisition in the axial, sagittal and coronal planes, by respecting the medio-sagittal line in coronal and axial planes, and the bi-commissural axis (the line that conjoins the anterior and posterior white matter commissures) in the sagittal plane. The second step represents measuring the lesion by assessing the greater diameter in the three planes and multiplying them to obtain the volume. Because the resulting shape is more similar to a parallelepiped or a cube, it is necessary to multiply the result with the ellipsoidal constant of 0.52 (π/6) which will consequently change the final shape to resemble an ellipse. This shape is found to be closer to the true shape of brain lesions [19]. The total volume of the lesion was calculated initially using the ellipsoidal manual method by two different neuro-radiologists, each with a minimum of 10 years of experience in the field.
2.4. Automated Segmentation
The images were also sent for the automated segmentation of the tumor, with calculation of the total tumor volume, consisting of the contrast-intake portion (solid component of the lesion) and of the central necrosis volume (non-enhancing portion of the lesion), as well as peripheric edema volume.
The automated segmentation was implemented using the mdbrain application, certified as a Conformité Européenne medical device of II class, developed by the German company of Mediaire, available in Romania through Supermedical. Mdbrain uses a DL algorithm consisting of a 3D convolutional neural network with a U-Net architecture [21]. The T2-wheighted Fluid Attenuated Inversion Recovery (T2W FLAIR) and T1-wheighted contrast-enhanced (CE T1W) images were priorly combined in order to see the tumor and the edema on the same image, as the tumor enhances on the CE T1W images and the edema shows hyperintense signal on FLAIR and does not enhance [22]. The results of the Digital Imaging and Communication in Medicine (DICOM) imaging processing tool are seen in Figure 1.
2.5. Data-Base Creation
We created an Excel table containing data about the patients: age, sex, diagnosis: primary tumor (in case of BM) and GBM; we then added data about the solitary lesions for every patient: volume calculated by the ellipsoid manual method, by the automated method, with emphasis on the total volume, the contrast-intake portion, the non-enhancing portion and the peripheric edema volume. A comparison of the two methods was performed by calculating the ratio and difference between the respective total volumes using Excel formulas; we determined the ratio between the automated calculated volumes of the necrosis (non-enhancing portion) and the total volume, between the edema and the total volume, and separately with the necrosis in order to appreciate the percentage of necrosis within the tumors and the time fold dimension of the edema compared to the lesion. An example of the formula used can be seen below:
Where R – ratio, Vn – volume of the necrosis and Vt – total volume, both calculated by the automated segmentation method. Similarly, if we switch Vn with Vt and Vt with Ve (volume of edema), we obtain the ratio between them.
In order to avoid any confusion and to minimize the repetition of these rapports we annotated them:
- R AI/M – the ratio between the volumes obtained using the DL tool (AI) and respectively the ellipsoidal method (the manual method - M);
- R E/T – the ratio between the volumes of the edema (E) and the lesion (T) calculated using the DL software;
- R N/T – the ratio between the volumes of the necrosis (N) and the entire lesion (T) calculated using the Dl software;
- R E/N – the ratio between the volumes of the edema (E) and the central necrosis (N) calculated using the DL software;
- Diff AI-M – we also calculated the difference between the volumes obtained by the AI software and the manual method (M).
2.6. Statistical Analysis
We analyzed our data distribution using the Kolmogonov-Smirnov test, in order to apply the suitable parametric or non-parametric tests for gaussian and non-gaussian distribution variables, see Figure 2 and Figure 3 [23]. We also performed bivariate analysis to show the relation of two different binary and numerical attributes generating box plots. In order to analyze the significance of the volume ratios for different groups of variables, we used the ANOVA one-way test in the multivariate analysis.
2.6.1. Univariate Analysis
2.6.2. Bivariate Analysis
We then examined the relation between each pair of variables. To identify differences between subgroups defined by the binary attributes and continuous values we used statistical tests and generated box plots. The volume and the ratios had a non-gaussian distribution, therefore we used non-parametric tests such as the Mann-Whitney-U test. However, for age and Diff AI-M we used a parametric test, the Student t-test, considering the value of p ≤ 0.05 statistically significant [23,24].
2.6.3. Multivariate Analysis
We also assessed the statistical significance of the variation of variables, for more than two groups of data, using the ANOVA one-way test for variables with gaussian distribution (Diff AI-M) and the analog non-parametric test, the Kruskal test for the non-gaussian distribution variables [25].
2.7. Processing Environment
The statistical analysis was performed using the Phyton 3.13.2 version and packages from different code libraries such as “pandas”, “seaborn”, “numpy”, “matplotlib” and “scipy”.
3. Results
In total we found 578 patients admitted at our hospital with the diagnosis of BM, and 695 patients with GBM, during a period of time of five years (2019-2023). Of the ones with BMs, only 178 had positive histological and immunopathological diagnosis and only 109 underwent an MRI investigation prior any local treatment, of which 58 had a singular brain lesion. Only 39 were included in the study, as many of them showed other brain lesions.
The patients diagnosed with GBM that underwent histopathological confirmation and MR investigation were a number of 85, 39 of whom were selected to be analyzed with the AI program. We did not include patients with other concomitant brain lesions, as discussed in the Materials and Methods section. In total, we included 78 participants, 54 male patients and 24 female patients.
3.1. Cohort Description
3.1.1. Glioblastoma Patients
The GBM patients included in this study were 39, 28 of them were men and 11 women, ranging from 36 to 76 years old, with a median of 53.89 years old. The characteristics of the patients can be seen in Table 1.
3.1.2. Single Brain Metastasis Patients
For the BM subgroup, 26 of them were men and 13 women, with ages between 21 and 78 years old, and a median age of 58.89 years old. Their primary tumors were known, with 24 patients diagnosed with lung cancer, 7 with breast cancer, 3 with melanoma, 2 with colorectal carcinoma; 2 patients with other digestive system sites (of which one diagnosed with gastric carcinoma) and one with clear-cell renal carcinoma. The characteristics of the patients can be seen in Table 1 and the molecular subtype of primary tumors in Table 2.
3.2. Primary Results
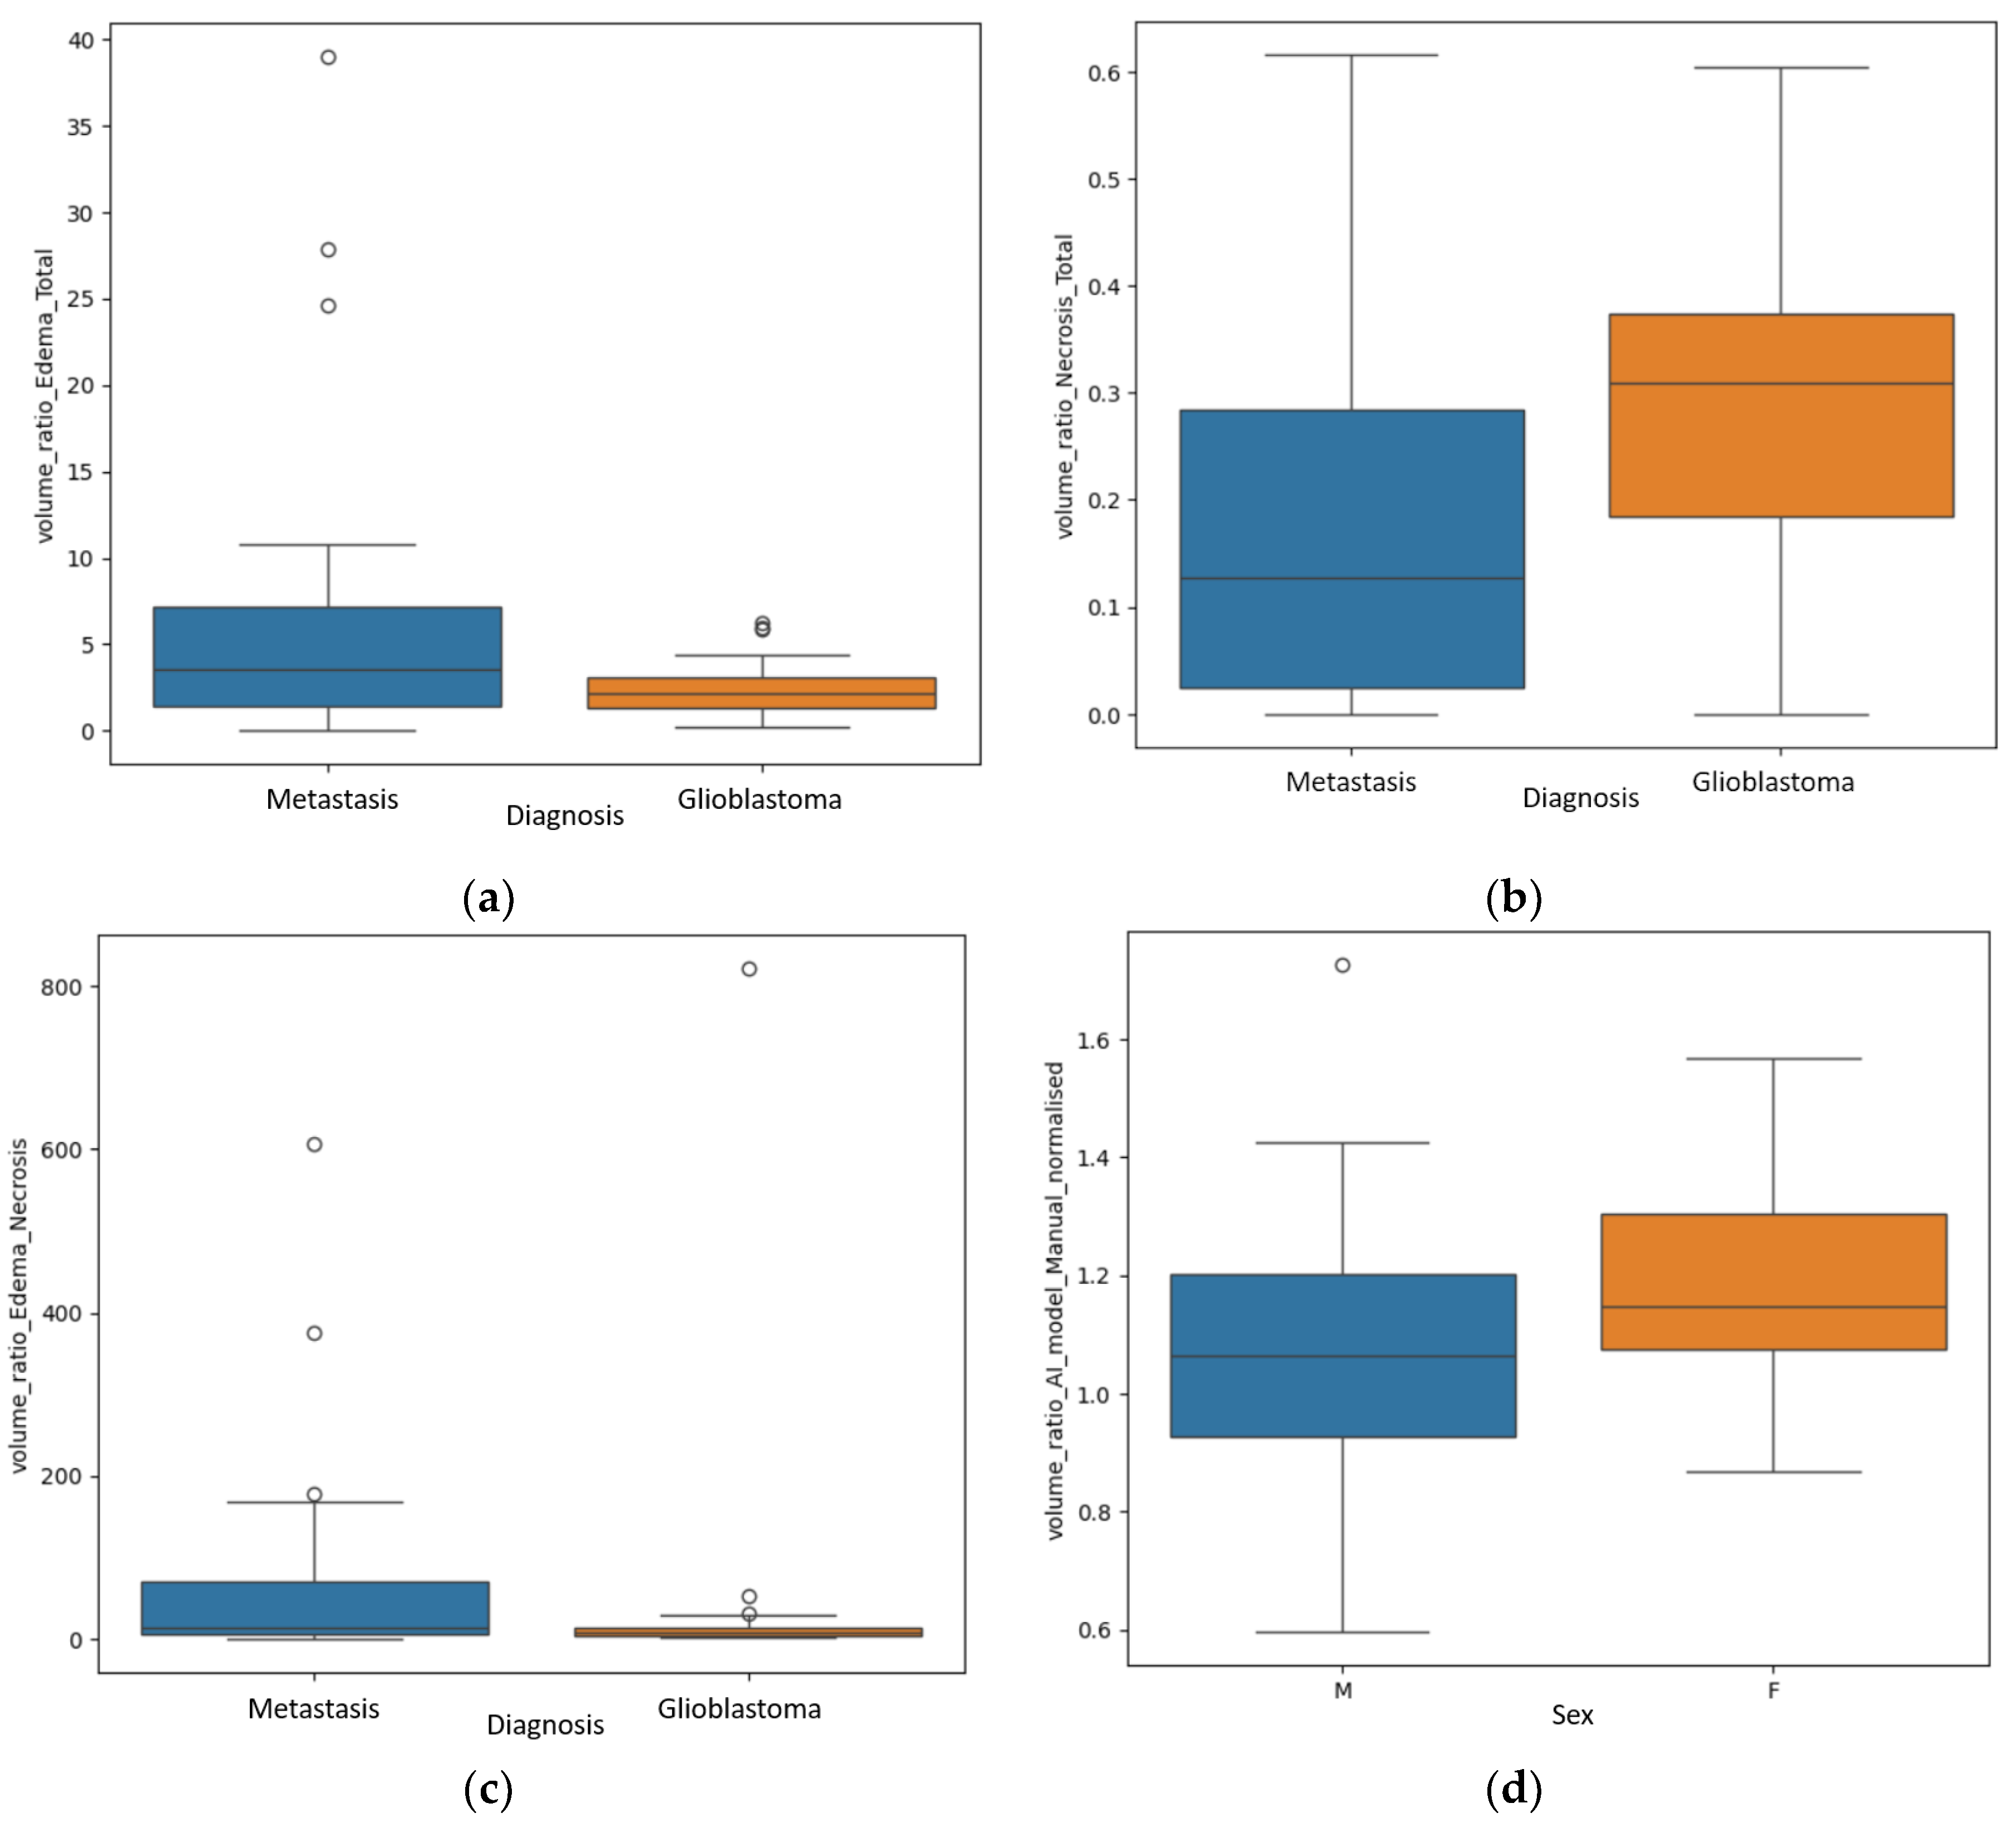
Significant findings were achieved after the statistical analysis of the data, particularly regarding the difference of the ratios between the different volumes for GBM and secondary brain lesions, as shown in Figure 4.
The first finding was the statistically significant difference between the R E/T for secondary brain lesions and GBM (p=0.04 – Mann Whitney-U test), with significant greater values for the metastases, a median of 3.59 with a minimum of 0.06 and a maximum of 10.81, and smaller values for the GBM group: a median of 2.2 with a minimum of 0.25 and a maximum of 4.4.
The second primary result was the difference of the R N/T (p=0.002 – Mann Whitney-U test), with grater values for the GBM subpopulation, as follows: a median of 0.3, minimum of 0 (no necrotic center) and maximum of 0.6. For the BM subgroup the median value was 0.12, with a minimum of 0 (no central necrosis) and 0.61.
Another significant finding was the R E/N (p=0.02), with greater values for the metastatic subgroup, suggesting greater inconsistencies between perilesional edema and central necrosis (greater edema and lesser necrosis). The median value for the metastatic group was 70.6, with a minimum of 0.09 and a maximum of 167.84; for the GBM subgroup, a median value of 28.52, with a minimum of 0 (no central necrosis) and maximum of 53.15.
An unexpected result was the significant value of p=0.02 in analyzing the R AI/M, rapport of volume calculated by the manual method and the one calculated by the DL program, between the male (in total 54) and female patients (in total 24), as seen in Figure 4d. This aspect will be further discussed, as it may be a product of selection bias.
3.3. Secondary Results
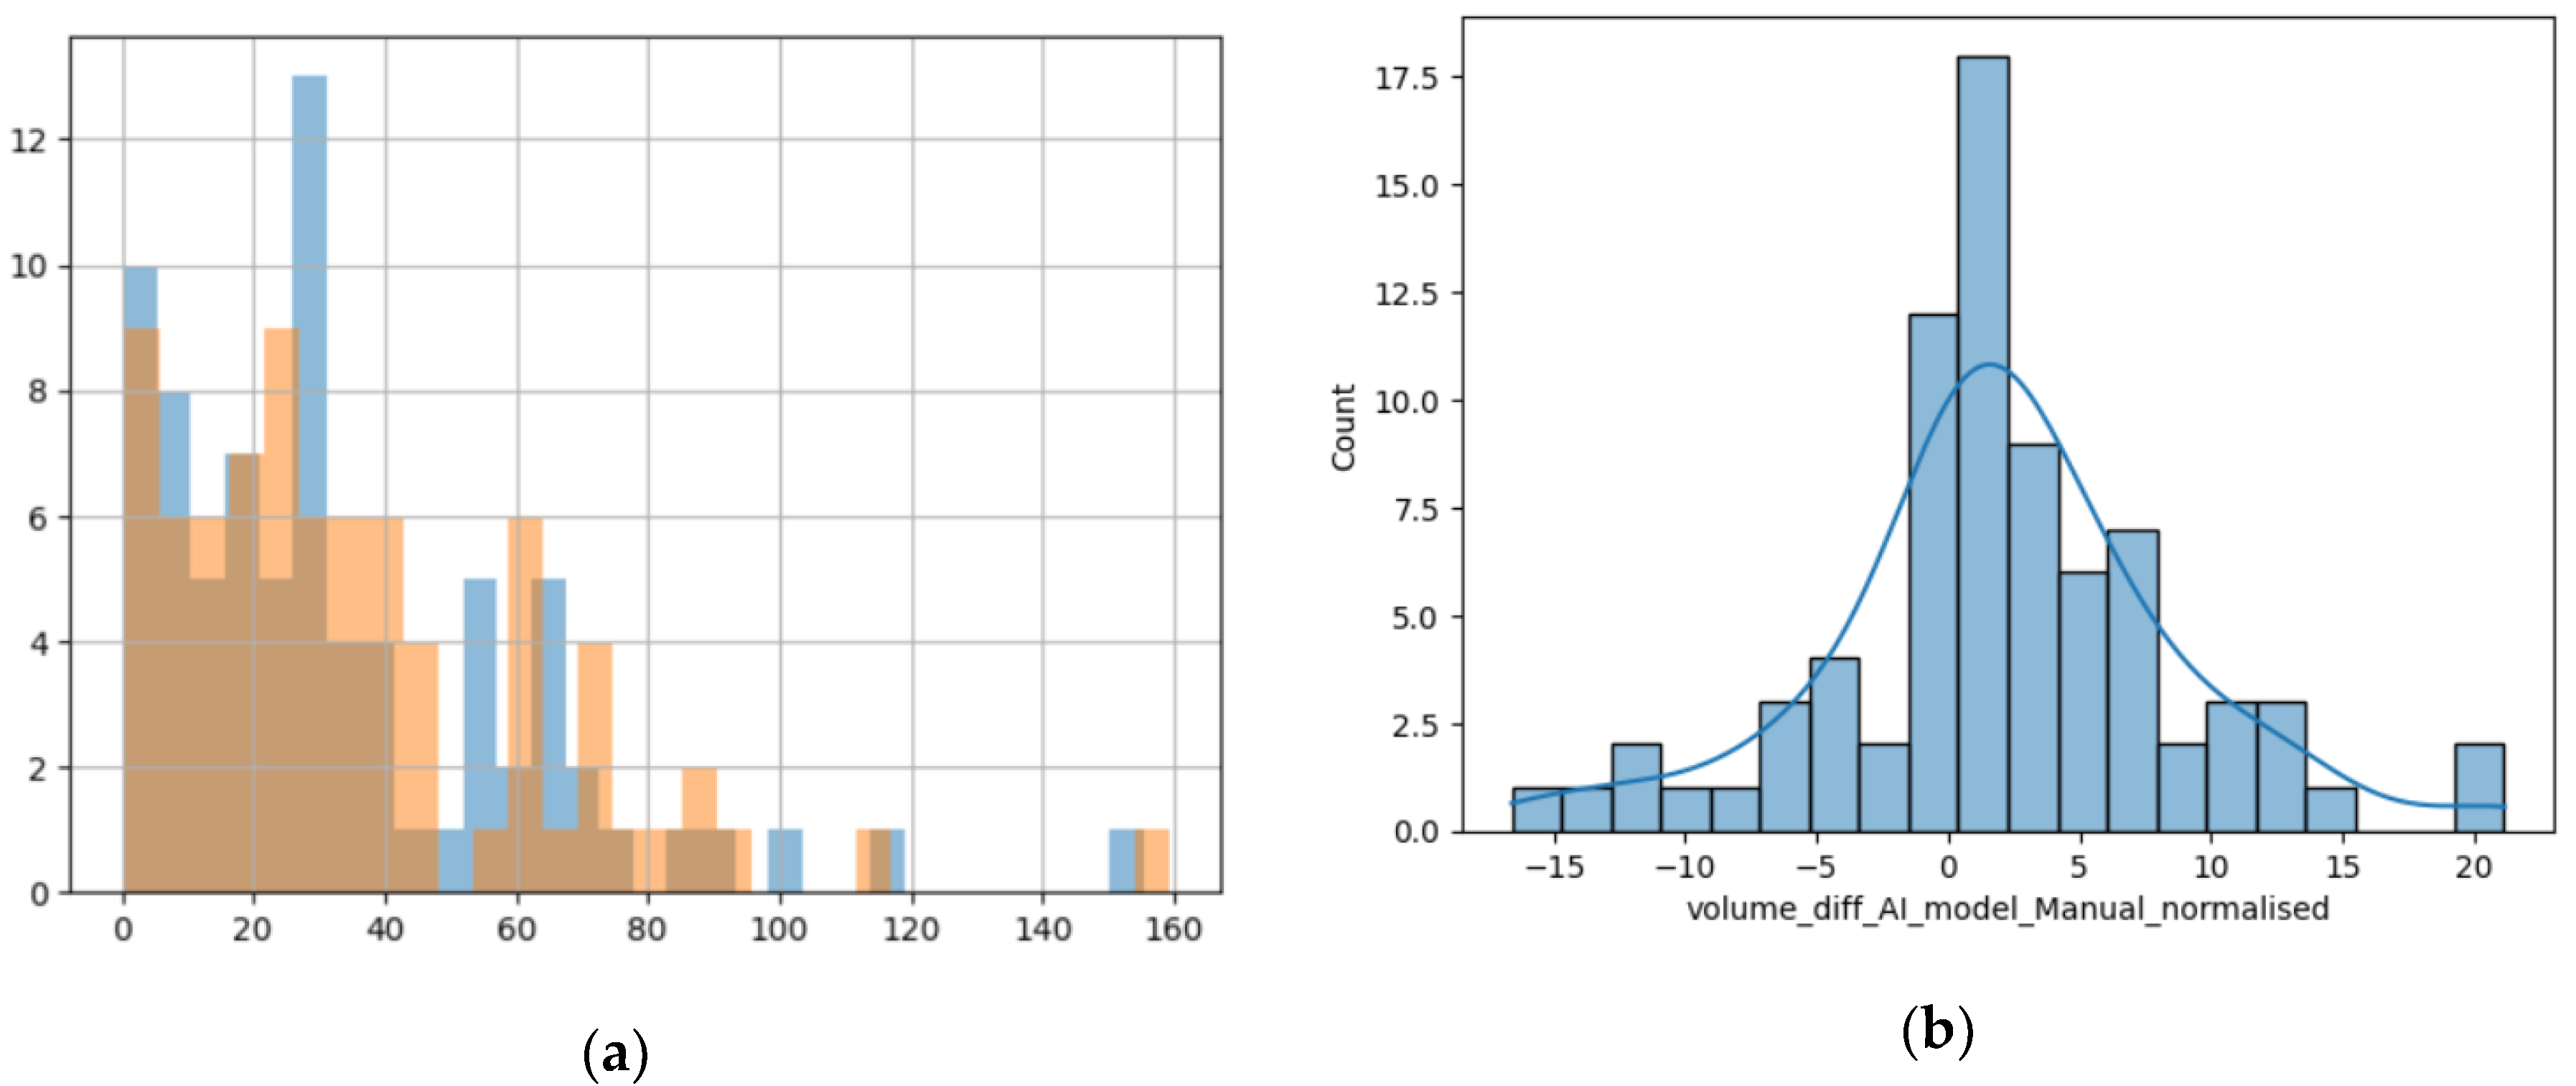
Comparing the two different modalities used to calculate the volume of the lesions, we found that their values are predominantly superposable and the numerical difference between them had a normal distribution, as the resulting values are volumes measured in cm3, closely resembling the standard normal distribution, as seen in Figure 5b [23].
Figure 5.
(a) Histogram showing the superposition of the manual method (blue columns) and the DL method (orange columns); x-axis – value of the volume and y-axis – number of lesions with that volume; (b) Distribution of difference between volumes calculated with the manual method and the DL method.
Figure 5.
(a) Histogram showing the superposition of the manual method (blue columns) and the DL method (orange columns); x-axis – value of the volume and y-axis – number of lesions with that volume; (b) Distribution of difference between volumes calculated with the manual method and the DL method.
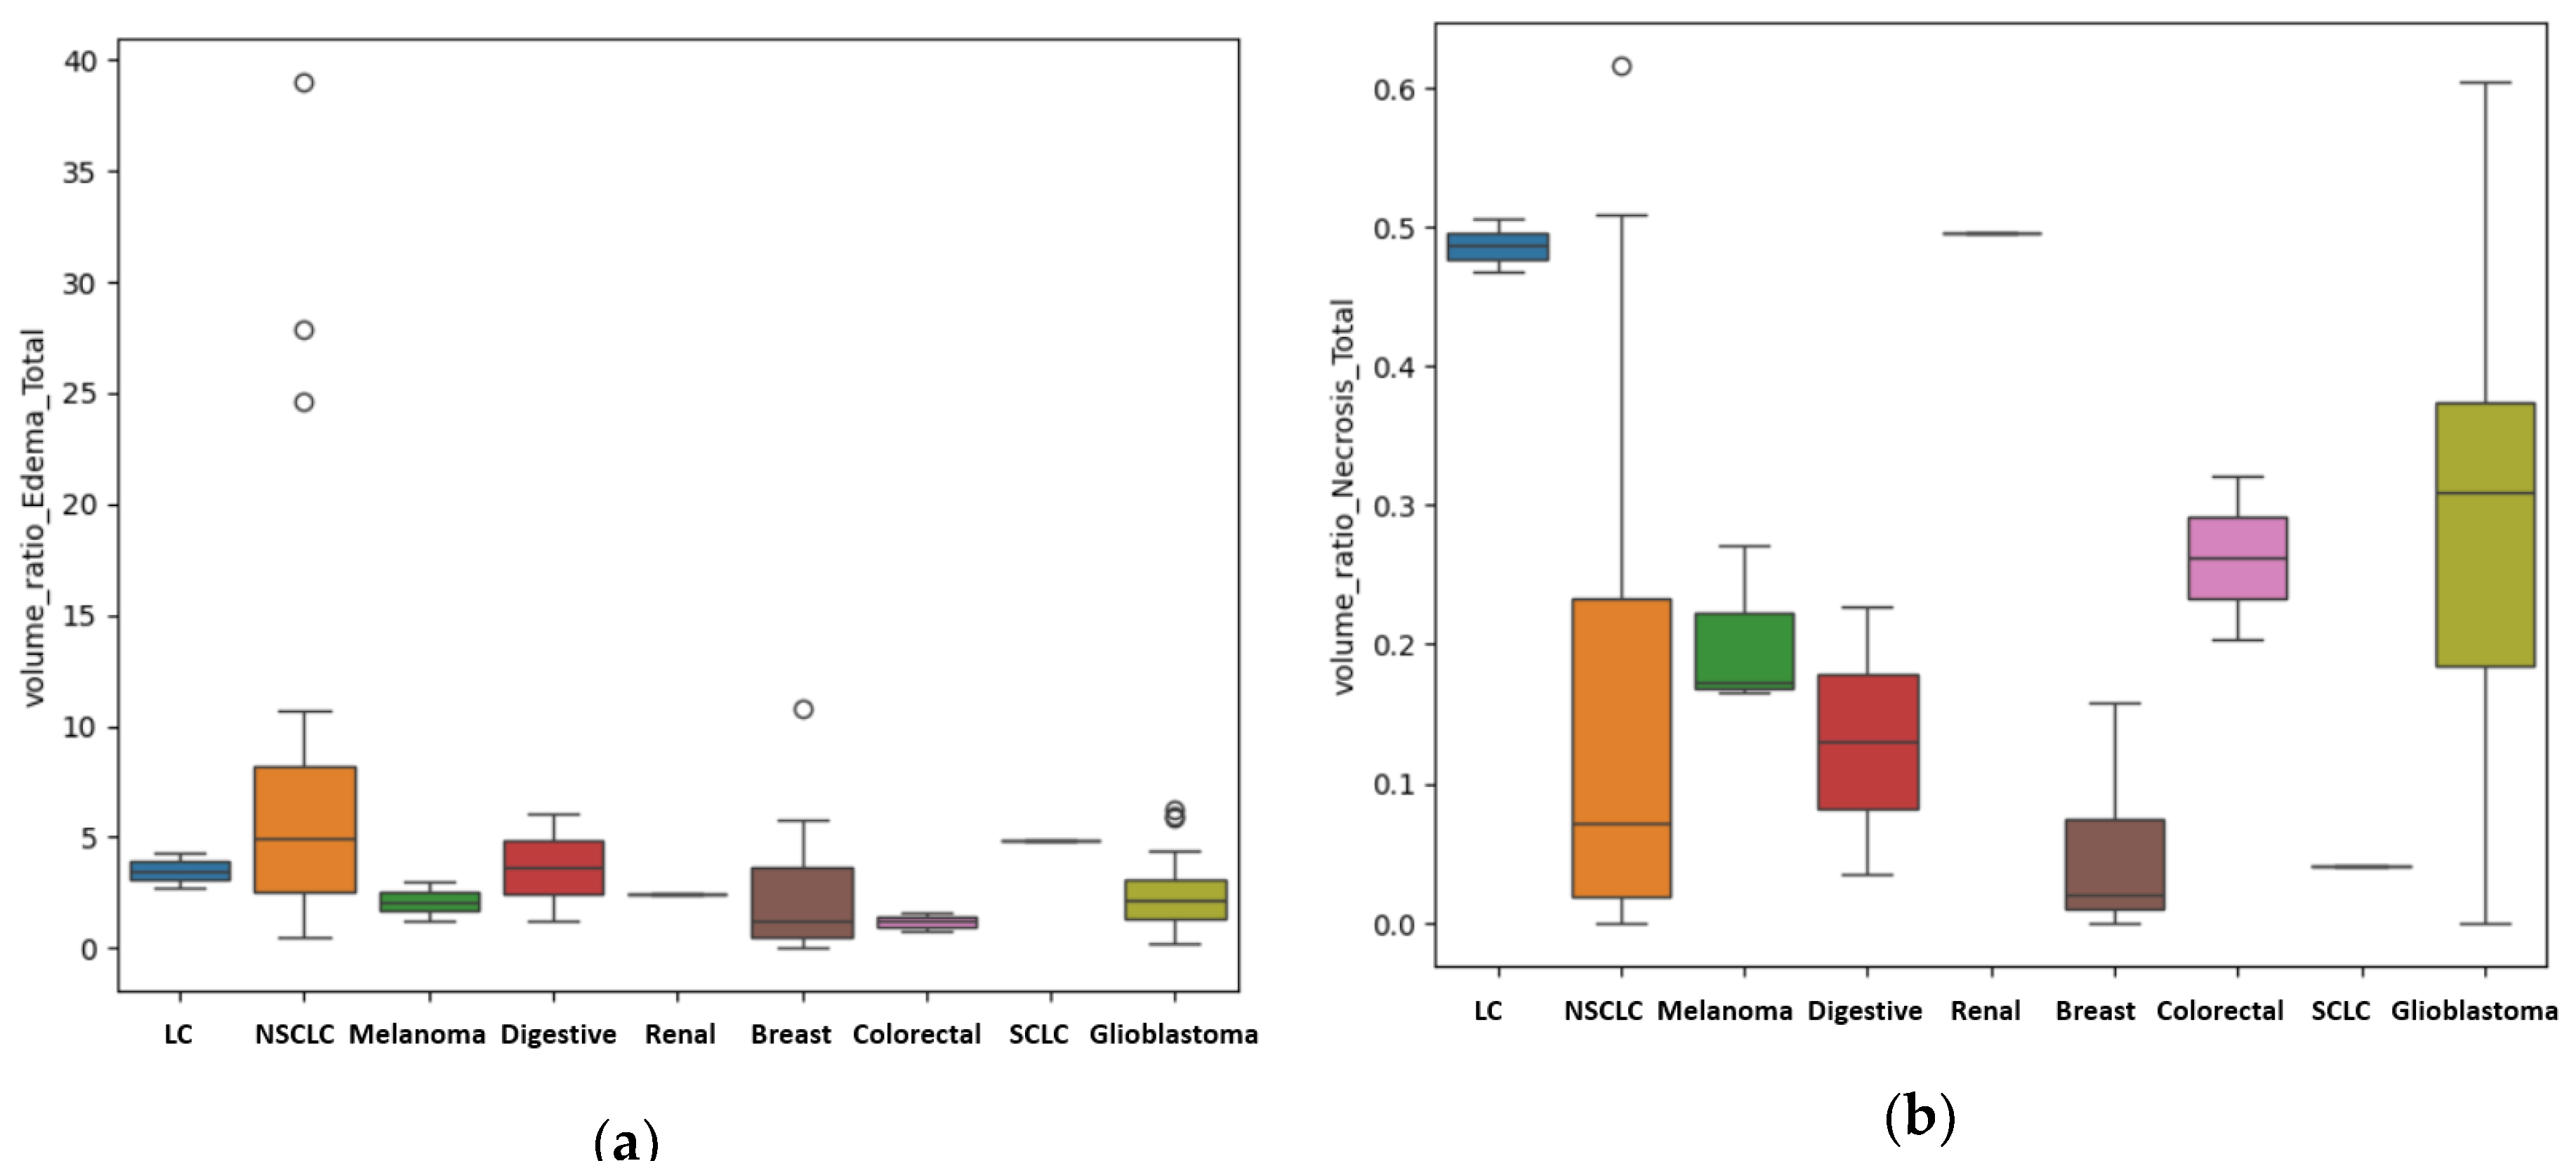
For the patients with unique BM, other results were also of statistical importance regarding in particular the primary source. We assessed the difference in metastatic volume for every different primary cancer, compared to GBM, using the ANOVA test for non-parametric distribution (Kruskal test). We found a p-value of 0.01 that indicates statistical importance regarding the R E/T of the lesions (Figure 6a) with the most edematous lesions being the BM from lung cancer, and in particular from NSCLC, followed by the ones from digestive carcinomas (including gastric carcinoma), from breast cancer, melanoma, renal carcinoma, GBM (as primary tumor) and colorectal carcinomas. The p-value was calculated after considering the patients with BM from lung cancer (LC) a single subgroup (LC + NCLSC + SCLC); when considering them separate determined by their molecular subtype, the calculated p-value was 0.03.
Another important finding is the difference in terms of the quantity of central necrosis, with a p-value of 0.01 for the R N/T (Figure 6b). Our findings strongly suggest that GBM, as a primary brain lesion, has considerably more central necrosis than secondary lesions, of any kind, the most necrotic ones being the BM from colorectal and renal carcinomas. When considering the LC patients as separate groups depending on their molecular subtype, the calculated p-value was 0.001.
In terms of their localization, for both GBM and BM lesions, only the R N/T showed a p-value of 0.002 (Mann Whitney-U test) with greater values for supratentorial lesions than infratentorial ones (see Figure 7). This referenced ratio had a median value of 0.2, a minimum of 0 and maximum of 0.61 for the supratentorial sites and a median value of 0.03, with a minimum of 0 and maximum of 0.2.
Depending on the precise localization of the BM, we also found some significant results in relation to the difference (in cm3) between the volumes measured by the AI model and the manual method (Diff AI-M). We compared the volumes from different anatomical sites, both supra- and infratentorial: frontal, temporal, occipital, parietal lobes, corpus callosum and cerebellar (infratentorial). The p-value calculated with the ANOVA one-way test was equal to 0.01. Figure 8a illustrates that for the lesions of the occipital and temporal lobes, the Diff AI-M was greater than for other sites, with a median difference of 4.2 ± 6.51 cm3 and respectively 3.5 ± 9.09 cm3. The parietal lesion had a Diff AI-M in measuring of 2.02 ± 4.63 cm3, the frontal lesions of 1.63 ± 5.02cm3, 0.7 ± 1.94 cm3 for the cerebellar site and 0.3 ± 6.11 cm3 for the corpus callosum.
Using the Kruskal test, we also found a p-value of 0.006 for the R N/T depending on specific distribution. The anatomical sites in which the tumors had a larger necrotic center are the occipital lobe, the temporal and frontal lobes, as seen in Figure 8b.
4. Discussion
Our findings provide compelling evidence of significant differences in the conventional MRI appearance of GBM and solitary BM. First of all, there is a quantitative difference in the degree of perilesional edema, with greater values for secondary lesions compared to GBM (p=0.04). This may be the result of the different dynamic in tumoral growth, since metastatic disease tends to progress slower compared to aggressive primary tumors as GBM. Therefore, the volume of perilesional edema appears to be directly proportional to the duration of the secondary lesions’ evolution. Perilesional edema is the result of chronic mass effect on impaired adjacent brain parenchyma and it is seen on T2W and T2W FLAIR images as an area of hyperintensity [26].
Another important aspect that we would like to emphasize on is the difference between vascular edema and invasion of the surrounding parenchyma, usually found in primary aggressive tumors as GBM [27]. GBM is less edematous and determines a rapid local invasion by infiltrating adjacent brain tissue along tracts of white matter, blood vessels and the subarachnoid space [27,28].
The distinction between brain invasion and perilesional edema is not always clear on conventional MRI, as they are both hyperintense on T2W and T2W FLAIR [26]. However, tumoral invasion can be seen as a diffuse area with diffusion restriction and no enhancement on contrast-enhanced MRI images. The presence of adjacent brain invasion alters the therapeutic protocol, shifting the focus to radiotherapy and leading to a greater risk of recurrence [16]. Numerous research papers have analyzed the peripheric edema of the brain lesions, especially GBM, using functional and advanced MRI techniques, as perfusion, diffusion, tractography and spectroscopy, with promising results [15,16,17]. Multiple studies found significant differences in the peritumoral edema of GBM and BM, in comparison with the intra-tumoral area, suggesting that future research should mainly focus on the peritumoral region [7].
Even though the differentiation between tumoral invasion and edema is a challenging task, the identification of surrounding brain parenchyma invasion by ML or DL programs can be performed using diffusion tensor imaging (DTI), an advanced MRI protocol that analyzes the extracellular water content calculating the fractional anisotropy and the mean diffusivity [16].
DTI can be a particularly useful in discriminating between the peritumoral edema of the metastasis and the peritumoral invasion of GBM, as in GBM water particles change their isotropic movement when destruction of white matter fibers occurs [6]. One particular research also studied the DTI signal difference of the tumoral lesions, with no discrepancy between the two. Instead, they found significant disparity in the peritumoral edema, with it being more heterogeneous in the proximity of GMB compared to BM, where the edema was predominantly or completely vasogenic in nature [6]. This suggests early parenchymal neoplastic invasion of GBM in the course of its development, and the expansive nature of BM [7].
Furthermore, we identified a specific case involving a patient diagnosed with GBM that had visible invasion in the adjacent parenchyma, the aspect on MRI imaging is seen in Figure 9.
Another finding strongly suggests that the internal necrosis is more abundant in GBM lesions compared to BM (p=0.002). This could also emphasize on the fact that GBM has a more aggressive nature, with greater cellular destruction and turn-over. Consequently, the RE/N was significantly greater for secondary brain lesions than GBM (p=0.02).
The incidence of BM depending on the primary tumor, in our cohort, was similar to that of the general incidence, with predominance of lung, breast carcinomas and melanoma, displaying slightly disproportionately values due to bias selection [29]. Lung cancer was the most frequent neoplasia, representing in total 61.53% of cases, of which 53.84% NSCLC subtype, followed by breast cancer (17.94%) and melanoma (7.69%).
The most edematous secondary lesions were from lung cancer, especially NSCLC, followed by digestive carcinomas, breast and melanoma, with the least edematous being the BM from renal and colorectal carcinomas (p=0.01). On the other hand, the most necrotic ones derived from colorectal and renal carcinomas (p=0.01); this finding could be the result of scarce identification of cystic lesions by the AI model, as necrotic tissues and cystic transformation of lesions are quite similar on T2W FLAIR images.
A better identification of cystic components and necrotic central tissue could be obtained by analyzing the contour defined by the lesion border, as necrotic borders are irregular and anfractuous, differing in thickness. In contrast, cystic walls are well delineated and smooth, having a more rounded shape (see Figure 10) [20].
Consequently, more studies should focus on this aspect, as their following implications are very different. Cystic lesions are radiotherapy resistant, often developing radiation necrosis, and their content is usually evacuated prior to other treatment. On the other hand, necrotic areas are surgically excised along with the tumor [30].
Regarding central necrosis, the most necrotic lesions were found in the supratentorial plane (p=0.002), specifically in the occipital, temporal and frontal lobes (p=0.006). The presence of central necrosis at diagnosis has been associated with poor prognosis for patients with secondary lesions [31].
Regarding the accuracy of volume calculation by the ellipsoid manual and DL methods, the results are similar, with the greater difference being found among occipital and temporal lobes lesions (p=0.01). This might be the consequence of the particular shape of the occipital and the temporal lobes, as they are more distantly situated from the medio-sagittal plan; therefore, interfering in the ellipsoidal method of calculation, making it difficult to appreciate the true dimensions of lesions in these particular lobes.
Finally, we would like to discuss the results regarding the RAI/M between men and women, which was statistically significant, with a p-value of 0.02. This is clearly a biased result, as no difference of brain lesions between sexes should exist or has been previously confirmed. This might be the result of the demographic distribution of GBM and BM in the population, as GBM affects male patients more often than female patients, with an incidence of 5.51 per 100,000 population for men compared to 3.65 for women [1]. Moreover, BM prevalence strongly depends on the primary tumors (for example BM from breast cancer are found predominantly in female patients). We would like to draw attention to the fact that female patients should be represented as much as male participants in studies, especially in the development of AI tools regarding medical conditions that concern both male and female patients.
Our study however has its limitations, being a retrospective, single-center research focusing on a relatively small cohort of patients (78 in total) diagnosed with GBM and BM. The results regarding the subtypes of BM should not be generalized due to the small sample size of many subgroups (1 patient with single BM from renal carcinoma). We therefore strongly advise further correlations with other findings on this particular topic.
The retrospective nature of our study also brings a certain grade of diversity to the acquisition parameters that can affect the model results. The data collection was also retrospectively retrieved from the hospital’s registry of patients, and some data is consequently missing (for example, the molecular subtype of other primary tumors, as breast cancer or melanoma). Although the inclusion and exclusion criteria helped building a solid database, consisting only of pathologically confirmed cases, this can also result in selection bias. This is why the incidence of GBM and BM in our study is not representative for the entire population.
Finally, ulterior studies are required in order to better differentiate cystic lesions from central necrosis, as well as perilesional edema from adjacent brain invasion in the case of aggressive tumors such as GBM.
5. Conclusions
To conclude, the DL software developed by mdbrain demonstrated its efficacy in the process of sub-segmenting brain lesions into solid and necrotic components, while also focusing on the perilesional edema. This provides greater information about the volume of both the lesion and the edema. Segmentation is an indispensable step in radiomics, preceding the feature extraction, and used alone it can also provide relevant data regarding the tumoral burden and differentiation.
Moreover, our results confirm that GBMs are less edematous but more necrotic compared to secondary brain lesions.
Author Contributions
Conceptualization, D.P. and C.C.; methodology, D.P., O.M.O; software, O.M.O.; formal analysis, O.M.O.; investigation, D.P., E.A.M., S.I.C.; resources, D.P., C.C., B.I.D., M.R.P., A.C.I.; data curation, D.P., O.M.O., C.C., E.A.M.; writing—original draft preparation, D.P., S.I.C; writing—review and editing, C.C., S.I.C.; visualization, A.C.I., B.I.D., M.P.R., D.H.; supervision, D.H., E.A.M.; project administration, D.P., D.H. All authors have read and agreed to the published version of the manuscript.
Funding
This research received no external funding.
Institutional Review Board Statement
The study was conducted in accordance with the Declaration of Helsinki, and approved by the by the Ethics Committee of both the University of Medicine and Pharmacy “Grigore T. Popa” (Nr. 422/02.04.2024 for BM patients and Nr. 421/31.03.2024 for GBM patients) and the Clinical Emergency Hospital “Prof. Dr. Nicolae Oblu” (Nr. 10/08.11.2023).
Informed Consent Statement
Patient consent was waived due to the retrospective nature of the study.
Data Availability Statement
Our data is not publicly available due to ethical restrictions, but can be accessed through the corresponding author on reasonable request.
Acknowledgments
We would like to express our gratitude to the radiology technicians that performed the MRI investigations. Special thanks to the histopathology department that indirectly contributed to the selection of the cases.
Conflicts of Interest
The authors declare no conflicts of interest.
Abbreviations
The following abbreviations are used in this manuscript:
| GBM | Glioblastoma |
| BM(s) | Brain Metastasis |
| CT | Computer Tomography |
| MRI | Magnetic Resonance Imaging |
| ML | Machine Learning |
| DL | Deep Learning |
| AI | Artificial intelligence |
| T2W FLAIR | T2-wheighted Fluid Attenuated Inversion Recovery |
| CE T1W | Contrast-enhanced T1-wheigthed |
| FSPGR | Fast Spoiled Gradient Echo |
| DICOM | Digital Imaging and Communication in Medicine |
| NSCLC | Non-small Cell Lung Carcinoma |
| SCLC | Small Cell Lung Carcinoma |
| LC | Lung Cancer |
| DWI | Diffusion-weighted Imaging |
| ADC | Apparent Diffusion Coefficient |
| DTI | Diffusion Tensor Imaging |
References
- Pellerino, A.; Caccese, M.; Padovan, M.; Cerretti, G.; Lombardi, G. Epidemiology, risk factors, and prognostic factors of gliomas. Clin Trans Imaging. Springer Science and Business Media Deutschland GmbH; 2022, Vol. 10, p. 467–75. [CrossRef]
- Zoghbi, M.; Moussa, MJ.; Dagher, J.; Haroun, E.; Qdaisat, A.; Singer, ED. et al. Brain Metastasis in the Emergency Department: Epidemiology, Presentation, Investigations, and Management. Cancers. Multidisciplinary Digital Publishing Institute (MDPI); 2024, Vol. 16. [CrossRef]
- McNamara, C.; Mankad, K.; Thust, S.; Dixon, L.; Limback-Stanic, C.; D’Arco, F. et al. 2021 WHO classification of tumours of the central nervous system: a review for the neuroradiologist. Neuroradiology. Springer Science and Business Media Deutschland GmbH; 2022, Vol. 64, p. 1919–50. [CrossRef]
- Gliomas - StatPearls - NCBI Bookshelf [Internet]. [cited 2025 Jul 24]. Available from: https://www.ncbi.nlm.nih.gov/books/NBK441874/#article-18547.s4.
- Habibi, MA.; Omid, R.; Asgarzade, S.; Derakhshandeh, S.; Soltani Farsani, A.; Tajabadi, Z. Distinguishing glioblastoma from brain metastasis; a systematic review and meta-analysis on the performance of machine learning. EJNS, 2025 Feb 6;40(1):26. Available from: https://EJNS.springeropen.com/articles/10.1186/s41984-025-00386-w. [CrossRef]
- Skogen, K.; Schulz, A.; Helseth, E.; Ganeshan, B.; Dormagen, JB.; Server, A. Texture analysis on diffusion tensor imaging: discriminating glioblastoma from single brain metastasis. Acta radiol. 2019, Mar 1;60(3):356–66. [CrossRef]
- Jekel, L.; Brim, WR.; von Reppert, M.; Staib, L.; Cassinelli Petersen, G.; Merkaj, S. et al. Machine Learning Applications for Differentiation of Glioma from Brain Metastasis—A Systematic Review. Cancers. MDPI; 2022, Vol. 14. [CrossRef]
- Artzi, M.; Bressler, I.; Ben Bashat, D. Differentiation between glioblastoma, brain metastasis and subtypes using radiomics analysis. J Magn Reson Imaging. 2019 Aug 1;50(2):519–28. [CrossRef]
- Azab, MA.; El-Gohary, N.; Atallah, O.; Shama, M.; Ibrahim, IA. Perfusion-MRI for differentiating cerebral metastatic lesions and gliomas: An evidence-based review. J Clin Neurosci. Churchill Livingstone; 2025, Vol. 133. [CrossRef]
- Qian, Z.; Li, Y.; Wang, Y.; Li, L.; Li, R.; Wang, K. et al. Differentiation of glioblastoma from solitary brain metastases using radiomic machine-learning classifiers. Cancer Lett. 2019, Jun 1;451:128–35. [CrossRef]
- Board WHOC of TE. Central Nervous System Tumours [Internet]. World Health Organization; 2022 [cited 2025 Jul 24]. 584 p. Available from: https://www.amazon.com/Central-Nervous-System-Tumours-Classification/dp/9283245083.
- Dong, F.; Li, Q.; Jiang, B.; Zhu, X.; Zeng, Q.; Huang, P. et al. Differentiation of supratentorial single brain metastasis and glioblastoma by using peri-enhancing oedema region–derived radiomic features and multiple classifiers. Eur Radiol. 2020, May 1;30(5):3015–22. [CrossRef]
- Smirniotopoulos, JG.; Jäger, HR. Differential Diagnosis of Intracranial Masses. 2022, p. 93–104. [CrossRef]
- Anne, G. Osborn.; Gary, L. Hedlung.; Karen, L. Salzman. Osborn’s Brain Imaging, Pathology, and Anatomy. Second Edition. Elsevier, editor. Elsevier; 2018, Vol. I, 497–867 p. ISBN 978-0-323-47776-5.
- Abdel, Razek AAK.; Talaat, M.; El-Serougy, L.; Abdelsalam, M.; Gaballa, G. Differentiating Glioblastomas from Solitary Brain Metastases Using Arterial Spin Labeling Perfusion− and Diffusion Tensor Imaging−Derived Metrics. World Neurosurg. 2019 Jul 1;127:e593– 8. [CrossRef]
- Samani, ZR.; Parker, D.; Wolf, R.; Hodges, W.; Brem, S.; Verma, R. Distinct tumor signatures using deep learning-based characterization of the peritumoral microenvironment in glioblastomas and brain metastases. Sci Rep. 2021 Dec 1;11(1). [CrossRef]
- Askaner, K.; Rydelius, A.; Engelholm, S.; Knutsson, L.; Lätt, J.; Abul-Kasim, K. et al. Differentiation between glioblastomas and brain metastases and regarding their primary site of malignancy using dynamic susceptibility contrast MRI at 3T. AJNR, 2019 Nov 1;46(6):367–72. [CrossRef]
- Shin, I.; Kim, H.; Ahn, SS.; Sohn, B.; Bae, S.; Park, JE. et al. Development and validation of a deep learning-based model to distinguish glioblastoma from solitary brain metastasis using conventional MR images. AJNR Am J Neuroradiol. 2021 May 1;42(5):838–44. [CrossRef]
- Le Fèvre, C.; Sun, R.; Cebula, H.; Thiery, A.; Antoni, D.; Schott, R. et al. Ellipsoid calculations versus manual tumor delineations for glioblastoma tumor volume evaluation. Sci Rep. 2022, Dec 1;12(1). [CrossRef]
- Dolgushin, M.; Kornienko, V.; Pronin, I. Brain Metastases. Springer, editor. Springer; 2018. 52–58 p. [CrossRef]
- Ronneberger, O.; Fischer, P.; Brox, T. U-net: Convolutional networks for biomedical image segmentation. In: Lecture Notes in Computer Science (including subseries Lecture Notes in Artificial Intelligence and Lecture Notes in Bioinformatics). Springer Verlag, 2015. p. 234–41. [CrossRef]
- Ramakrishnan, D.; Jekel, L.; Chadha, S.; Janas, A.; Moy, H.; Maleki, N. et al. A large open access dataset of brain metastasis 3D segmentations on MRI with clinical and imaging information. Sci Data, 2024 Dec 1;11(1). [CrossRef]
- Krithikadatta, J. Normal Distribution. J Conserv Dent [Internet]. 2014 Jan [cited 2025 Jul 31];17(1):96. Available from: https://pmc.ncbi.nlm.nih.gov/articles/PMC3915399/. [CrossRef]
- Sedgwick, P. Parametric v non-parametric statistical tests. BMJ (Online). 2012, Vol. 344. [CrossRef]
- Schober, P.; Vetter, TR. Statistical Minute Nonparametric Statistical Methods in Medical Research [Internet]. 2020. p. 1862-1863. Available from: www.anesthesia-analgesia.org. ISBN 2018;127:569575.
- Qin, X.; Liu, R.; Akter, F.; Qin, L.; Xie, Q.; Li, Y. et al. Peri-tumoral brain edema associated with glioblastoma correlates with tumor recurrence. J Cancer, 2021 Feb 5;12(7):2073–82. [CrossRef]
- Vollmann-Zwerenz, A.; Leidgens, V.; Feliciello, G.; Klein, CA.; Hau, P. Tumor cell invasion in glioblastoma. Int J Mol Sci. MDPI AG, 2020, Vol. 21. [CrossRef]
- Doroszko, M.; Stockgard, R.; Uppman, I.; Heinold, J.; Voukelatou, F.; Mangukiya, HB. et al. The invasion phenotypes of glioblastoma depend on plastic and reprogrammable cell states. Nat Commun [Internet]. 2025 Jul 19;16(1):6662. Available from: https://www.nature.com/articles/s41467-025-61999-1. [CrossRef]
- Lamba, N.; Wen, PY.; Aizer, AA. Epidemiology of brain metastases and leptomeningeal disease. Neuro-Oncology. Oxford University Press; 2021, Vol. 23, p. 1447–56. [CrossRef]
- Feng, R.; Loewenstern, J.; Aggarwal, A.; Pawha, P.; Gilani, A.; Iloreta, AM. et al. Cerebral Radiation Necrosis: An Analysis of Clinical and Quantitative Imaging and Volumetric Features. World Neurosurg. 2018 Mar 1;111:e485–94. [CrossRef]
- Ocaña-Tienda, B.; Pérez-Beteta, J.; Ortiz de Mendivil, A.; Asenjo, B.; Albillo, D.; Pérez-Romasanta, LA. et al. Morphological MRI features as prognostic indicators in brain metastases. Cancer Imaging. 2024 Dec 1;24(1). [CrossRef]
Figure 1.
Mdbrain processing of MRI brain acquisition (DICOM). T1W CE in sagittal, coronal and respectively axial planes. View of the three regions that were calculated separately for every patient: green – necrosis, orange – enhancing part of the tumor and purple – perilesional edema (approval was obtained from the Ethics Committee of the University of Medicine and Pharmacy “Grigore T. Popa” Iasi). .
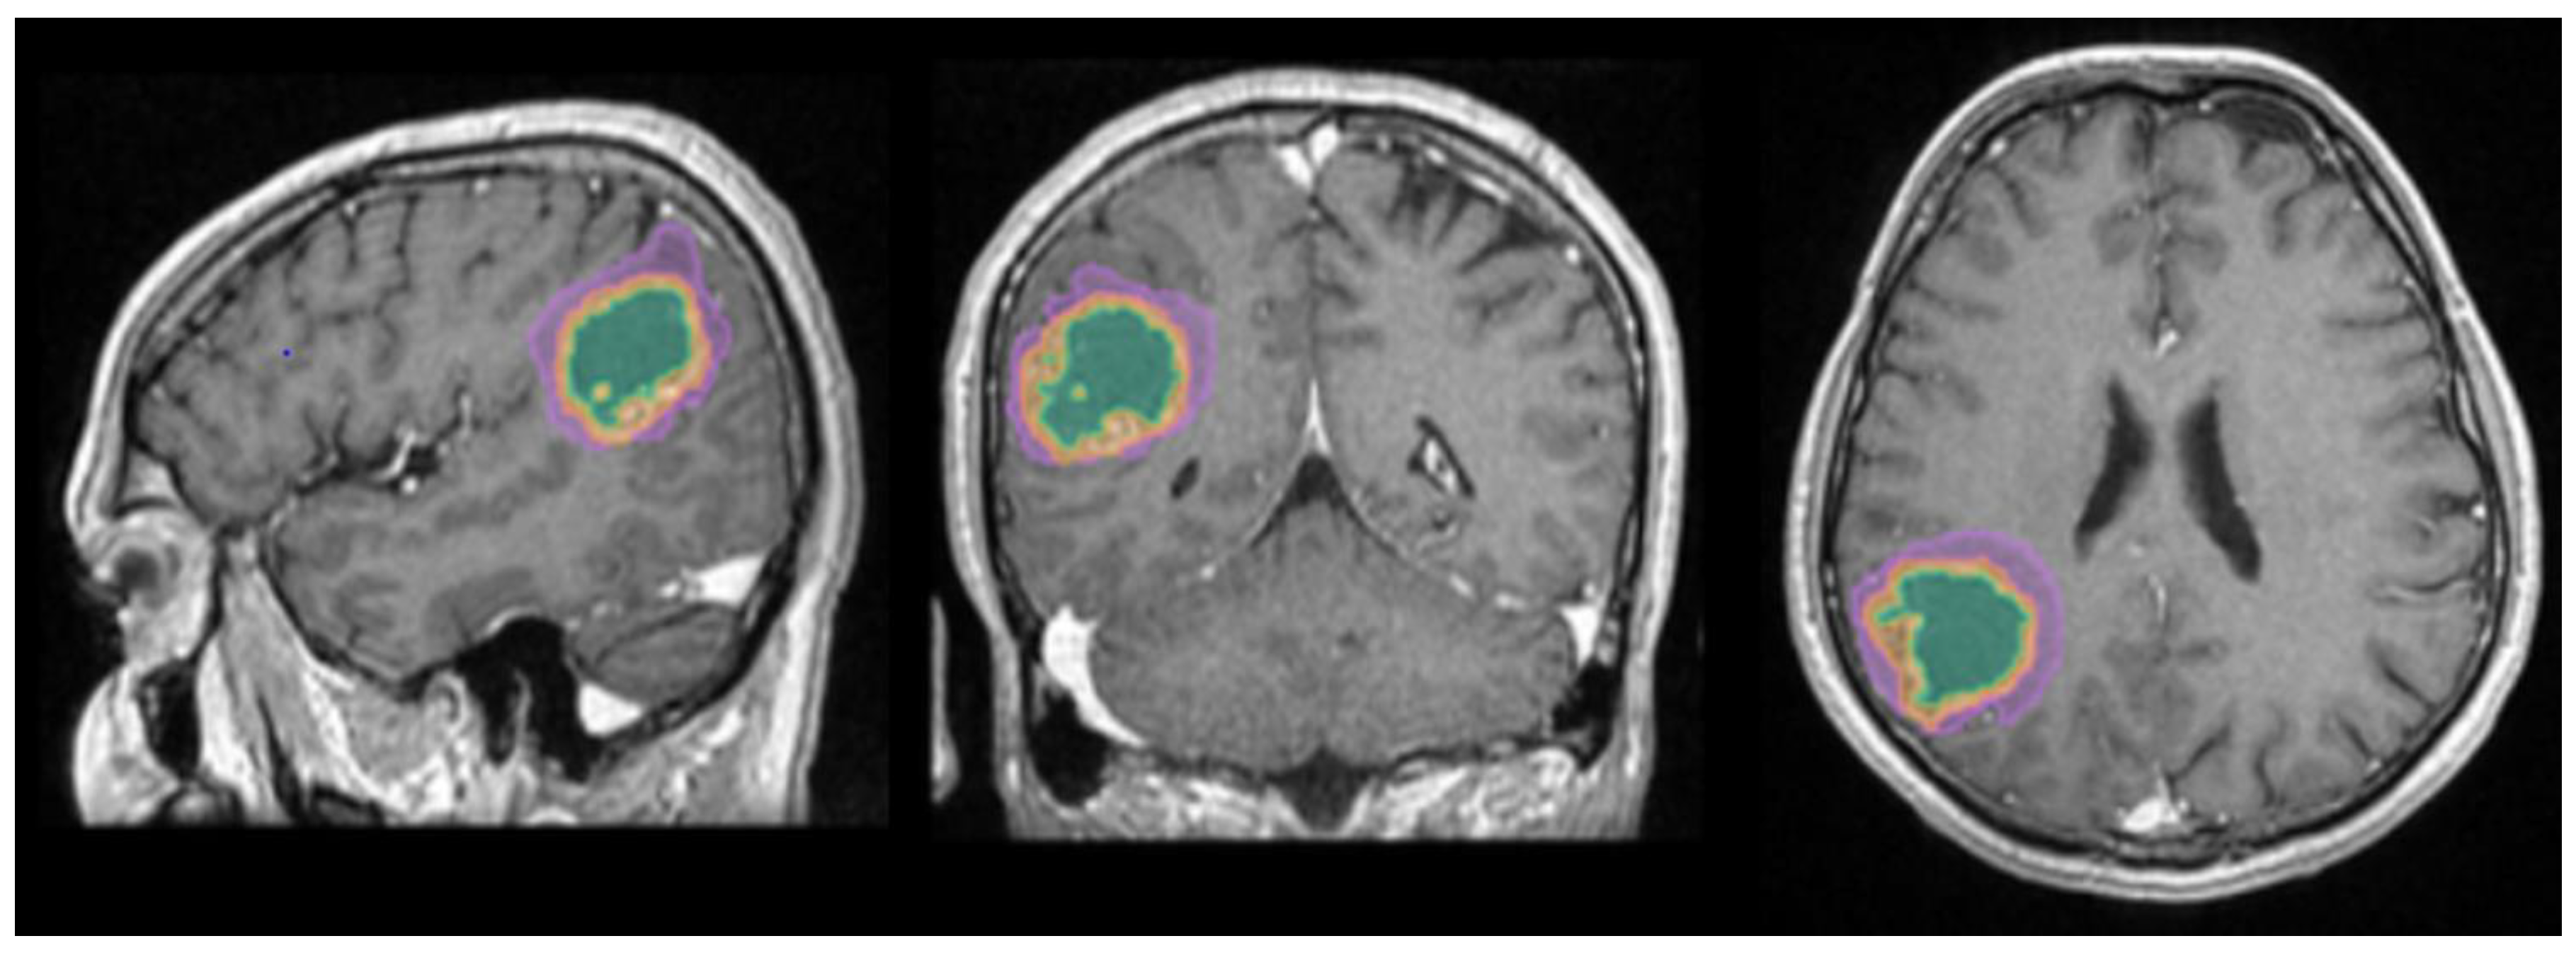
Figure 2.
(a) Distribution of the volume of the lesions calculated using the ellipsoidal method; (b) Distribution of the lesions’ volume calculated by the AI tool (c) Distribution of the perilesional edema volume of the lesions calculated using the AI tool; (d) Distribution of the necrosis volume calculated by the AI tool.
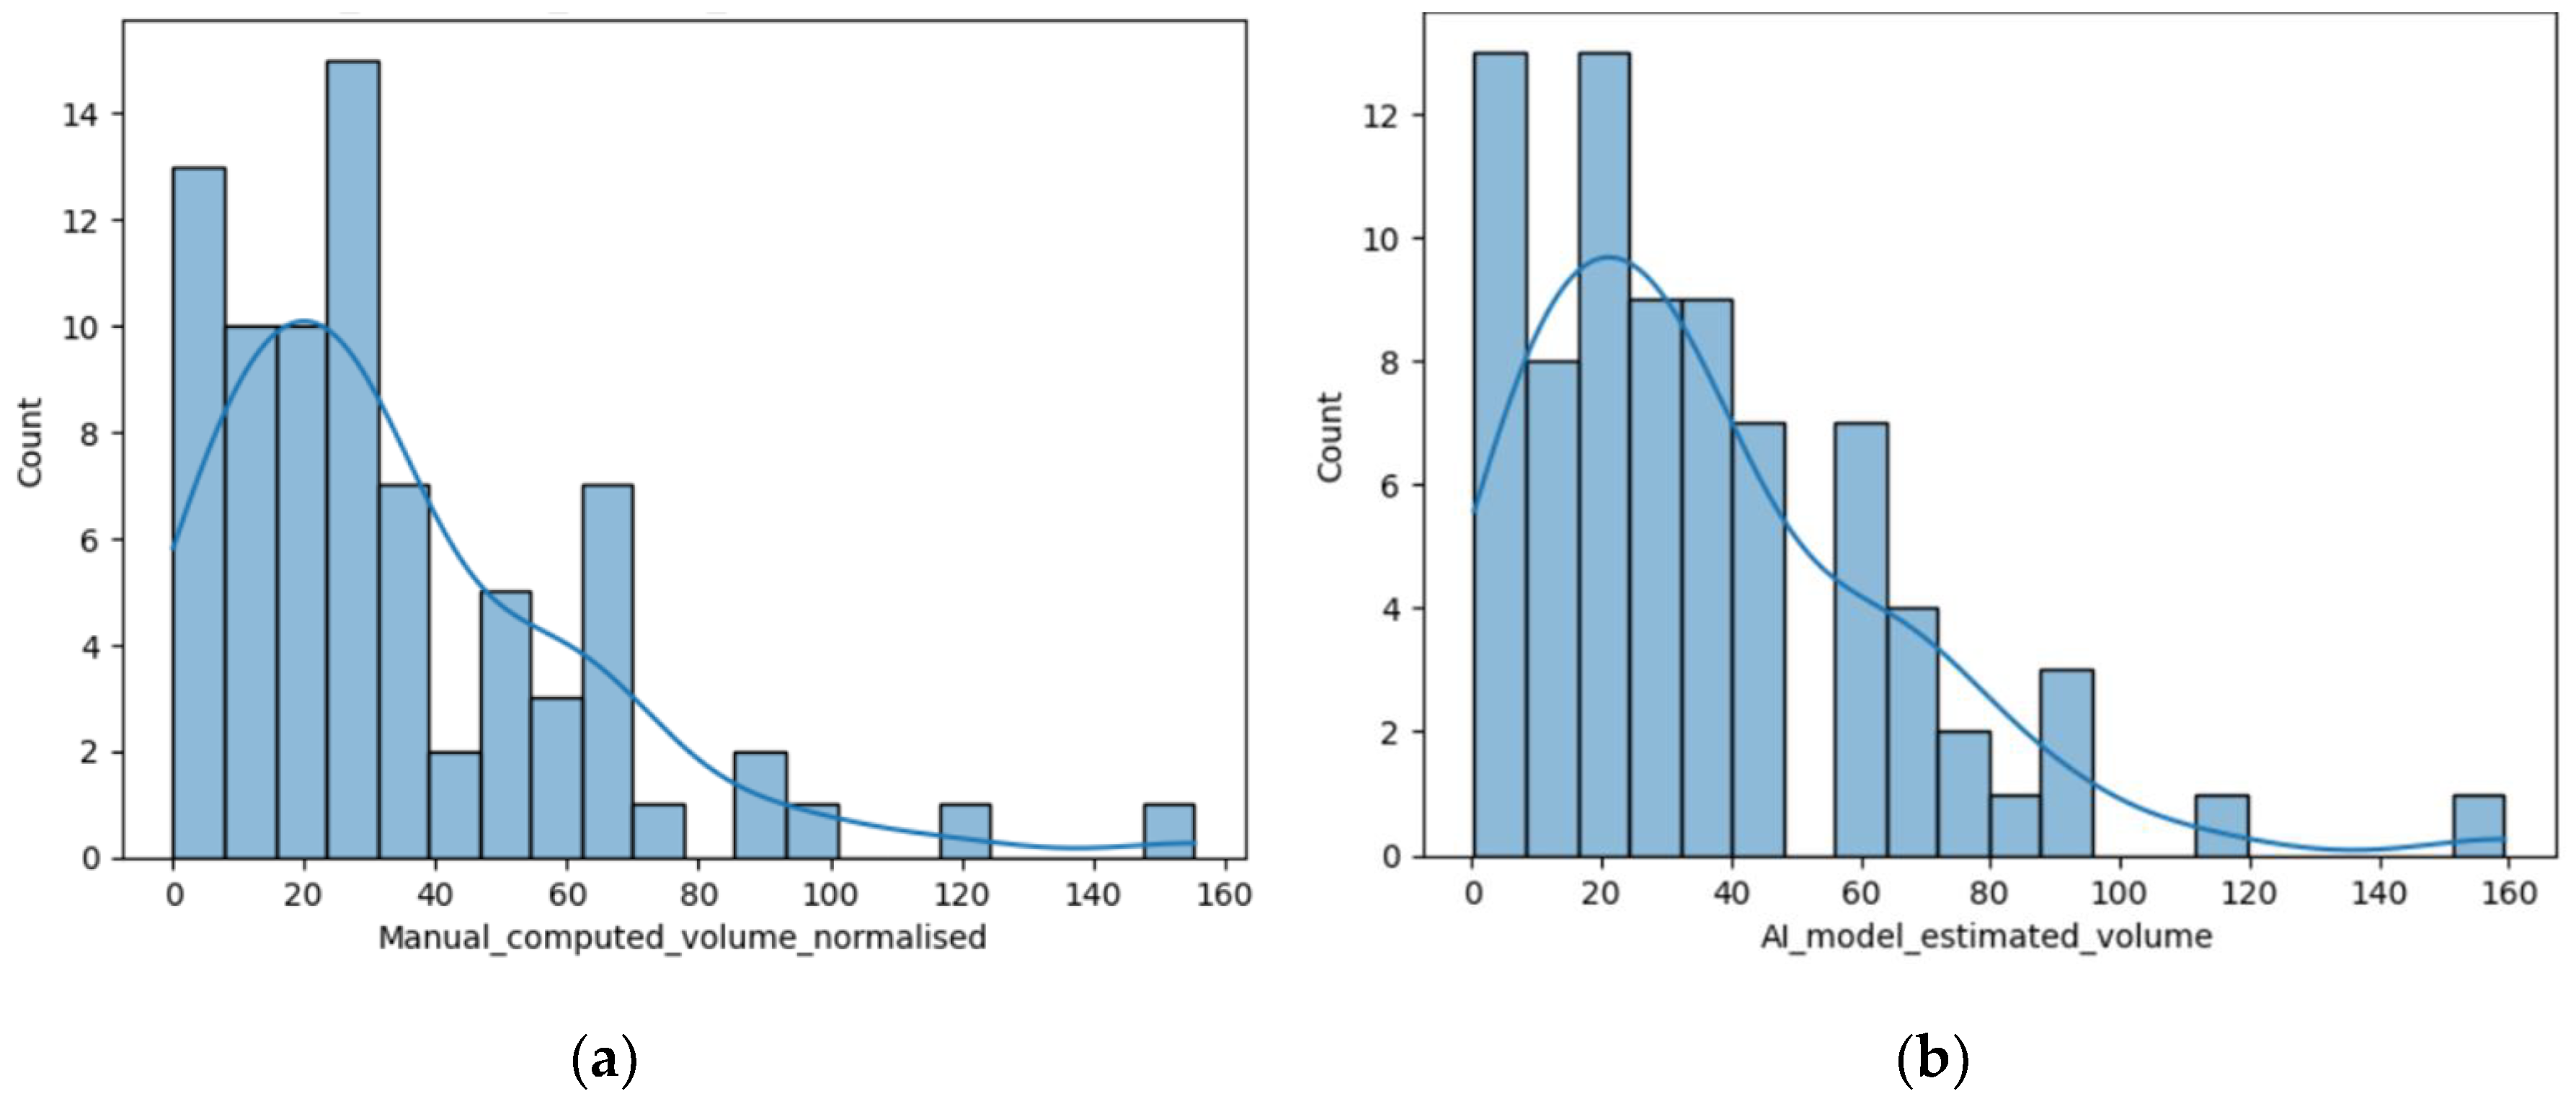
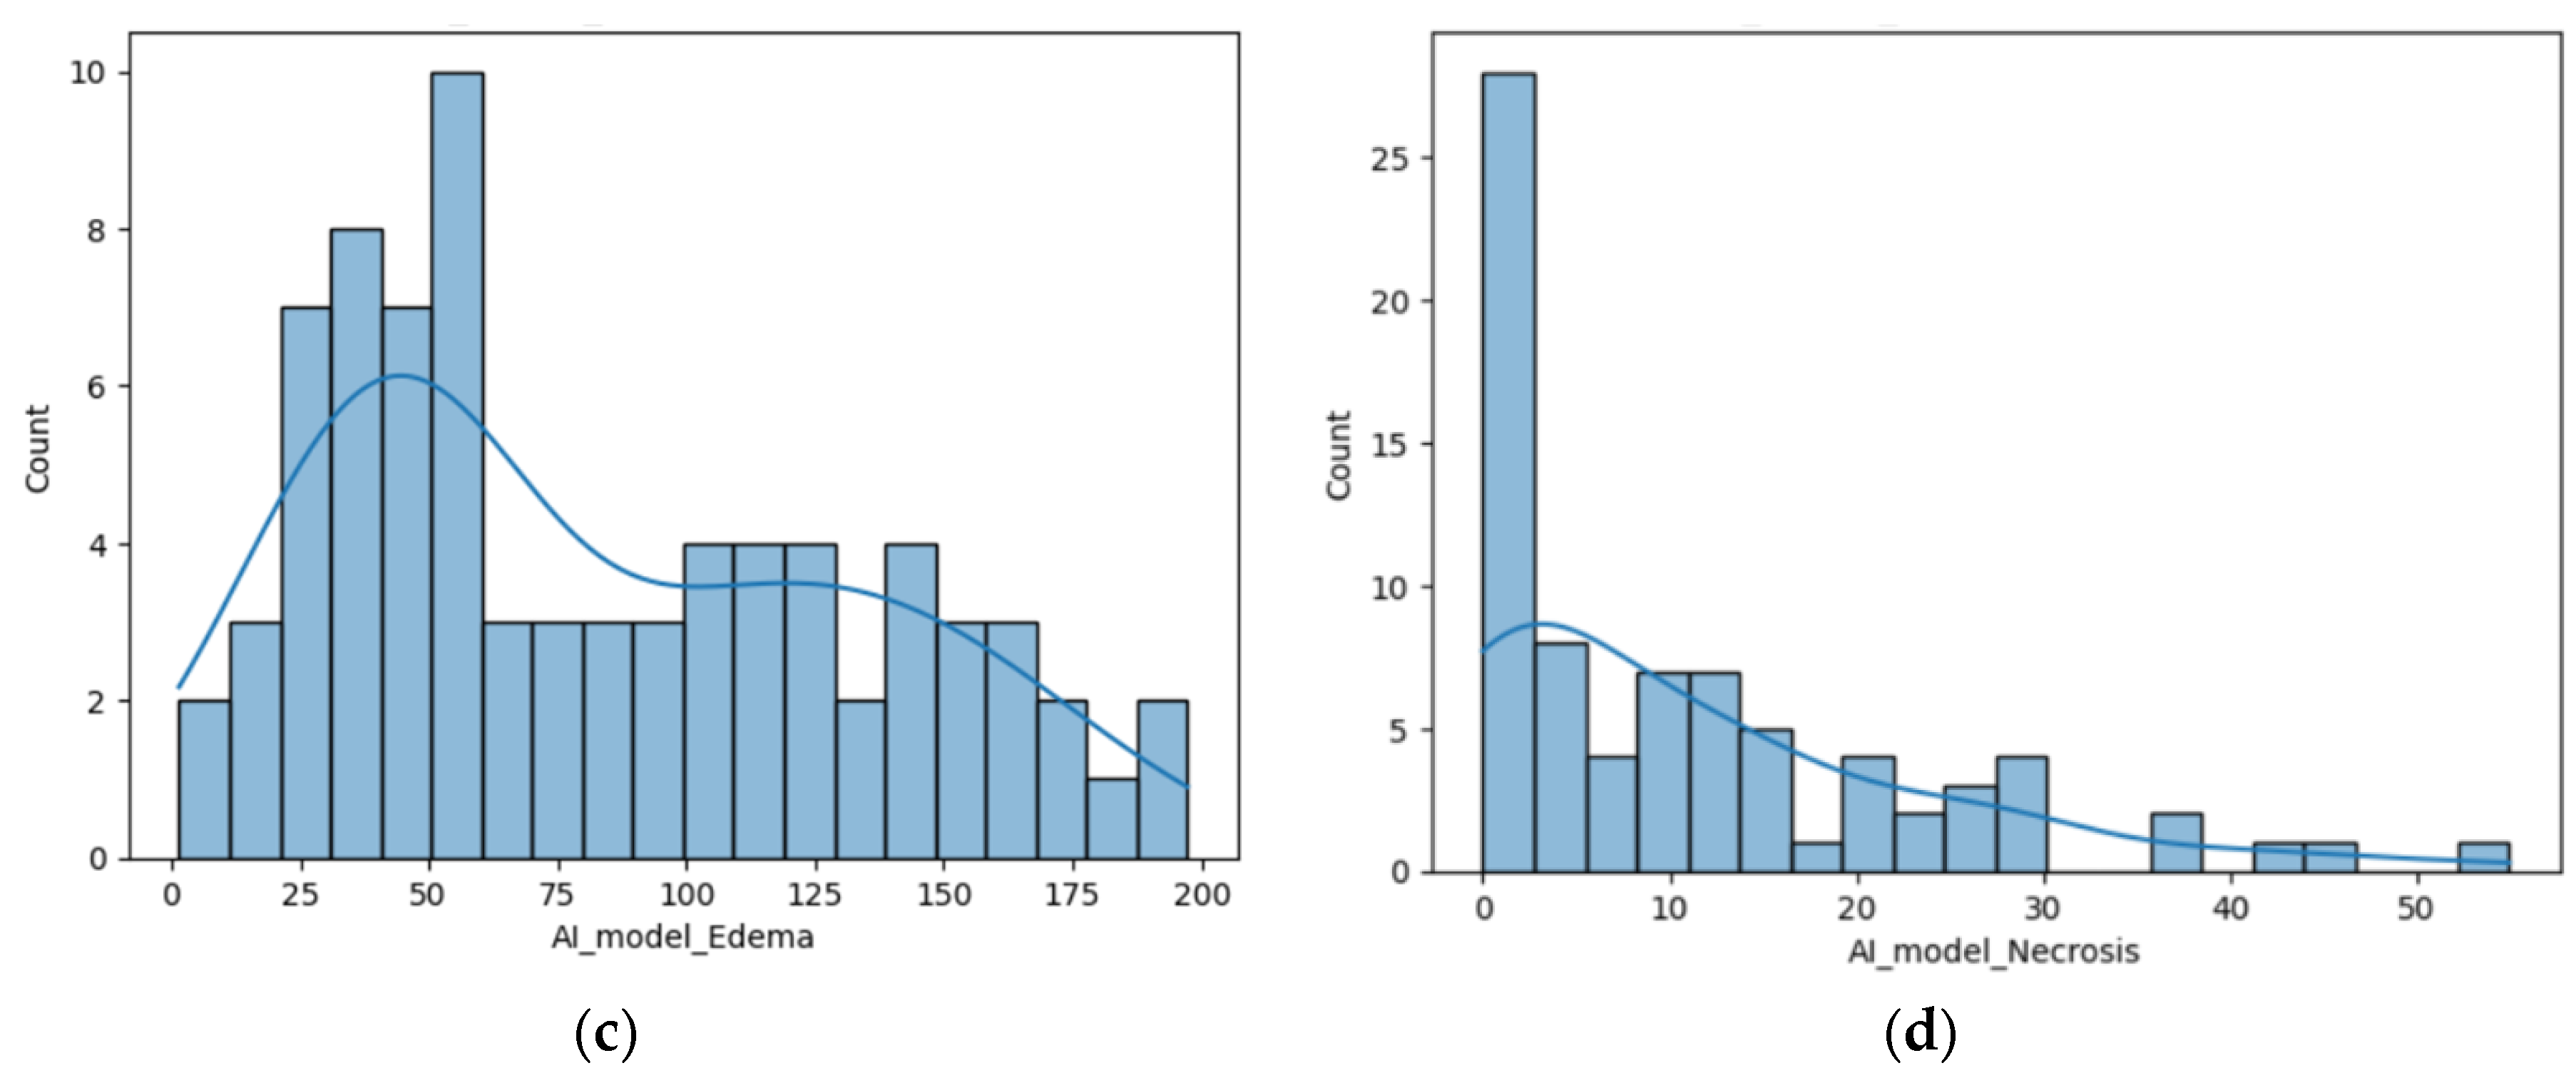
Figure 3.
(a) Distribution of the R AI/M; (b) Distribution of the R E/T calculated by the AI tool; (c) Distribution of the R N/T calculated using the AI tool; (b) Distribution of the R E/N.
Figure 3.
(a) Distribution of the R AI/M; (b) Distribution of the R E/T calculated by the AI tool; (c) Distribution of the R N/T calculated using the AI tool; (b) Distribution of the R E/N.
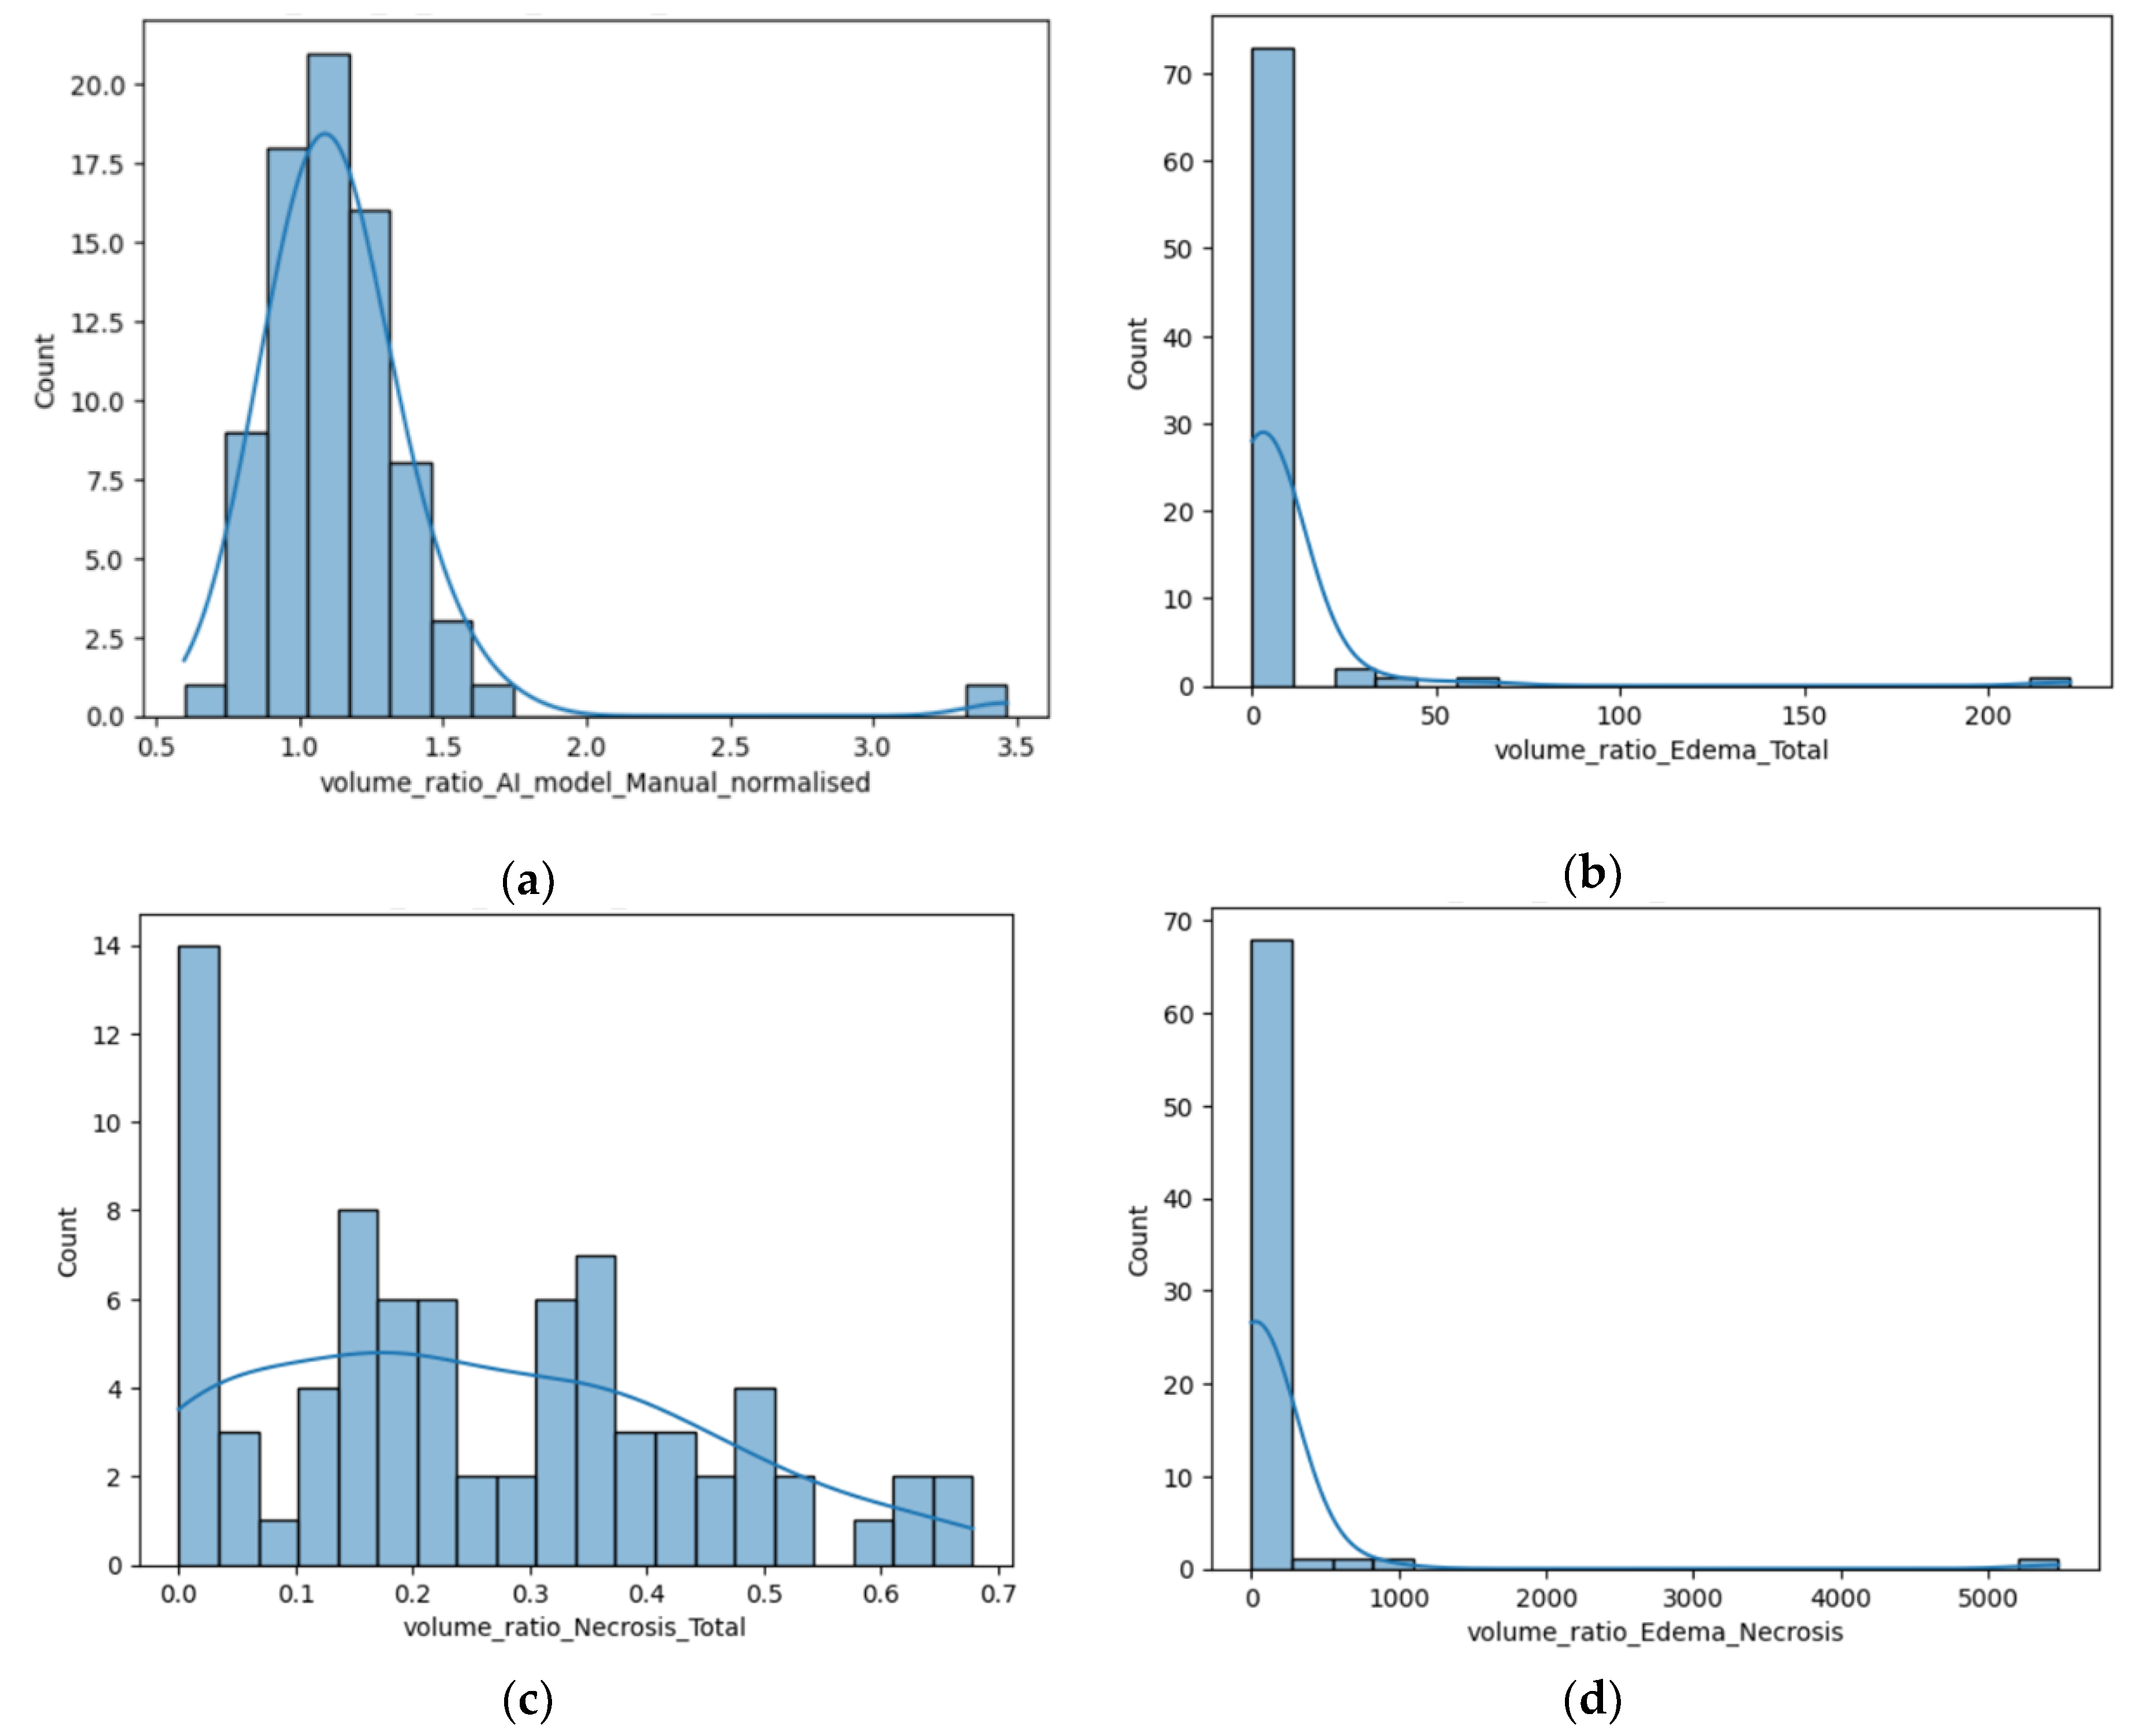
Figure 4.
(a) Box-plot showing the R E/T for the two subgroups; (b) Box-plot displaying the difference of the R N/T; (c) Box-plot representing the difference of the R E/N for the two subgroups; (b) Box-plot revealing the R AI/M for male and female participants.
Figure 4.
(a) Box-plot showing the R E/T for the two subgroups; (b) Box-plot displaying the difference of the R N/T; (c) Box-plot representing the difference of the R E/N for the two subgroups; (b) Box-plot revealing the R AI/M for male and female participants.
| Primary tumor | Number (%) |
|---|---|
| Lung cancer (61.53%) | 21 (NSCLC*) (53.84%) |
| 1 (SCLC**) (2.56%) | |
| 2 (anaplastic) (5.12%) | |
| Breast cancer | 7 (17.94%) |
| Melanoma | 3 (7.69%) |
| Colorectal | 2 (5.12%) |
| Digestive (other sites) | 2 (5.12%) |
| Renal | 1 (2.56%) |
| Diagnosis | Women | Men |
|---|---|---|
| Glioblastoma | 11 | 28 |
| Brain metastasis | 13 | 26 |
Figure 6.
(a) Box-plot showing the different values of the median, minimum and maximal values for the R E/T, according to their primary tumor (if secondary lesions) and GBM. In this box-plot, the different molecular subtypes of lung cancer are separately assessed: the NSCLC subgroup has the more edematous lesions, with external values close to 40, the SCLC subgroup consisting of only one patient has significantly a smaller R E/T; and the LC subgroup – unknown molecular subtype with even lower values (close to 4); (b) Box-plot showing the different values of the median, minimum and maximal values o R N/T, according to their primary tumor (if secondary lesions) and GBM. In this box-plot, the different molecular subtypes of lung cancer are separately assessed with the LC subgroup – unknown molecular subtype showing the greater central necrosis of the LC group. GBM is the most necrotic lesion, with a median value of 0.31, with maximum ratio of 0.6.
| Primary tumor | Number (%) |
|---|---|
| Lung cancer (61.53%) | 21 (NSCLC*) (53.84%) |
| 1 (SCLC**) (2.56%) | |
| 2 (anaplastic) (5.12%) | |
| Breast cancer | 7 (17.94%) |
| Melanoma | 3 (7.69%) |
| Colorectal | 2 (5.12%) |
| Digestive (other sites) | 2 (5.12%) |
| Renal | 1 (2.56%) |
| Diagnosis | Women | Men |
|---|---|---|
| Glioblastoma | 11 | 28 |
| Brain metastasis | 13 | 26 |
Figure 7.
Box-plot showing the difference of R N/T for supratentorial and infratentorial lesions.
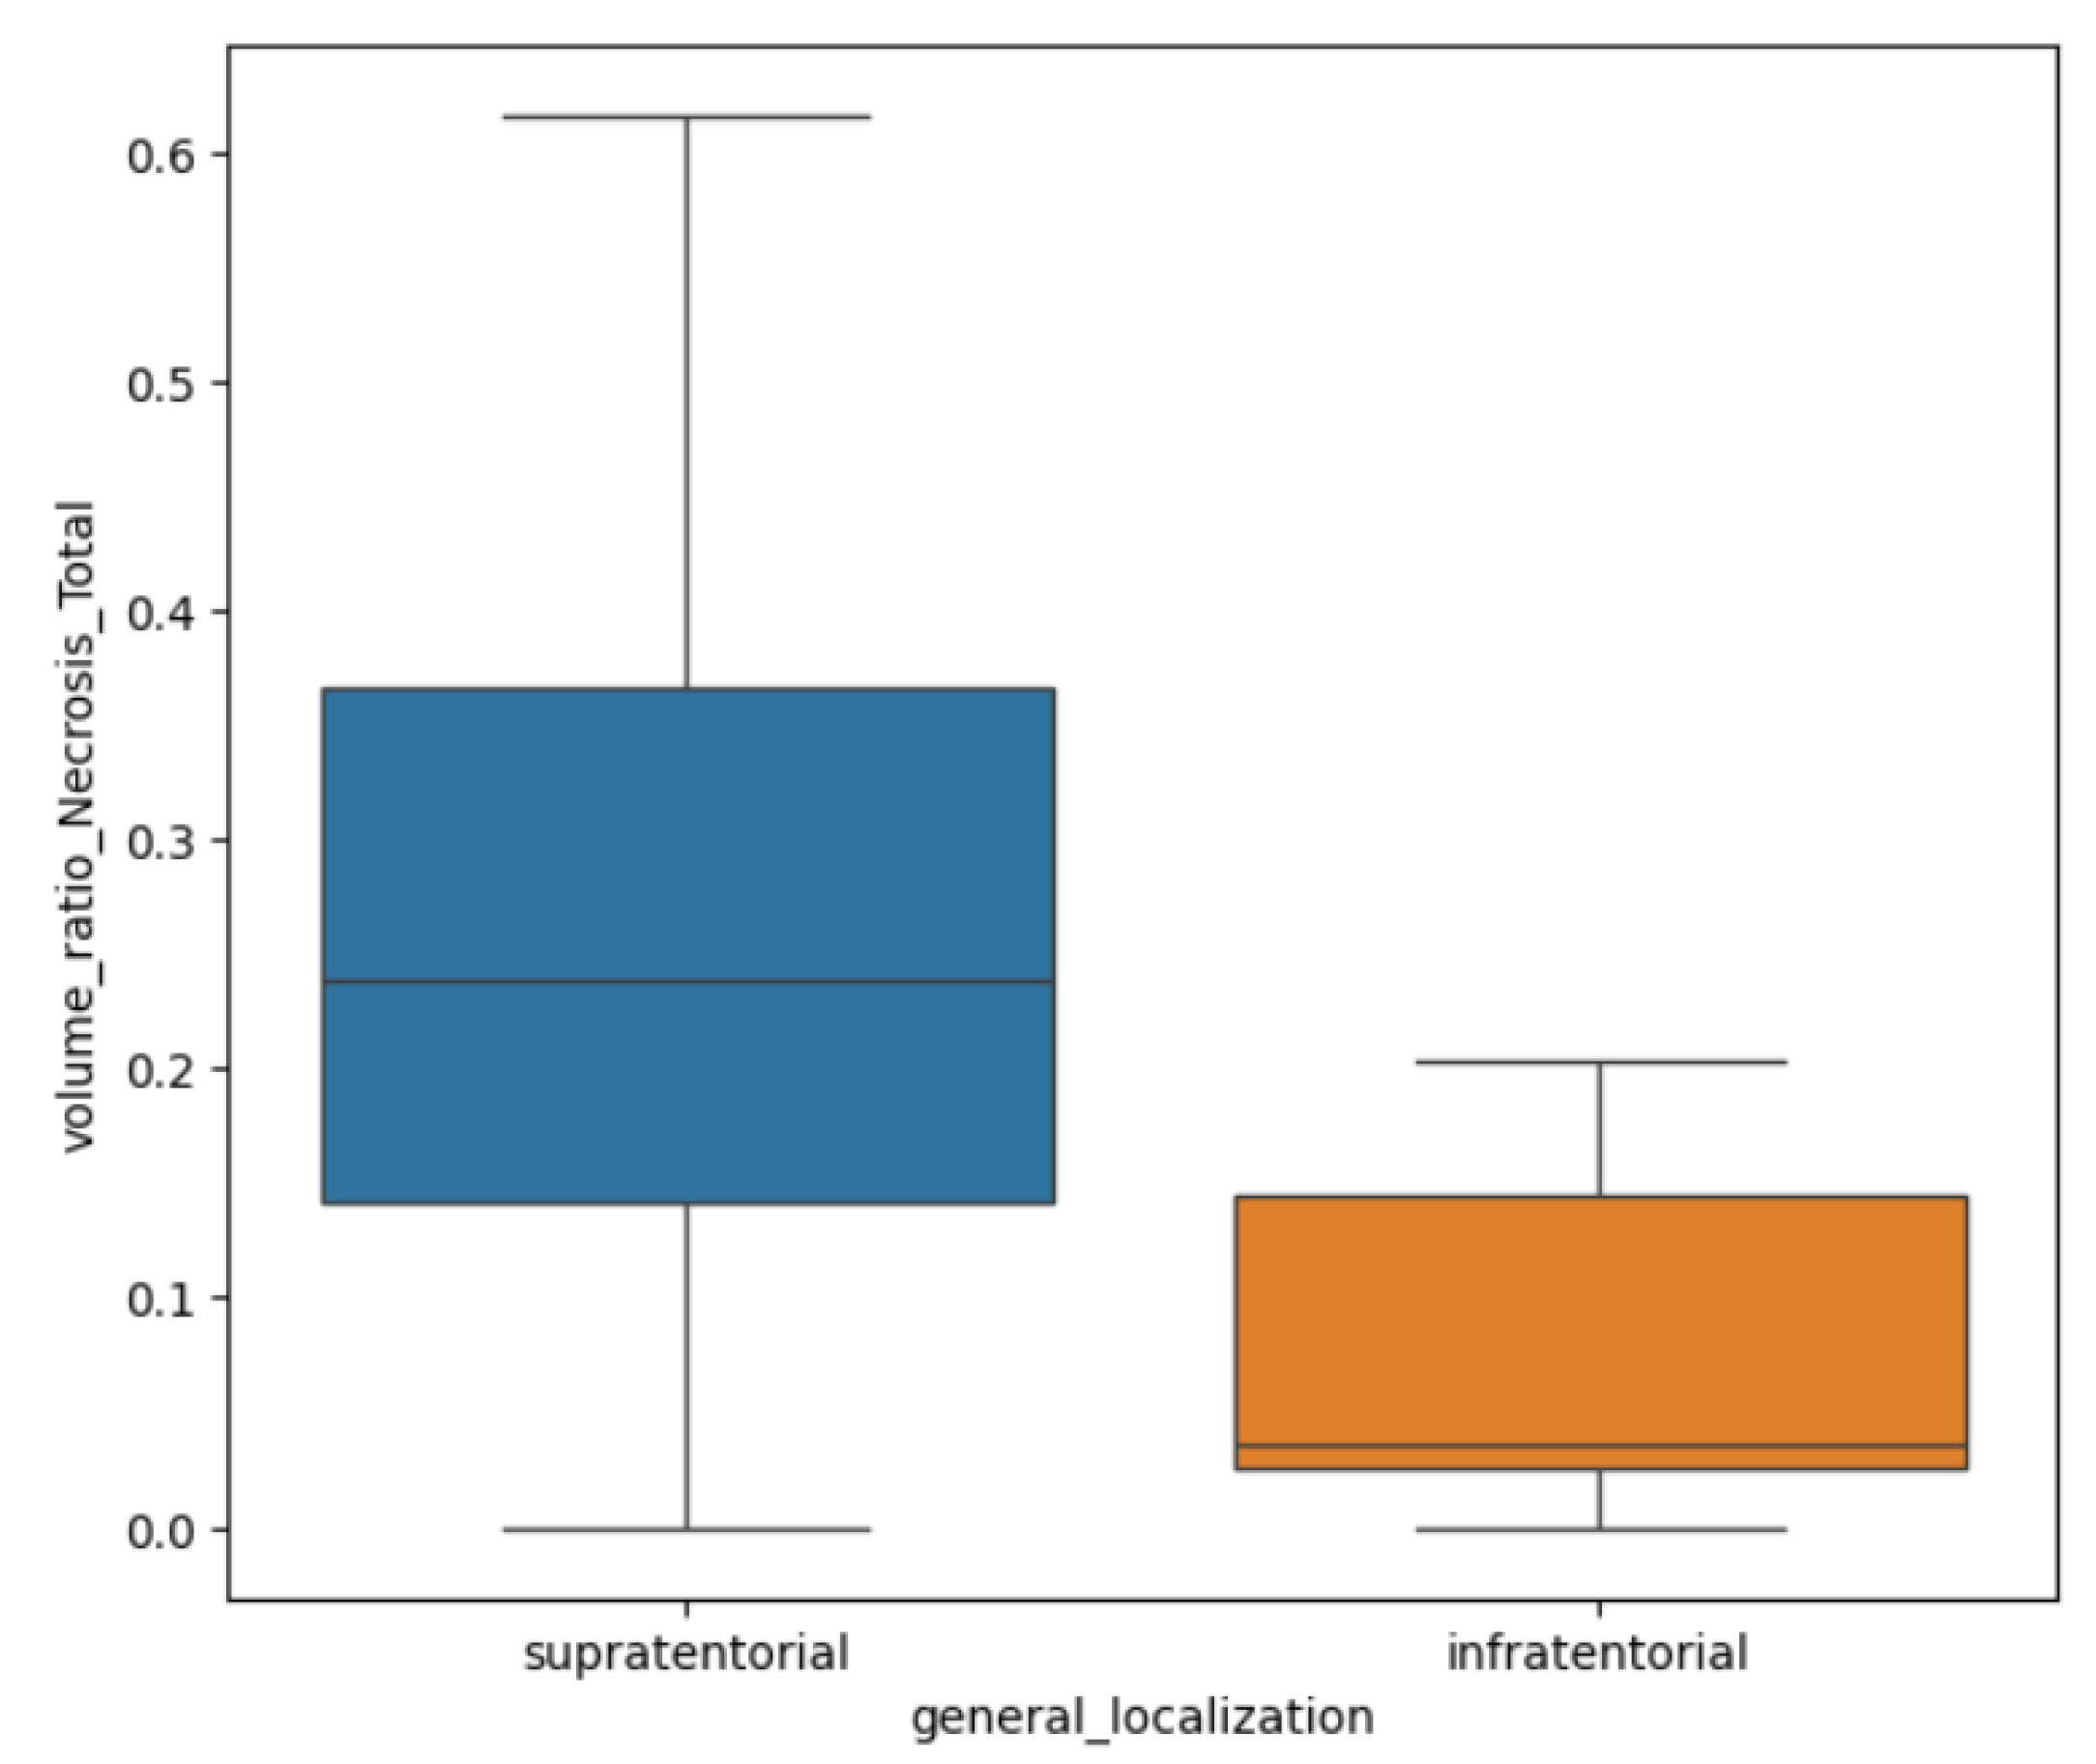
Figure 8.
(a) Box-plot showing the Diff AI-M depending on anatomical site (b) Box-plot showing the R N/T depending on anatomical site.
Figure 8.
(a) Box-plot showing the Diff AI-M depending on anatomical site (b) Box-plot showing the R N/T depending on anatomical site.
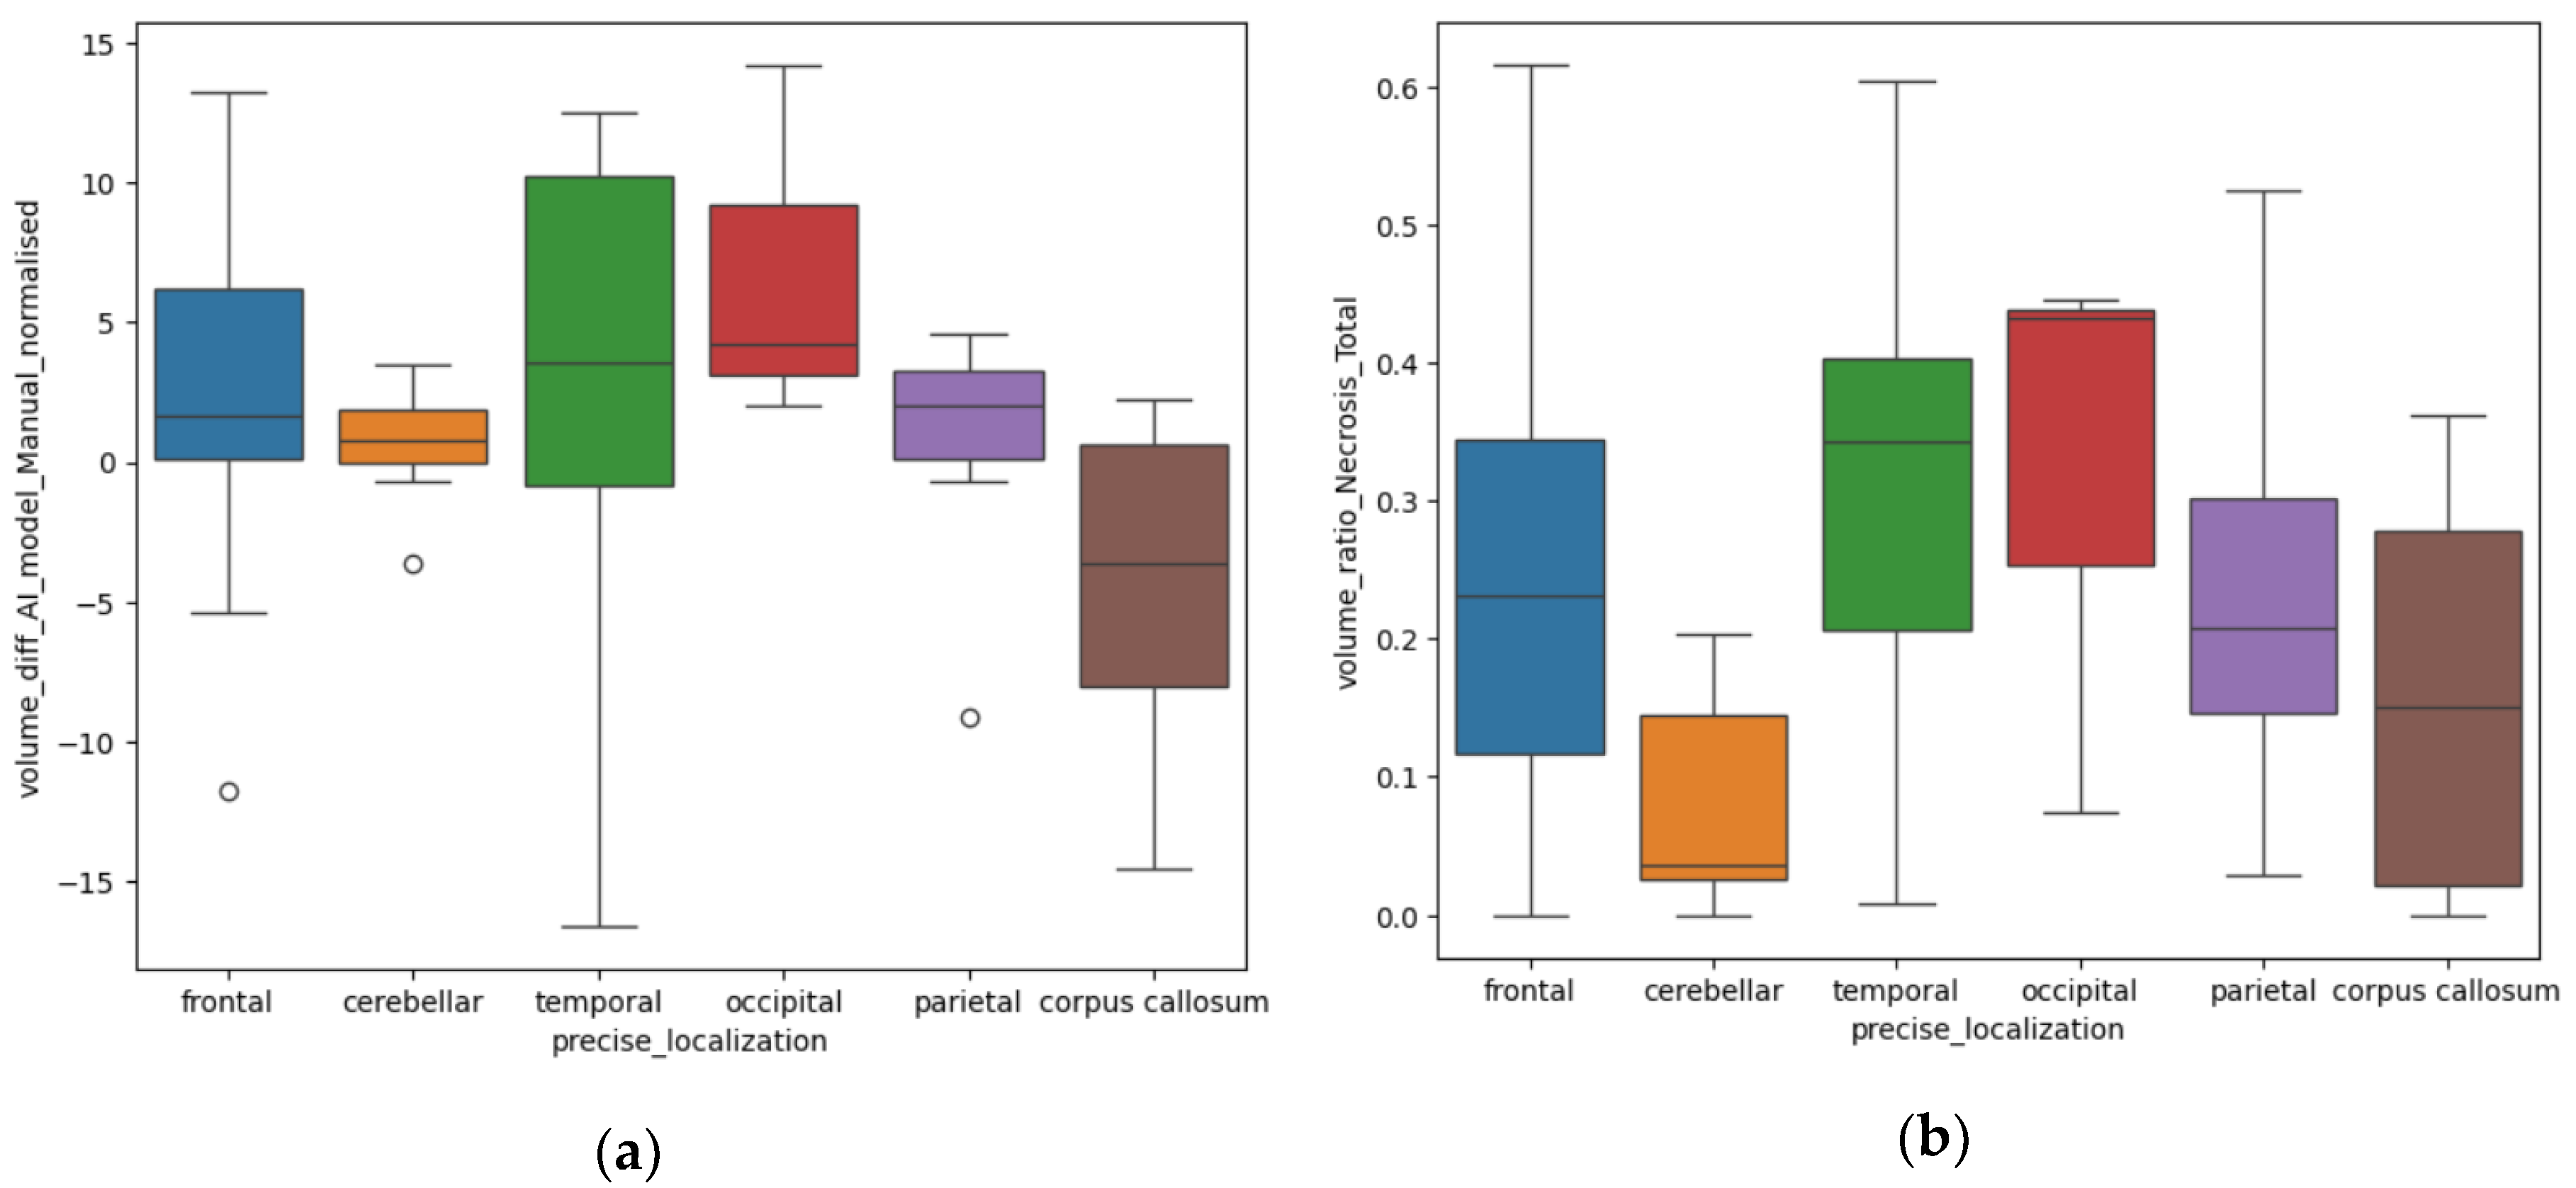
Figure 9.
(a) Mdbrain processing of MRI brain acquisition (DICOM) – purple area corresponding to T2W FLAIR hyperintensity; (b) T2W FLAIR, axial plane, manual delimitated (yellow dotted line) hyperintense area corresponding to edema/ parenchymal invasion; (c) DWI, axial plane, discreet hyperintensity in the immediate subcortical area, manually delineated (orange dotted line); (d) ADC map – hypo-intensity corresponding to the DWI hypersignal, suggesting parenchymal invasion, manually delimitated (orange dotted line) (approval was obtained from the Ethics Committee of the University of Medicine and Pharmacy “Grigore T. Popa” Iasi).
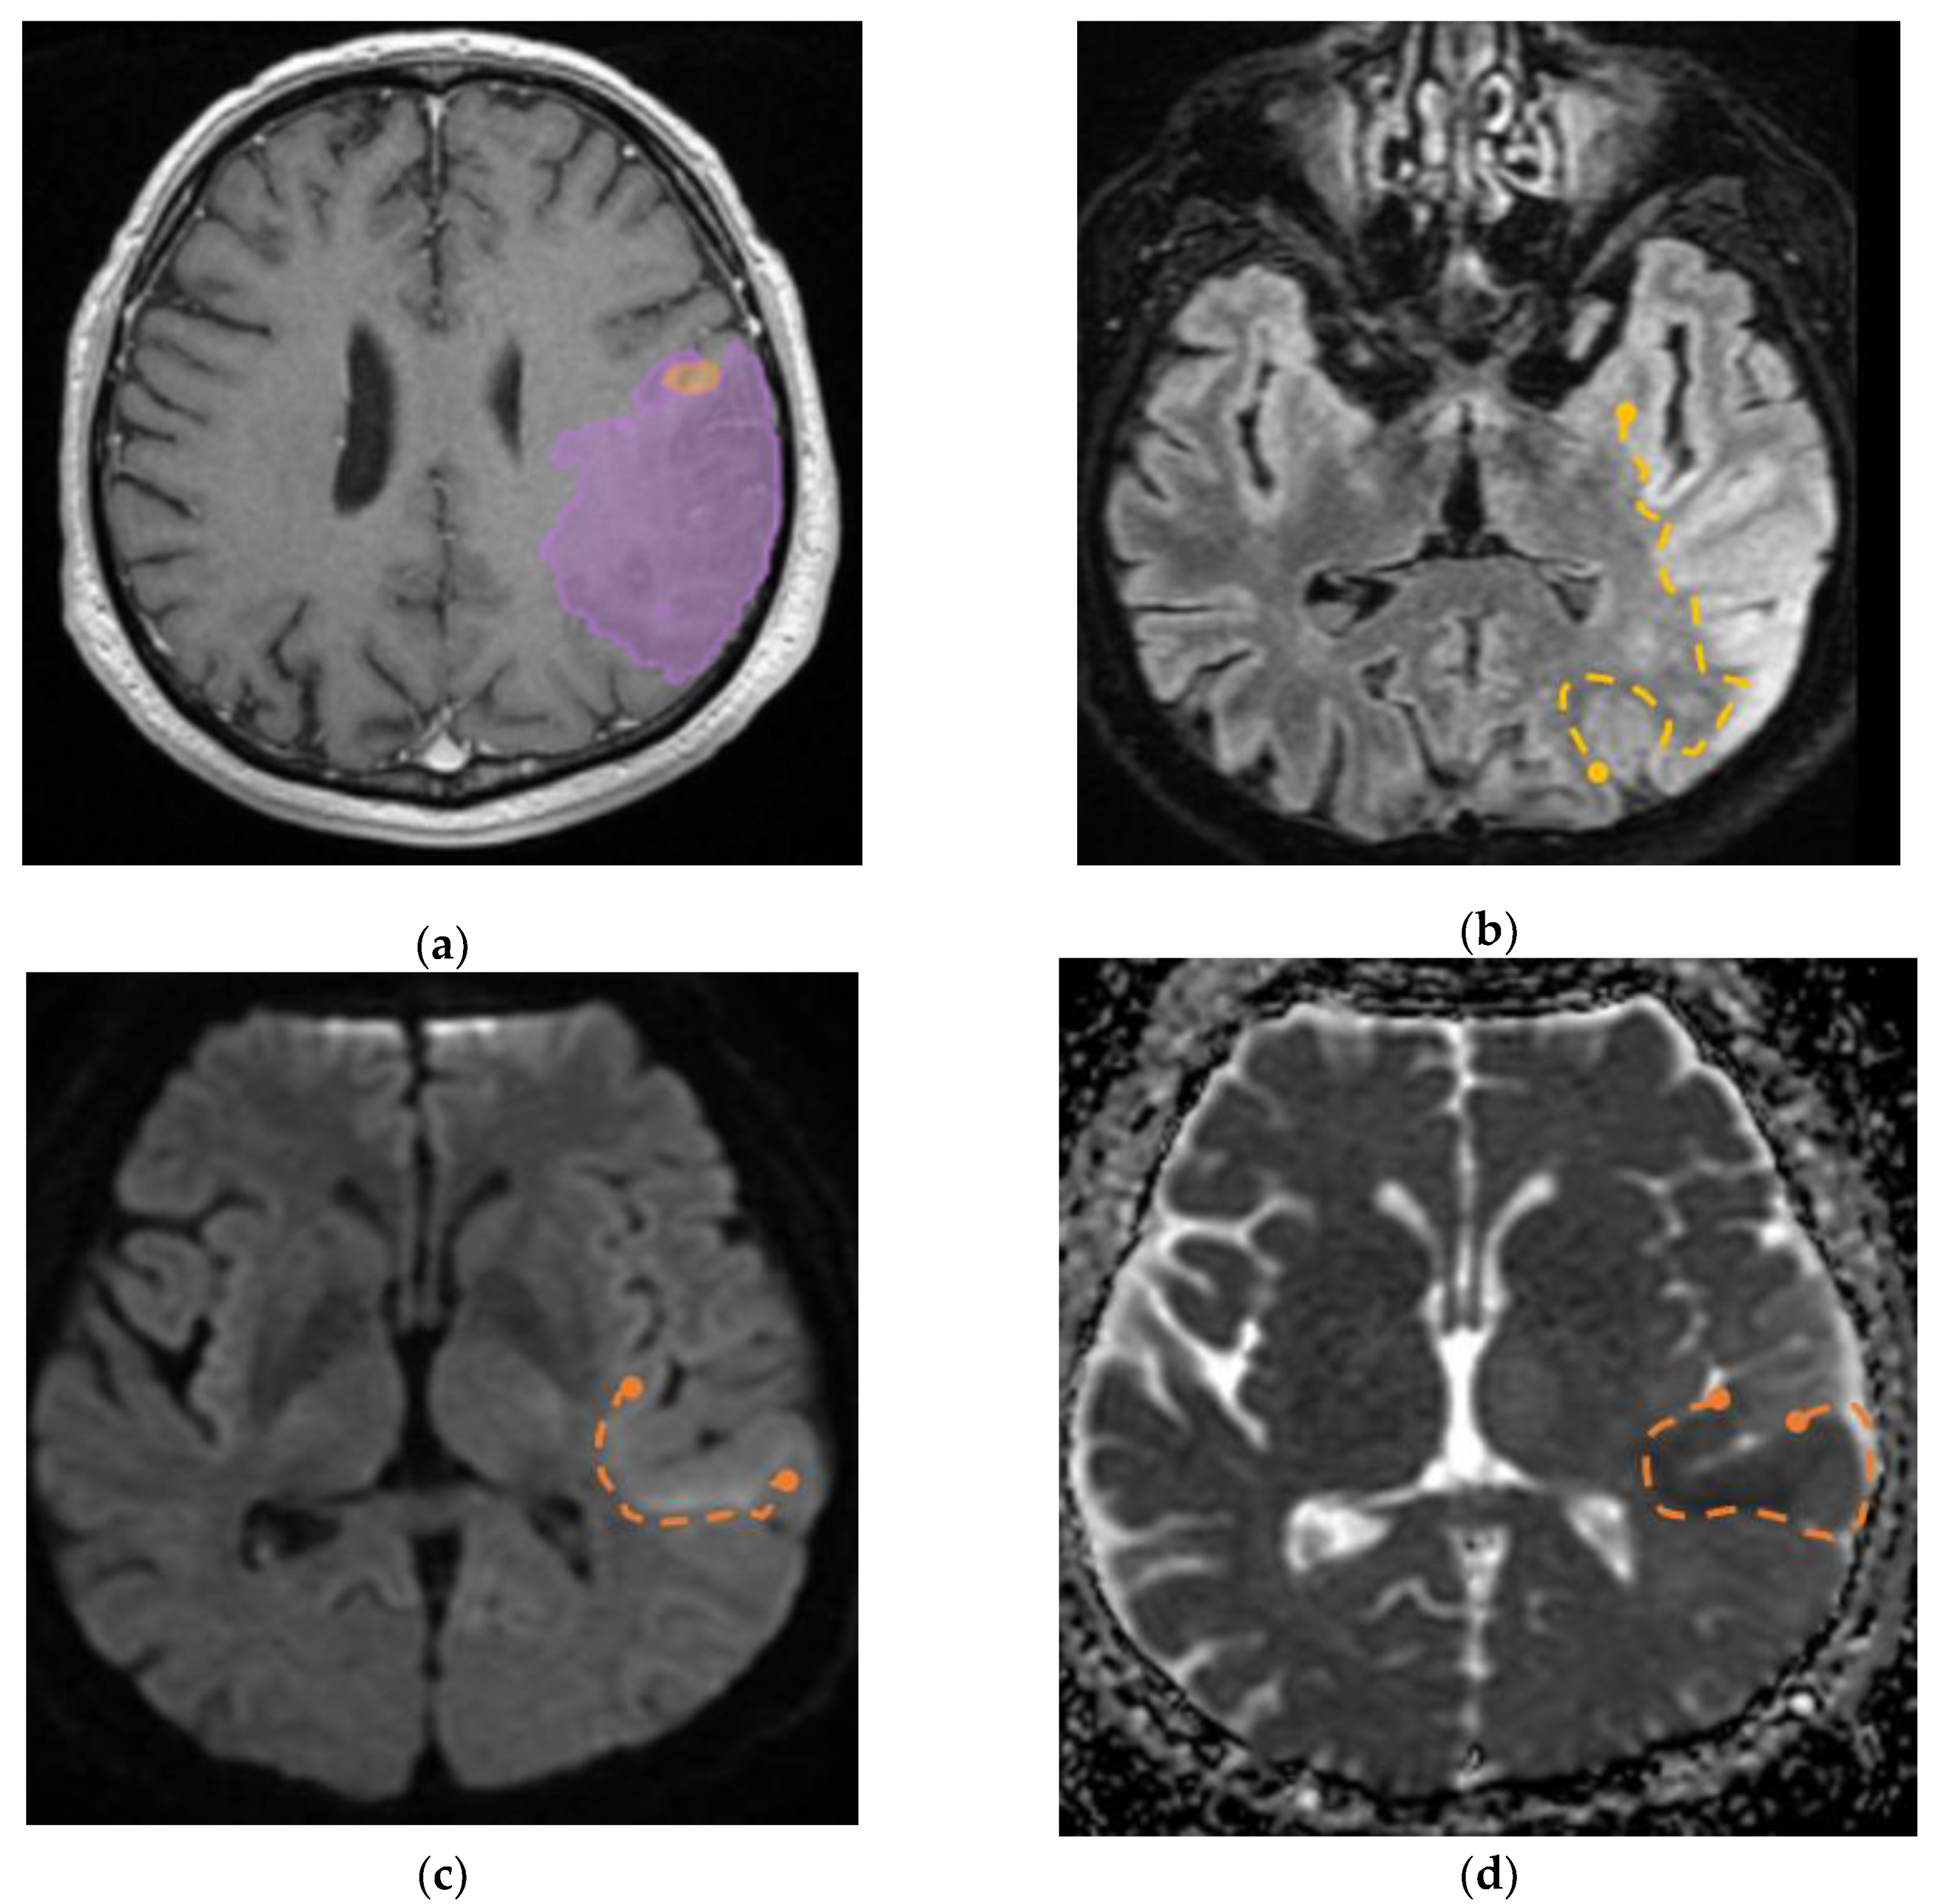
Figure 10.
Mdbrain processing of MRI brain acquisition (DICOM). (a) T1W CE +FLAIR, axial plane, green area corresponding to the cystic portion of the lesion; (b) T1W CE+FLAIR, axial plane, green area corresponding to the necrotic center (approval was obtained from the Ethics Committee of the University of Medicine and Pharmacy “Grigore T. Popa” Iasi).
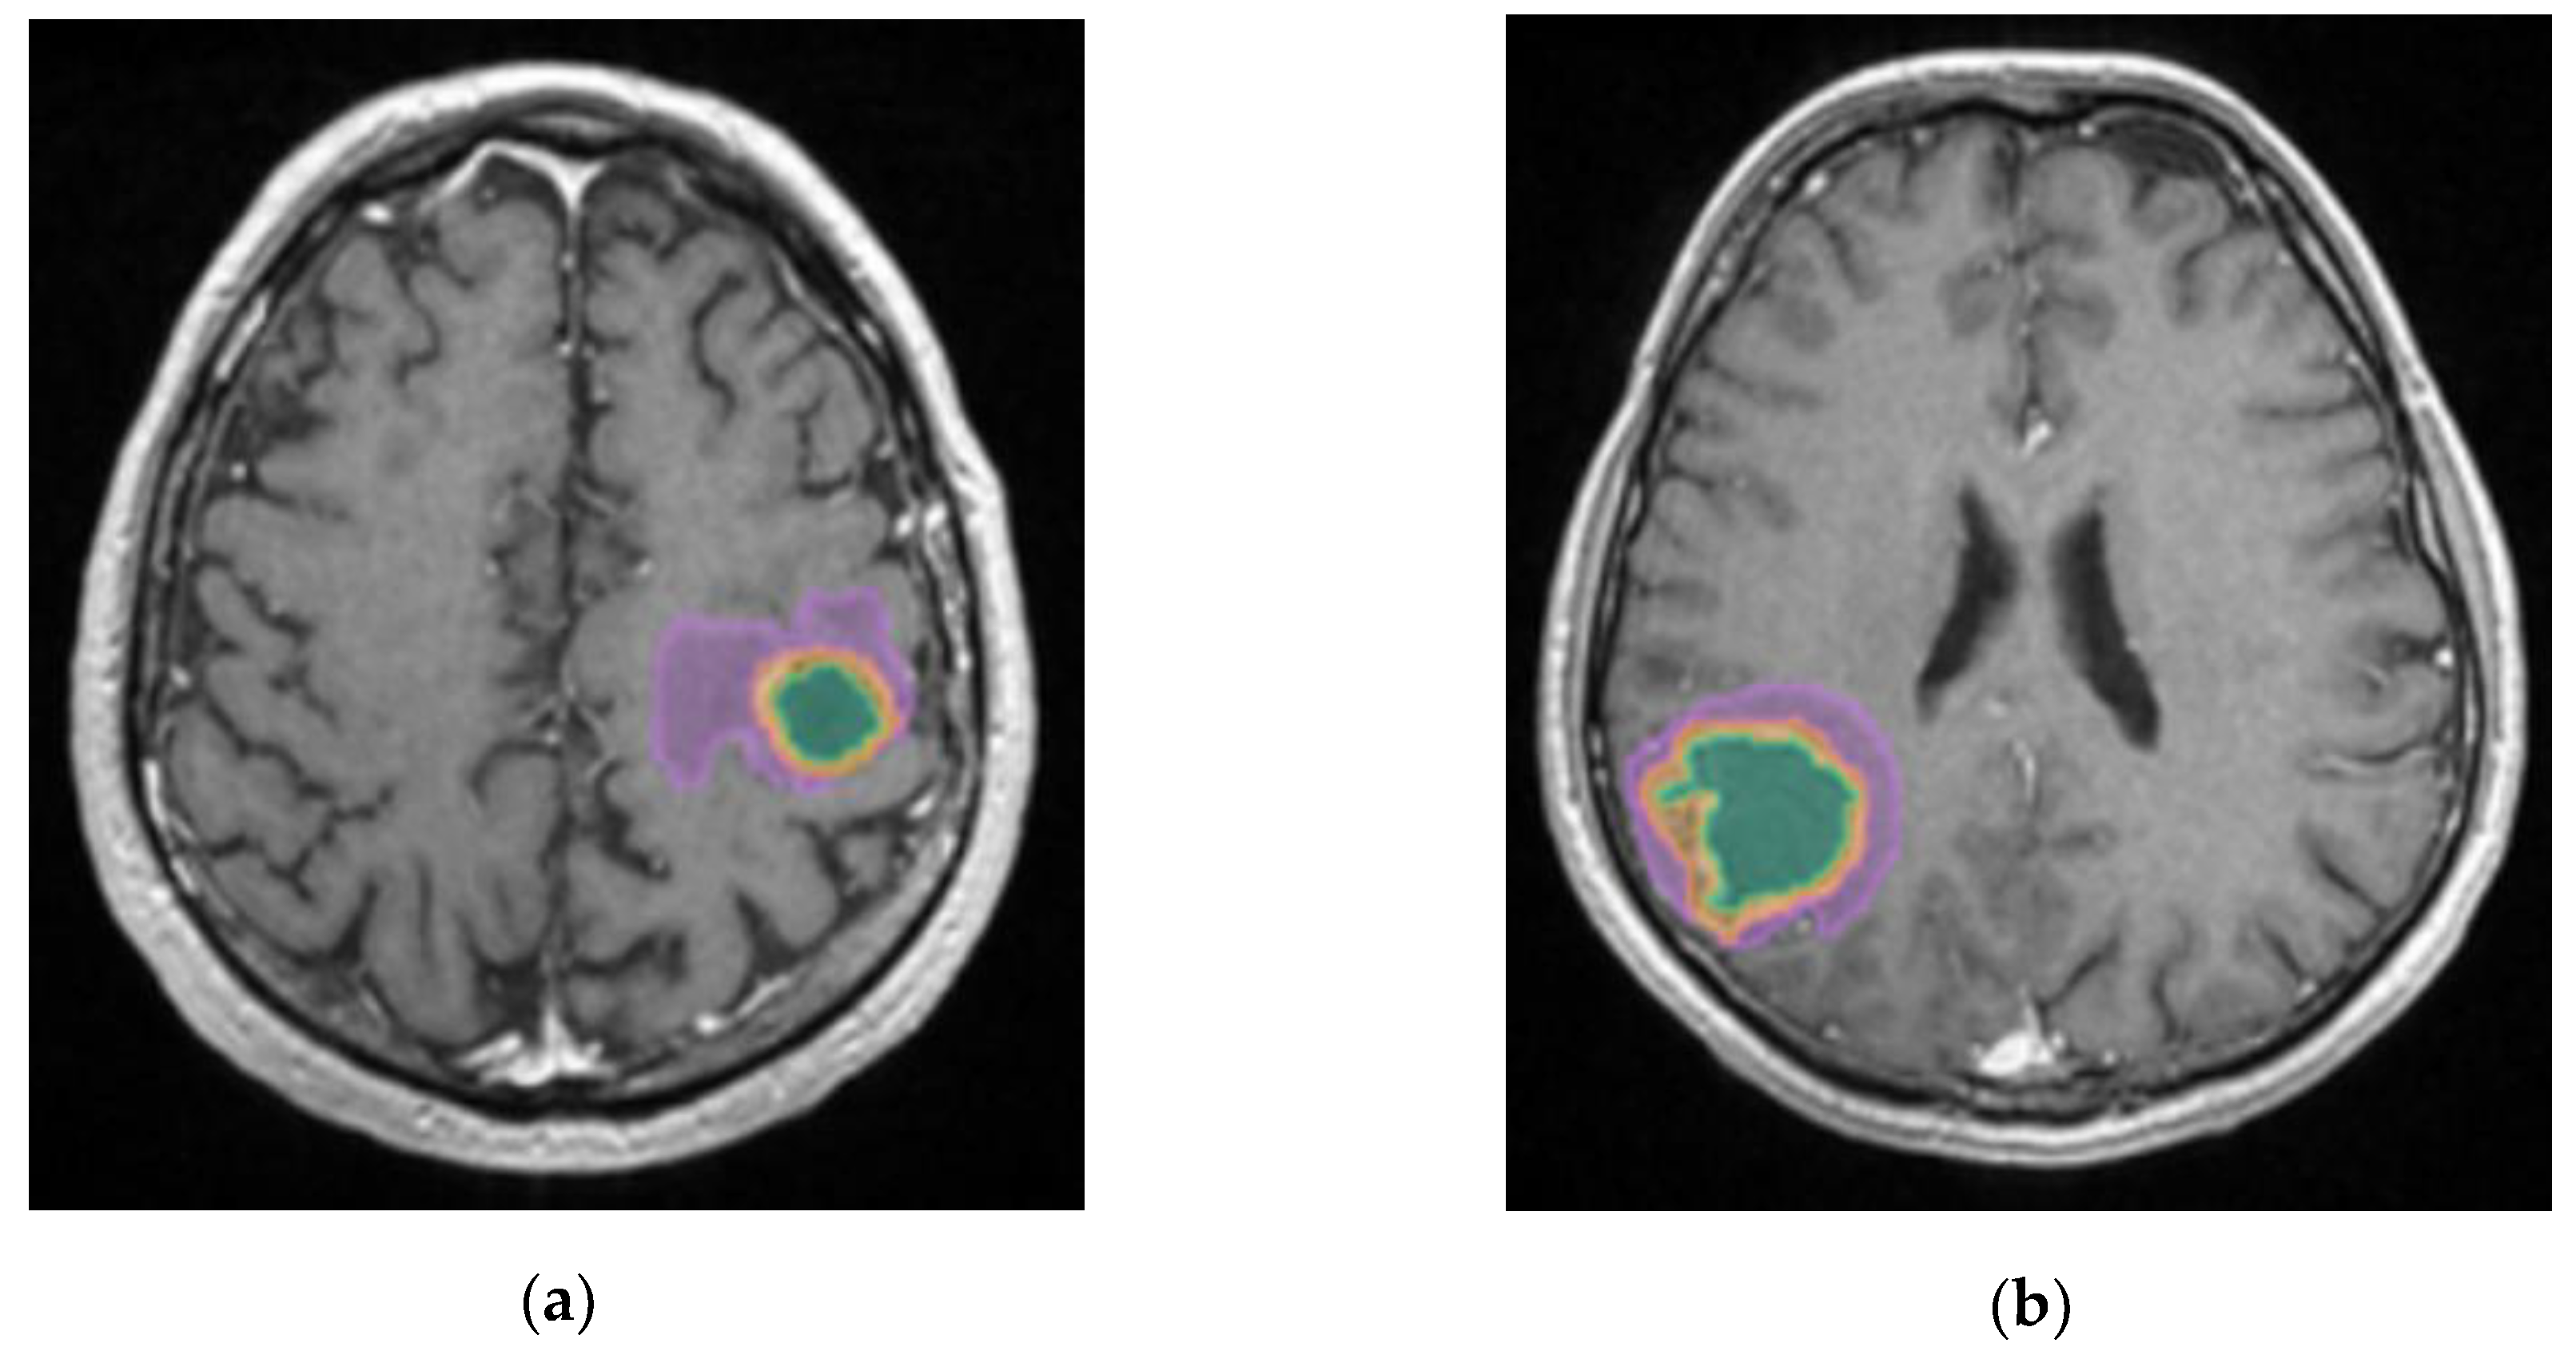

Table 1.
Patients in the two groups – by sex.
| Diagnosis | Women | Men |
|---|---|---|
| Glioblastoma | 11 | 28 |
| Brain metastasis | 13 | 26 |
Table 2.
Type of primary tumor.
| Primary tumor | Number (%) |
|---|---|
| Lung cancer (61.53%) | 21 (NSCLC*) (53.84%) |
| 1 (SCLC**) (2.56%) | |
| 2 (anaplastic) (5.12%) | |
| Breast cancer | 7 (17.94%) |
| Melanoma | 3 (7.69%) |
| Colorectal | 2 (5.12%) |
| Digestive (other sites) | 2 (5.12%) |
| Renal | 1 (2.56%) |
* non-small cell lung carcinoma; **small cell lung carcinoma.
Disclaimer/Publisher’s Note: The statements, opinions and data contained in all publications are solely those of the individual author(s) and contributor(s) and not of MDPI and/or the editor(s). MDPI and/or the editor(s) disclaim responsibility for any injury to people or property resulting from any ideas, methods, instructions or products referred to in the content. |
© 2025 by the authors. Licensee MDPI, Basel, Switzerland. This article is an open access article distributed under the terms and conditions of the Creative Commons Attribution (CC BY) license (http://creativecommons.org/licenses/by/4.0/).
Copyright: This open access article is published under a Creative Commons CC BY 4.0 license, which permit the free download, distribution, and reuse, provided that the author and preprint are cited in any reuse.


