

Submitted:
02 August 2025
Posted:
05 August 2025
You are already at the latest version
Abstract
Data-poor areas usually have difficulties in meeting the multiple predictor variables requirement of building appropriate multivariate machine learning (ML) regression models with contemporary radar (all-weather) satellites observations of Earth’s surface phenomena (ESP). In this regard, univariate ML autoregressive integrated moving average (ARIMA) models built with such satellite observations have a relative advantage. However, our knowledge of the accuracy of traditional variants of ESP forecasts (Forecast, Lo 95, and Hi 95) by auto-determined best ARIMA models; and the forecasts accuracy optimisation when such models are built with relatively sparse time series satellite data is still limited. Experimental approach was leveraged to exploit three sets (36, 48, and 60 monthly epochs) of relatively sparse sea surface salinity (SSS) datasets from the Soil Moisture Active Passive Mission (SMAP) satellite products (Jan. 2016-Dec. 2021) as a case study. The optimised SSS forecasts (Hybrid of the traditional variants) shows RMSE of 0.3133 to 0.7813 psu; and the validation shows MAPE of 0.6773 to 1.3643% respectively. This implies that the innovative “Hybrid” variant consistently optimised the SSS forecasts accuracy (MAPE) of each of the traditional variants across the three different levels of the temporal data sparsity by about 14.97-81.54%. This suggests that relatively accurate traditional variants of ESP forecasts by such ARIMA models can be reasonably and significantly optimised to better model future variations in any ESP at any geographical location.
Keywords:
Earth’s surface phenomenon
; sea surface salinity
; machine learning arima
; variations modelling
; time series
; forecasts optimization
1. Introduction
ESP refer to all the measurable physical, chemical and biological variables involved in the Earth’s (land and water) surface processes in the context of this study. Like SSS and its temperature, ESP are characterized by both spatial and temporal variations. The magnitude and frequency of such variations are usually driven by two or more relevant factors (predictors). Predictors of such ESP are usually characterised by different directions of relationship; and levels of importance in relation to ESP. In the case of variations in SSS on a global spatial scale, evaporation, precipitation (P), and river outflow are among the principal drivers (Dinnat et al., 2019). Changes in SSS on a local spatial scale in the tropics, particularly along the Nigerian coastal zone are influenced by several factors including wind speed (WS), high wind speed (HWS), sea surface temperature (SST), sea level anomaly (SLA) and P. Statistically, only three of these predictors are important in making significant contributions to SSS variability (Ajibola-James, 2023). Variations in ESP, including SSS and SLA may be associated with some risks to humankind and/or the environment. The increasing risks of upstream seawater intrusion due to rising sea level (Zhou, 2011) and/or high tides are associated with socioeconomic, environmental health and human health problems (CGIARCSA, 2016; Trung et al., 2016; Sneath, 2023; Ajibola-James, 2023). Therefore, efficient (relatively proactive, cost-effective, and accurate) modelling and forecasting of the ESP, particularly SSS variations along coastal zones, are crucial for providing useful early warning information for mitigating such risks proactively (before they occur) (Ajibola-James, 2023). A timely effort in this direction is important for realizing the relevant parts of the sustainable development goals (SDGs) 2 (No hunger), 3 (Good health and well-being), 6 (Clean water and sanitation) and 14-sub (Stocktaking, partnership and solution) (UN, 2015).
The traditional approach for the observation of ESP including sea surface salinity (SSS) has been field (in situ) measurements. However, this approach has been limited by its inefficiency in relation to ESP that are usually characterised by large spatial coverage and remoteness. These issues have necessitated the past, existing and ongoing developments in the satellite observation of ESP, which also have their own share of limitations. The predominant optical satellites with multispectral and hyperspectral sensors for the observation of ESP are limited by seasonal cloud cover of dynamically important regions. This singular limitation has been the major motivation for the existing and ongoing developments in the applications of radar (all-weather) satellites datasets for studying some of the ESP, including SSS. For example, three satellites using the same L-band radiometry to measure SSS at approximately 0.2 practical salinity unit (psu) accuracy have been launched. The European Space Agency (ESA) Soil Moisture and Ocean Salinity (SMOS) satellite was launched in 2009 and still in operation till date. The National Aeronautics and Space Administration (NASA) Aquarius was launched in 2011 but no longer in operation. The Soil Moisture Active Passive Mission (SMAP) was launched in 2015 and still in operation till now. In spite of their relatively high temporal resolution (2-3 days), they lack consistent observation of relevant ESP due to technical issues (Reichle, 2015) resulting into data scarcity (Cheng et al., 2020). These make their monthly mean to be more realistic (but not necessarily appropriate) for a relatively long-term study (36 months and above). However, the realistic monthly mean SSS observations by the contemporary satellites are not proactive because such satellite missions are predominantly programmed to offer archived (non-real time) data to end-users. Consequently, such satellite data are unable to provide useful early warning information for monitoring and detecting harmful positive SSS anomalies in downstream coasts before they occur.
Proper integration of such reactive satellite data with appropriate ML methods can significantly elicit their proactive capability. This is essentially because ML is a subset of artificial intelligence (AI), and a method of data analysis that involves building systems (models and algorithms) that can learn from data without being explicitly programmed to identify patterns, and make decisions with minimal human intervention (Ajibola-James, 2023). In relation to ESP, particularly SSS derived from satellite data, ML methods are capable of making useful class prediction (Nguyen et al., 2018; Jiang et al., 2024); and future prediction (Rajabi-Kiasari and Hasanlou, 2020; Ajibola-James, 2023). The methods usually involve trade-offs between ‘flexibility’ and ‘interpretability’, but the latter has been given priority over the former in a study, which suggested that a multivariate ML model, least absolute shrinkage and selection operator (LASSO) regressions has a relatively high interpretability (Chan-Lau, 2017). However, the increasing difficulties in meeting the multiple predictor variables requirement of building such multivariate (data-intensive) ML regression models; and accessing appropriate in situ data for validating such models in data-poor areas (such as tropical coasts including Africa) have been discouraging the exploitation of such ML models for modelling and prediction of ESP, particularly SSS till date. These issues have also limited useful comparative study between such data-intensive ML models and univariate autoregressive (a relatively low data) ML models, particularly ARIMA model in such areas. This is essentially because a small sample size is related to overfitting, which usually inhibits the development of a useful model (Raudys & Jain, 1991; Liu & Gillies, 2016; Zhao et al., 2017; Nguyen et al., 2018; Yu et al., 2025).
The ARIMA model is one of the most widely used methods for time series forecasting. It usually seeks to describe data autocorrelations by providing complementary approaches to a problem. In such a model, the predictors used for forecasting future value(s) consist primarily of lags of the dependent variable (autoregressive, AR terms) and lags of the forecast errors (moving average, MA terms); and secondarily of differencing (l) if non-stationarity problem is involved. The approaches make the model to be effective at fitting past data and forecasting future points in a time series (Kotu & Deshpande, 2019). The applications of the model are based on the Box–Jenkins principle, which consists of three iterative steps, namely, model identification, parameter estimation, and diagnostic checking phases (Box & Jenkins, 1970). A relative advantage of the ARIMA model for time series modelling and prediction is that it does not require additional predictor variable(s) to fit new (predicted) values. Therefore, the costs (in terms of the amount of data input, data processing time, and computer hardware) of implementing the model are relatively low (Ajibola-James, 2023). Additionally, the ARIMA model can produce better results in short-run forecasting when compared to such a relatively complex multivariate model (Meyler et al., 1998). In relation to ESP, particularly SSS such ARIMA models have been predominantly utilized in modelling and forecasting of health, financial and economic data (Renato, 2013; Zhirui & Hongbing, 2018; Nayak & Narayan, 2019; Benvenuto et al., 2020; Khan & Gunwant, 2024; Yu et al., 2025).
Despite the relative advantages of using ML ARIMA for forecasting, our knowledge of its traditional variants of ESP (including SSS) forecasts accuracy; and the accuracy optimisation when built with relatively sparse time series satellite data is still limited, particularly in data-poor areas. Consequently, the objectives of this paper are to (i) determine the accuracy of three relatively sparse SSS models training (36, 48, and 60 monthly epochs) and the forecasts validation (12 monthly epochs) time series datasets; (ii) determine and validate a relatively accurate ML ARIMA model built with each of the three datasets; and (iii) forecast SSS for 12 monthly epochs, validate the forecasts, and optimise the forecasts accuracy.
2. Study Area
The location adopted for this experimental study was the Nigerian coastal zone, which comprises the immediate maritime area (IMA) and the contiguous Exclusive Economic Zone (EEZ) and reaches approximately 200 nautical miles (370 km) offshore of the Nigerian continental shelf; this zone should not extend beyond the limits of approximately 350 nautical miles in accordance with the provisions of Article 76(8) of the 1982 United Nations Convention on the Law of the Sea (UNCLOS) (United Nations, undated). The IMA was established for the purpose of this study. The offset ranged from 58-100 km between the shoreline and the edge of the observation points in the contiguous EEZ (Figure 1). To significantly reduce the effect of the error associated with satellite SSS data acquisitions close to land masses on the data accuracy, as observed by Boutin et al. (2016), the IMA was excluded from the study area. The study area was restricted to 278 data observation points over a geographical area of approximately 6.5° × 4.5° in the contiguous EEZ of approximately 295,027.4 km2 (Figure 1). In the area, the mean monthly rainfall ranges from approximately 28 mm in January to approximately 374 mm in September (Zabbey et al., 2019). Several rivers, including the Niger, Forcados, Nun, Ase, Imo, Warri, Bonny, and Sombreiro Rivers, discharge freshwater to the coastal region of Nigeria. Given the actual evaporation of 1,000 mm per annum, a total runoff of 1,700–2,000 mm, and an additional flow of 50–60 km3 calculated for the water balance of the Niger system, a total of 250 km3 per year eventually discharges into the Gulf of Guinea (Golitzen et al., 2005; Ajibola-James, 2023).
3. Materials and Methods
3.1. Satellite Observations and Map
This study utilized the SMAP satellite SSS and the SSS Uncertainty time series datasets on monthly time scale, which were retrieved from NASA’s SMAP online repository managed by NASA’s Joint Propulsion Laboratory, JPL (JPL, 2020), in network Common Data Form-4 (netCDF-4) file format. The characteristics of the cleaned datasets analysed for the study are presented in Table 1. The base map material utilised for the study area was sourced from Anyikwa & Martinez (2012) and modified as appropriate (Figure 1).
3.2. Data Preparation
The appropriate data preparation tasks (data extraction, cleaning and selection) were implemented using automatic (scripted) procedures prior to the modelling and prediction tasks of the study. The dataset was automatically extracted from the netCDF-4 file into comma-separated Excel (.csv) file by executing a python 3.10.2 script with glob, netCDF4, pandas, numpy and xarray libraries in Spyder IDE (Integrated Development Environment) 5.2.2 software. The data cleaning involved rigorous supervised-automatic deletion of the observation records with null values (redundant empty records that have no relevance to the study area, which might be created in the process of the data file transformation) and outliers induced by radio frequency interference (RFI) and land contamination (LC) in the dataset stored in the .csv file. It was achieved through three consecutive tasks: (a) automatic deletion of null values by executing a python script; (b) visual identification and verification of outliers with Google Earth Pro online; and (c) automatic deletion of the predetermined outliers with a python script. A total of 278 appropriate satellite observation points per epoch, which constitute the study area (Figure 1) were selected for the analysis in this study. This was achieved by executing a python script with appropriate python libraries in the IDE. The points were imported and merged with the base map using the overlay function in ArcMap 10.4.1 (Ajibola-James, 2023). The SSS data (Jan. 2016-Dec. 2021) was partitioned into three datasets characterised by 36, 48, and 60 monthly epochs for models training purpose, and three forecasts validation datasets Jan.-Dec. 2019, Jan.-Dec. 2020, and Jan.-Dec. 2021 respectively (Table 1).
3.3. Data Accuracy
The accuracy (amount of error) of the satellite SSS datasets in terms of RMSD for the modelling and forecasts validation were computed in Microsoft Excel software by using the SSS Uncertainty datasets (the difference between in situ SSS and satellite SSS) (Table 1).
3.4. Autoregressive Integrated Moving Average Model and Algorithm
The study adopted experimental design approach, which utilized the three satellite SSS datasets of 36, 48, and 60 monthly epochs (Table 1) to train three different ML ARIMA models to forecast SSS for 12 months ahead in experiments A, B, and C respectively. The ML ARIMA models and algorithms were built primarily with the forecast library in R 4.3.3/RStudio 2024.04.2 Build 764 software. Other complimentary libraries, such as tseries and MLmetrics, were also used in this process. At the inception of the ML modelling task, each of the dataframes, df, containing 36, 48, and 60 monthly epochs of the SSS data in the experiments A, B, and C respectively was transformed from “function” to “time series” to satisfy one of the basic assumptions of the ARIMA model. The time series datasets were assessed for stationarity utilizing both visual and metric approaches. The former involved the inspection of autocorrelation function (ACF) and partial autocorrelation function (PACF) plot patterns (Fattah et al., 2018; Benvenuto et al., 2020; Hyndman & Athanasopoulos, 2021), while the latter was characterized by hypothesis testing using augmented Dickey-Fuller (ADF) test metrics. The ADF, a relatively credible and commonly used method offers objective metric values for testing time series for stationarity (Cheung & Lai, 1995). Additionally, the Dickey-Fuller (DF) value, also known as the critical value of the ADF test, and its corresponding p-value can easily be interpreted without prejudice to determine the stationarity of time series data (Ajibola-James, 2023). The following hypotheses and assumptions (decision rules) were adopted for the ADF diagnostic test:
H0: No white noise (nonstationary)
H1: White noise (Stationary)
where H0 is the null hypothesis and H1 is the alternative hypothesis; and the decision rule states that if the p value is ≤ 0.05, H0 is rejected to accept H1.
In this regard, in the experiment A, the 36 monthly epochs with a p-value of about 0.6072 (> 0.05) was adjudged to be nonstationary, and the first-order differencing was applied to achieve stationary data with a p-value of about 0.0350 (< 0.05). In the experiment B, the 48 monthly epochs with a p-value of 0.7600 (> 0.05) was also adjudged to be nonstationary, and the first-order differencing was applied but could not achieve stationary data given a p-value of about 0.0603 (>0.05). Consequently, the second-order differencing was applied to achieve stationary data with a p-value of about 0.0100 (< 0.05). In the experiment C, the 60 monthly epochs with a p-value of 0.1769 (> 0.05) was adjudicated to be nonstationary, and the first-order differencing was applied to achieve stationary data with a p-value of about 0.0100 (< 0.05).
Subsequently, the best ARIMA model together with the most appropriate parameters were identified using the auto.arima function, mymodel_train with the training data, Outcome_SSS given by running
mymodel_train <- auto.arima(Outcome_SSS, ic=‘aic’, trace=TRUE, approximation=FALSE) (1)
The function helped to determine the best ARIMA model in each of the experiments based on relevant model evaluation criteria. Generally, the function employs a variant of the Hyndman-Khandakar evaluation methods, which combine unit root testing, Akaike information criterion (AIC) minimization, the Bayesian information criterion (BIC) and maximum likelihood estimation (MLE) to generate ARIMA models (Hyndman & Khandakar, 2008; Hyndman & Athanasopoulos, 2018). However, the most widely used information criteria are AIC and BIC (Rahman & Hasan, 2017; Suleiman & Sani, 2020). Thus, the AIC was adopted to determine the best ARIMA model in each of the three experiments.
The Ljung-Box (Portmanteau) diagnostic test was also performed to assess the residuals of each of the best time series ML ARIMA models for randomness in each experiment based on the following hypotheses and decision rule:
H0: Autocorrelation
H1: No autocorrelation
If the p value is > 0.05, H0 is rejected (Hyndman & Khandakar, 2008).
Having confirmed the stationarity and randomness of the input datasets in (1) in each experiment, it (myforecast_train) was used as input for building the user-defined forecasting model, given by running
where level is the confidence level and h is the number of monthly forecasts.
myforecast_train <- forecast(mymodel_train, level=c(95), h=1*12) (2)
The significance of each term in each of the best ARIMA models in experiments A, B, and C was assessed with a z-test conducted in the R software. The test assumed that a p-value of less or equal to the chosen significant value of 0.05 indicates that the corresponding term is statistically significant. Subsequently, the SSS values were predicted 12 months ahead with (2) using each of the three variants of the best models determined. Three types of SSS forecasts, namely Forecast, Lo 95, and Hi 95 were produced by each of the best models. The graph of the SSS forecasts by each of the models was generated in the Excel software.
3.5. Determination and Validation of ARIMA Model Accuracy for Modelling and Forecasting SSS
The best auto-selected ML ARIMA model built with each of the 36, 48, and 60 monthly epochs that have the most appropriate parameter was determined with the minimum AIC value. Each of the best models was assigned identity (ID) A, B, and C respectively. The accuracy of each of the best ML ARIMA models for modelling variations in SSS was determined with the RMSE and R2 (the amount of variation explained by the ML model). The forecasting accuracy was determined with the RMSE (a measure of accuracy that reveals the magnitude of the difference between the predicted and observed values). The validation of the modelling and forecasting accuracy of each of the best ML models in relation to error estimation, which is also known as residual variation, was also computed in terms of MAPE, a good measure of the absolute percentage difference between predicted and observed values. In general, the greater the R2 value is, the greater the amount of variation explained by the ML model. Conversely, lower values of MAPE and RMSE indicate relatively good model and forecasts accuracy. In terms of the interpretation of the error metrics in real-world applications, the MAPE seems to be the most versatile because it is usually computed in percentage (%) units. In addition, what should be considered an acceptable accuracy level seems to be properly documented for the MAPE. In this regard, a MAPE less than 10% is considered to indicate “high prediction accuracy” (Lewis, 1982; Ajibola-James, 2023).
3.6. Optimisation of the ML ARIMA SSS Forecasts and the Forecasts Accuracy
The three types of the 12-month SSS forecasts values (Forecast, Lo 95, and Hi 95) produced by each of the best 36, 48, and 60 epochs ML ARIMA models were innovatively integrated in the Excel to produce optimised (Hybrid) version of the 12-month SSS forecasts. First, each of the forecasts (Forecast, Lo 95, and Hi 95) monthly record was subtracted from the corresponding satellite observed monthly record. Second, the absolute values of the outputs were generated. Third, the minimum absolute value in each of the corresponding records of Forecast, Lo 95, and Hi 95 was computed to produce a 12-month “Hybrid Index” values, which aided the determination of the appropriate “Hybrid” forecast value for each month in each of the three ML modelling and forecasting scenarios (36, 48, and 60 epochs). Fourth, any of the three types of the SSS forecasts (Forecast, Lo 95, and Hi 95) for each month that produced the minimum value in each corresponding record of the “Hybrid Index” column was selected to populate the new column of 12-month “Hybrid” forecasts.
4. Results and Discussion
4.1. Data Accuracy
The deleted records of the outliers show 80 (22.35%) data points out of the 358 (100%) total data points. The accuracies of the relatively sparse SSS data (36, 48, and 60 monthly epochs) over a geographical area of approximately 6.5° × 4.5° in terms of the RMSD for the models training and forecast validation datasets are presented in Table 2. The six RMSD values show a relatively high level of accuracy exceeding the SMAP missions’ accuracy requirement of 0.2 psu by substantial margins ranging from approximately 36.05% to 47.25% (models training), and 23.60% to 41.90 (forecast validation). It should be noted that relatively high accuracy was achieved by the rigorous supervised automatic data cleaning approach, which primarily involved deletion of the outliers induced by RFI and LC in the satellite dataset. This implies that the data preparation technique can reasonably affect the accuracy of the input datasets for modelling and model’s validation. Additionally, it implies a credible model’s validation datasets.
4.2. Augmented Dickey-Fuller and the Ljung-Box Diagnostic Tests in ML ARIMA Modelling
The result of the ADF diagnostic test in the experiment A (36 monthly epochs) after the first-order differencing was applied shows stationary data with a p-value of about 0.0350 (< 0.05). The result of the ADF test in the experiment B (48 monthly epochs) after the second-order differencing was applied shows stationary data with a p-value of about 0.0100 (< 0.05). The result of the ADF test in the experiment C (60 monthly epochs) after the first-order differencing was applied shows stationary data with a p-value of about 0.0100 (< 0.05). These imply that the three time series datasets significantly satisfied one of the basic assumptions of a typical ARIMA model, “stationarity”. The result of the Ljung-Box tests that used a total of 7 lags with a p-value of 0.1857 (> 0.05) in the experiment A; a total of 10 lags with a p-value of 0.4164 (>0.05) in the experiment B; and a total of 12 lags with a p-value of 0.4522 (>0.05) in the experiment C show that there was no autocorrelation in the data. This implies that the each of the datasets is independently distributed, the residuals are random, and the ARIMA model meets the assumption.
4.3. Determination and Validation of the Best ML ARIMA Model
The results in terms of the best ML ARIMA model that scored the minimum AIC value, the model’s accuracy, its validation parameters, and other relevant information in experiments A, B, and C are detailed in Table 3. The associated plots of the best models and their SSS forecasts are presented in Figure 2. The result of the models’ accuracy shows that the R2, which depicts the amount of variation explained by the models decreased with the number of the monthly epochs of the data used for training and building the models. It also shows that the RMSE, a measure of the models’ errors increased with the number of the monthly epochs of the data used for constructing the models. The result of the models’ accuracy validation shows that the MAPE, a measure of the models’ errors increased with the number of the monthly epochs of the data utilised for the modelling. These imply that the accuracy of the ML ARIMA model built with a relatively sparse satellite data decreases with the number of epochs in the time series. However, the MAPE that ranged from 0.4622% to 0.7779%, which is approximately 12 times less than the 10% benchmark upper limit shows that each of the best ARIMA models has a relatively high modelling accuracy. This imply that a relatively accurate ML ARIMA model can be achieved with less than 50 time series observations, which is of great relevance to data-poor areas. Consequently, data-poor areas with a minimum of 36 time series observations can confidently start their modelling and forecasting projects with such ML ARIMA with a view to updating the model as additional observations are accessible. It should be underscored that the updating of such a ML model built with a relatively parse data from 36 to 48, and further to 60 monthly epochs did not improve its accuracy as one would have expected in a typical machine learning approach. The results of the z-test performed on the terms of each of the best models in the three experiments show a p-value of 0.0000 (< 0.05). This implies that all the terms utilized in building each of the best ARIMA models are statistically significant, and they have meaningful impact on the time series. In the experiment A, the second term in the best model show a drift, a constant term that represents a non-zero mean or a linear trend in the time series after the first-order differencing. The drift essentially allowed the model to account for a persistent upward or downward tendency in the data, beyond what was captured by the AR and MA components. In effect, the drift term included in the experiment A contributed to its relatively high accuracy (Table 3) because it helped the model to capture the trend appropriately.
In Figure 2, the “Training” side shows the result of using the 36, 48, and 60 monthly epochs of the data to train the best ML ARIMA model for modelling variations in the SSS in experiments A, B, and C respectively, while the adjoining “Forecast” side shows the result of 12 monthly epochs of the SSS forecasts in each of the experiments.
4.3. Determination and Validation of Forecasting Accuracy of the Best ARIMA Model
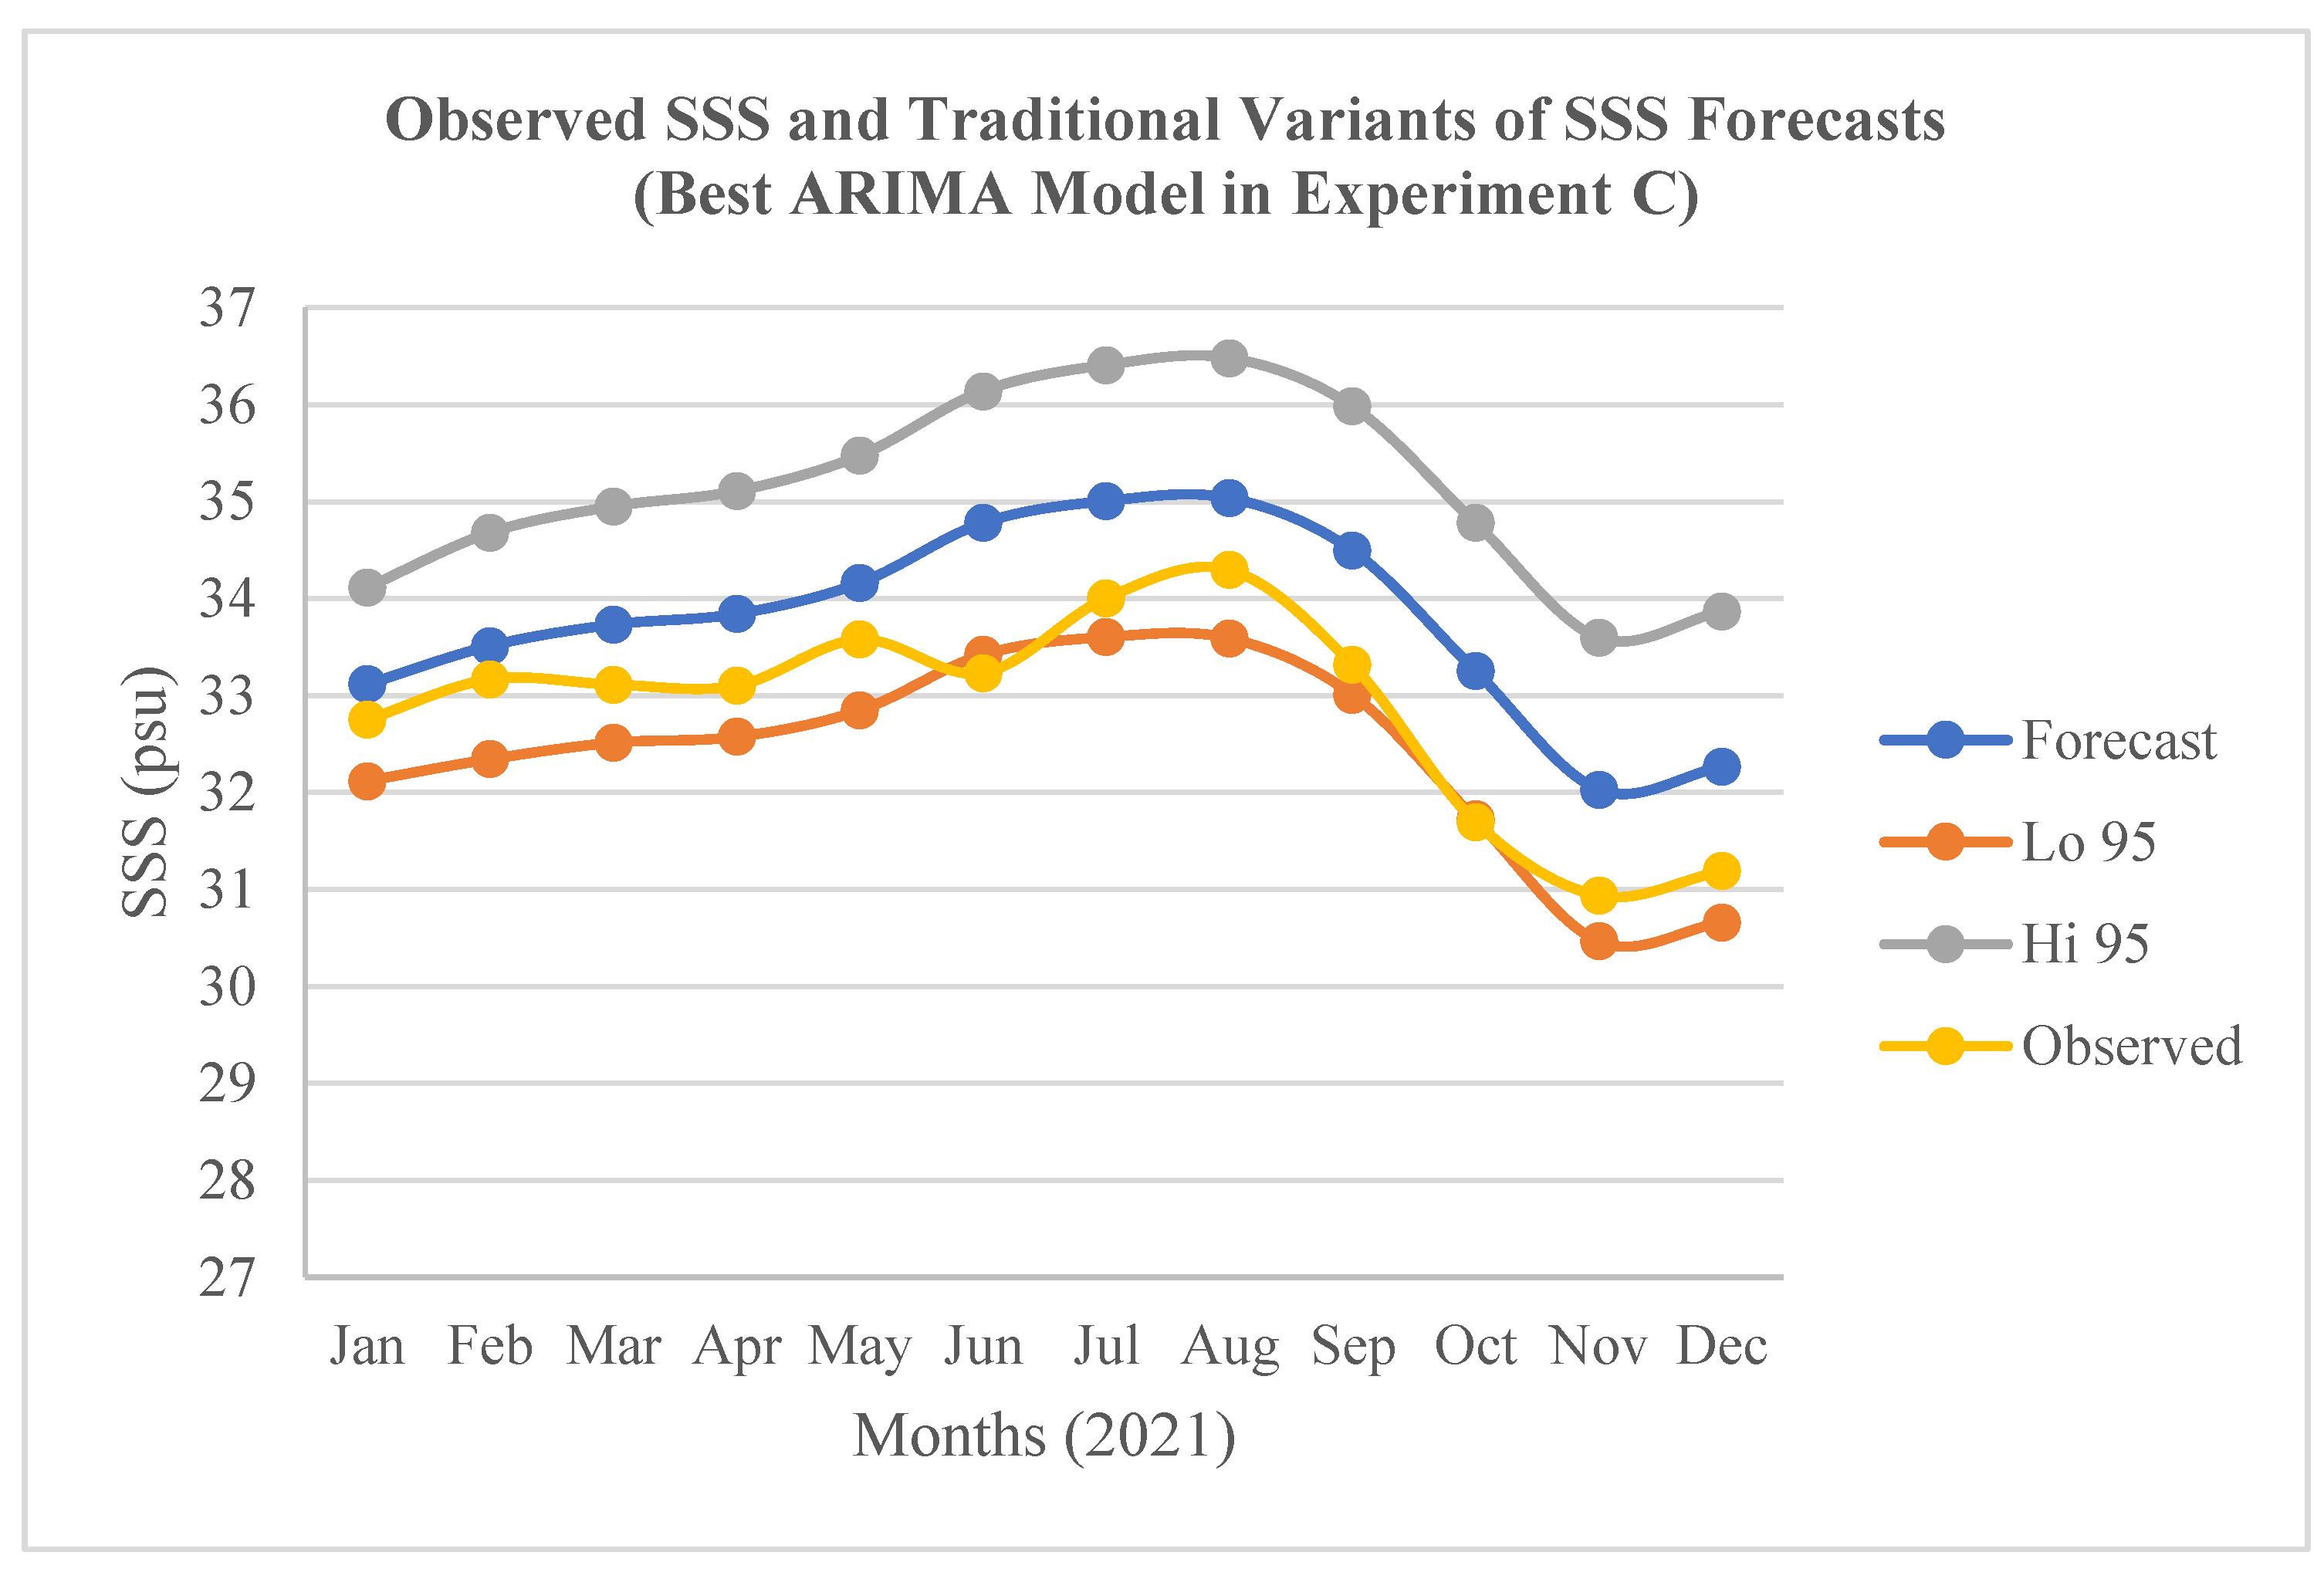
The result of the determination of the accuracy of the traditional variants of the SSS forecasts (Forecast, Lo 95, and Hi 95) in terms of RMSE; and the result of their validation in terms of MAPE for the best models in the experiments A, B, and C are presented in Table 4. In relation to the “Forecast” variant, the best model in A shows the lowest RMSE (0.5810 psu) while the best model in B shows the highest RMSE (1.1156 psu). The former was validated with the lowest MAPE of 1.3613%. Conversely, the 2.0080% scored by the latter did not show the highest MAPE. Instead, the best model in C that did not show the highest RMSE (0.9850 psu) was validated with the highest MAPE of 2.7665%. This implies that the model in C has the highest SSS forecasts errors. The inconsistency can be explained by some inherent weaknesses of RMSE including heavily weighting of outliers; and penalizing of large errors more than small ones particularly in models built with different number observations or different types of datasets. These weaknesses further justify the adoption of MAPE for the validation of SSS forecasts errors in this study. In relation to the “Lo 95” variant, the best model in C shows the lowest RMSE (0.5435 psu) while the best model in B shows the highest RMSE (1.8651 psu) (Table 4; Figure 4). The former was validated with the lowest MAPE of 1.5038%, while the latter was also validated with the highest MAPE of 4.8848%. In relation to the “Hi 95” variant, the best model in A shows the lowest RMSE (0.8919 psu) while the best model in C shows the highest RMSE (2.3283 psu). The former was successfully validated with the lowest MAPE of 2.1323 %, while the latter was also validated with the highest MAPE of 6.9260%. Accordingly, the outcomes of the validations of the three forecasts variants imply that the “Forecast” variant of the SSS forecasts by the best ML ARIMA model built with the 36 monthly epochs in the experiments A characterised by the lowest MAPE (1.3613) is the most accurate in the experimental study (Table 4; Figure 3). The outcomes also imply that the “Hi 95” variant of the SSS forecasts by the best ML ARIMA model built with the 60 monthly epochs in the experiments C, which have the highest MAPE (6.9260) is the least accurate in the experimental study (Table 4; Figure 5).
Figure 3.
Observed SSS and the traditional variants of the SSS forecasts (Jan.-Dec. 2019) by the best ARIMA model in Experiment A.
Figure 3.
Observed SSS and the traditional variants of the SSS forecasts (Jan.-Dec. 2019) by the best ARIMA model in Experiment A.
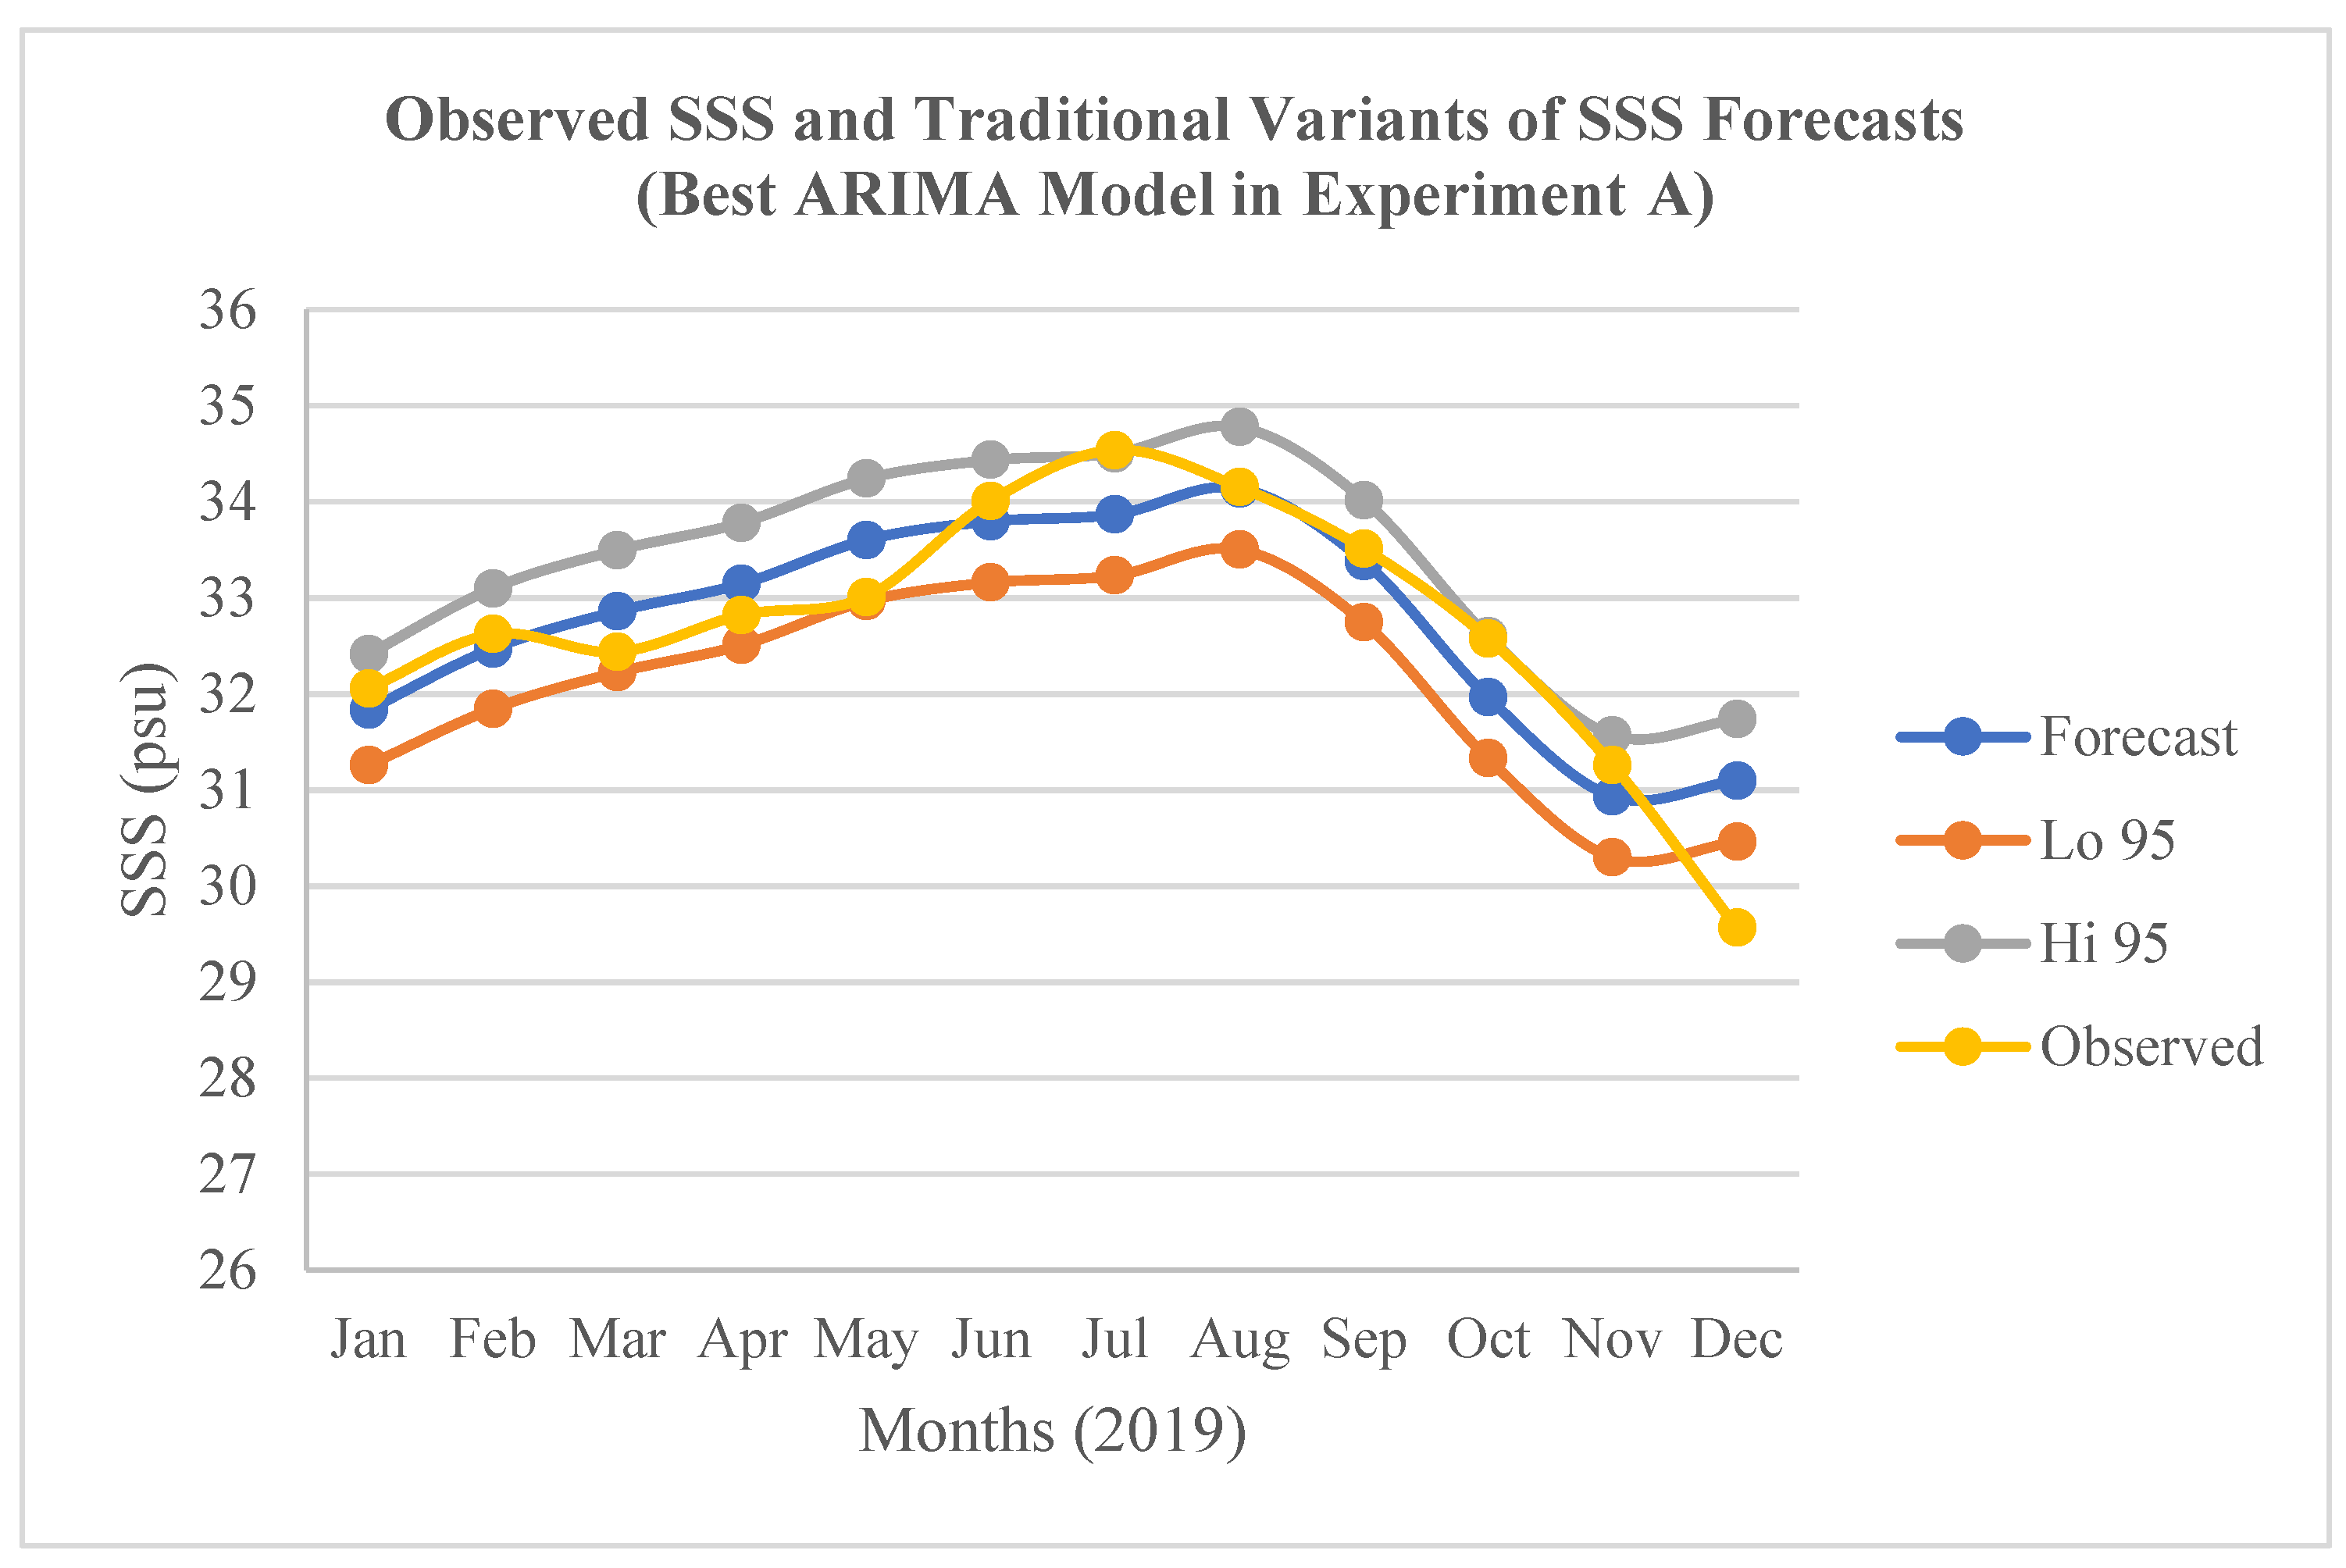
Figure 4.
Observed SSS and the traditional variants of the SSS forecasts (Jan.-Dec. 2020) by the best ARIMA model in Experiment B.
Figure 4.
Observed SSS and the traditional variants of the SSS forecasts (Jan.-Dec. 2020) by the best ARIMA model in Experiment B.
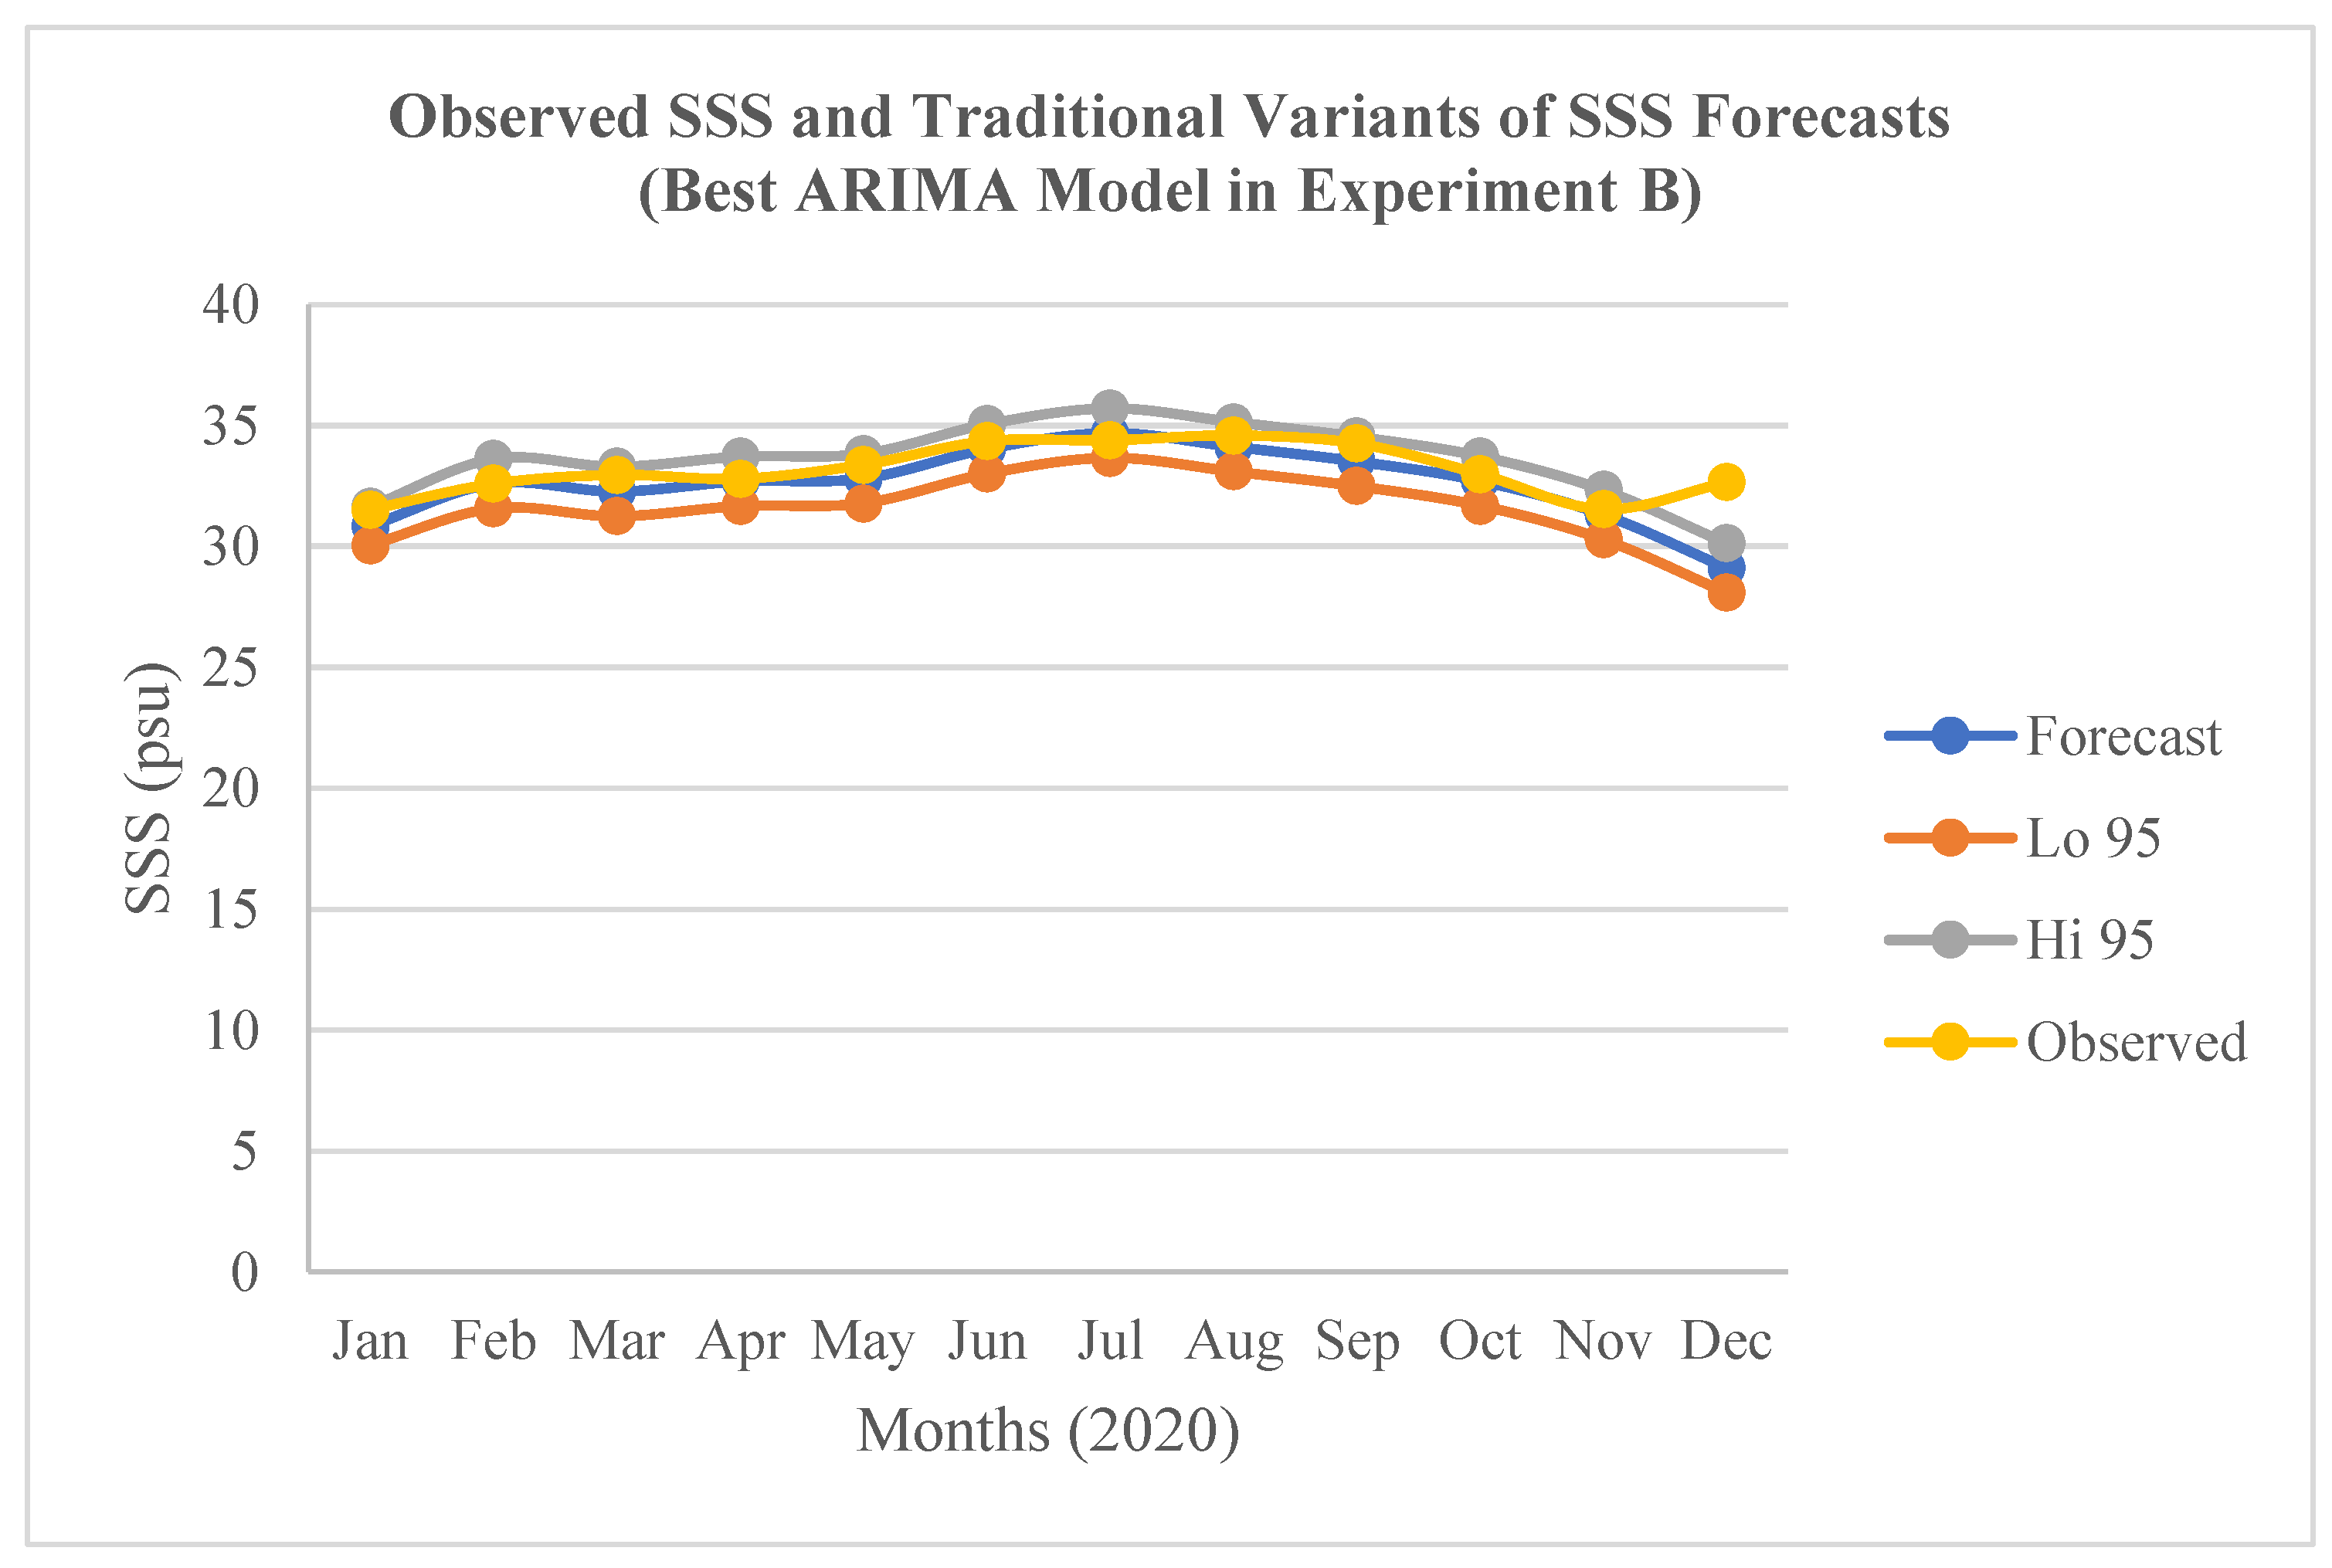
Figure 5.
Observed SSS and the traditional variants of the SSS forecasts (Jan.-Dec. 2021) by the best ARIMA model in Experiment C.
Figure 5.
Observed SSS and the traditional variants of the SSS forecasts (Jan.-Dec. 2021) by the best ARIMA model in Experiment C.
4.4. Optimisation of the ML ARIMA SSS Forecasts and Validation of the Forecasts Accuracy
The results of the optimization of the SSS forecasts (an innovative “Hybrid” variant of the forecasts) in relation to the traditional variants of the SSS forecasts by the best ARIMA models in the experiments A, B, and C are presented in Figure 6, Figure 7, and Figure 8 respectively. In relation to the traditional variants of the forecasts, the three figures apparently show that the “Hybrid” variant produced the closest SSS forecasts to the “Observed” SSS values. This implies that the 12-months ahead “Hybrid” SSS forecasts were more accurate than each of the traditional variants of the SSS forecasts in the three experimental scenarios.
The results of the optimised (Hybrid) SSS forecasts accuracy in terms of RMSE and the accuracy validation in terms MAPE for the best ARIMA models in the experiments A, B, and C are presented in Table 5. In this regard, the best model in A shows the lowest RMSE (0.3133 psu) while the best model in B shows the highest RMSE (0.7813 psu). The former was validated with the lowest MAPE of 0.6773%, while the latter was also validated with the highest MAPE of 1.3643%. In relation to the traditional variants of the SSS forecasts (Forecast, Lo 95, and Hi 95) by the best ARIMA models in the tree experiments (A, B, and C), the “Hybrid” variant shows MAPE values that reduced the SSS forecasts errors by about 50.24-69.95% in A; 32.06-72.07% in B; and 14.97-81.54% in C (Table 6). This implies that the traditional forecasts errors that are associated with utilizing such ML ARIMA models for time series forecasting of ESP can be significantly reduced by about 14.97-81.54% in relation to the optimised (Hybrid) SSS forecasts.
The result of the validation of the accuracy of the optimised (Hybrid) SSS forecasts in relation to the traditional variants of the SSS forecasts (Forecast, Lo 95, and Hi 95) by the best ARIMA models in the tree experiments (A, B, and C) in terms of MAPE metric is presented in Figure 9. The “Hybrid” variant of the SSS forecasts made by the 36 Epochs ARIMA (A) shows the lowest MAPE in relation to the three traditional variants. Similarly, the “Hybrid” variant of the SSS forecasts made by the 48 Epochs ARIMA (B) shows the lowest MAPE in relation to the three traditional variants. Likewise, the “Hybrid” variant of the SSS forecasts made by the 60 Epochs ARIMA (C) shows the lowest MAPE in relation to the three traditional variants. However, the “Hybrid” variant of the SSS forecasts made by the A shows the lowest MAPE in relation to the B, and C. This implies that the traditional forecasts errors that are associated with the ML ARIMA models built with such relatively sparse time series datasets for forecasting ESP can be reasonably minimized by adopting the optimised (Hybrid) SSS forecasts that is proposed and validated in this study. The consistency in the SSS forecasts errors minimization by the “Hybrid” variant when compared with each of the traditional variants across the three different levels of the utilized temporal data sparsity (36, 48, and 60 monthly epochs) implies reliability, and gives further credence to its optimization power irrespective of the data sparsity level.
5. Conclusions
Positive (increased) anomalies in ESP, particularly SSS and SLA in downstream coasts have been associated with some risks to humankind and/or the environment, which have implications for socioeconomic welfare, environmental health and human health. However, the realistic monthly mean SSS observations by the contemporary satellites are unable to provide the much-needed useful early warning information for monitoring and detecting such harmful positive SSS anomalies in downstream coasts before they occur without the integration of appropriate AI/ML methods. In this regard, the study presents some encouraging key findings as subsequently highlighted.
- The RMSD values of the datasets exceeded the SMAP missions’ accuracy requirement of 0.2 psu by substantial margins ranging from about 36.05% to 47.25% (models training), and 23.60% to 41.90 (forecast validation) due to the data preparation approach.
- The traditional variants of the SSS forecasts (Forecast, Lo 95, and Hi 95) by the best ML ARIMA models in the tree experiments (A, B, and C) characterised by MAPEs that range from 1.3613 to 6.9260% (less than 10%) indicate a relatively “high prediction accuracy”.
- This implies that relatively sparse satellite time series datasets ranging from 36 to 60 epochs (hourly, daily, weekly monthly or yearly) can be utilized for building useful ML ARIMA models that can achieve traditional variants of ESP forecasts at a relatively high accuracy.
- The “Hybrid” variant consistently optimised the SSS forecasts accuracy (MAPE) of each of the traditional variants across the three different levels of the temporal data sparsity (36, 48, and 60 monthly epochs) by about 14.97-81.54%.
In effect, the results offer a more reliable decision support tool that can provide useful early warning information for monitoring and detecting harmful positive ESP anomalies at any geographical locations, particularly positive SSS anomalies in downstream coasts before they occur.
6. Recommendations
Considering the relatively high accuracy of the optimised (Hybrid) variant of the SSS forecasts made by the ML ARIMA model; coupled with its relatively low costs of implementation, the following are highly recommended.
- The adoption of the “Hybrid” variant, which consistently optimised the traditional SSS forecasts accuracy for each level of the data sparsity should be highly encourage when using the ML ARIMA for time series forecasting of SSS and other forms of ESP.
- The ML ARIMA model built with the 60 monthly epochs should be updated and adopted by the local stakeholders (particularly government agencies and aquatic entrepreneurs) as a preliminary early warning decision support tools that can enable them to provide proactive information on future risks of positive SSS anomalies to humans and the environment.
Author Contributions
Conceptualization, O.A-J.; methodology, O.A-J.; software, O.A-J.; validation, O.A-J.; formal analysis, O.A-J.; investigation, O.A-J.; resources, O.A-J.; data curation, O.A-J. (data downloaded from JPL repository); writing—original draft preparation, O.A-J.; writing—review and editing, O.A-J. and O.A-J.; visualization, O.A-J.; supervision, O.A-J.; project administration, O.A-J. The author has read and agreed to the published version of the manuscript.
Funding
This research received no external funding.
Informed Consent Statement
Not applicable.
Data Availability Statement
The dataset used was obtained from JPL via https://doi.org/10.5067/SMP50-3TMCS accessed on 10 July 2022.
Conflicts of Interest
The authors declare no conflict of interest.
References
- Ajibola-James, O. Assessment of sea surface salinity variability along Nigerian coastal zone using machine learning–2012-2021. Doctoral thesis, University of Nigeria, Nsukka, Enugu Campus, 2023. [Google Scholar]
- Anyikwa, O. B.; Martinez, N. Continental Shelf Act, 2012. T; he International Maritime Law Institute, IMO, 2012; Available online: https://imli.org/wp-content/uploads/2021/03/Obiora-Bede-Anyikwa.pdf.
- Benvenuto, D.; Giovanetti, M.; Vassallo, L.; Angeletti, S.; Ciccozzi, M. Application of the ARIMA model on the COVID-2019 epidemic dataset. Data in Brief 29 2020. [Google Scholar] [CrossRef] [PubMed]
- Boutin, J.; Chao, Y.; Asher, W. E.; Delcroix, T.; Drucker, R.; Drushka, K.; Kolodziejczyk, N.; Lee, T.; Reul, N.; Reverdin, G.; Schanze, J.; Soloviev, A.; Yu, L.; Anderson, J.; Brucker, L.; Dinnat, E.; Santos-Garcia, A.; Jones, W.; Maes, C.; Meissner, T.; Tang, W.; Vinogradova, N.; Ward, B. Satellite and in situ salinity: understanding near-surface stratification and subfootprint variability. Bulletin of the American Meteorological Society 2016, 97(8), 1391–1407. [Google Scholar] [CrossRef]
- Box, G.E.P.; Jenkins, G. Time series analysis, forecasting and control; San Francisco; Holden-Day, 1970. [Google Scholar]
- CGIAR Research Centers in Southeast Asia. The drought and salinity intrusion in the Mekong River Delta of Vietnam. 2016. Available online: https://cgspace.cgiar.org/rest/bitstreams/78534/retrieve/.
- Chan-Lau, J. A. Lasso Regressions and Forecasting Models in Applied Stress Testing. International Monetary Fund (IMF) Working Paper; WP/17/108, 2017; Available online: https://www.imf.org/~/media/Files/Publications/WP/2017/wp17108.ashx.
- Cheng, L.; Trenberth, K. E.; Gruber, N.; Abraham, J. P.; Fasullo, J. T.; Li, G.; Mann, M. E.; Zhao, X.; Zhu, J. Improved estimates of changes in upper ocean salinity and the hydrological cycle. Journal of Climate 2020, 33(23), 10357–10381. [Google Scholar] [CrossRef]
- Cheung, Y.-W.; Lai, K. S. Lag order and critical values of the Augmented Dickey-Fuller test. Journal of Business & Economic Statistics 1995, 13(3), 277–280. [Google Scholar] [CrossRef]
- Dinnat, E. P.; Le Vine, D. M.; Boutin, J.; Meissner, T.; Lagerloef, G. Remote sensing of sea surface salinity: Comparison of satellite and in situ observations and impact of retrieval parameters. Remote Sensing 2019, 11(7). [Google Scholar] [CrossRef]
- Fattah, J.; Ezzine, L.; Aman, Z.; el Moussami, H.; Lachhab, A. Forecasting of demand using ARIMA model. International Journal of Engineering Business Management 10 2018. [Google Scholar] [CrossRef]
- Golitzen, K. G.; Andersen, I.; Dione, O.; Jarosewich-Holder, M.; Olivry, J. (Eds.) The Niger River Basin: A vision for sustainable management. In World Bank; Washington, DC, 2005. [Google Scholar] [CrossRef]
- Hyndman, R. J.; Khandakar, Y. Automatic time series forecasting: The forecast package for R. Journal of Statistical Software 2008, 27(1), 1–22. [Google Scholar] [CrossRef]
- Hyndman, R.J.; Athanasopoulos, G. Forecasting: Principles and practice, 2nd edition, OTexts. Melbourne, Australia. 2018. Available online: https://otexts.com/fpp2/.
- Hyndman, R.J.; Athanasopoulos, G. Forecasting: Principles and practice, 3rd edition, OTexts. Melbourne, Australia. 2021. Available online: https://otexts.com/fpp3/.
- Jiang, D.; Dong, C.; Ma, Z.; Wang, X.; Lin, K.; Yang, F.; Chen, X. Monitoring saltwater intrusion to estuaries based on UAV and satellite imagery with machine learning models. Remote Sensing of Environment 2024, 308, 114198. [Google Scholar] [CrossRef]
- Joint Propulsion Laboratory. JPL CAP SMAP Sea Surface Salinity Products (PO.DAAC; Version V5.0) [Dataset]; JPL, CA, USA, 2020. [Google Scholar] [CrossRef]
- Khan, I.; Gunwant, D. F. Revealing the future: an ARIMA model analysis for predicting remittance inflows. Journal of Business and Socio-economic Development 2024. [Google Scholar] [CrossRef]
- Kotu, V.; Deshpande, B. Time Series Forecasting. In Data Science; Elsevier, 2019; pp. 395–445. [Google Scholar] [CrossRef]
- Lewis, C. D. Industrial and business forecasting methods: A radical guide to exponential smoothing and curve fitting; London; Butterworth Scientific, 1982. [Google Scholar]
- Liu, R.; Gillies, D. F. Overfitting in linear feature extraction for classification of high-dimensional image data. Pattern Recognition 53 2016, 73–86. [Google Scholar] [CrossRef]
- Meyler, A.; Kenny, G.; Quinn, T. Forecasting Irish inflation using ARIMA models. Technical Paper 3/RT/1998; Central Bank of Ireland Research Department, 1998. [Google Scholar]
- Nayak, MDP.; Narayan, K. Forecasting Dengue Fever Incidence Using ARIMA Analysis. International Journal of Collaborative Research on Internal Medicine & Public Health 2019, 11(3), 924–932. [Google Scholar]
- Nguyen, P. T. B.; Koedsin, W.; McNeil, D.; Van, T. P. D. Remote sensing techniques to predict salinity intrusion: Application for a data-poor area of the coastal Mekong Delta, Vietnam. International Journal of Remote Sensing 2018, 39(20), 6676–6691. [Google Scholar] [CrossRef]
- Rahman, A.; Hasan, M. M. Modelling and forecasting of carbon dioxide emissions in Bangladesh using Autoregressive Integrated Moving Average (ARIMA) Models. Open Journal of Statistics 7 2017, 560 –566. [Google Scholar] [CrossRef]
- Rajabi-Kiasari, S.; Hasanlou, M. An efficient model for the prediction of SMAP sea surface salinity using machine learning approaches in the Persian Gulf. International Journal of Remote Sensing 2020, 41(8), 3221–3242. [Google Scholar] [CrossRef]
- Raudys, S. J.; Jain, A. K. Small sample size effects in statistical pattern recognition: Recommendations for practitioners. IEEE Transactions on Pattern Analysis and Machine Intelligence 1991, 13(3), 252–264. [Google Scholar] [CrossRef]
- Reichle, R. Soil Moisture Active Passive (SMAP) algorithm theoretical basis document level 2 & 3 soil moisture (passive) data products; 2015; pp. 1–82. [Google Scholar]
- Renato; CS. Disease management with ARIMA model in time series. Einstein 2013, 11(1), 128–31. [Google Scholar]
- Sneath, S. Louisiana: New Orleans declares emergency over saltwater intrusion in drinking water. The Guardian. 23 September 2023. Available online: https://www.theguardian.com/us-news/2023/sep/22/louisiana-drought-drinking-water-mississippi-river-saltwater-new-orleans.
- Suleiman, S.; Sani, M. Application of ARIMA and Artificial Neural Networks Models for daily cumulative confirmed Covid-19 prediction in Nigeria. Equity Journal of Science and Technology 2020, 7(2), 83–90. Available online: https://www.equijost.com/fulltext/14-1594712555.pdf?1681453732.
- Trung, N. H.; Hoanh, C. H.; Tuong, T. P.; Hien, X. H.; Tri, L. Q.; Minh, V. Q.; Nhan, D. K.; Vu, P. T.; Tri, V. P. D. Climate Change Affecting Land Use in the Mekong Delta: Adaptation of Rice-Based Cropping Systems (CLUES) Theme 5: Integrated Adaptation Assessment of Bac Lieu Province and Development of Adaptation Master Plan; 2016; Available online: https://www.researchgate.net/publication/301612048_Climate_change_affecting_land_use_in_the_Mekong_Delta_Adaptation_of_rice-based_cropping_systems_CLUES_ISBN_978-1-925436-36-5.
- United Nations. Transforming our world: the 2030 agenda for sustainable development. 2015. Available online: https://sdgs.un.org/2030agenda.
- United Nations. United Nations Convention on the Law of the Sea. n.d. Available online: https://www.un.org/depts/los/convention_agreements/texts/unclos/unclos_e.pdf.
- Yu, W.; Cheng, X.; Jiang, M. Exploitation of ARIMA and annual variations model for SAR interferometry over permafrost scenarios. IEEE Journal 2025, 1–16. [Google Scholar] [CrossRef]
- Zabbey, N.; Giadom, F. D.; Babatunde, B. B. Sheppard, C., Ed.; Nigerian coastal environments. In An environmental evaluation; Elsevier; World Seas, 2019; pp. 835–854. [Google Scholar] [CrossRef]
- Zhao, J.; Temimi, M.; Ghedira, H. Remotely sensed sea surface salinity in the hypersaline Arabian Gulf: Application to landsat 8 OLI data. Estuarine, Coastal and Shelf Science 187 2017, 168–177. [Google Scholar] [CrossRef]
- Zhirui, H.; Hongbing, T. Epidemiology and ARIMA model of positive-rate of influenza viruses among children in Wuhan, China: A nine-year retrospective study. International Journal of Infectious Diseases 2018, 7(4), 61–70. [Google Scholar]
Figure 1.
Map of the study area showing the 278 points (in red) of SMAP satellite SSS data observations (Jan. 2016-Dec. 2021). Source: Anyikwa & Martinez (2012) and Modification: Author (2025).
Figure 1.
Map of the study area showing the 278 points (in red) of SMAP satellite SSS data observations (Jan. 2016-Dec. 2021). Source: Anyikwa & Martinez (2012) and Modification: Author (2025).
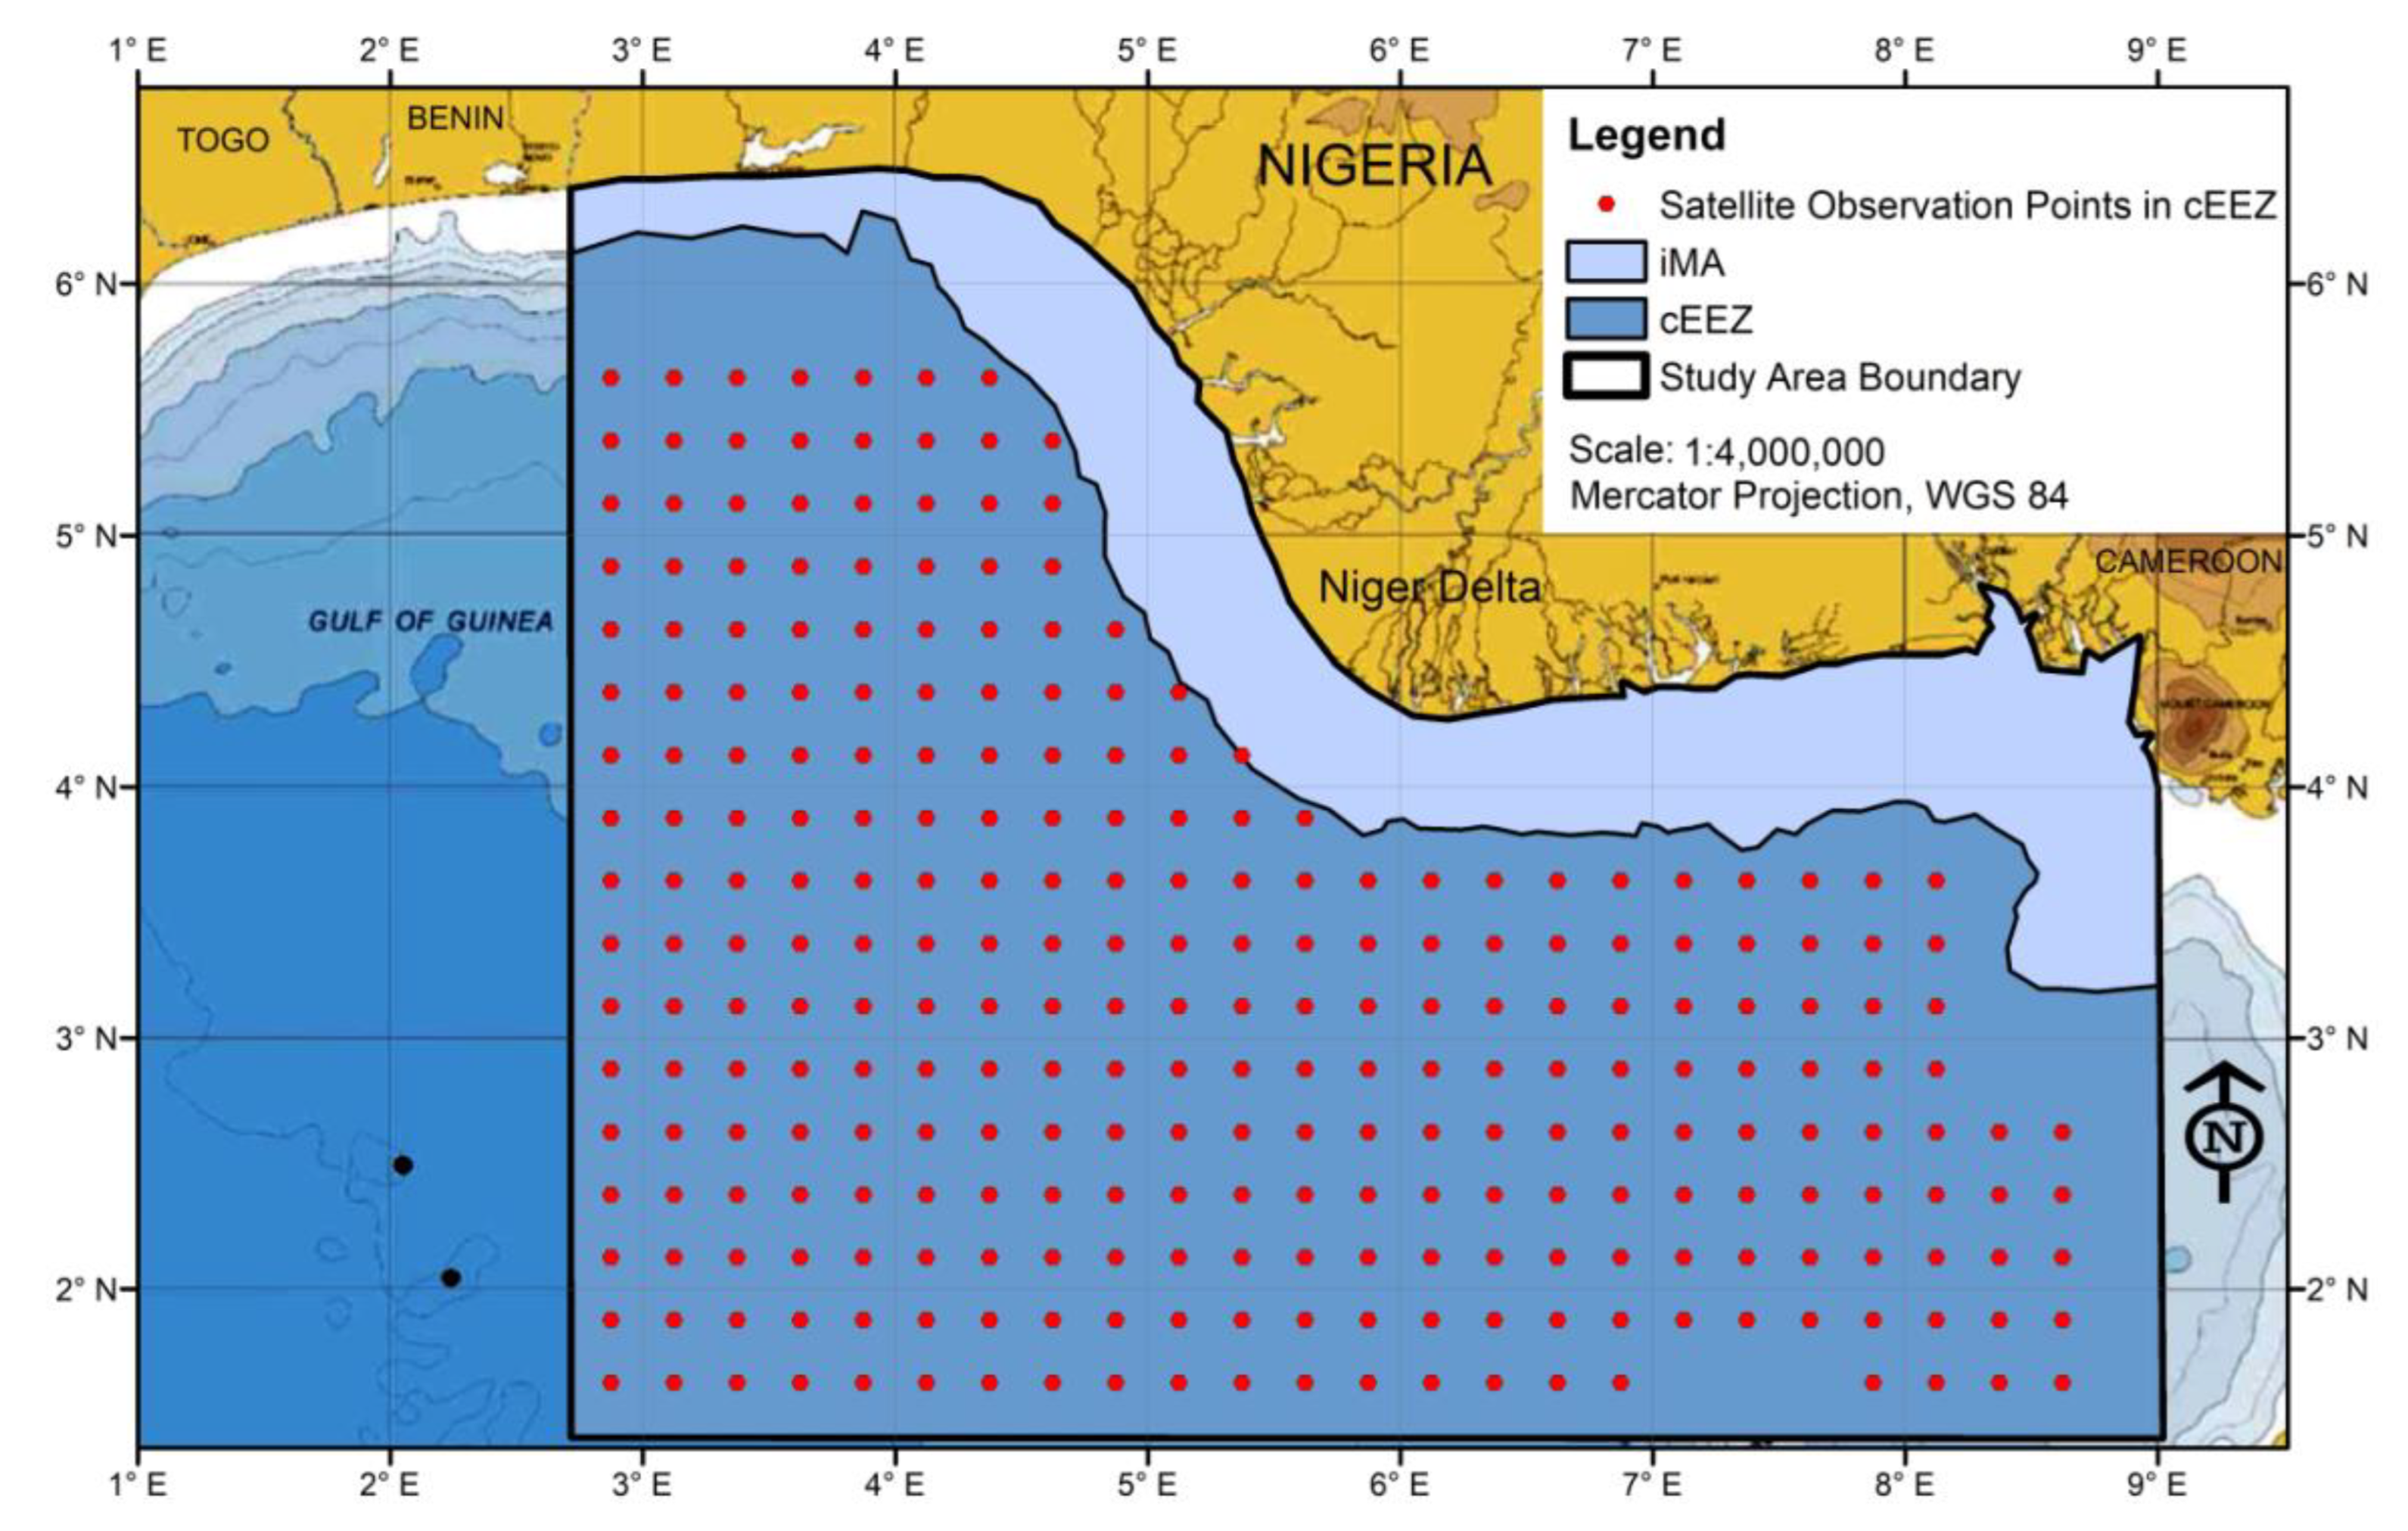
Figure 2.
Modelling and forecasting of SSS variations using the best ML ARIMA model.
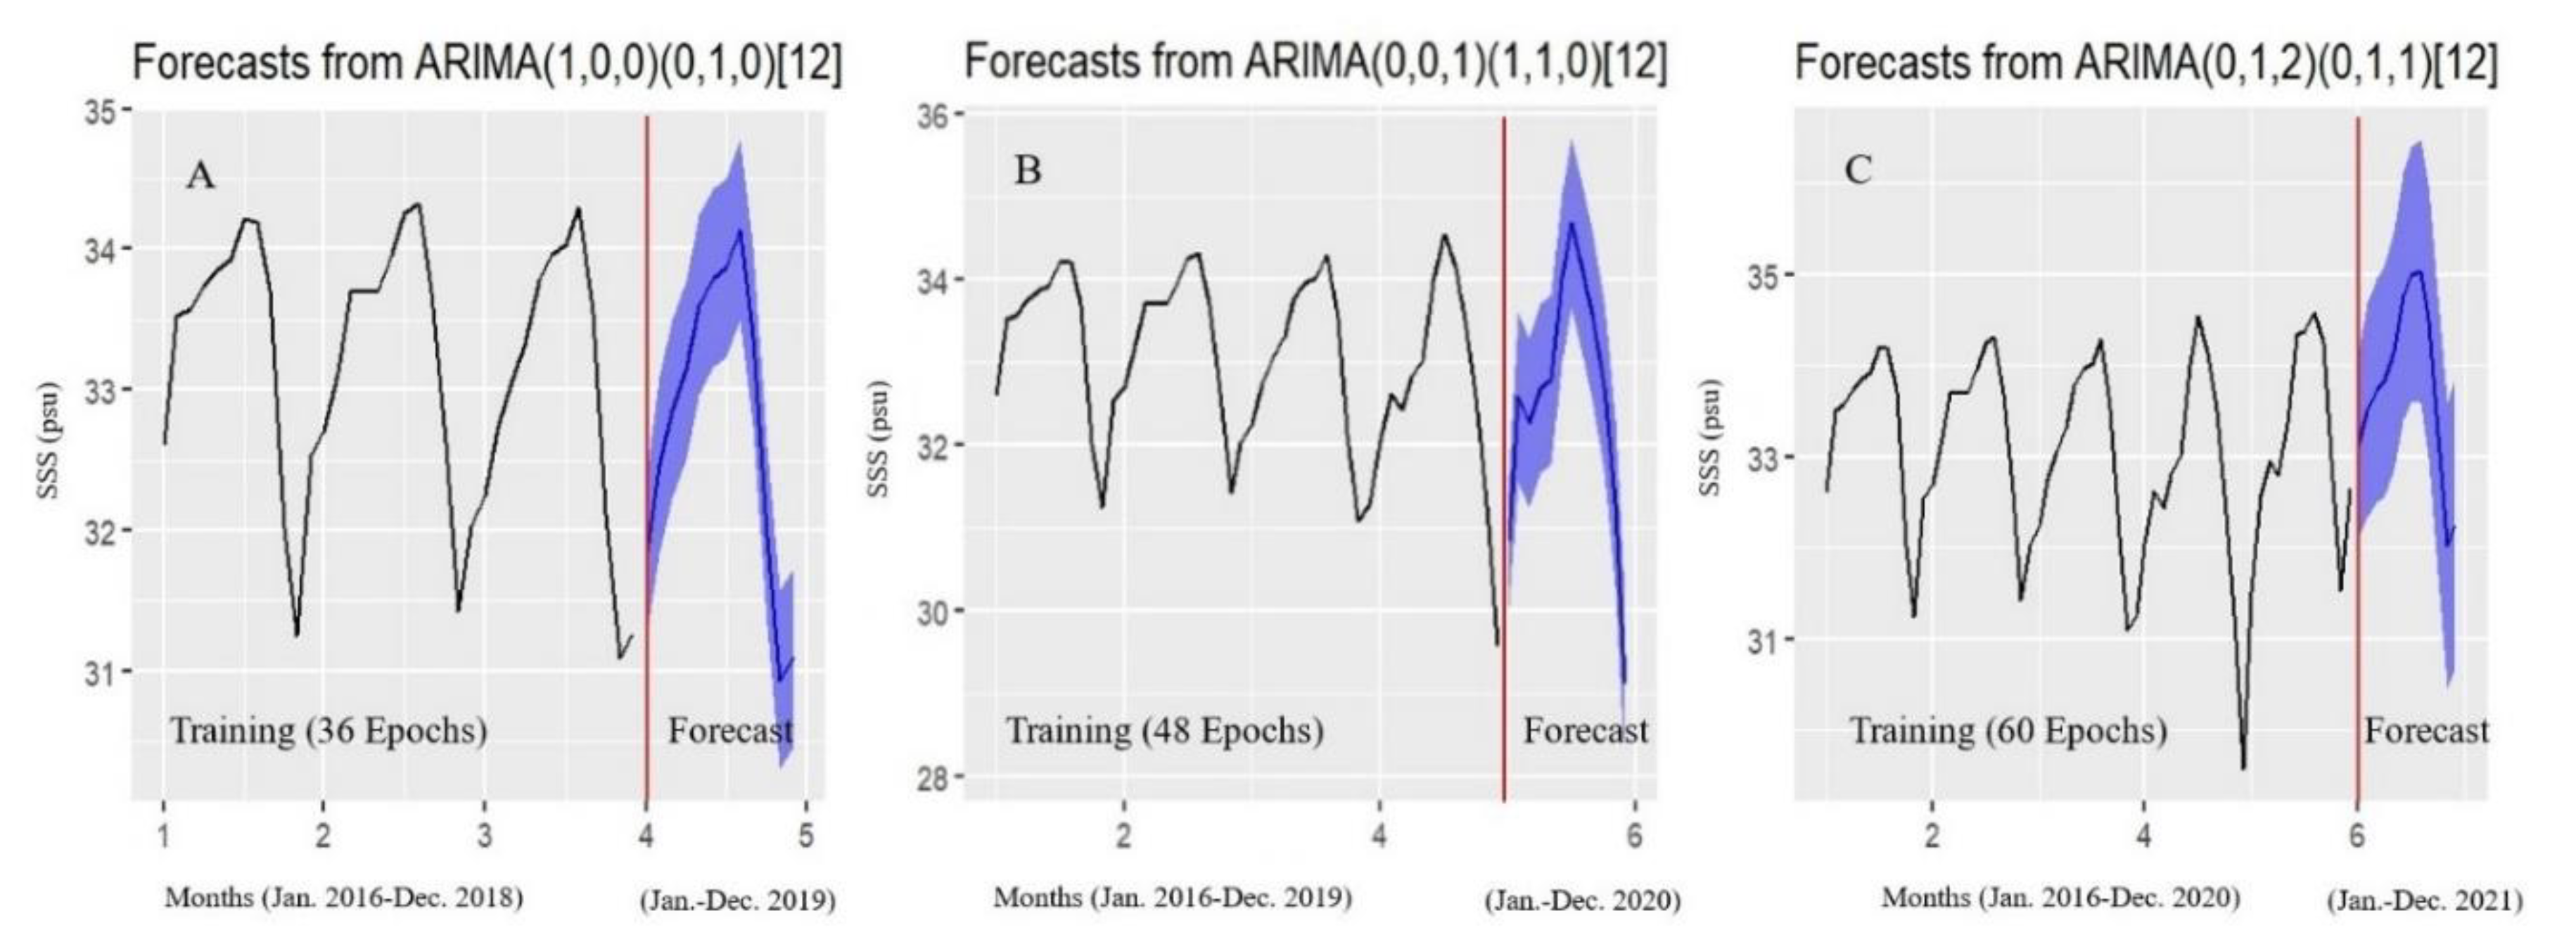
Figure 6.
Observed SSS, the traditional variants and hybrid of the SSS forecasts (Jan.-Dec. 2019) by the best ARIMA model in Experiment A.
Figure 6.
Observed SSS, the traditional variants and hybrid of the SSS forecasts (Jan.-Dec. 2019) by the best ARIMA model in Experiment A.
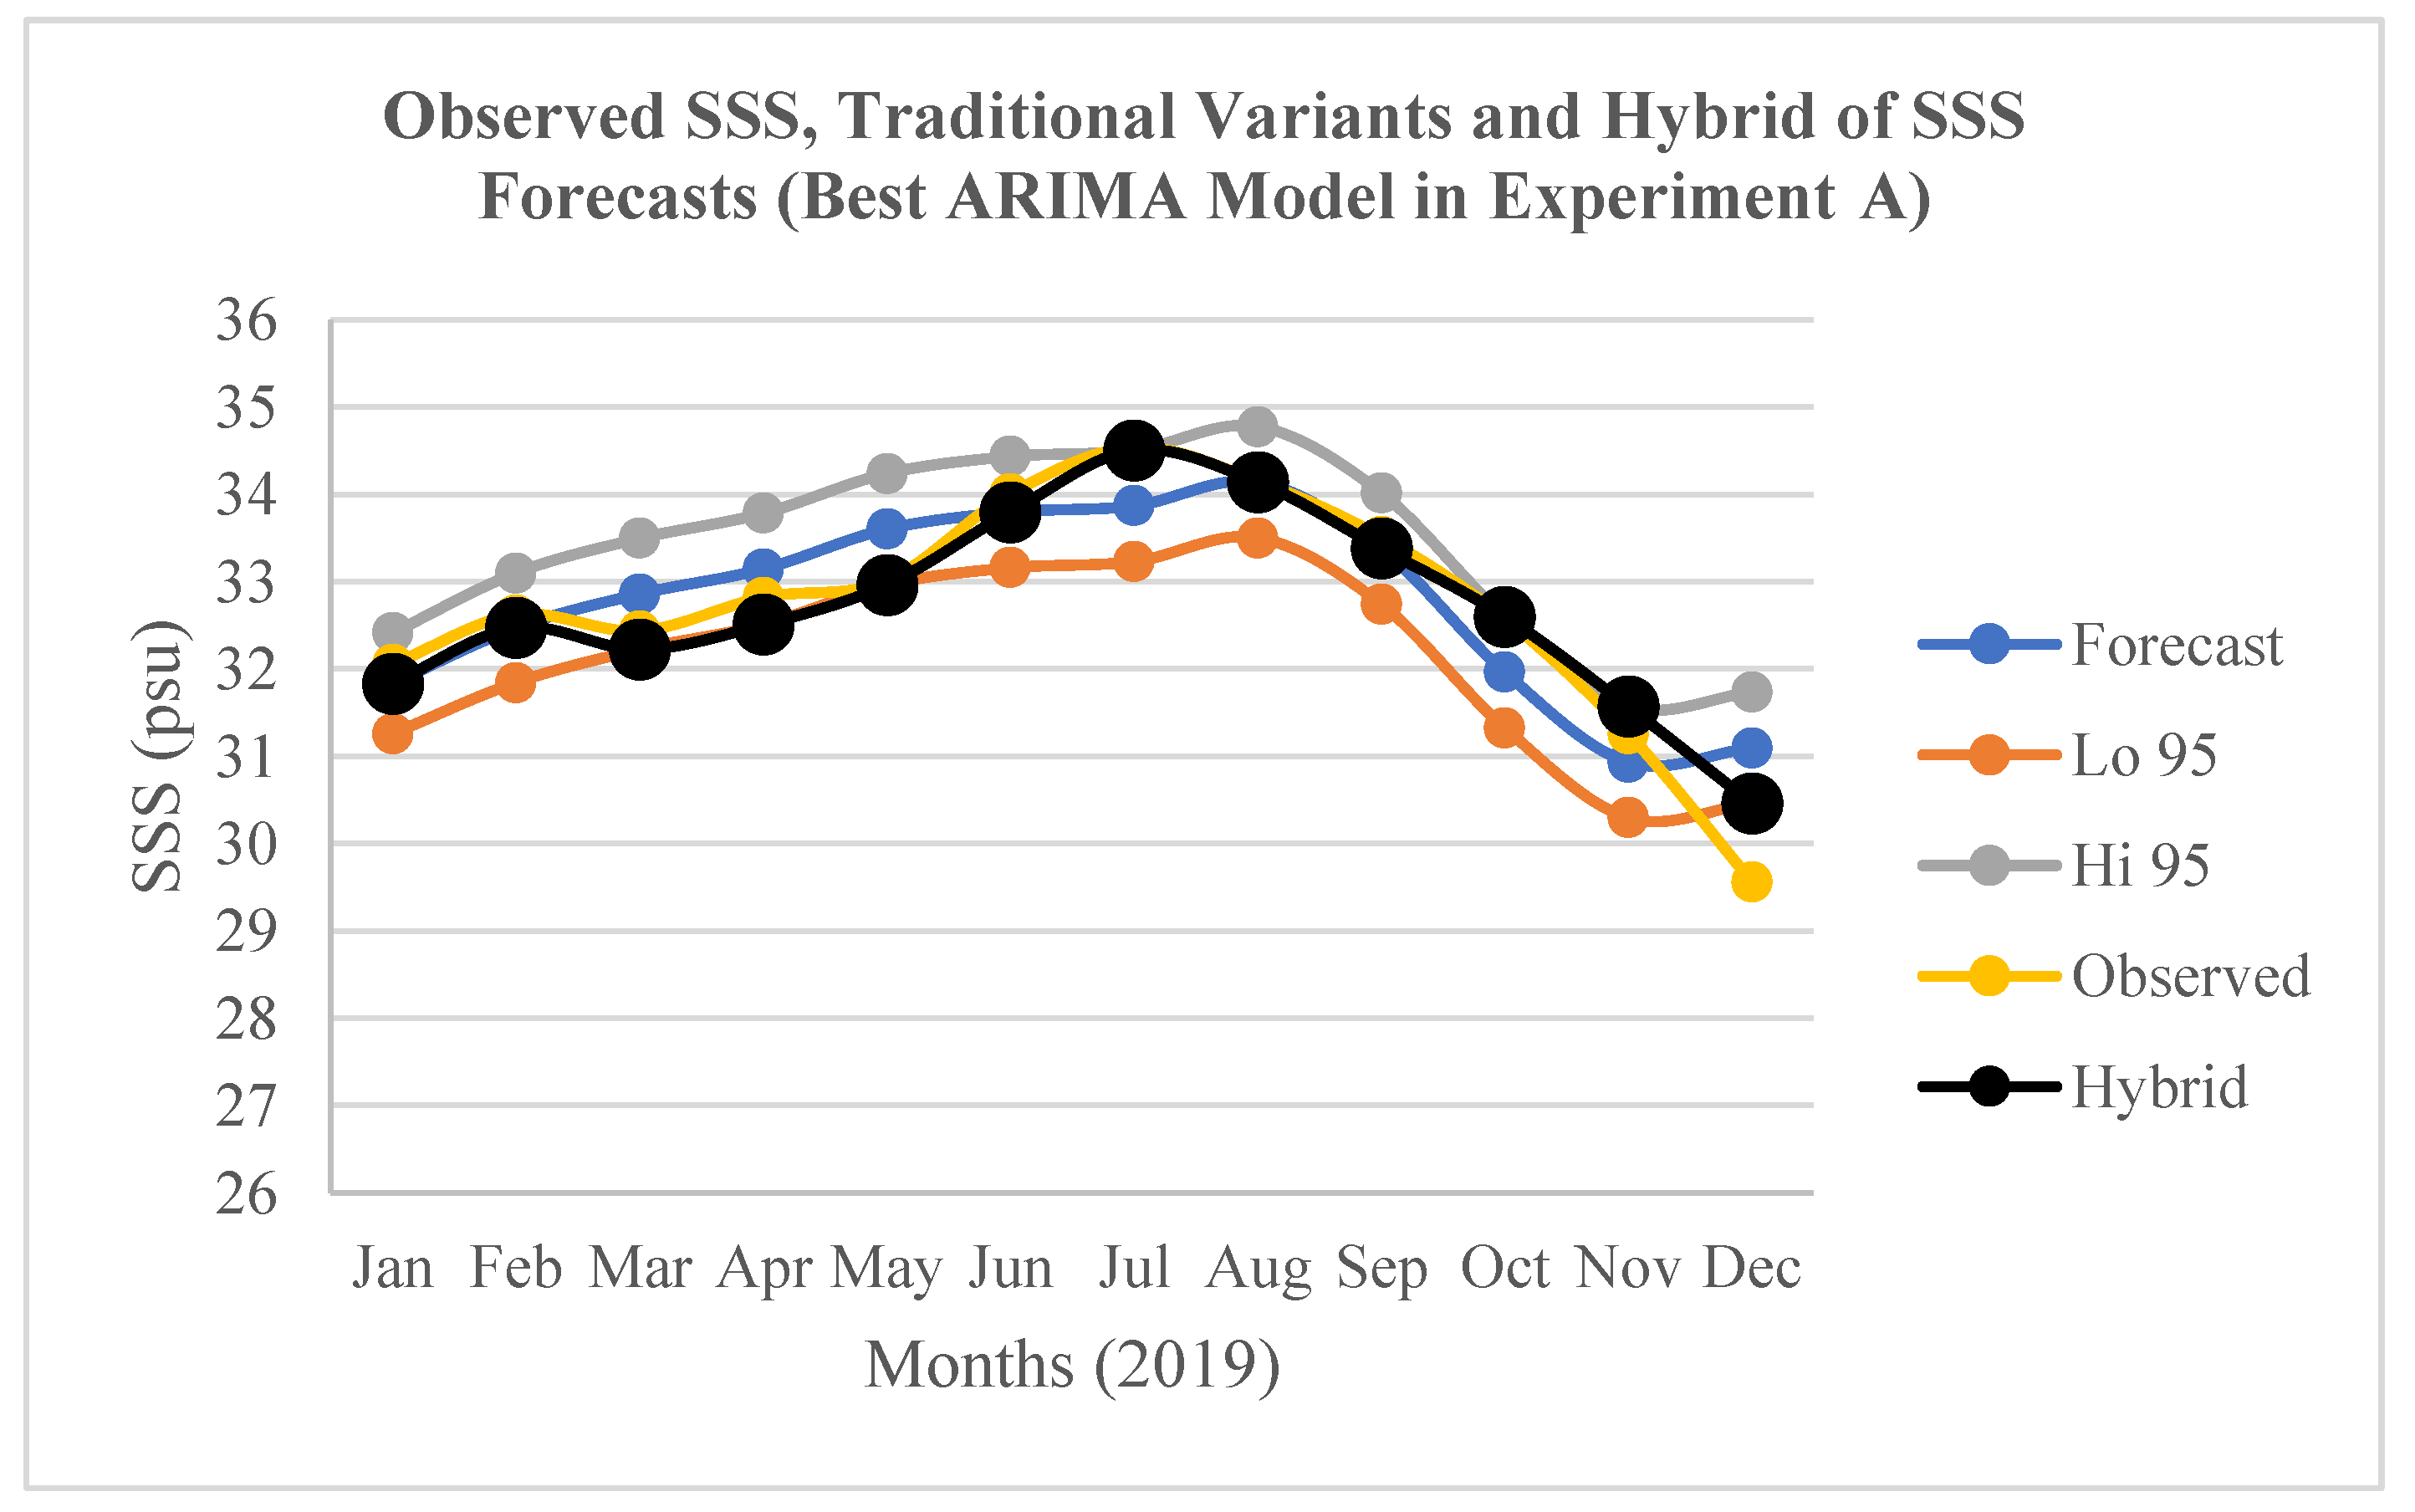
Figure 7.
Observed SSS, the traditional variants and hybrid of the SSS forecasts (Jan.-Dec. 2020) by the best ARIMA model in Experiment B.
Figure 7.
Observed SSS, the traditional variants and hybrid of the SSS forecasts (Jan.-Dec. 2020) by the best ARIMA model in Experiment B.
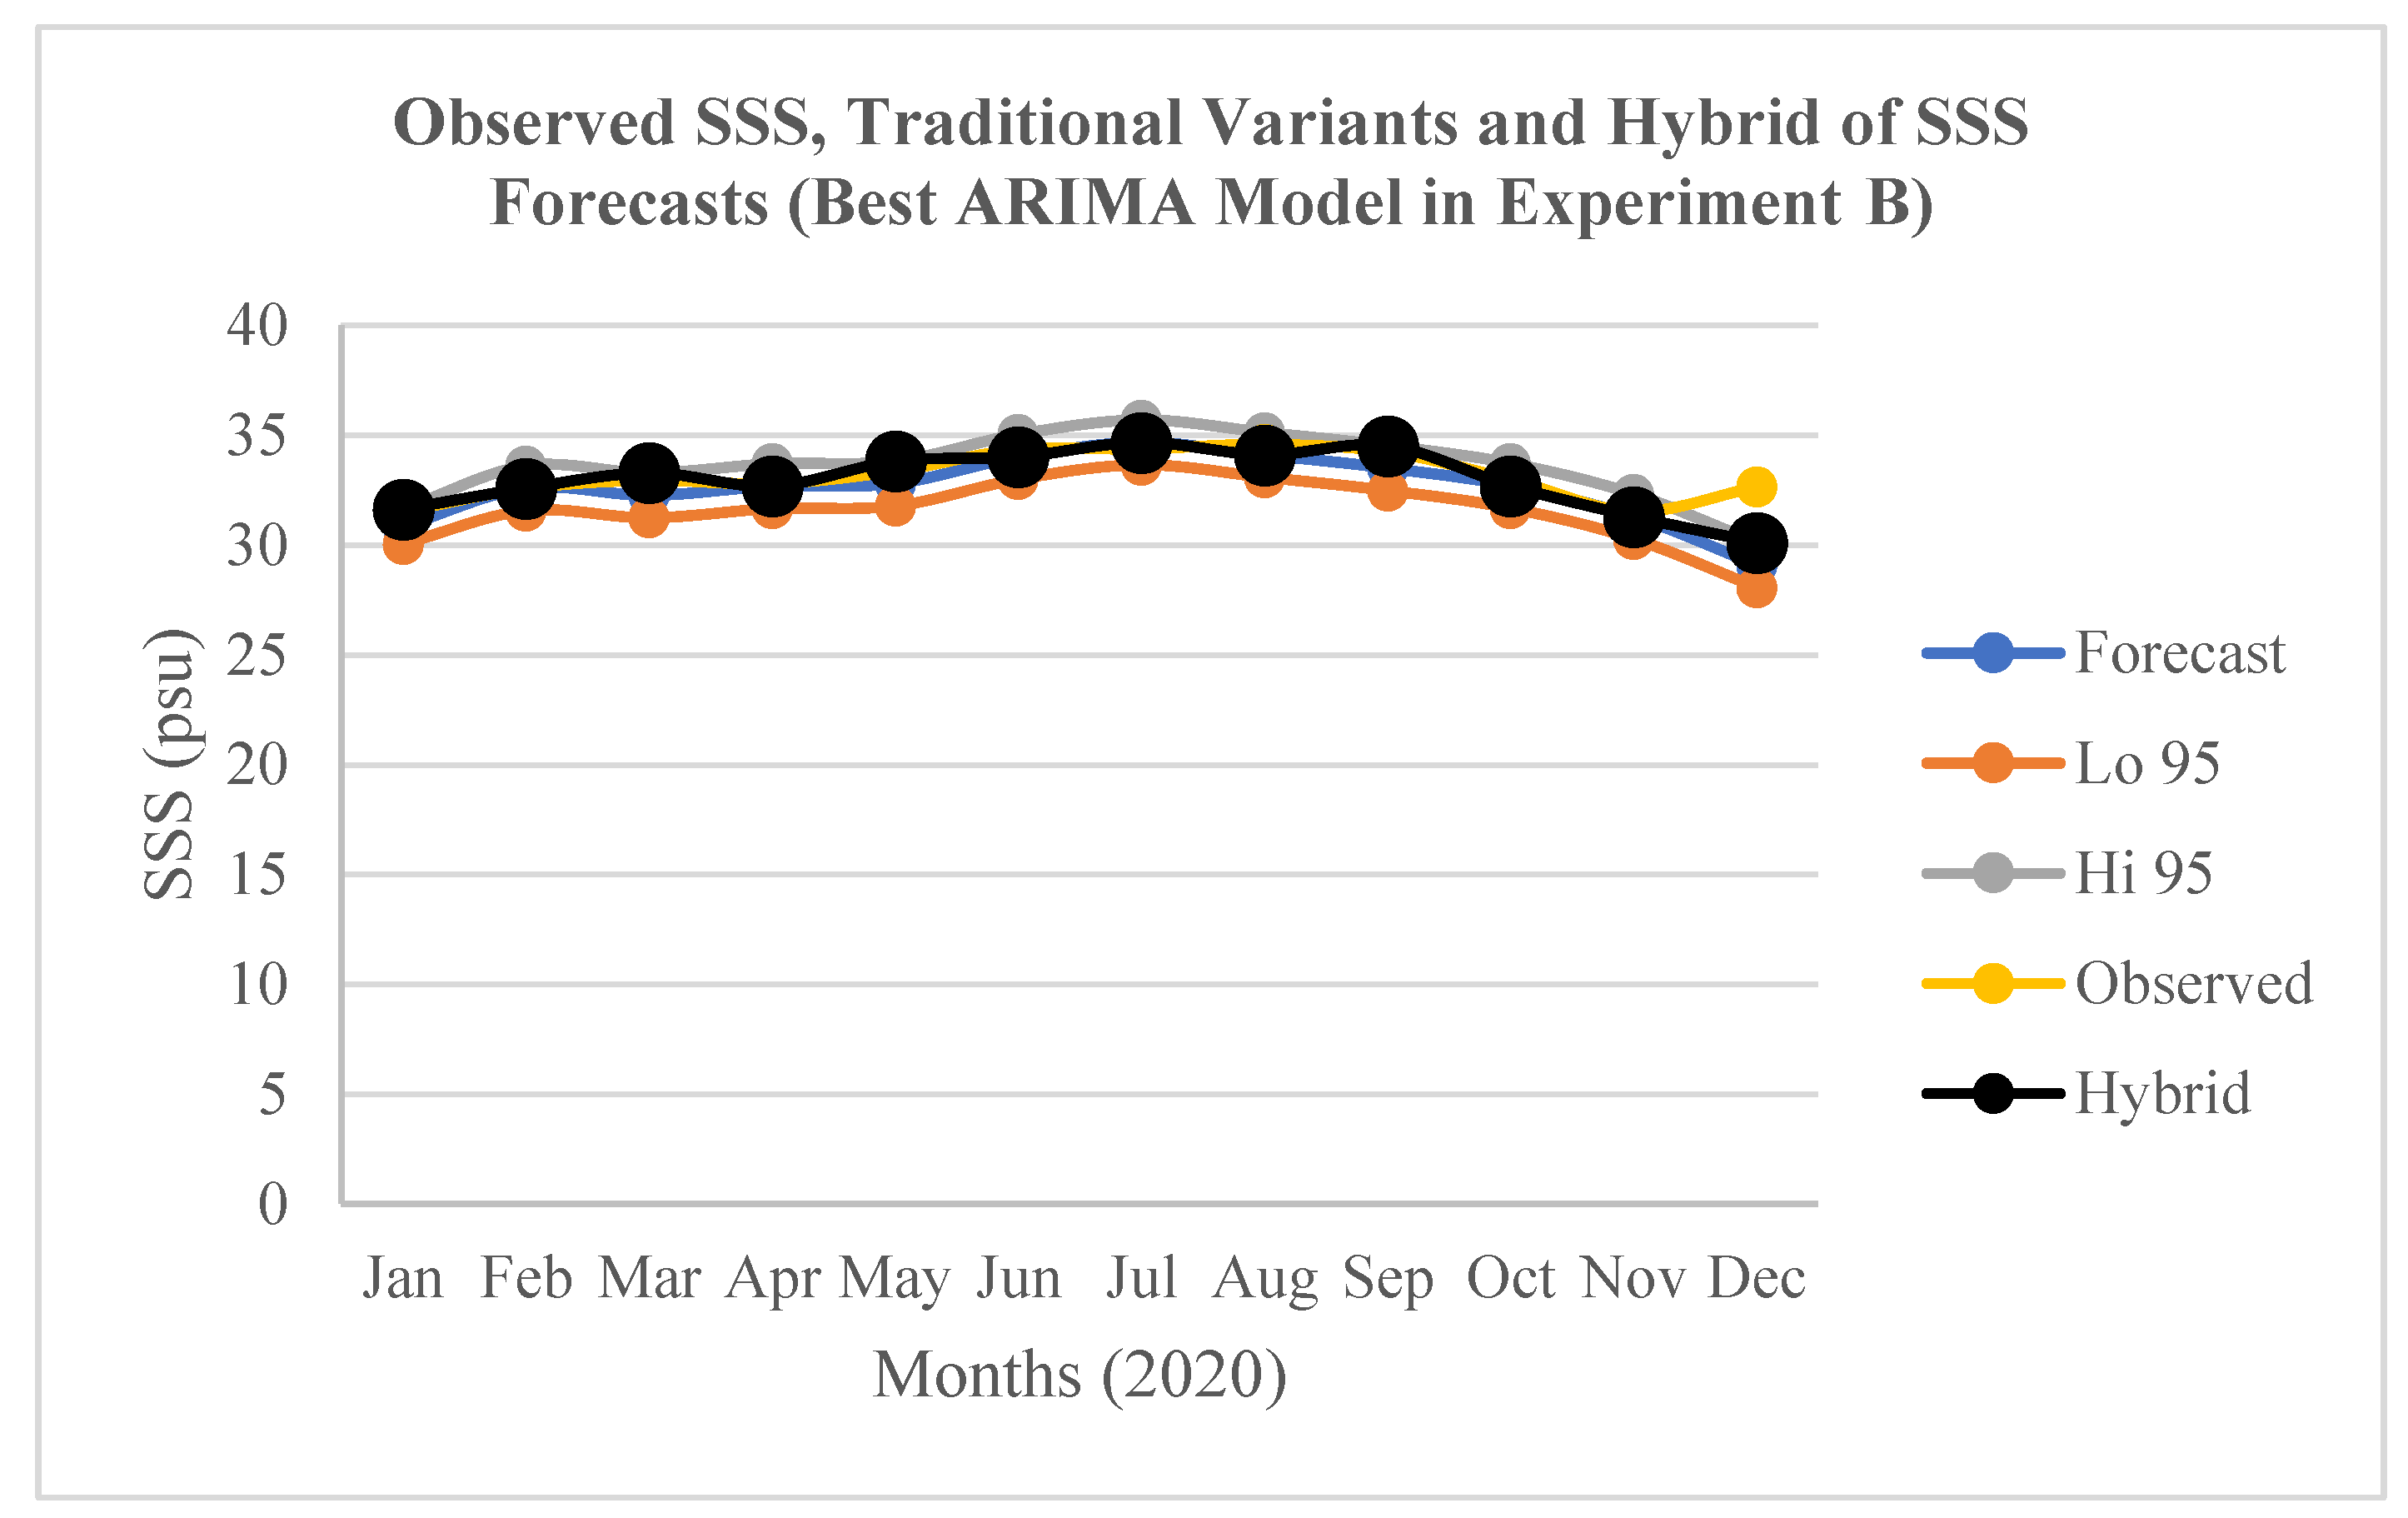
Figure 8.
Observed SSS, the traditional variants and hybrid of the SSS forecasts (Jan.-Dec. 2021) by the best ARIMA model in Experiment C.
Figure 8.
Observed SSS, the traditional variants and hybrid of the SSS forecasts (Jan.-Dec. 2021) by the best ARIMA model in Experiment C.
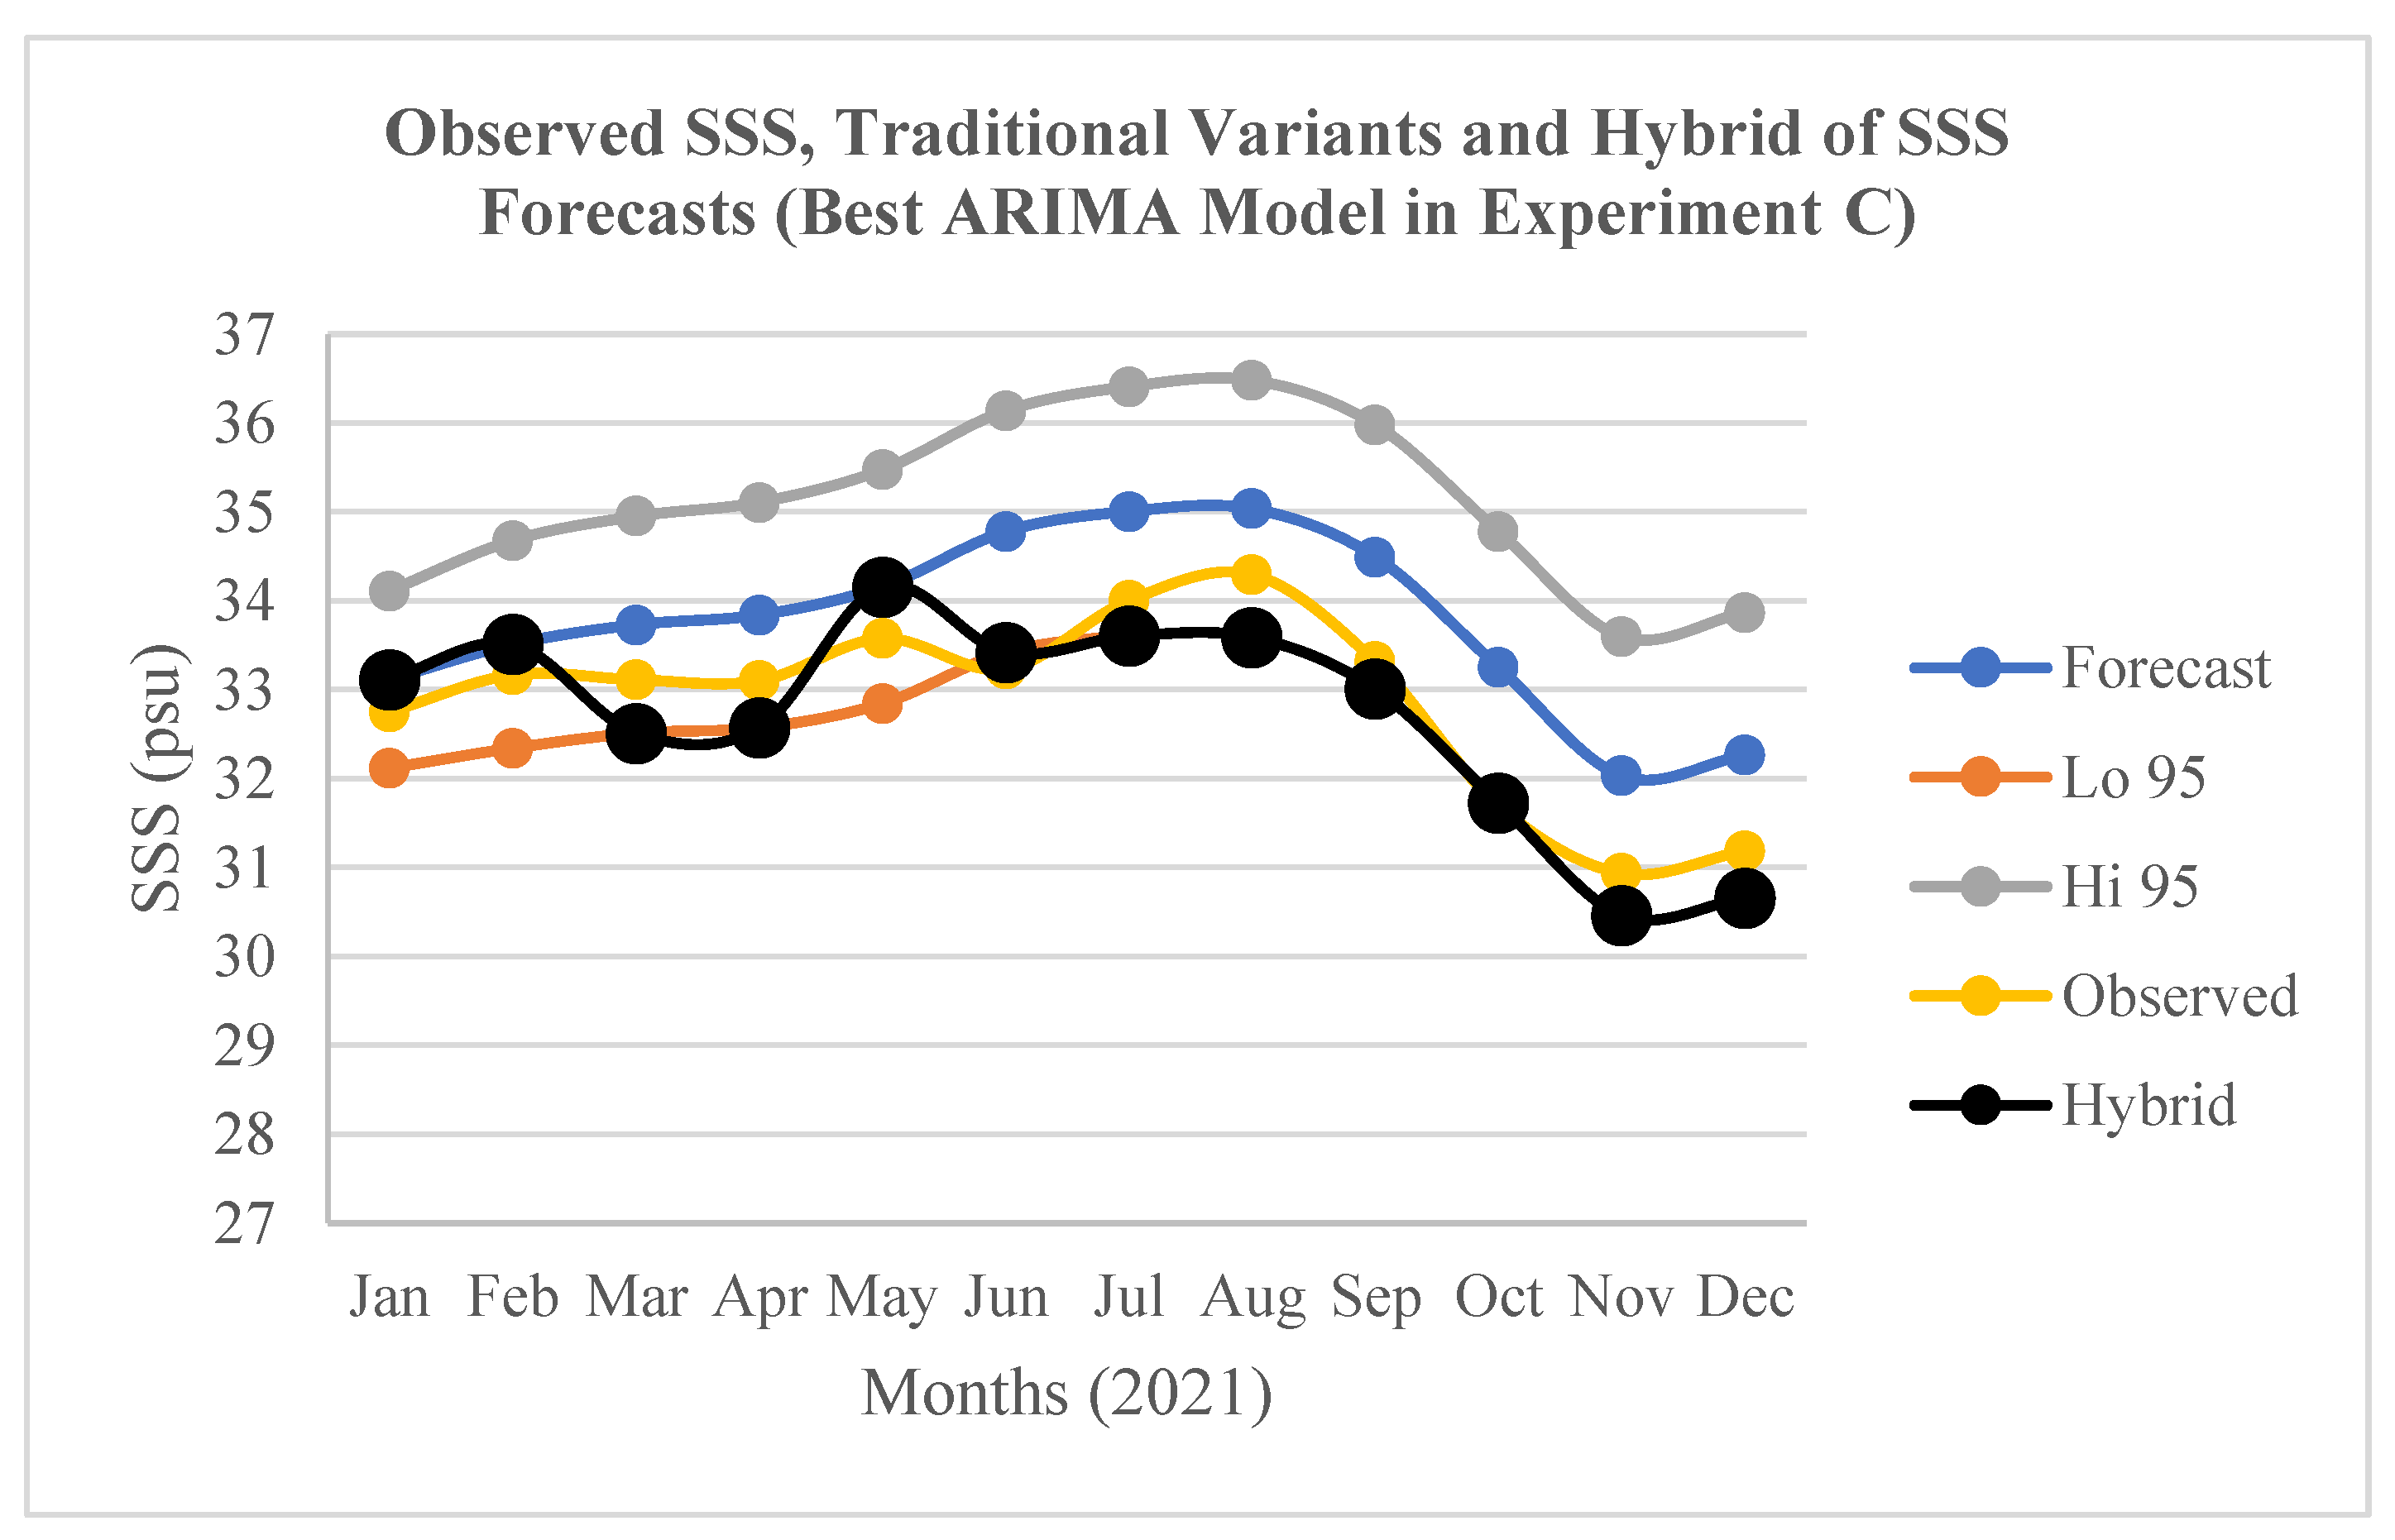
Figure 9.
Validation of the optimised SSS forecasts accuracy in relation to the accuracy of the traditional variants of the SSS forecasts by the best ARIMA model in Experiments A, B, and C in terms of MAPE.
Figure 9.
Validation of the optimised SSS forecasts accuracy in relation to the accuracy of the traditional variants of the SSS forecasts by the best ARIMA model in Experiments A, B, and C in terms of MAPE.
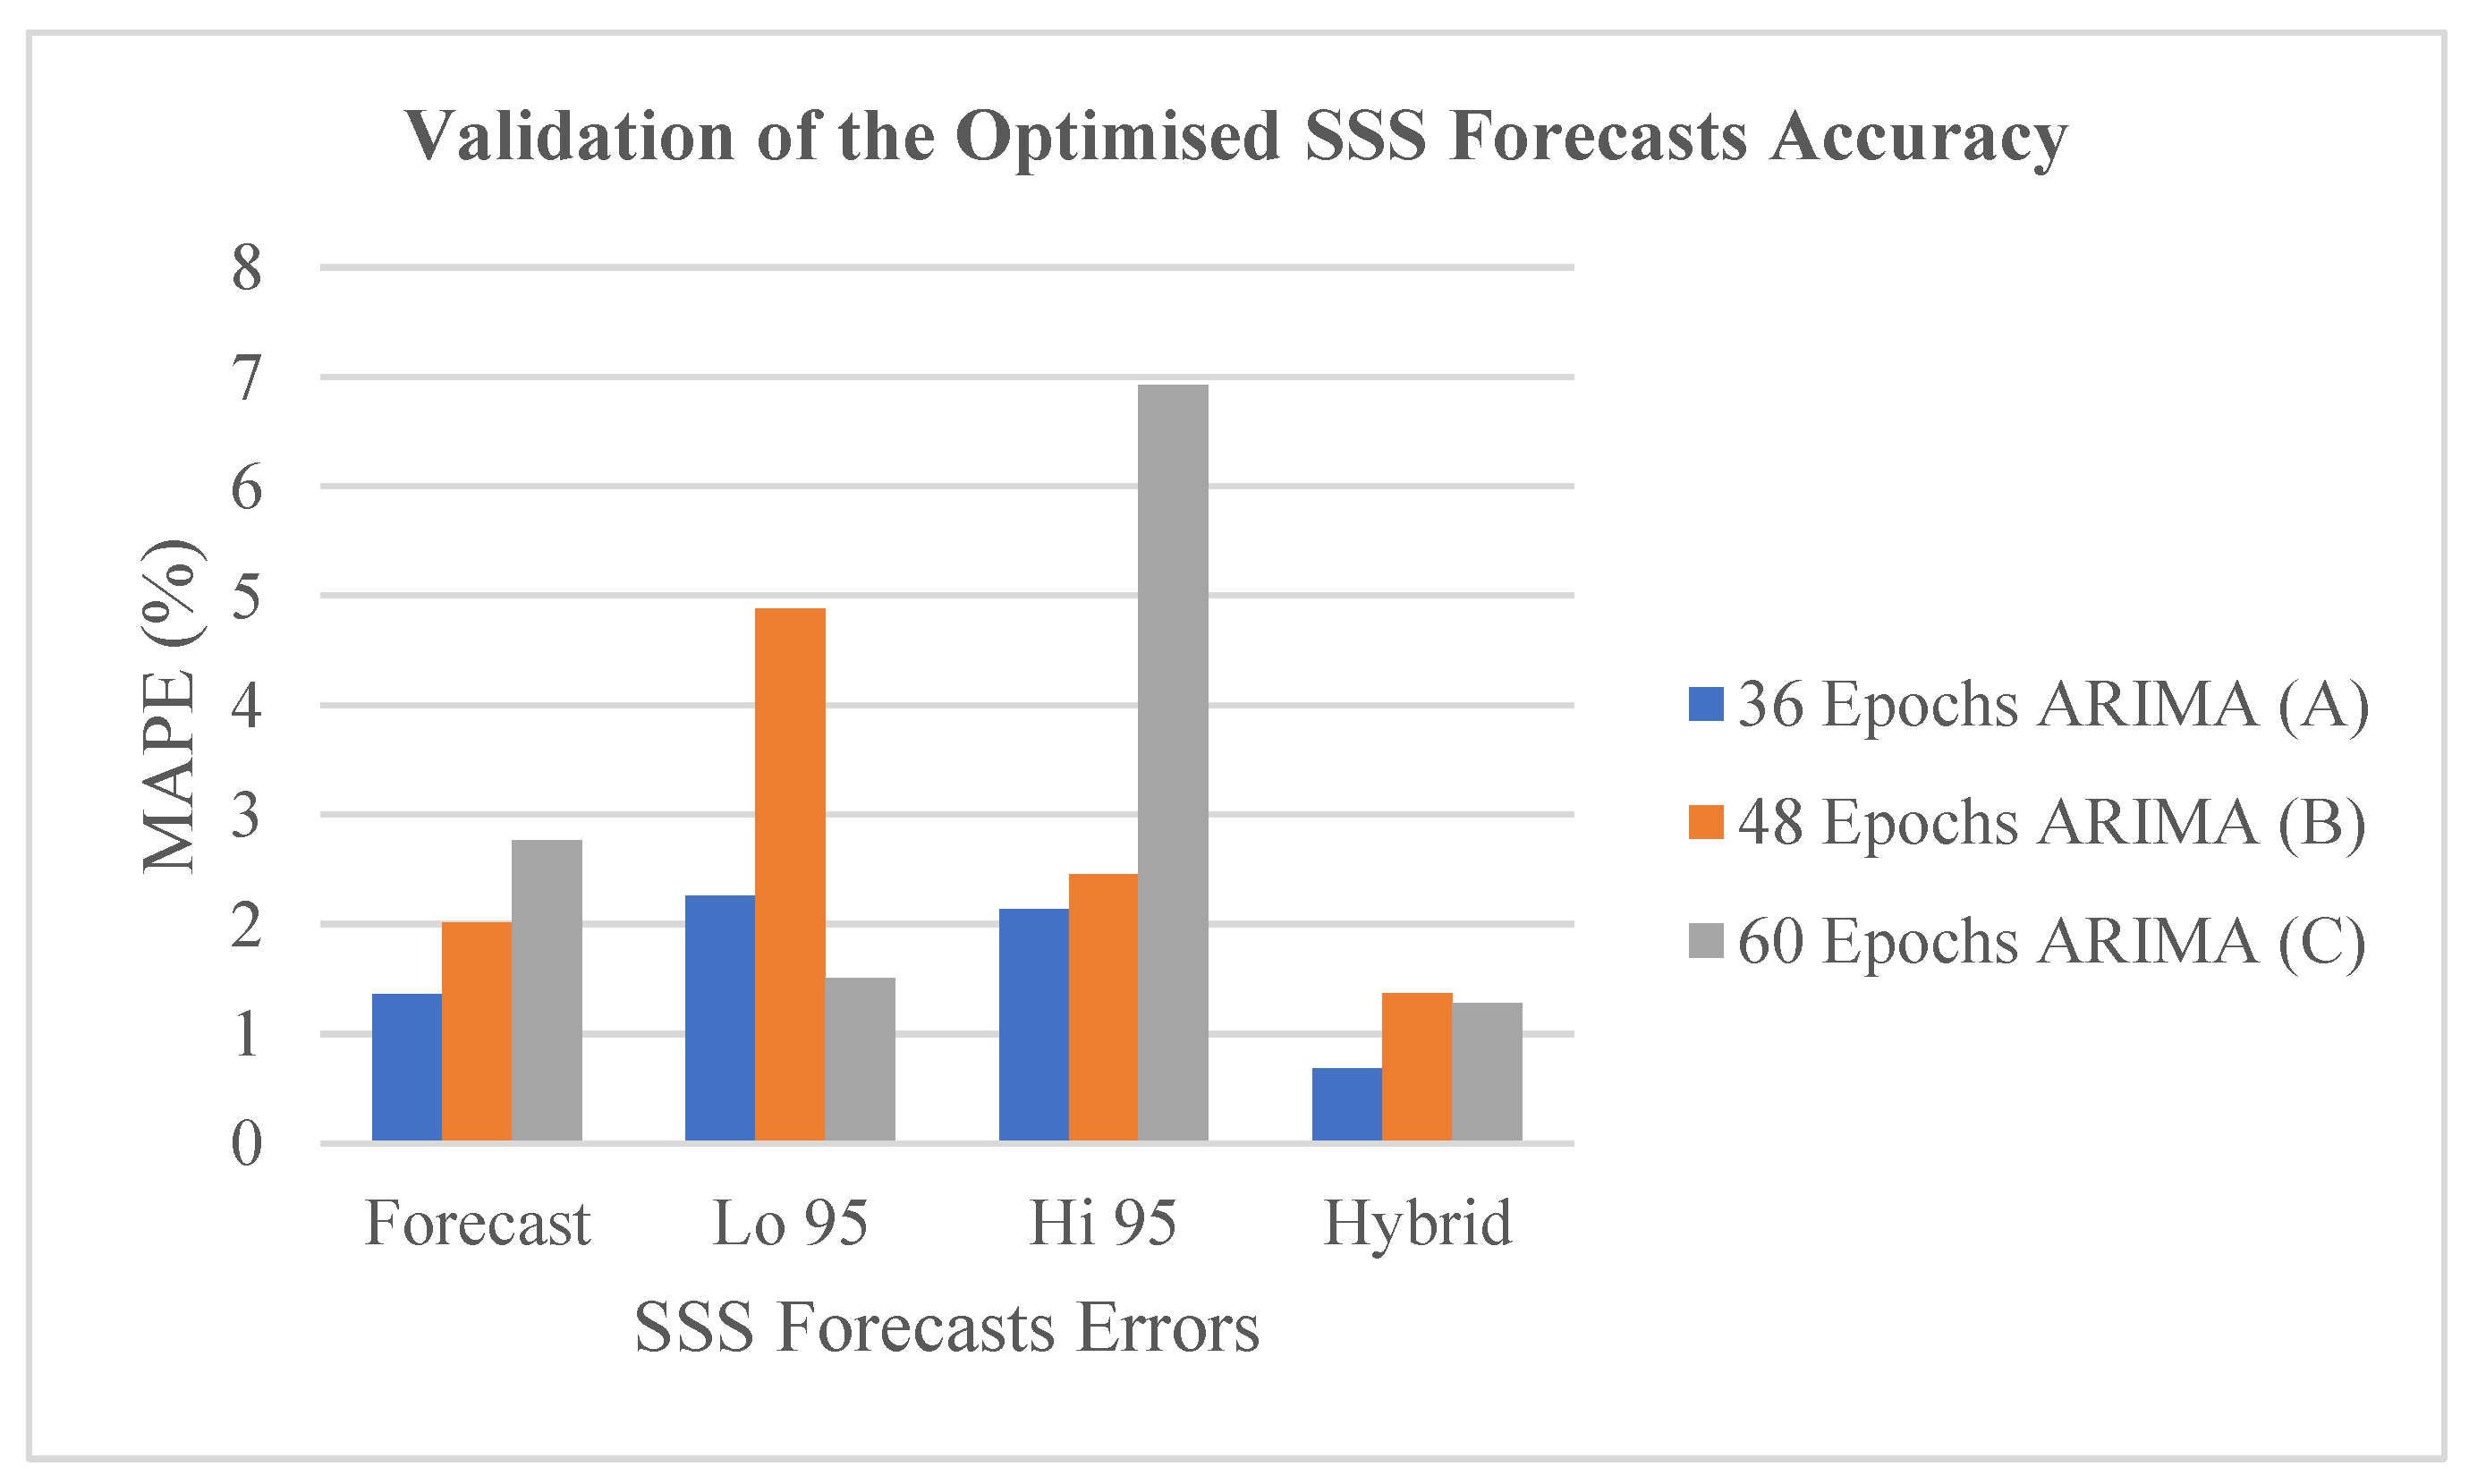

Table 1.
Characteristics of the datasets analysed for the study.
| Data Name | Data Variable | Observation (Obs.) Period | Monthly Time Scale (Epochs) |
Spatial Resolution | Obs. per Time |
Total Obs. | Data Purpose |
|---|---|---|---|---|---|---|---|
| SMAP | SSS; SSS Uncertainty | Jan. 2016 to Dec. 2018 Jan. 2016 to Dec. 2019 Jan. 2016 to Dec. 2020 |
36 48 60 |
0.25° (Lat.) × 0.25° (Lon.) | 278 | 10008 13344 16680 |
Models Training |
| SMAP | SSS; SSS Uncertainty | Jan. to Dec. 2019 Jan. to Dec. 2020 Jan. to Dec. 2021 |
12 12 12 |
0.25° (Lat.) × 0.25° (Lon.) | 278 | 3336 3336 3336 |
Forecasts Validation |
Table 2.
Accuracy of the SMAP SSS datasets utilized for the models training and forecasts validation.
Table 2.
Accuracy of the SMAP SSS datasets utilized for the models training and forecasts validation.
| Data Purpose | Observation (Obs.) Period | Monthly Time Scale (Epochs) |
Total Obs. | Spatial Area | RMSD (PSU) | Difference between RMSD and Mission Accuracy (%) |
|---|---|---|---|---|---|---|
| Models Training |
Jan. 2016 to Dec. 2018 Jan. 2016 to Dec. 2019 Jan. 2016 to Dec. 2020 |
36 48 60 |
10008 13344 16680 |
6.5° × 4.5° | 0.1203 0.1055 0.1279 |
39.85 47.25 36.05 |
| Forecasts Validation |
Jan. to Dec. 2019 Jan. to Dec. 2020 Jan. to Dec. 2021 |
12 12 12 |
3336 3336 3336 |
6.5° × 4.5° | 0.1528 0.1226 0.1162 |
23.60 38.70 41.90 |
Table 3.
Performance metrics of the best ARIMA model in the experiments A, B, and C.
| Model | Model’s Training Dataset |
Model Determination | Model’s Accuracy |
Model’s Accuracy Validation |
||||
|---|---|---|---|---|---|---|---|---|
| ID | Monthly Epoch | Best ARIMA Model | Minimum AIC |
Term and Coefficient | Term’s P-value |
R2 | RMSE (PSU) |
MAPE (PSU) |
| A | 36 | ARIMA(1,0,0)(0,1,0)[12] with drift | 13.4120 | ar1: 0.4221 drift: -0.0135 |
0.0000 0.0000 |
0.9407 | 0.2304 | 0.4622 |
| B | 48 | ARIMA(0,0,1)(1,1,0)[12] | 42.8184 | ma1: 0.8131 sar1: 0.2738 |
0.0000 0.0000 |
0.8978 | 0.3404 | 0.6916 |
| C | 60 | ARIMA(0,1,2)(0,1,1)[12] | 81.8097 | ma1: -0.3858 ma2: -0.2633 sma1: -0.7099 |
0.0000 0.0000 0.0000 |
0.8345 | 0.4294 | 0.7779 |
Table 4.
Accuracy of the three variants of the SSS forecasts by the best ARIMA models in the experiments A, B, and C.
Table 4.
Accuracy of the three variants of the SSS forecasts by the best ARIMA models in the experiments A, B, and C.
| Best Model in A (36 Epochs) | Best Model in B (48 Epochs) | Best Model in C (60 Epochs) | |||||||
|---|---|---|---|---|---|---|---|---|---|
| Traditional Forecasts Variants | RMSE (psu) |
MAE (psu) |
MAPE (%) |
RMSE (psu) |
MAE (psu) |
MAPE (%) |
RMSE (psu) |
MAE (psu) |
MAPE (%) |
| Forecast | 0.5810 | 0.4340 | 1.3613 | 1.1156 | 0.6624 | 2.0080 | 0.9850 | 0.9041 | 2.7665 |
| Lo 95 | 0.8229 | 0.7359 | 2.2540 | 1.8651 | 1.6147 | 4.8848 | 0.5435 | 0.4958 | 1.5038 |
| Hi 95 | 0.8919 | 0.6815 | 2.1323 | 1.0144 | 0.8109 | 2.4496 | 2.3283 | 2.2673 | 6.9260 |
Table 5.
Accuracy of the optimised (Hybrid) SSS forecasts by the best ARIMA models in the experiments A, B, and C.
Table 5.
Accuracy of the optimised (Hybrid) SSS forecasts by the best ARIMA models in the experiments A, B, and C.
| Best Model in A (36 Epochs) | Best Model in B (48 Epochs) | Best Model in C (60 Epochs) | |||||||
|---|---|---|---|---|---|---|---|---|---|
| Optimised Forecasts Variant | RMSE (psu) |
MAE (psu) |
MAPE (%) |
RMSE (psu) |
MAE (psu) |
MAPE (%) |
RMSE (psu) |
MAE (psu) |
MAPE (%) |
|
Hybrid |
0.3133 | 0.2131 | 0.6773 | 0.7813 | 0.4516 | 1.3643 | 0.4586 | 0.4213 | 1.2787 |
Table 6.
Percentage of the SSS forecasts errors (MAPE) made by the best ARIMA models in the experiments A, B, and C that was reduced in relation to the optimised (Hybrid) SSS forecasts.
Table 6.
Percentage of the SSS forecasts errors (MAPE) made by the best ARIMA models in the experiments A, B, and C that was reduced in relation to the optimised (Hybrid) SSS forecasts.
| A 36 Epochs ARIMA (%) |
B 48 Epochs ARIMA (%) |
C 60 Epochs ARIMA (%) |
|---|---|---|
| 50.24 | 32.06 | 53.78 |
| 69.95 | 72.07 | 14.97 |
| 68.23 | 44.30 | 81.54 |
Disclaimer/Publisher’s Note: The statements, opinions and data contained in all publications are solely those of the individual author(s) and contributor(s) and not of MDPI and/or the editor(s). MDPI and/or the editor(s) disclaim responsibility for any injury to people or property resulting from any ideas, methods, instructions or products referred to in the content. |
© 2025 by the authors. Licensee MDPI, Basel, Switzerland. This article is an open access article distributed under the terms and conditions of the Creative Commons Attribution (CC BY) license (http://creativecommons.org/licenses/by/4.0/).
Copyright: This open access article is published under a Creative Commons CC BY 4.0 license, which permit the free download, distribution, and reuse, provided that the author and preprint are cited in any reuse.


