
Submitted:
02 August 2025
Posted:
04 August 2025
You are already at the latest version
Abstract
This paper explores the application of integrated computational intelligence techniques to address challenges in predictive analytics and market structuring. A hybrid approach, combining convolutional neural networks (CNN) with fuzzy logic, is employed for enhanced forecasting in financial markets and sales. Self-organizing maps (SOM) are utilized for customer segmentation. The methodology demonstrates the efficacy of these combined AI methods for improving decision-making across diverse business domains.
Keywords:
computational intelligence
; convolutional neural networks (CNN)
; fuzzy logic
; predictive analytics
; financial forecasting
; customer segmentation
; self-organizing maps (SOM)
; hybrid AI models
; market structuring
; decision support systems
1. Introduction
Artificial Intelligence (AI) has revolutionized problem-solving by enabling systems to emulate cognitive functions, process vast datasets, and make data-driven decisions [1]. With advancements in computational resources and data availability, AI has permeated multiple sectors, notably healthcare, finance, and marketing. Within finance, AI methods are increasingly employed in stock price prediction and customer profiling.
Stock market forecasting is inherently complex due to volatility and data noise. Nonetheless, AI models like Neural Networks (NNs) and Fuzzy Logic (FL) demonstrate strong potential in identifying nonlinear patterns and learning from historical trends [2]. These adaptive methods often outperform conventional statistical models in dynamic environments.
In business operations, accurate revenue prediction supports demand planning, inventory control, and budgeting, leading to greater efficiency [3]. AI-driven forecasting systems, trained on historical patterns and external factors, can significantly enhance prediction accuracy and responsiveness.
From a marketing perspective, segmenting customers based on behavior or demographics is vital for personalized engagement and optimized strategy. Clustering methods, particularly Self-Organizing Maps (SOMs), have emerged as effective tools for visualizing and interpreting complex customer data [4,5]. SOMs offer a topological mapping of high-dimensional inputs, enabling businesses to uncover nuanced consumer patterns.
2. Backpropagation Algorithm
Backpropagation is a foundational training method in artificial neural networks, aimed at minimizing prediction error by adjusting connection weights based on the difference between actual and desired outputs. The learning process involves two main steps: forward and backward propagation. In the forward pass, input data traverses through network layers to generate an output, which is then compared to the target to compute the error. During the backward pass, this error is distributed across layers using gradient-based optimization to refine the weights.
Each neuron’s error contribution is quantified, allowing the model to update weights in a way that reduces the overall loss. This cycle repeats until weight changes fall below a predefined threshold, signifying convergence.
In this study, the Levenberg-Marquardt algorithm—a powerful technique for solving non-linear least squares problems—was employed to optimize training. The dataset was split, with 70% used for training and 30% for testing to evaluate generalization performance.
The neural network comprises twenty hidden layers with sigmoid activation functions to capture complex relationships in data. This architecture has been applied to stock price and sales data, demonstrating strong performance in diverse forecasting scenarios through deep learning and error minimization.
3. Artificial Intelligence Techniques
Modern AI emphasizes learning and adaptability over sheer computation, drawing inspiration from cognitive processes [6]. Among its key tools are artificial neural networks (ANNs), which consist of interconnected layers of processing units designed to model complex relationships. ANNs are particularly effective in handling noisy, incomplete, or unstructured data due to their generalization capabilities [7].
This study integrates three AI methods: backpropagation neural networks, self-organizing maps (SOMs), and fuzzy logic. Each addresses specific challenges in pattern recognition and data interpretation.
3.1. Fuzzy Logic
Fuzzy logic provides a framework for handling vagueness and partial truths, making it suitable for modeling uncertain systems [8]. Unlike binary logic, it permits variable degrees of membership, represented by a function that maps values between 0 and 1.
Using if-then rules based on linguistic variables (e.g., “low,” “medium,” “high”), fuzzy inference systems process inputs through fuzzification, rule evaluation, aggregation, and defuzzification to generate precise outputs.
In this work, fuzzy models are iteratively refined by adjusting membership functions in response to output discrepancies. This adaptive feedback loop enhances system performance by identifying stable configurations that mirror real-world behavior, proving effective in environments characterized by ambiguity and nonlinearity.
3.2. Self-Organizing Maps
Self-Organizing Maps (SOMs), introduced by Teuvo Kohonen, are a class of unsupervised learning models that transform high-dimensional data into a typically two-dimensional neural lattice while maintaining the topological structure inherent in the original input space. Unlike supervised neural networks, SOMs operate without labeled outputs, making them particularly effective for pattern discovery, data clustering, and visualization in complex datasets.
The architecture of a SOM comprises a network of interconnected neurons arranged in a lattice, with each neuron linked to a weight vector of the same dimensionality as the input data. During training, the algorithm sequentially processes input vectors to identify the Best Matching Unit (BMU)—the neuron whose weight vector is most similar to the given input, often determined using Euclidean distance. Once the BMU is located, its weight vector, along with those of its neighboring neurons, is updated to more closely align with the input vector. This iterative refinement process allows the map to self-organize, capturing the underlying distribution and similarity structure of the input data.
One of the defining attributes of SOMs is their preservation of spatial relationships. Inputs that are alike tend to activate neighboring neurons on the map, effectively enabling the projection of high-dimensional patterns onto a lower-dimensional grid without losing essential proximity information. This spatial coherence makes SOMs valuable for uncovering latent structures within the data, which is especially beneficial for visualization and interpretative analysis.
In this work, SOMs are employed for customer segmentation, a task centered on grouping individuals based on common traits such as purchasing patterns, behavioral tendencies, and demographic attributes. Each neuron in the resulting Kohonen map symbolizes a distinct customer profile. In the implementation developed for this study, the SOM comprises a linear configuration of neurons, each representing a unique cluster of consumers.
The training regimen consists of 200 epochs, a value empirically determined to achieve stable convergence. During each iteration, the SOM algorithm adjusts the neurons’ weights depending on their proximity to the BMU in both the input space and the map topology. This iterative adaptation process culminates in a structured neural layout that intuitively captures customer groupings, thereby enhancing decision-making in applications such as personalized marketing and customer relationship optimization.
By integrating SOMs with fuzzy inference systems and neural models, this research proposes a synergistic hybrid framework capable of both accurate forecasting and granular customer segmentation. The combined strengths of these methods enable the extraction of actionable insights from heterogeneous datasets, thereby supporting strategic planning and data-driven service personalization.
4. Formulation of the Problem and Simulation of Results for Prediction
To evaluate the effectiveness of intelligent computational techniques in modeling and forecasting complex systems, this study focuses on two dynamic and uncertain real-world applications: (1) stock price movement prediction and (2) future sales volume estimation. These domains are selected due to their high levels of variability, nonlinearity, and stochasticity—attributes that challenge conventional analytical approaches but offer fertile ground for AI-based methodologies.
4.1. Stock Market Forecast
Dataset Overview: The stock market prediction module utilizes a robust dataset comprising daily trading data from the Bombay Stock Exchange (BSE). The dataset spans from July 2, 2016, to February 17, 2020, and includes both raw equity trading information and derived financial indicators. The variables employed in model development encompass a range of technical metrics frequently used by traders and analysts. These include, but are not limited to:
- Opening Price: The initial transaction price recorded at the start of the trading session.
- Closing Price: The final price at which the stock traded at the end of the session.
- High and Low Prices: The maximum and minimum trading prices recorded within a single day.
- Trading Volume: The total number of shares exchanged during the session.
- Moving Averages (e.g., MA5, MA10): Calculated to smooth out price trends and reveal market momentum.
- Relative Strength Index (RSI): A momentum oscillator used to evaluate overbought or oversold conditions.
- MACD (Moving Average Convergence Divergence): Indicates changes in momentum and trend strength.
TThese indicators were scaled using normalization techniques to ensure consistent numerical ranges across all features, thereby enhancing the stability and convergence of the learning algorithms. After preprocessing, the dataset was divided into two distinct subsets to facilitate a fair evaluation of the models’ generalization capabilities. A conventional split of 70% for training and 30% for testing was employed, enabling performance comparison on unseen data.
The core of the forecasting framework involves an artificial intelligence pipeline utilizing two distinct methodologies: artificial neural networks (ANNs) and fuzzy logic systems. Each approach was individually trained on the processed dataset to capture underlying trends and price dynamics in the stock market.
Input Feature Descriptions: The selected input variables include a diverse set of technical indicators, each offering unique insight into market behavior:
- Opening Price: Represents the initial transaction value at the commencement of a trading day.
- Simple Moving Average (SMA): A statistical measure that computes the average of closing prices over a fixed interval to identify directional trends.
- Exponential Moving Average (EMA): Similar to the SMA, but assigns exponentially decreasing weights to older data, emphasizing recent market movements.
- Relative Strength Index (RSI): A bounded oscillator ranging from 0 to 100 that reflects the magnitude and velocity of recent price shifts, aiding in the detection of potential reversal zones.
The dependent variable used for learning and prediction is the closing price on the corresponding trading day. This target is chosen due to its significance as a summary measure of market sentiment and trading activity.
Preprocessing Strategy and Data Partitioning: To bring all numerical inputs into a comparable range and reduce the influence of scale disparities, min-max normalization was applied. This step is critical for accelerating the training process and preventing numerical instability. Following normalization, the dataset was randomly split, preserving the temporal order to simulate realistic forecasting conditions. The 70:30 ratio ensures that sufficient data is available for learning while maintaining a representative test set for validation.
Neural Network Configuration and Training: The neural forecasting model consists of a feedforward architecture, beginning with four input nodes corresponding to the selected indicators. Several hidden layers with nonlinear activation functions were experimented with to determine an optimal network depth and width. The architecture terminates with a single output node predicting the day’s closing price. The training process involves supervised learning through the backpropagation algorithm, guided by the minimization of the Mean Squared Error (MSE) loss function, formally expressed as:
Here, represents the actual stock closing price for the i-th sample, is the model’s predicted output, and n is the number of observations in the testing set.
Fuzzy Logic System Design: The alternative modeling approach leverages fuzzy logic, which mimics human reasoning by encoding knowledge into a rule-based framework. Each input feature is associated with linguistic terms (e.g., “low”, “medium”, “high”) described by triangular or trapezoidal membership functions. A Mamdani inference mechanism processes fuzzy rules, and the system concludes with a defuzzification step using the centroid technique to produce crisp output values representing the estimated stock price.
Evaluation and Comparative Results: After training, both models were subjected to the test dataset for benchmarking. The neural network demonstrated robust learning capabilities, capturing non-obvious patterns and dependencies among inputs. It achieved lower prediction errors under high volatility, reflecting its proficiency in approximating nonlinear mappings.
Conversely, the fuzzy logic system exhibited strengths in interpretability and transparency. Although it delivered slightly higher errors in quantitative terms, it facilitated qualitative assessments, especially in ambiguous market scenarios. Its linguistic rule base allowed analysts to trace reasoning steps, making it suitable for strategic insights where transparency is paramount.
The comparative study underscores the complementary nature of these methodologies—while neural networks excel in predictive precision, fuzzy logic offers valuable explanatory power. This duality suggests the potential for a hybrid system combining the predictive depth of neural networks with the interpretability of fuzzy inference, thereby providing a comprehensive solution for financial forecasting tasks.

Table 1.
Performance comparison of prediction techniques for Data Set I
| Prediction Technique | Mean Square Error (MSE) | Accuracy (%) |
|---|---|---|
| ANN | 1.08 | 97.18 |
| Fuzzy | 5.94 | 92.36 |
Table 2.
Performance comparison of prediction technology
| Prediction Technique | Mean Square Error (MSE) | Accuracy (%) |
|---|---|---|
| ANN | 2.43 | 99.68 |
| Fuzzy | 2.64 | 99.04 |
5. Results and Discussion
The effectiveness of the developed predictive models—artificial neural networks (ANN) and fuzzy logic systems—was evaluated using two case studies. The first focuses on stock price forecasting, and the second on sales revenue estimation using two distinct datasets. The results are presented graphically and numerically to highlight the performance and accuracy of each method.
5.1. Stock Market Prediction Results
Figure 1 illustrates the alignment between actual and predicted stock prices during the ANN testing phase. The blue curve denotes the actual closing prices, while the red curve represents the predicted values. As evident from the figure, the red curve closely overlaps with the blue one, indicating high prediction accuracy. Similar predictive performance was observed with the fuzzy logic model.
Figure 2 and Figure 3 depict the progression of the Mean Squared Error (MSE) during training for the ANN and fuzzy logic models, respectively. MSE was employed as the primary error metric to quantify the deviation between predicted and actual values, calculated using:
Visual inspection of the MSE plots reveals that the ANN converged to a lower error value than the fuzzy logic approach, suggesting superior predictive precision. Table 3 presents the minimum MSE values obtained by both techniques.
Figure 4.
Stock Price Prediction for June 2016.
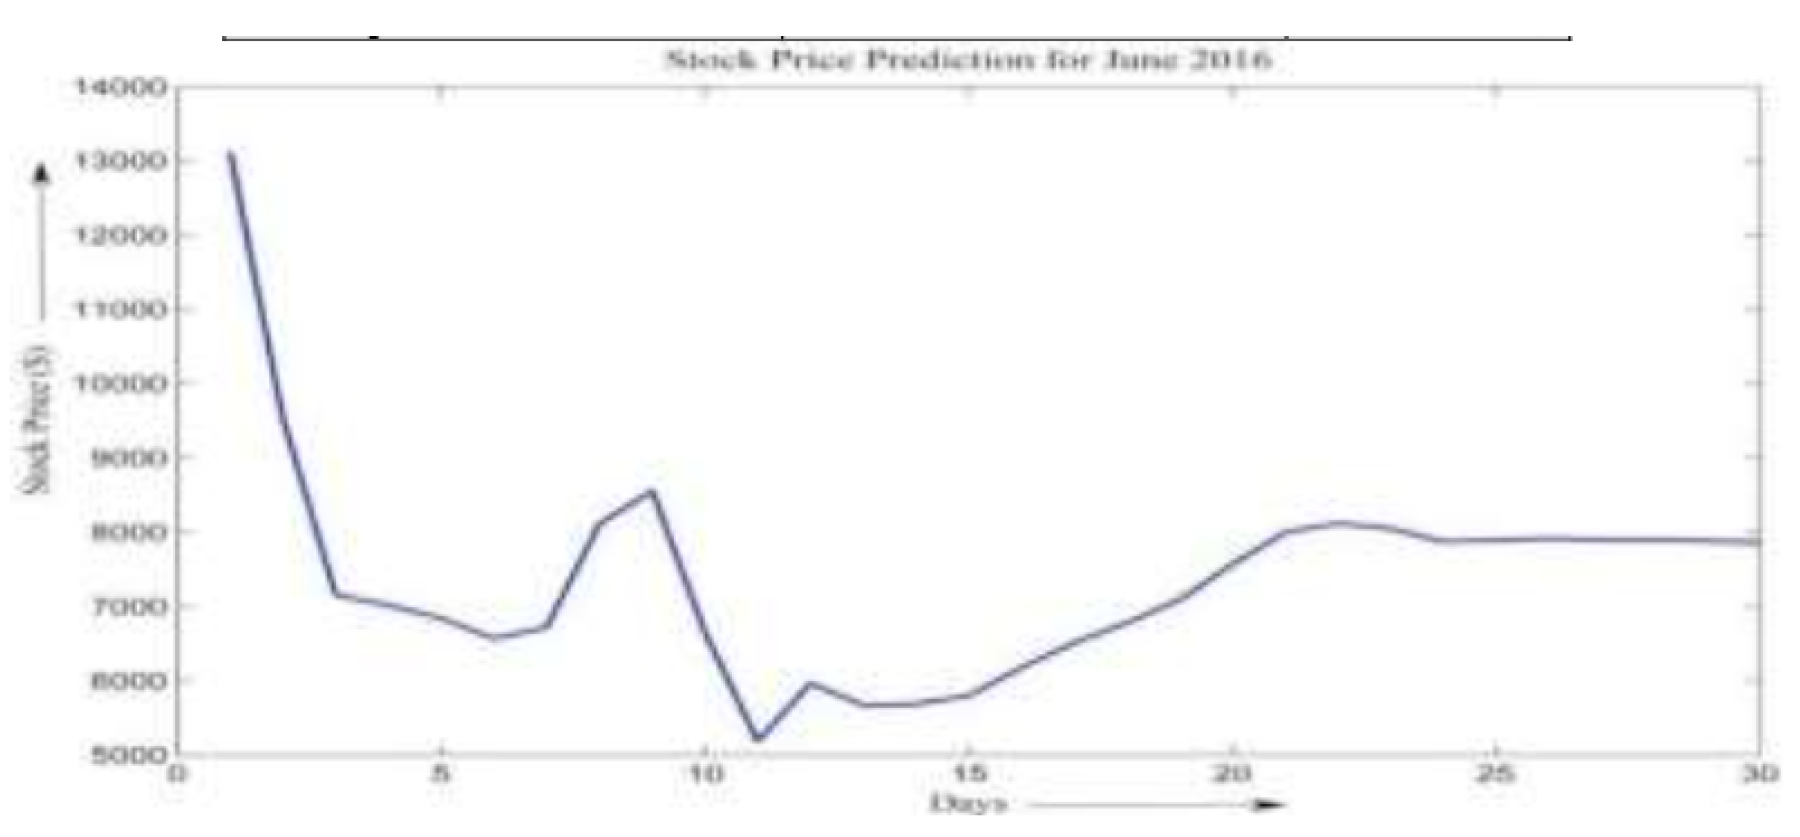
The findings demonstrate that both ANN and fuzzy systems are capable of capturing the trends in stock price movements, indicating that historical data holds predictive power. However, the ANN consistently outperformed the fuzzy model in terms of both error reduction and output accuracy. Therefore, the ANN was selected for subsequent stock price forecasting tasks, such as predicting the June 2016 closing prices shown in Figure 3.
5.2. Sales Forecasting Analysis
Data Set I: Promotional Campaign Revenue Prediction The first dataset spans a two-year period (2017–2019) and includes records of multiple promotional campaigns along with the corresponding monthly revenues. Nine key input variables were selected based on their influence on campaign success:
- Month of the year (1–12)
- Television advertisements
- Radio advertisements
- Newspaper advertisements
- Number of billboards
- Flyers distributed
- Direct mail volume
- Telemarketing calls
- Total promotional expenditure (in dollars)
The model was trained to predict the total transaction volume (in $) for the month following each promotional campaign. Figure 5 shows the real versus predicted revenue using ANN during the testing phase. The corresponding MSE curves for both ANN and fuzzy logic approaches are shown in Figure 6 and Figure 7, respectively.
From the plots, it is evident that the ANN model achieves rapid convergence, reaching its minimum error after just two iterations. In contrast, the fuzzy logic model converges more slowly and reaches only a local minimum by the third iteration. This demonstrates a more efficient learning capability in the neural network model for this particular forecasting task.
Data Set II: Telecom Sector Revenue Estimation This dataset covers a five-year period (2015–2020) and focuses on predicting service revenue for mobile operators. Five key input features were identified based on their influence on sales performance:
- Total operator subscriptions
- Operator’s market share
- Gross additions per operator
- Average Minutes of Use (MOU) per operator
- Operator’s annual retention (survival) rate
These variables were used to forecast the total revenue generated from services. The comparison between actual and predicted values during ANN testing is presented in Figure 8, while MSE plots for both models are shown in Figure 9 and Figure 10.
Interestingly, the results for this dataset show that the fuzzy logic model achieves a lower MSE compared to the ANN model, as summarized in Table 2. This indicates that, for this particular sales prediction problem, the fuzzy logic system is more effective, possibly due to its capability to model approximate reasoning and handle ambiguous input conditions better than the data-driven ANN.
Comparative Summary: A comprehensive comparison of model performances across all datasets is provided in Table 2. The analysis reveals that while ANN excels in stock price forecasting and promotional campaign revenue prediction, fuzzy logic demonstrates superior accuracy in the telecom sales estimation task. This highlights the importance of context when choosing between model architectures—ANNs are better suited for highly nonlinear, data-rich environments, whereas fuzzy logic models may be more effective when interpretability and rule-based decision-making are prioritized.
Figure 11.
Self-Organizing Map (SOM) output illustrating the market leader segment identified through clustering.
Figure 11.
Self-Organizing Map (SOM) output illustrating the market leader segment identified through clustering.
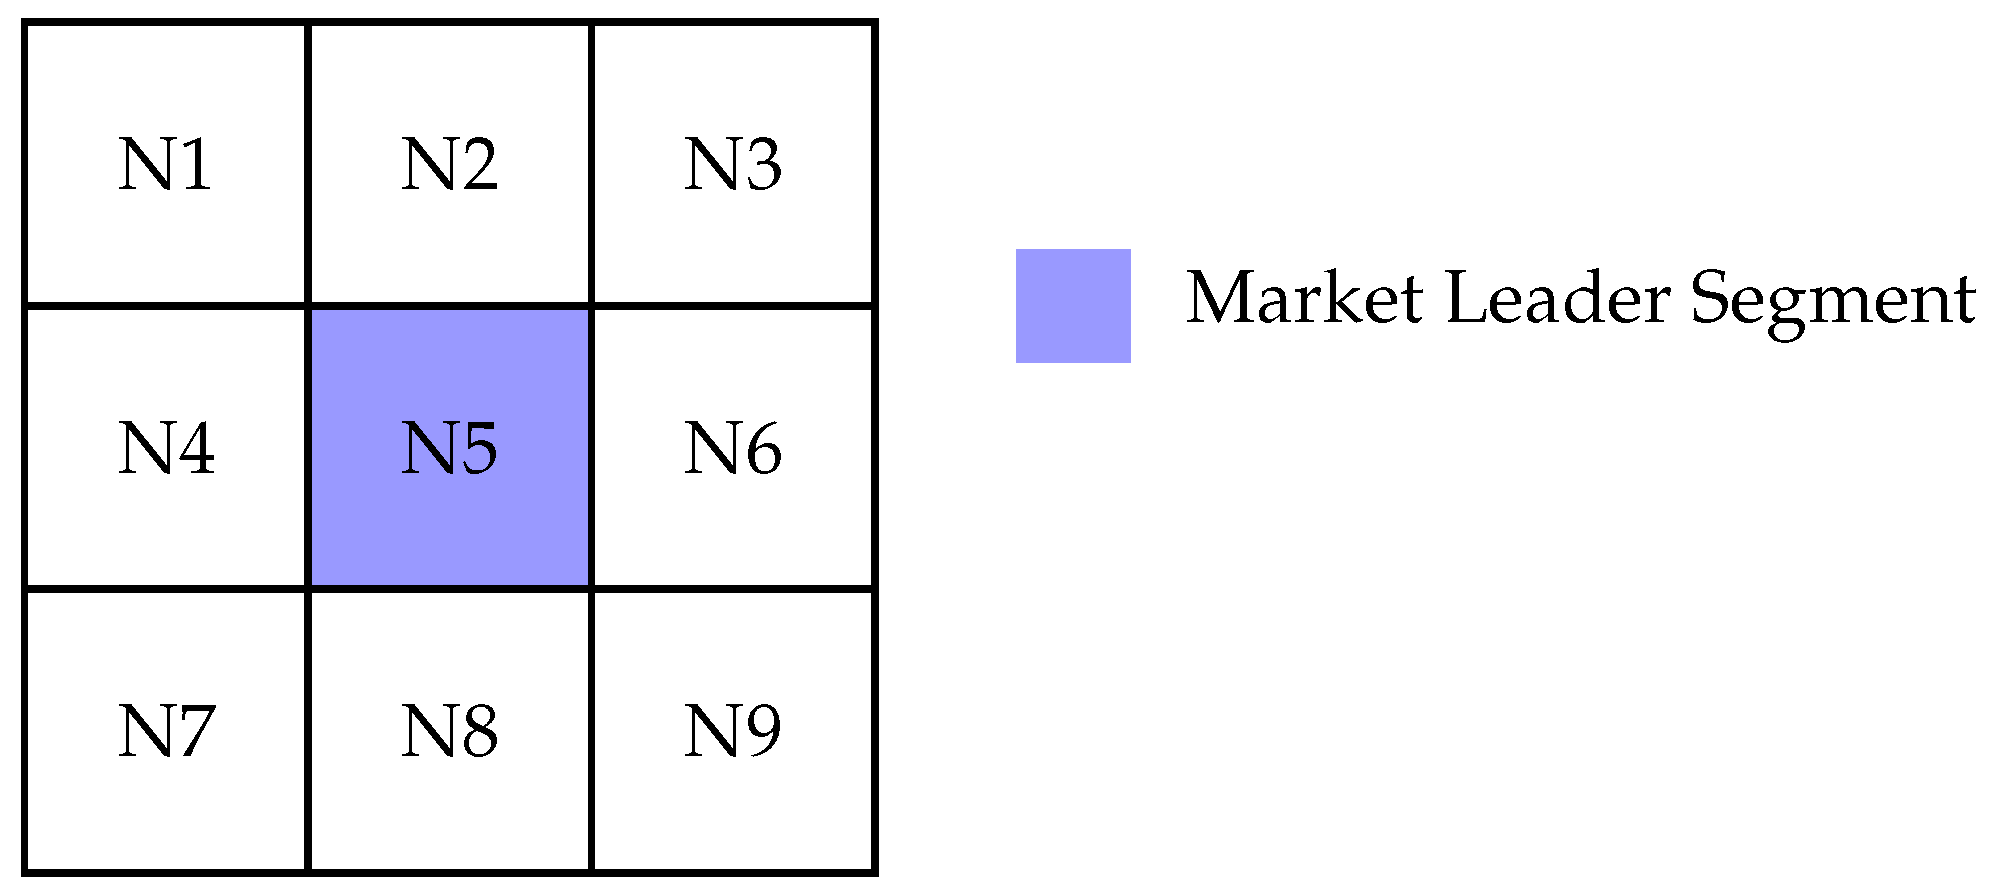
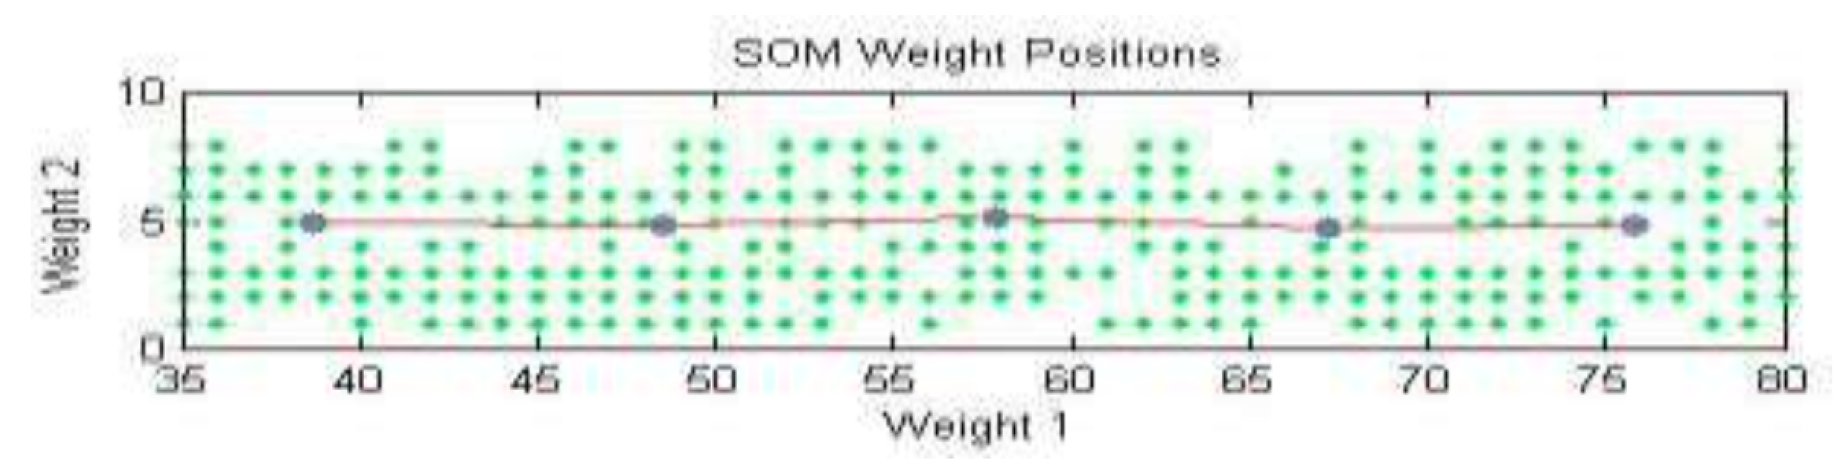
Figure 12.
SOM Weight Points.
6. Market Subdivision
i. Data Collection and Preprocessing
In this study, Self-Organizing Maps (SOM) were employed to perform unsupervised clustering of physicians for the purpose of enhancing targeted marketing strategies in the pharmaceutical industry. The specific use case involves a pharmaceutical company preparing to launch a new medication designed for the treatment of diabetes. By segmenting the physician population into meaningful clusters, the company aims to optimize its direct-to-physician marketing initiatives and increase outreach efficiency.
The dataset used for this segmentation includes several demographic and behavioral attributes of physicians that are believed to influence their prescription behavior and responsiveness to marketing. The attributes considered for clustering are as follows:
- Doctor Specialty – Refers to the physician’s area of medical expertise, such as endocrinology, general medicine, internal medicine, etc.
- Early Adopter Status – Indicates whether the physician typically adopts new medications and medical technologies early or waits until they become widely accepted.
- Physician’s Age – The chronological age of the doctor, which may influence experience, adaptability, and decision-making style.
- Gender – Gender information, which can potentially correlate with communication preferences and clinical behavior.
As neural network-based models such as SOMs require numerical input, all categorical variables in the dataset were converted into numeric form using appropriate encoding schemes. For instance, categorical variables like doctor specialty and gender were mapped to numerical identifiers, while early adopter status was converted into a binary variable. This transformation ensured that the data was compatible with the input requirements of the SOM while preserving the semantic meaning of each feature.
ii. SOM Training and Visualization
The Self-Organizing Map was then trained using the preprocessed data. The SOM architecture used in this study consisted of a two-dimensional grid of neurons, each capable of learning to represent a subset of the input space. During the training process, the SOM organizes itself such that similar input vectors are mapped to neighboring neurons, forming clusters based on multidimensional similarity.
Figure 8 illustrates the SOM neuron grid, where each neuron corresponds to a prototype vector and represents a distinct cluster in the input space. The density of input vectors mapped to each neuron is also visualized, providing insight into which clusters are more populated.
Figure 9 visualizes the topological organization of the SOM. In this figure, each neuron’s weight vector is depicted as a blue-gray dot. Neighboring neurons are connected using red lines, forming a structured grid that preserves topological relationships. The green dots scattered throughout the grid represent the actual input vectors (i.e., the physicians), showing how the input data has been distributed across the SOM.
This kind of visualization is crucial in understanding the internal organization of the data and identifying patterns, such as densely packed clusters of physicians with similar profiles or outlier physicians who may warrant special marketing consideration.
iii. Segmentation Results and Strategic Implications
The results of the SOM clustering process are summarized in Table 4, which shows the number of physicians grouped into each cluster or "chapter" of the SOM. These clusters represent subgroups of physicians who share similar characteristics across the defined dimensions—specialty, age, gender, and innovation adoption tendencies.
By leveraging this segmentation, the pharmaceutical firm can create more personalized and effective marketing strategies. For example, one cluster might consist predominantly of young endocrinologists who are early adopters—an ideal target group for introducing a novel diabetes treatment. Another cluster might consist of older general practitioners who adopt new medications more cautiously and may require more evidence-based literature and longer engagement cycles.
This targeted approach to segmentation allows the company to:
- Allocate Marketing Resources Efficiently – Resources can be focused on high-potential segments, reducing wasteful spending on less responsive groups.
- Customize Messaging and Campaigns – Each segment can be addressed with communication tailored to their preferences, specialties, and behaviors.
- Improve Conversion Rates – Personalized engagement is more likely to lead to prescriptions of the new medication, thereby increasing overall success.
- Monitor and Evaluate Campaign Impact – Segmentation facilitates performance tracking within each cluster, allowing for more granular assessment of strategy effectiveness.
In summary, the SOM-based segmentation of physicians provides the pharmaceutical firm with a data-driven foundation for strategic decision-making. It not only enhances the precision of marketing campaigns but also fosters stronger, more effective engagement with the medical community. This approach exemplifies the power of unsupervised learning in uncovering actionable insights from complex, multi-dimensional data.
7. Conclusions
This study presented a comprehensive comparison between neural networks and fuzzy logic systems for tackling both prediction and classification challenges in real-world business contexts. Specifically, two predictive case studies were explored—stock market index forecasting and sales forecasting—alongside one classification task focused on market segmentation using clustering techniques. The analysis aimed to evaluate the effectiveness, accuracy, and practical utility of these two computational intelligence paradigms in handling diverse types of problems.
The results indicate that both neural networks and fuzzy logic systems are competent tools in modeling complex and nonlinear systems. Each method has unique advantages and is suitable for specific types of applications depending on the problem characteristics and the nature of the data. However, neural networks demonstrated superior performance in terms of predictive accuracy, particularly when evaluated using statistical metrics such as the Mean Squared Error (MSE). The ability of neural networks to learn patterns directly from raw input data without explicit rule formulation allows them to achieve lower prediction errors and adapt more flexibly to dynamic environments.
For the classification task involving market segmentation, Self-Organizing Maps (SOMs)—a type of unsupervised neural network—proved to be particularly effective. The SOM algorithm enabled the formation of intuitive and visually interpretable clusters of physicians based on multiple demographic and behavioral features. This approach not only facilitated the identification of meaningful subgroups within the market but also provided actionable insights for personalized marketing strategies, especially in the pharmaceutical domain.
Fuzzy logic, on the other hand, offered interpretability and ease of rule-based modeling, which is particularly valuable in scenarios where domain knowledge is available and transparency is essential. It allows decision-makers to incorporate human-like reasoning and linguistic variables into computational models. While not as precise in numerical prediction as neural networks, fuzzy logic systems excel in scenarios that require explainable decision-making processes.
In conclusion, the choice between neural networks and fuzzy logic systems should be guided by the specific problem at hand, the nature and quality of the data, and the end-user requirements—be it accuracy, interpretability, or adaptability. Neural networks, especially architectures like SOM, are highly suited for tasks that demand high precision and automated pattern discovery, such as forecasting and clustering. Fuzzy logic, meanwhile, remains valuable for applications requiring human-interpretable rules and logic-driven inference.
Future work could explore the integration of both methods into hybrid systems, leveraging the learning capabilities of neural networks and the interpretability of fuzzy logic. Such neuro-fuzzy models have the potential to deliver the best of both worlds—high accuracy combined with transparent decision-making. Additionally, the study opens avenues for applying these techniques across other domains such as healthcare analytics, customer behavior modeling, and financial risk assessment, where intelligent and adaptive systems are increasingly in demand.
References
- Nandadeepa, B. Artificial Intelligence: Biologically inspired intelligent robots using artificial muscles. International Journal of Innovative Research in Computer and Communication Engineering 2014, 2, 915–921. [Google Scholar]
- Feo, T.A.; Resende, M.G.C. Greedy Randomized Adaptive Search Procedures. Journal of Global Optimization 1995, 6, 109–133. [Google Scholar] [CrossRef]
- Hicham, A.; Mohammed, B.; Abdellah, E.F. Sales Forecasting Based on ERP System through Delphi, fuzzy clustering and Back-Propagation Neural Networks with adaptive learning rate. International Journal of Computer Science Issues 2012, 9, 24–34. [Google Scholar]
- Aiex, R.M.; Ribeiro, C.C.; Resende, M.G.C. Probability distribution of solution time in GRASP: An experimental investigation. Journal of Heuristics 2002, 8, 343–373. [Google Scholar] [CrossRef]
- Liu, Y.; Kiang, M.; Brusco, M. A unified framework for market segmentation and its applications. Expert Systems with Applications 2012, 39, 10292–10302. [Google Scholar] [CrossRef]
- Aleksendrić, D.; Carlone, P. Soft computing techniques. In Soft Computing in the Design and Manufacturing of Composite Materials; Woodhead Publishing: Oxford, 2015; pp. 39–60. [Google Scholar] [CrossRef]
- Vellido, A.; Lisboa, P.J.G.; Vaughan, J. Neural networks in business: a survey of applications. Expert Systems with Applications 1999, 17, 51–70. [Google Scholar] [CrossRef]
- Amirkolaii, K.N.; Baboli, A.; Shahzad, M.K.; Tonadre, R. Demand forecasting for irregular demands in business aircraft spare parts supply chains by using artificial intelligence (AI). IFAC-Pap. 2017, 50, 15221–15226. [Google Scholar] [CrossRef]
Figure 1.
shows a graph of the real and expected market price during neural network research.
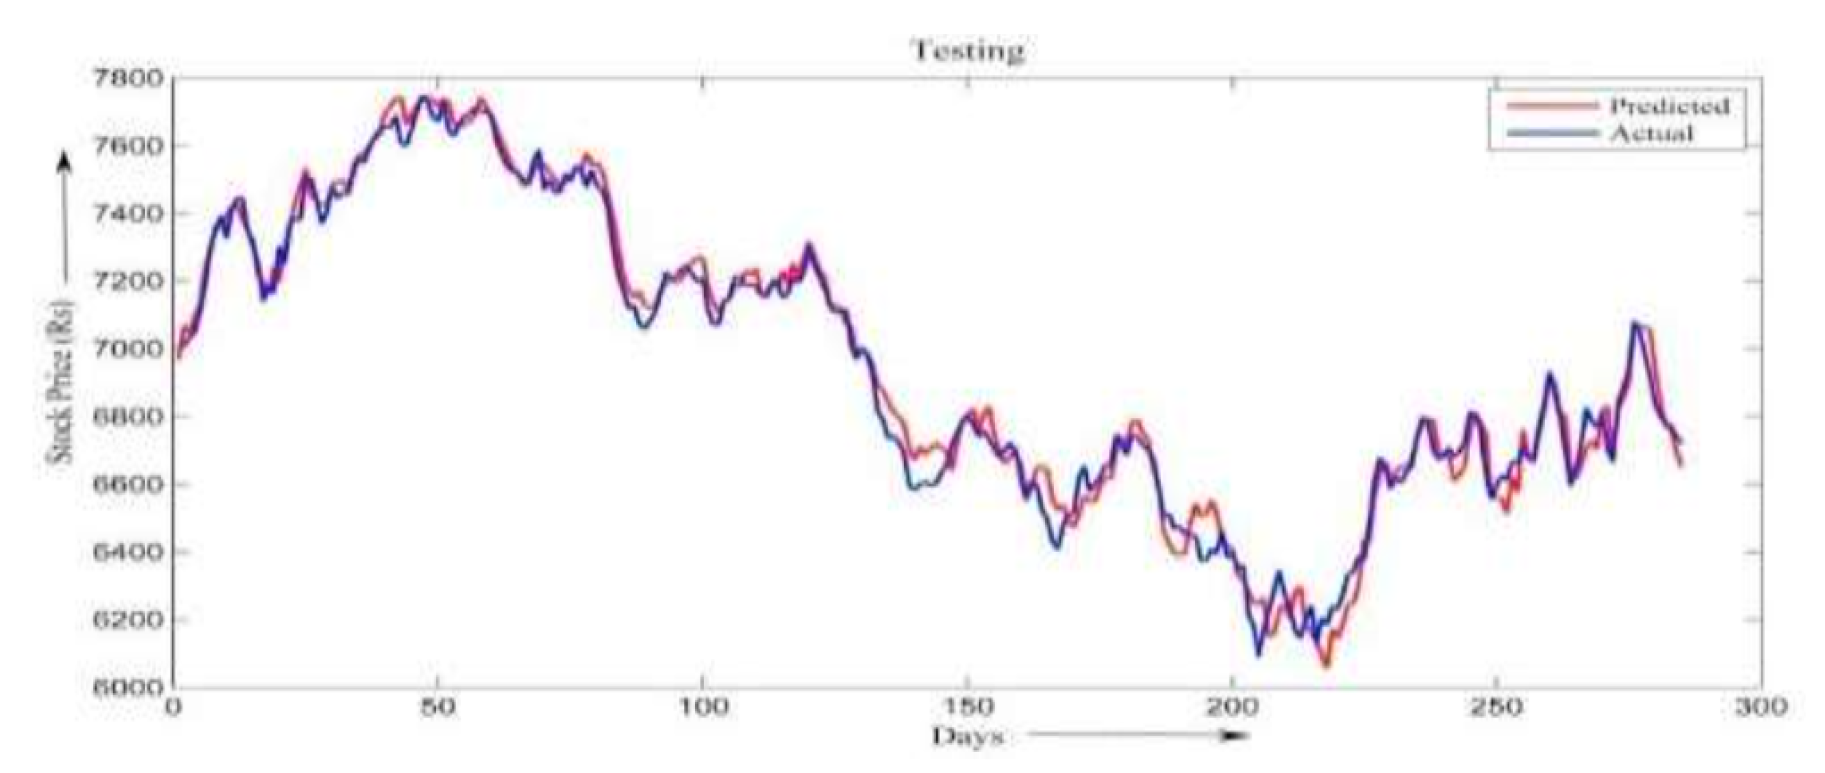
Figure 2.
ANN Model Mean Squared Error Metrics
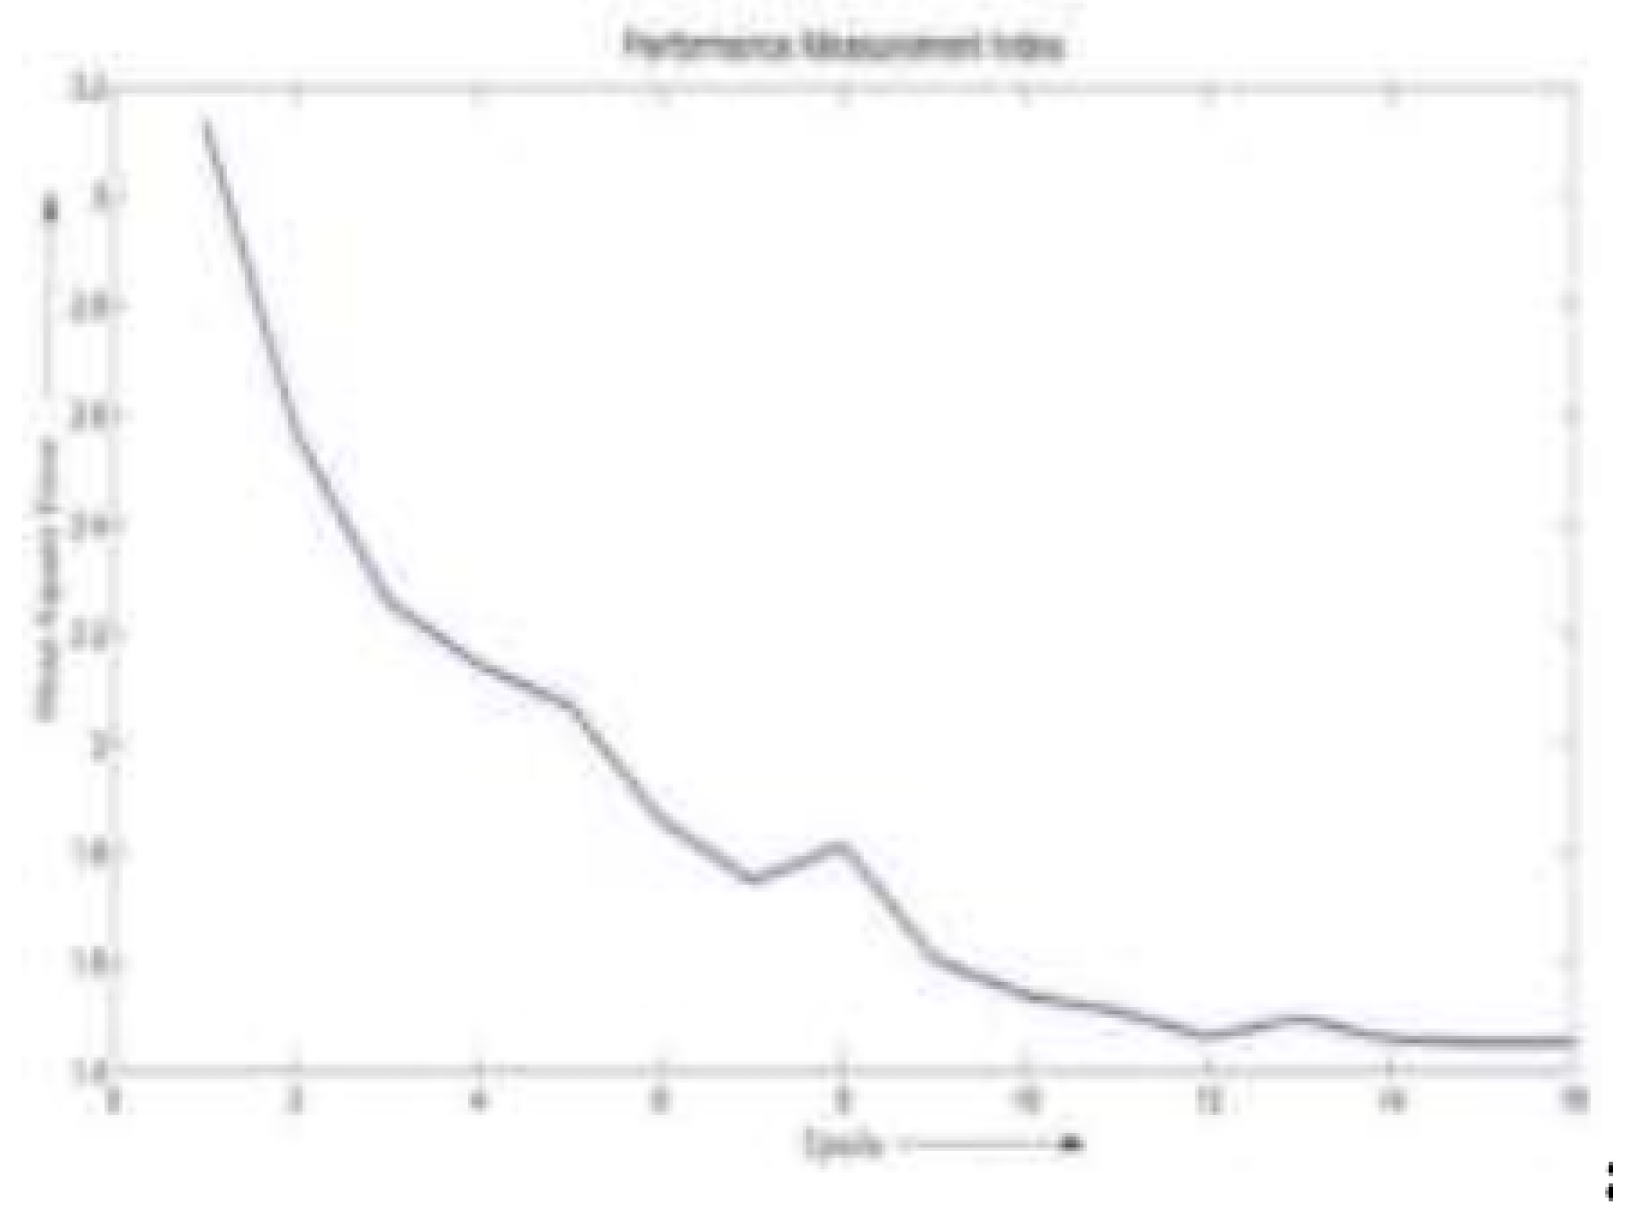
Figure 3.
Mean Square Errors of Fuzzy Logic Model
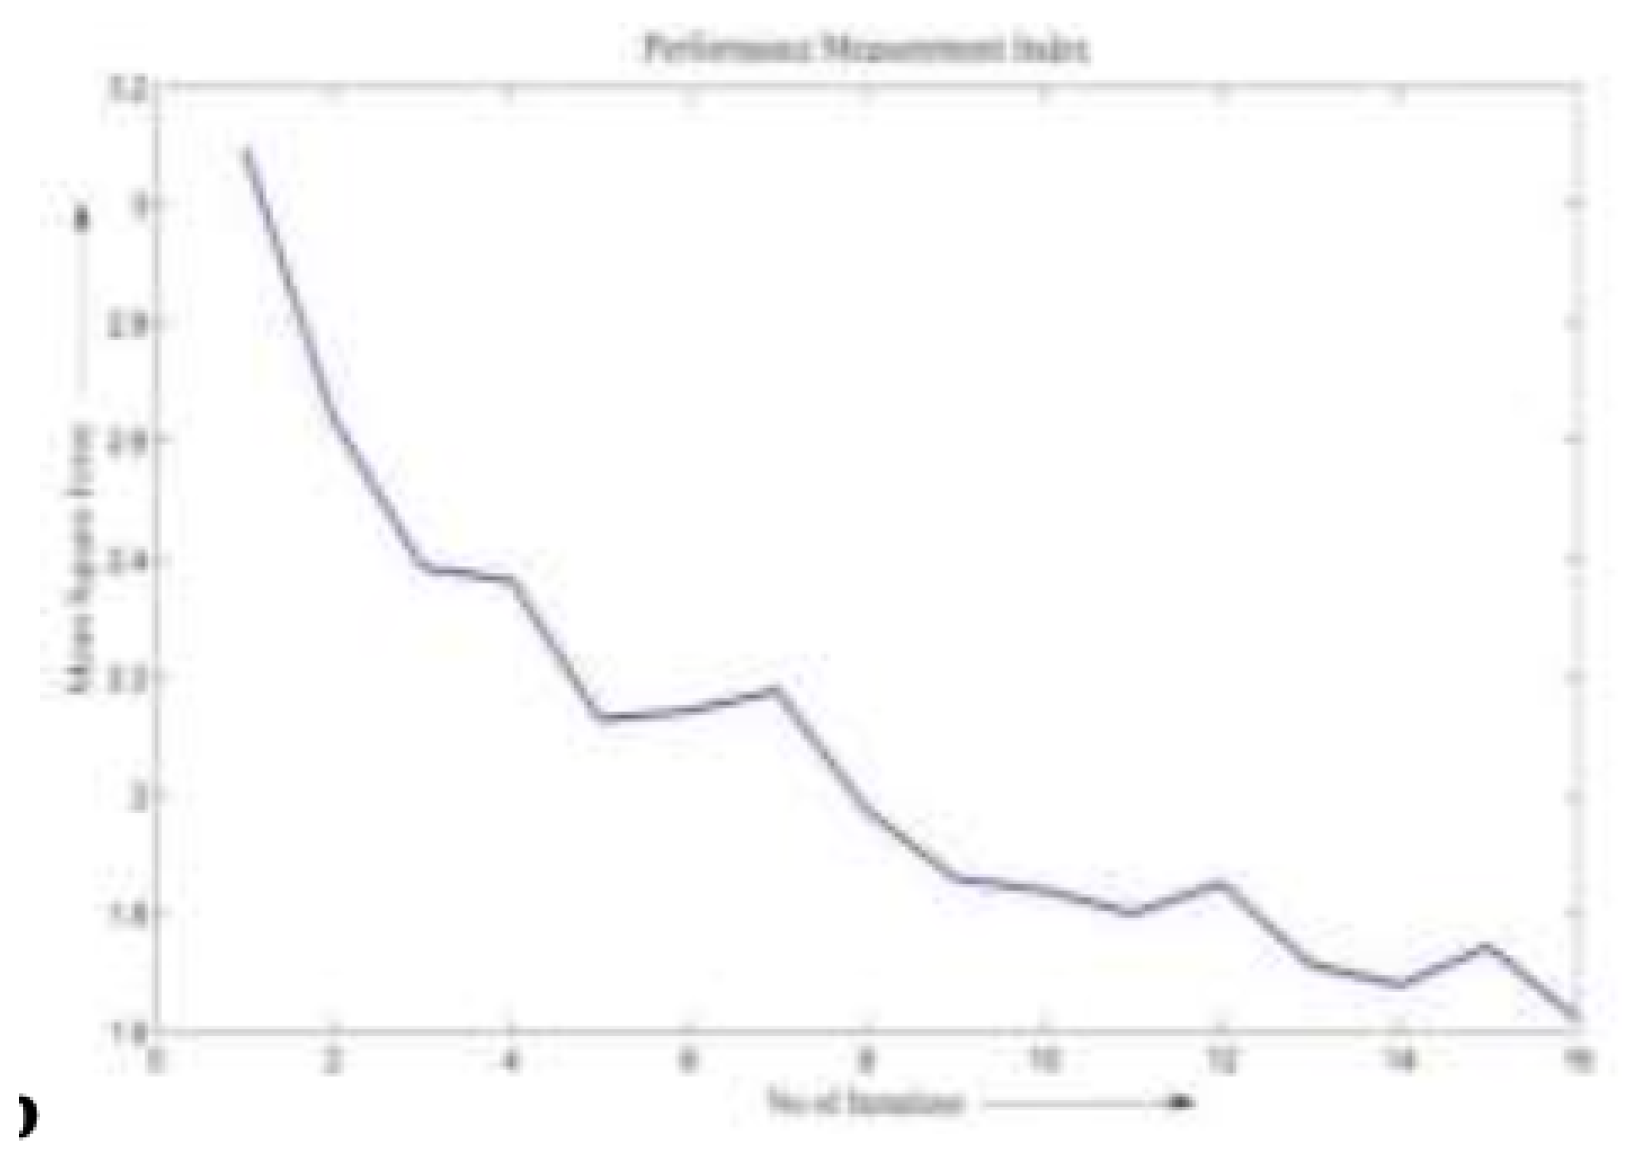
Figure 5.
.
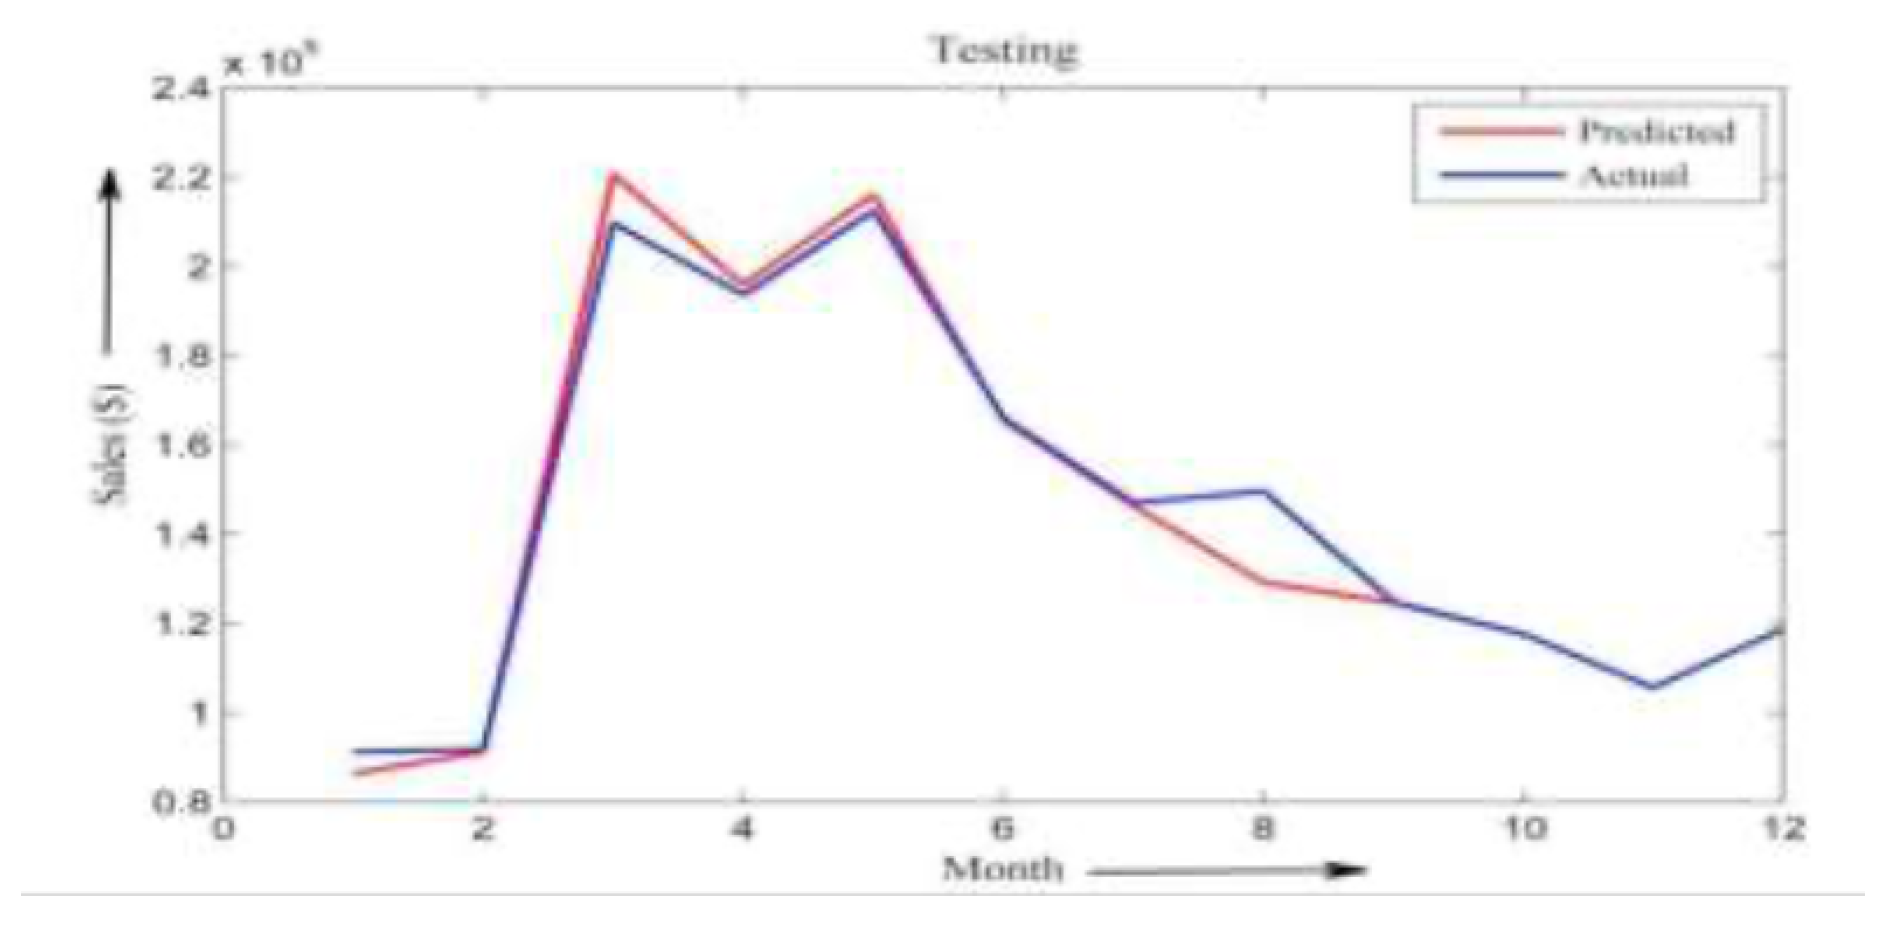
Figure 6.
Graphs of MSE vs. Number of Iterations for Data Set I for ANN
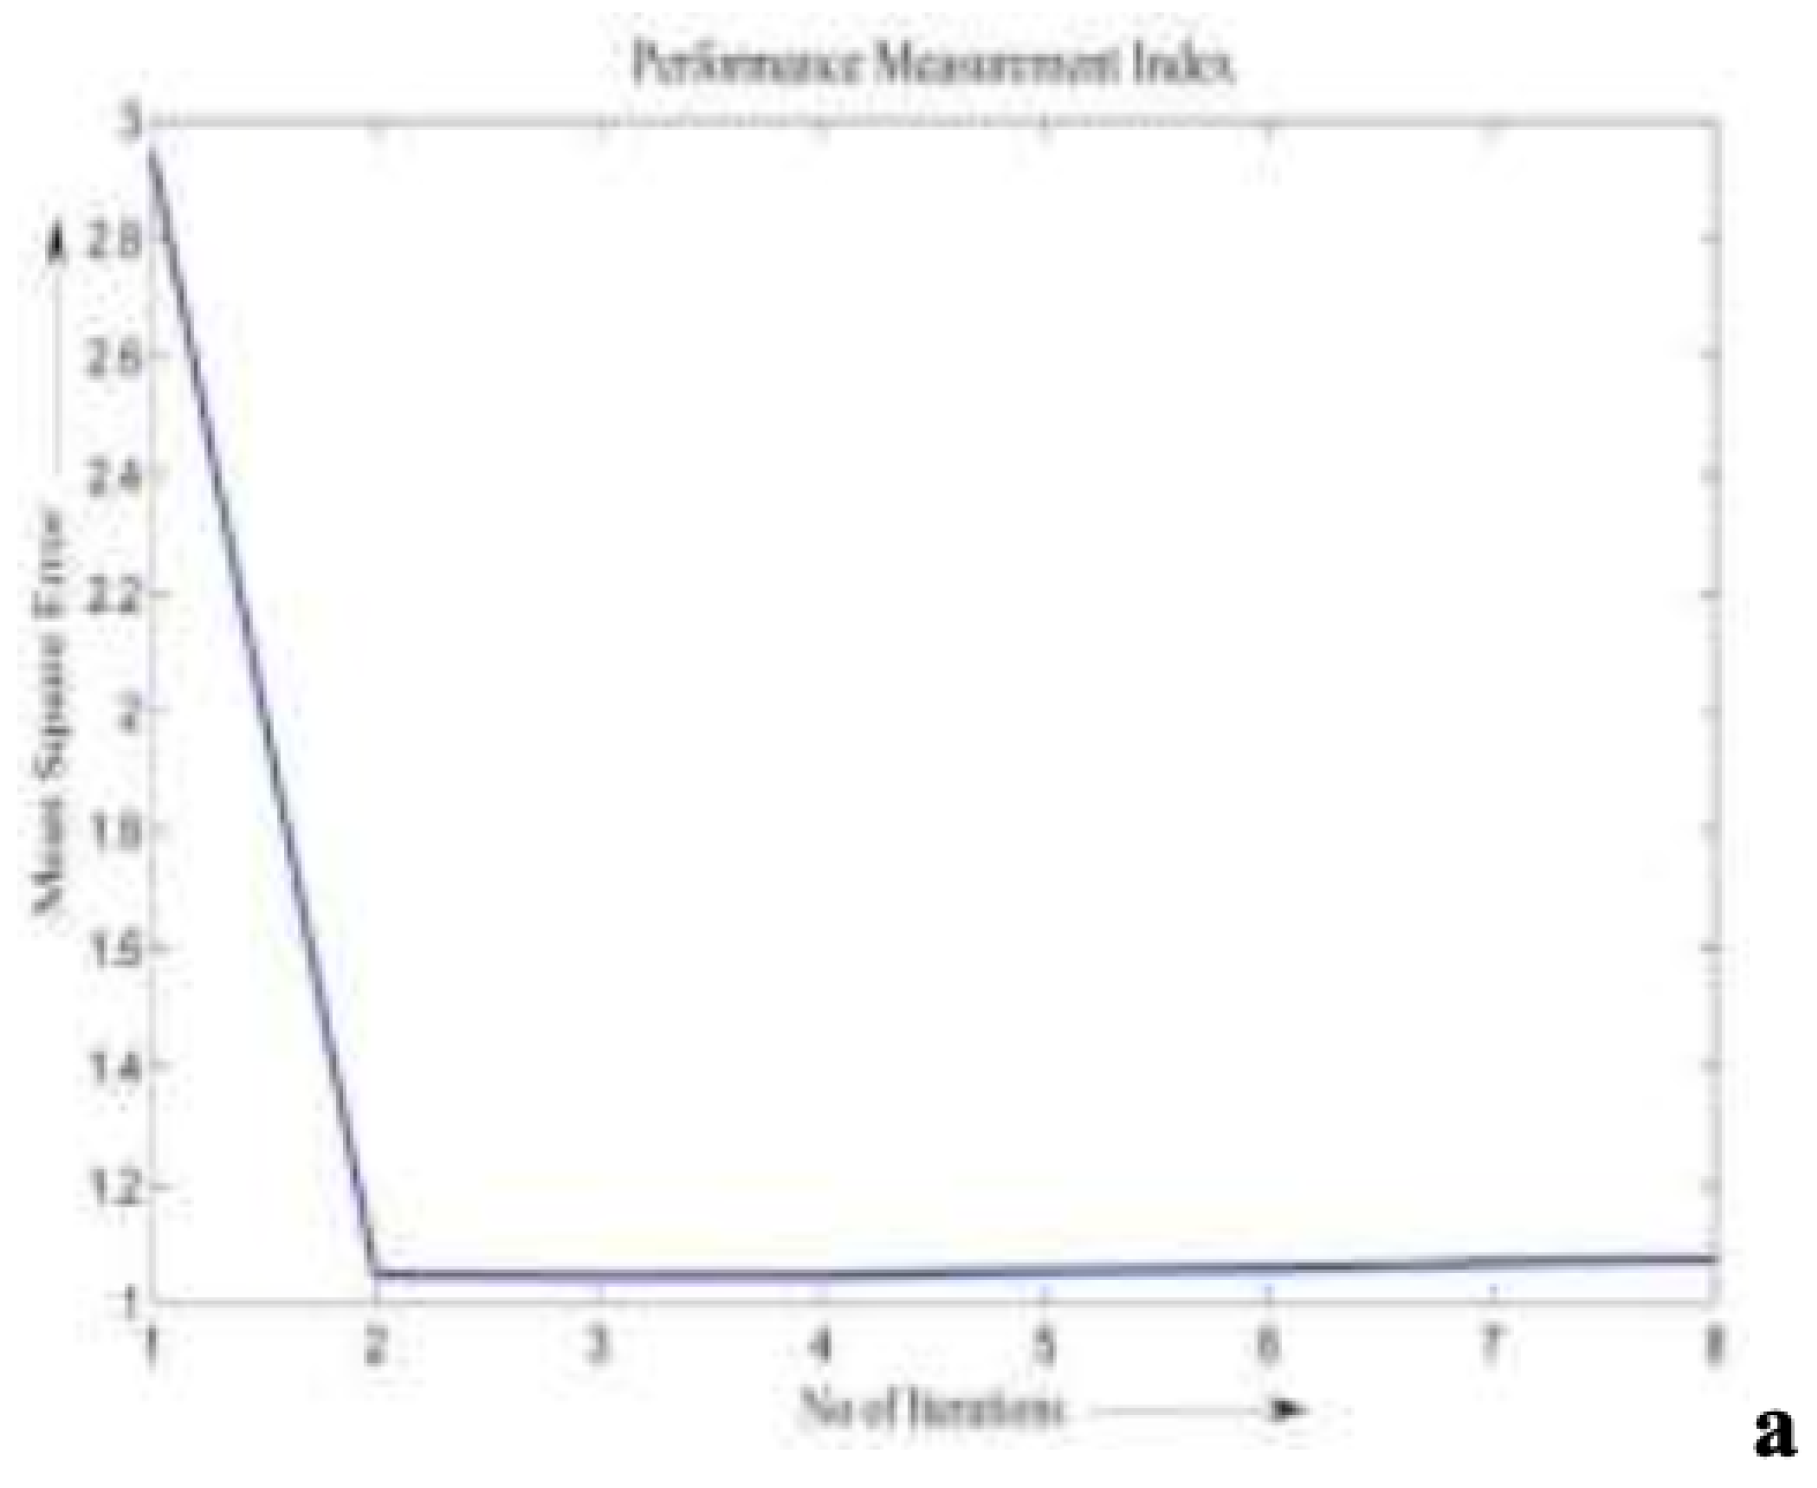
Figure 7.
Graphs of MSE vs. Number of Iterations for Data Set I for Fuzzy.
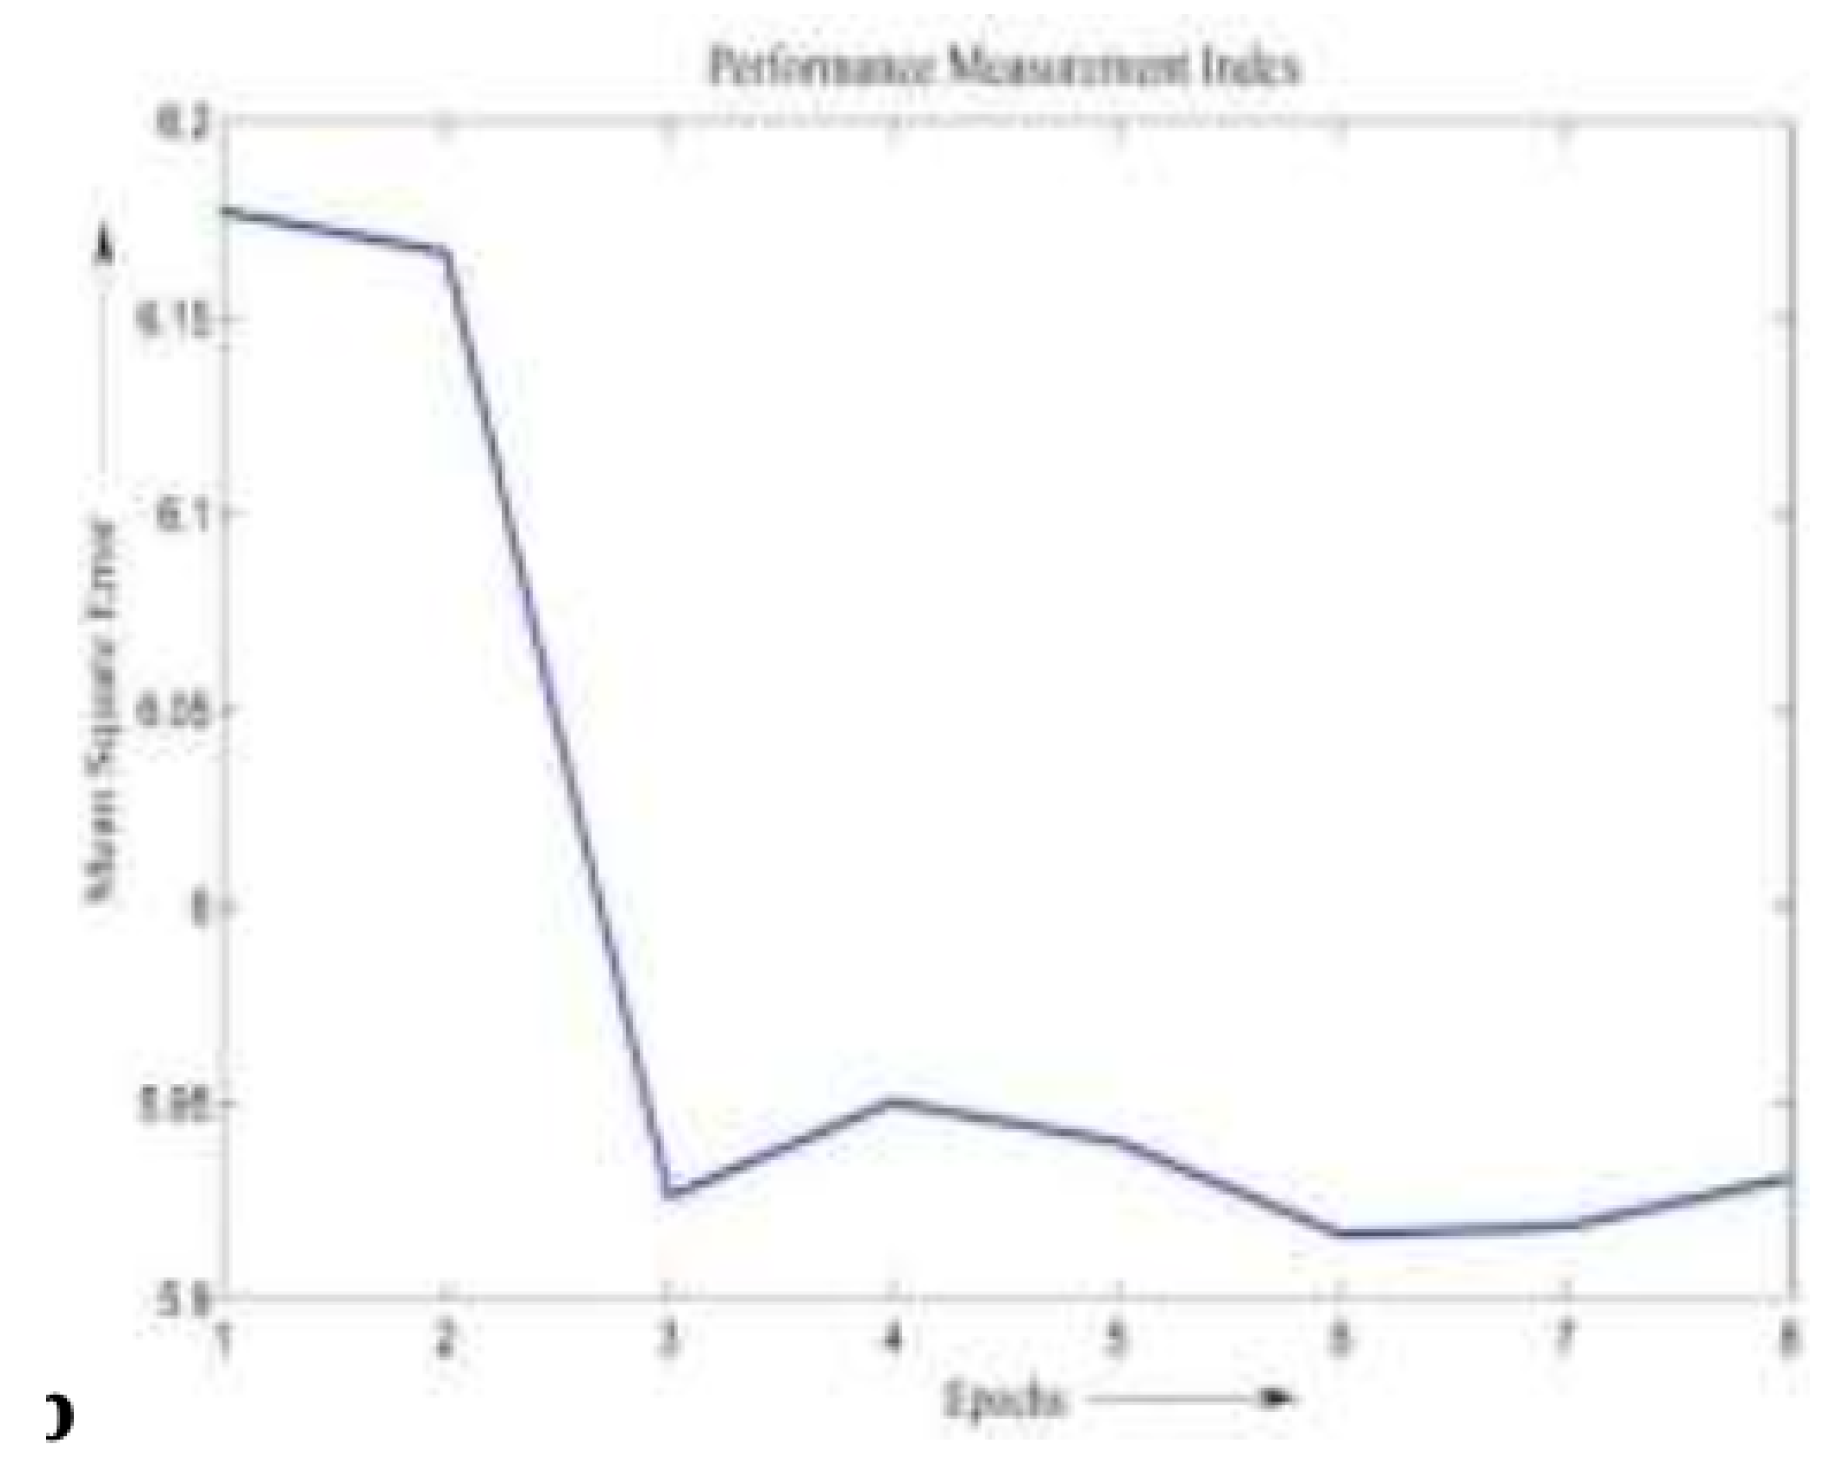
Figure 8.
shows a comparison of real and expected sales during neural network research (Data Set II).
Figure 8.
shows a comparison of real and expected sales during neural network research (Data Set II).
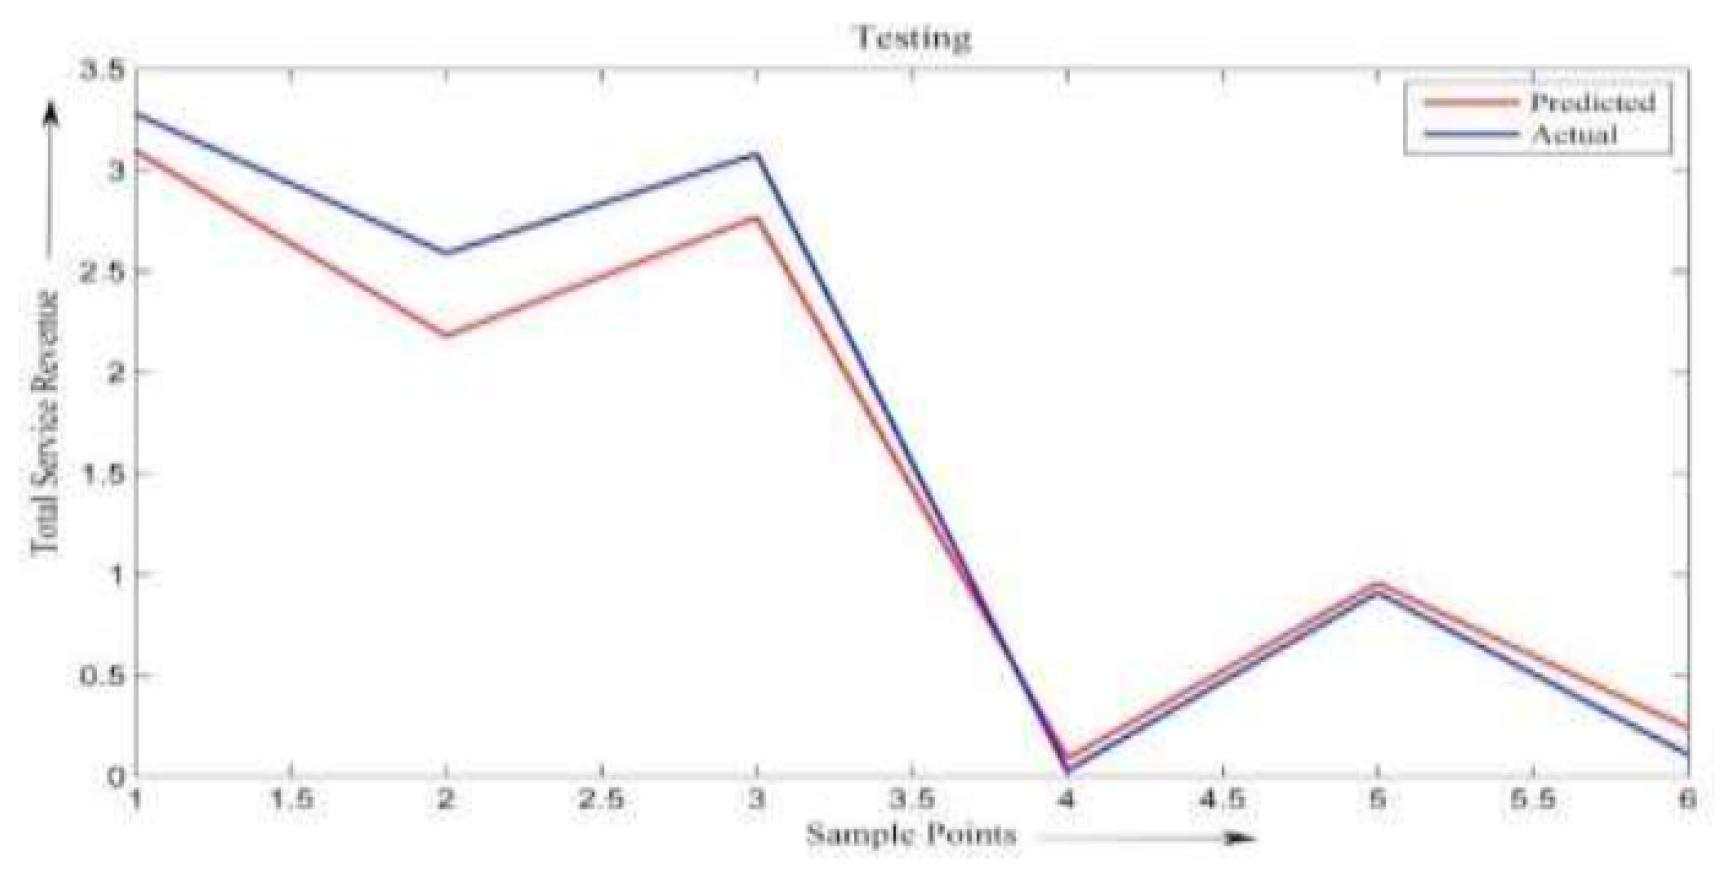
Figure 9.
Graphs of MSE vs. Iteration for Data Set II for ANN
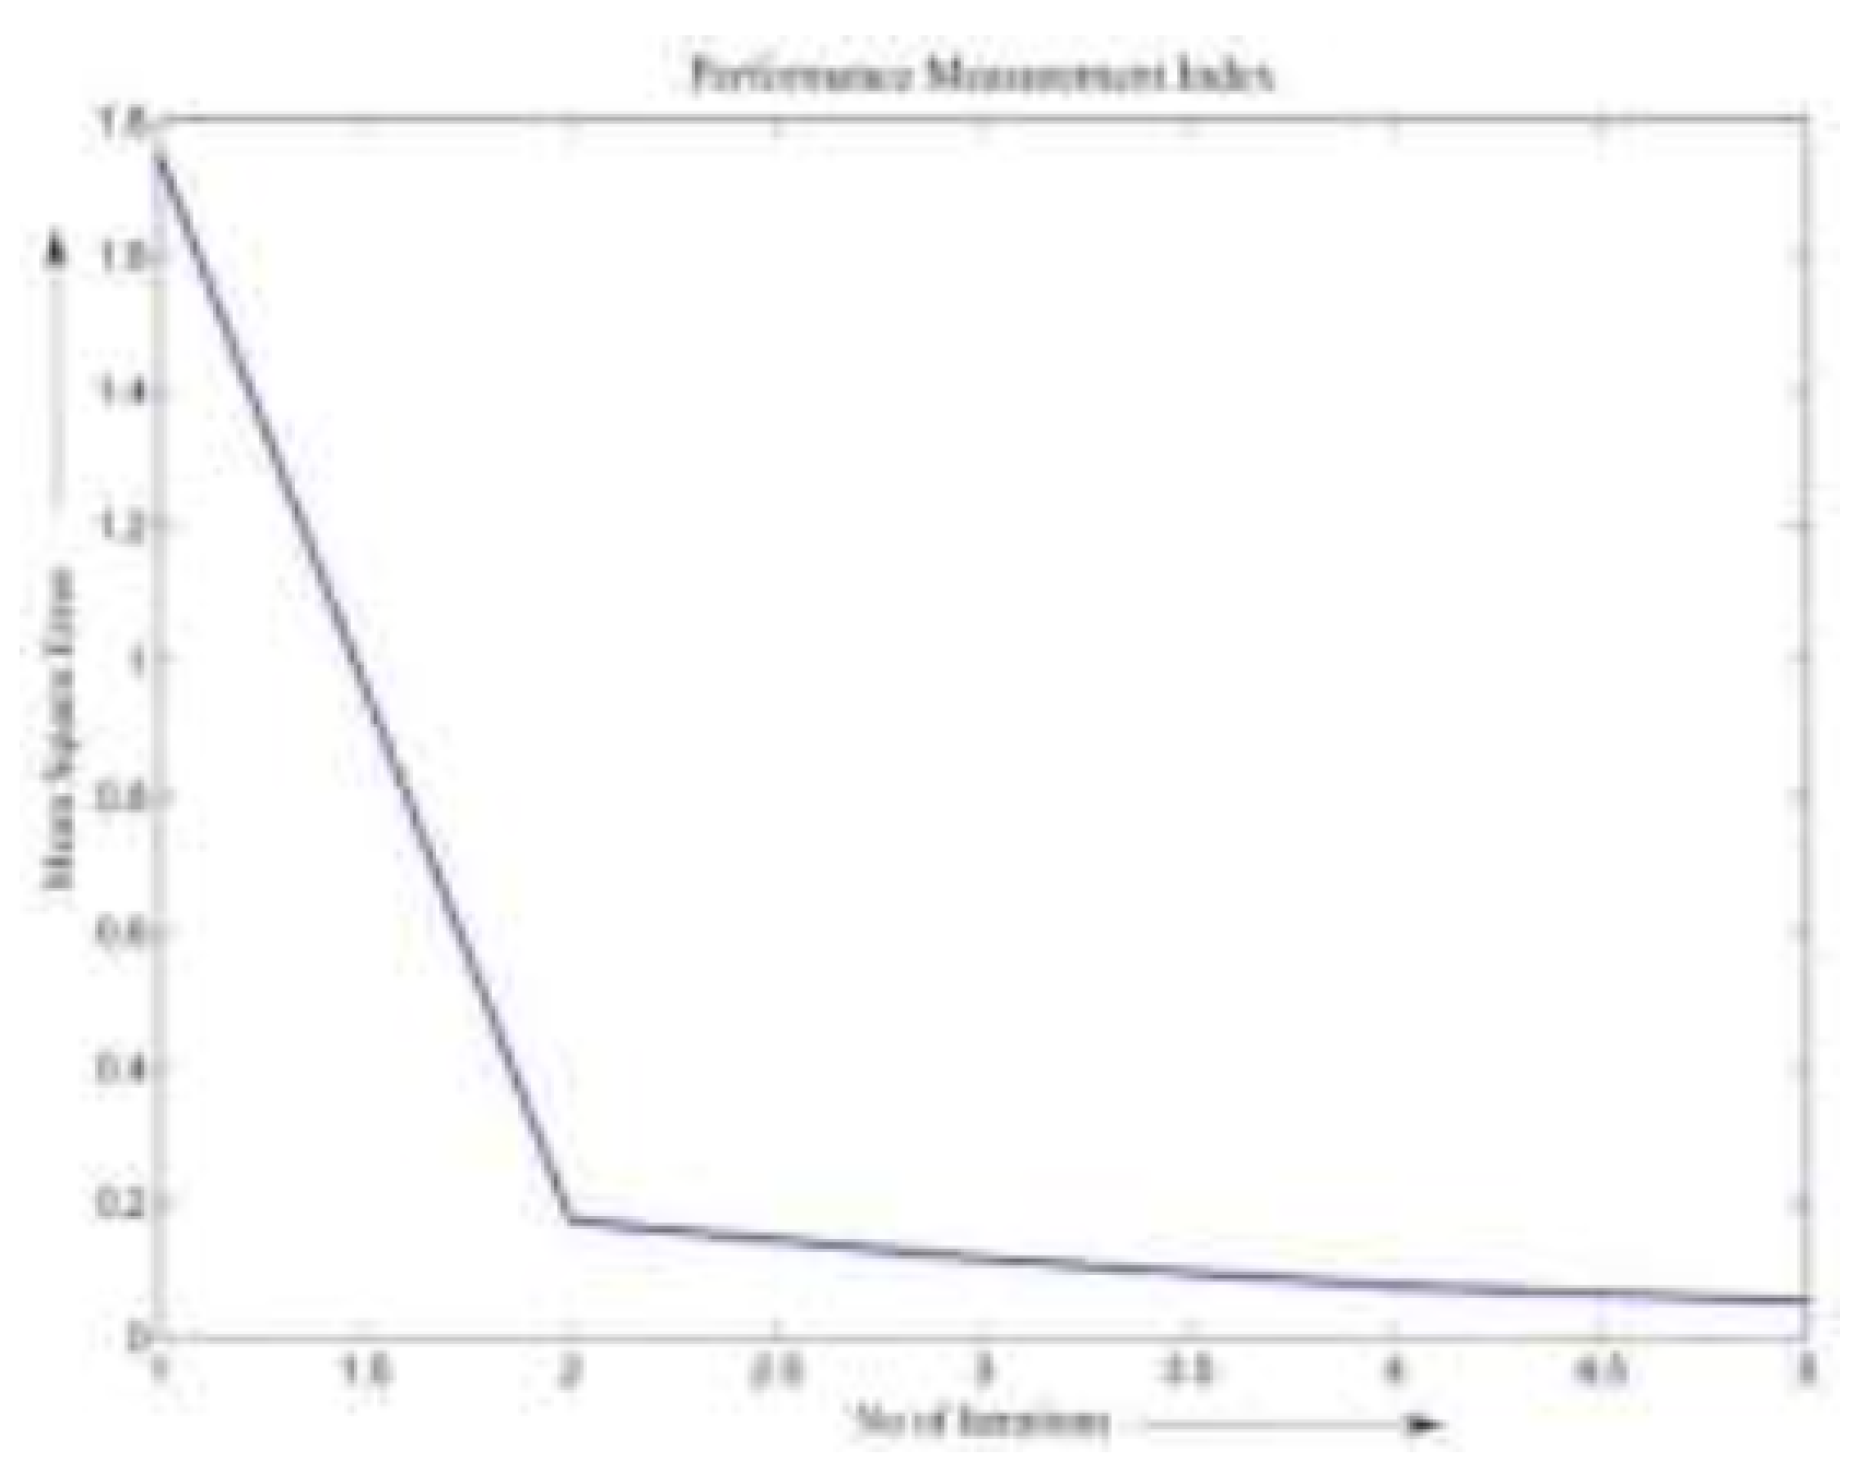
Figure 10.
Graphs of MSE vs. Iteration for Data Set II for Fuzzy logic.
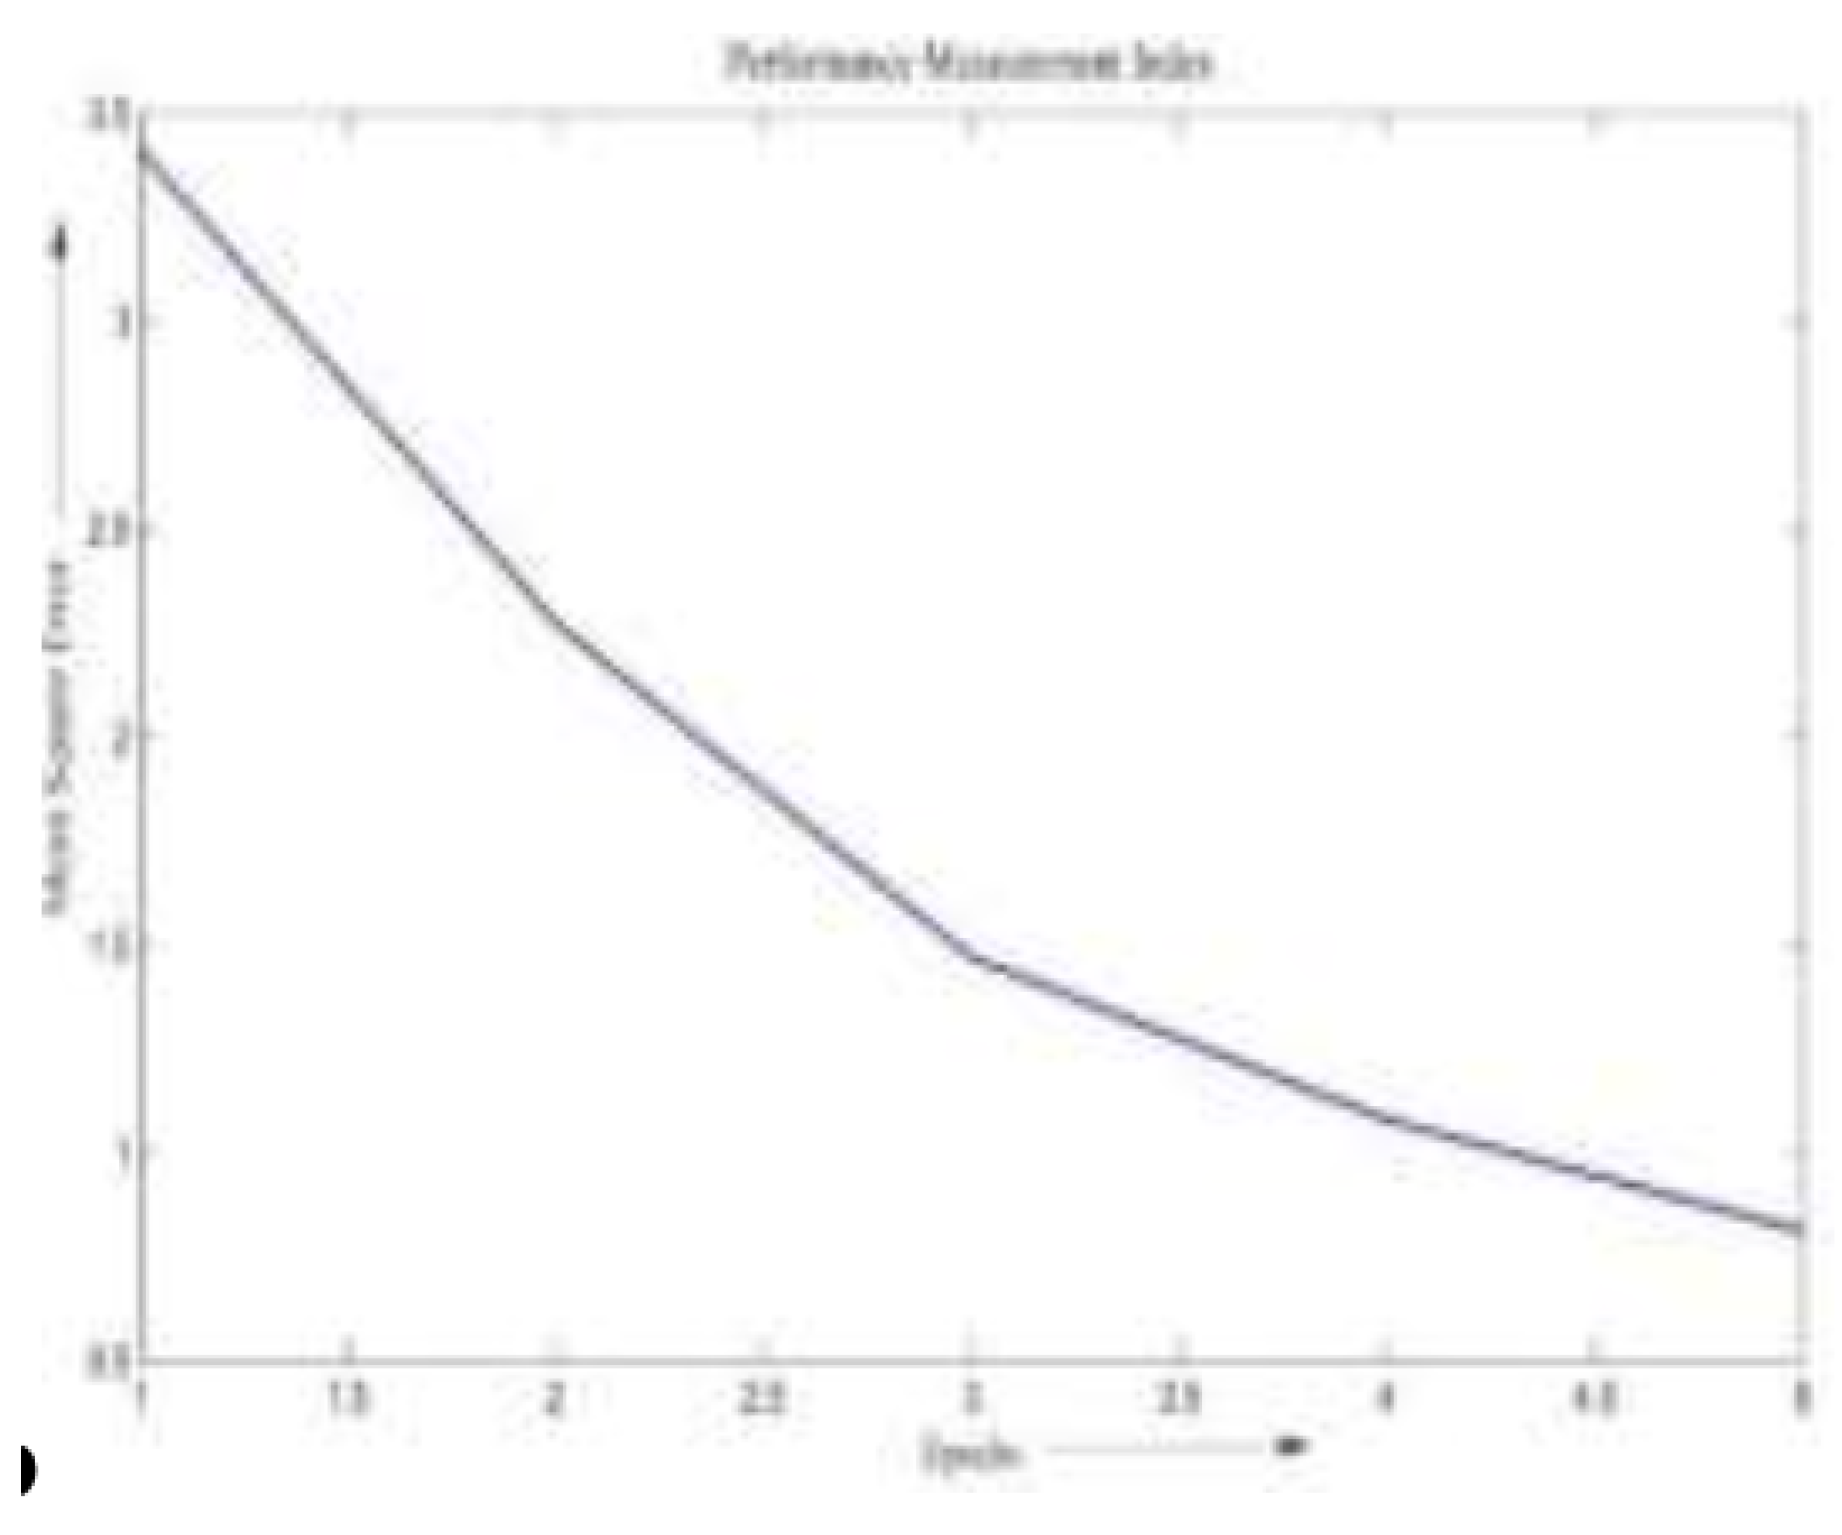
Table 3.
compares the expected techniques’ performance for Data Set II
| Prediction Technique | Mean Square Error (MSE) | Accuracy (%) |
|---|---|---|
| ANN | 0.82 | 93.61 |
| Fuzzy | 0.06 | 97.90 |
Table 4.
Number of Physicians per Division
| Division No | Number of Physicians |
|---|---|
| Div 1 | 188 |
| Div 2 | 226 |
| Div 3 | 178 |
| Div 4 | 192 |
| Div 5 | 219 |
Disclaimer/Publisher’s Note: The statements, opinions and data contained in all publications are solely those of the individual author(s) and contributor(s) and not of MDPI and/or the editor(s). MDPI and/or the editor(s) disclaim responsibility for any injury to people or property resulting from any ideas, methods, instructions or products referred to in the content. |
© 2025 by the authors. Licensee MDPI, Basel, Switzerland. This article is an open access article distributed under the terms and conditions of the Creative Commons Attribution (CC BY) license (http://creativecommons.org/licenses/by/4.0/).
Copyright: This open access article is published under a Creative Commons CC BY 4.0 license, which permit the free download, distribution, and reuse, provided that the author and preprint are cited in any reuse.


