
Submitted:
01 August 2025
Posted:
02 August 2025
You are already at the latest version
Abstract
Background: Reduced tissue sensitivity to insulin, as well as the associated increased risk of gestational diabetes mellitus is genetically controlled and often varies racially and geo-graphically. Roma populations constitute a genetically autonomous society with particu-larities in their type of sociability, while they are reported to have an increased prevalence of type 2 diabetes mellitus, which is pathophysiologically related to insulin resistance.
Objectives: The aim of this study was to investigate the level of insulin sensitivity in pregnancies of Roma mothers compared to controls.
Methods: A total of 65 pregnancies were studied during the third trimester, divided in 33 Roma mothers (RP) and 32 mothers of European descent to serve as control volunteers (CP). The presence of Gestational Diabetes was confirmed according to the WHO diagnos-tic criteria by 75 mg Oral Glucose Tolerance Test and insulin resistance status by the means of HOMA-IR index.
Results: The mean fasting insulin levels as well as the mean HOMA-IR index were statis-tically significantly higher in Roma population (p=0.0013) and (p< 0.001) respectively, re-gardless of age and BMI of the participants. Gestational Diabetes Mellitus developed in 7 women (10.7%), 5 of whom were Roma (15.1%) and in 2 Controls (6.2%)(p=0.247).
Conclusions: Increased insulin resistance is observed in Roma pregnancies, so it would be beneficial to provide these women with appropriate counseling focused on healthy diet and lifestyle.
Keywords:
Roma
; pregnancy
; gestational diabetes mellitus
; HOMA-IR
; insulin resistance
; oral glucose tolerance test
1. Introduction
Gestational Diabetes Mellitus (GDM) is a common complication of pregnancy, in which abnormal hyperglycemia is detected for the first time during pregnancy [1]. According to the most recent (2017) estimates of the International Diabetes Federation (IDF), GDM complicates approximately 14% of pregnancies worldwide, a percentage that corresponds to approximately 18 million births per year [2]. Although GDM resolves after childbirth, it may relate to long-term health consequences for the mothers and the neonates as well. More specifically, mothers are at an increased risk of developing type 2 diabetes mellitus (T2DM) later in life and possibly to the development of cardiovascular disease (CVD). The fetus is at greater risk for childhood obesity, as well as for T2DM, and consequently for CVD in adult life. This phenomenon appears to lead to the transmission of predisposition to obesity and diabetes from generation to generation, which affects the health of the population [3].
During a normal pregnancy, the mother’s body undergoes a series of changes in its physiology, to support the demands of the developing fetus. These include adaptations to the cardiovascular, urinary, hematopoietic, respiratory systems and metabolism. An important metabolic parameter that varies during pregnancy is insulin sensitivity that changes depending on the demands of pregnancy. According to the prevailing theory, during early pregnancy, insulin sensitivity remains stable or even increases, promoting glucose uptake into adipose tissue stores in preparation for the energy demands for the later pregnancy [4]. However, as pregnancy progresses, a surge of a hormonal array including estrogens, progesterone, leptin, cortisol, placental lactogen, and placental growth hormone with paracrine, endocrine, and placental effect may collectively promote insulin resistance [5]. As a result, blood glucose is slightly elevated, which favors its transport across the placenta to fuel fetal development. This mild state of insulin resistance also promotes endogenous glucose production and the breakdown of fat stores, resulting in further increases in blood glucose and free fatty acid concentrations [6]. The development of GDM, expressed as abnormal hyperglycemia during pregnancy, is the clinical manifestation of a greater degree of insulin resistance state. In these pregnancies, due to genetic or other factors, it is likely that lower insulin sensitivity exists both before and following pregnancy [7]. The vast majority (~80%) of GDM cases present as β-cell dysfunction in a background of chronic insulin resistance, which leads the pregnant woman unable to adequately cope with the metabolic changes that occur during gestation [8].
Several risk factors for developing GDM have been studied [9]. These include pre-gestational obesity of the mothers, excessive weight gain during pregnancy, unhealthy diet, ethnicity, genetic background, advanced maternal age, low or high maternal birth weight, and personal history of GDM, or other insulin resistance conditions, such as polycystic ovary syndrome (PCOS) [9].
The prevalence of GDM also varies worldwide due to different screening methods and diagnostic criteria [10,11,13]. The HAPO study was undertaken in response to the need to establish internationally agreed diagnostic criteria for gestational diabetes, based on their predictive value for adverse pregnancy outcomes. Increase in each of the three time-values on the 2-hour 75-gram oral glucose tolerance test are associated with graded increases in the likelihood for events of pregnancy complications, such as large-for-gestational-age fetuses, need of cesarean section, abnormal fetal insulin levels, and neonatal fat content. A diagnosis of GDM is recommended when any of the following three values on the 2-hour 75-gram oral glucose tolerance test (OGTT) were met or exceeded: 92 mg/dL at fasting, 180 mg/dL at one hour, 153 mg/dL at two hours. These criteria were also adopted by the World Health Organization (WHO) guidelines in 2013.
The euglycemic insulin curve and the intravenous glucose tolerance test (IVGTT) are standard methods for measuring insulin resistance in research, but they are impractical in clinical practice and difficult to use in large population studies [15]. HOMA-IR (homeostatic model assessment) is accepted as a reliable index of insulin resistance state, with an advantage of being easy to obtain. Fasting insulin and glucose levels are used in the calculations for the homeostasis model assessment (HOMA), specifically HOMA-IR = glucose X insulin/405. This model was first described by Matthews et al. in 1985 [16].
As mentioned above, insulin resistance, or the occurrence of gestational diabetes mellitus, is influenced by racial and ethnic components. A very special and distinct ethnic group is the Roma population, primarily residing in Central and Eastern Europe, with Indian origins. They are defined by a shared culture and various similar Romani languages, and more often they live in segregated communities or on the outskirts of towns and have abandoned the nomadic life. Data provided by social sciences, as well as genetic research, suggest that the 8-10 million Roma (Gypsies) living in Europe today are best described as a society of genetically isolated populations [17]. The relationship between the traditional social structures observed among Roma, where race is the main unit, and the boundaries, demographic history and biological kinship of their different ancestral communities appears complex and has not been analyzed by population genetic studies [18]. Recent genetic research has identified several new, or previously known, but rare, conditions caused by common mutations. The limited epidemiological data available suggest a non-random distribution of disease-causing mutations among Roma groups [19].
Examples of such diseases are three neurological disorders, namely the hereditary motor and sensory neuropathies of the Lom and Russe types, and the facial dysmorphic neuropathy syndrome with congenital cataract [19]. Accordingly, some of the existing studies, specifically those by Enache et al and Živkovic et al, indicate an increased prevalence of diabetes mellitus in Roma populations [20,21]. Also, based on Piko et al, Roma population appears to have a greater genetic predisposition to insulin resistance status compared to other Caucasians [22]. Even more is suggested that GDM prevalence is higher among Roma populations compared to non-Roma but the information is scarce and the racial diversity or their lifestyle varies significantly. We therefor decided to study a distinct Greek Roma pregnant population, residing in the suburbs of the city of Kalamata in Greece, covered by the health services of the local hospital
2. Materials and Methods
2.1. Materials
- Our study population were Roma pregnant mothers aged 18 to 35 years old.
- Their BMI at the beginning of pregnancy and after the completion of pregnancy did not exceed the index of 30.
- Mothers with pre-existing diabetes were excluded.
- Samples and data from non-Roma volunteers of European decent with the same age and BMI, served as the control group.
2.2. Methods
- Fasting glucose and insulin samples from the women’s plasma were used to determine the HOMA-IR index, to determine insulin resistance.
- Data was collected from the medical history of women and their newborns from the Hospital’s archives, and anthropometric data were obtained from women who became pregnant within the study period.
2.3. Statistical Analysis
Quantitative variables were expressed as mean values (Standard Deviation) and as median (interquartile range), while categorical variables were expressed as absolute and relative frequencies. For the comparison of proportions chi-square and Fisher’s exact tests were used. Student’s t-tests and Mann-Whitney tests were used for the comparison of continuous variables between two groups. Multiple linear regression analysis was used with dependent variable women’s HOMA-IR index at 3rd trimester. The regression equation included terms for age, race and after pregnancy BMI. Adjusted regression coefficients (β) with standard errors (SE) were computed from the results of the linear regression analysis. All reported p values are two-tailed. Statistical significance was set at p<0.05 and analyses were conducted using SPSS statistical software (version 27.0).
3. Results
3.1. Results of the Study
3.1.1. Demographic Characteristics of the Population (Table 1)
- Data from 65 women were collected, with mean age 26.2 years (SD=5.7 years). Almost half of them (49.2%) were controls, and the rest (50.8%) were ROMA mothers.
- Women’s demographical characteristics are presented in Table 1.
- The number of children was significantly greater in the ROMA group (p=0.028), as well as the percentage of smokers (p<0.001).
- Women in the Roma group were significantly younger than those in the Control group (p<0.001).

Table 1.
Sample’s demographical characteristics, in total sample and by population.
| Total sample (n=65; 100%) | Group | P | |||
|---|---|---|---|---|---|
| Controls (n=32; 49.2%) |
ROMA (n=33; 50.8%) |
||||
| n (%) | n (%) | n (%) | |||
| Multiparous (number of children) | |||||
| 1 | 27 (41.5) | 17 (53.1) | 10 (30.3) | 0.028+ | |
| 2 | 26 (40) | 13 (40.6) | 13 (39.4) | ||
| 3-4 | 12 (18.5) | 2 (6.3) | 10 (30.3) | ||
| Abortuses history | 9 (13.8) | 5 (15.6) | 4 (12.1) | 0.733++ | |
| PCO | 1 (1.5) | 0 (0) | 1 (3) | >0.999++ | |
| Smoking | 29 (44.6) | 3 (9.4) | 26 (78.8) | <0.001+ | |
| Cardiovascular disease | 3 (4.6) | 1 (3.1) | 2 (6.1) | >0.999++ | |
| Chronic lung disease | 2 (3.1) | 1 (3.1) | 1 (3) | >0.999++ | |
| Chronic liver disease | 1 (1.5) | 0 (0) | 1 (3) | >0.999++ | |
| Chronic renal disease | 0 (0) | 0 (0) | 0 (0) | - | |
| Immuno-compromised condition | 1 (1.5) | 0 (0) | 1 (3) | >0.999++ | |
| Neurologic disorder | 3 (4.6) | 1 (3.1) | 2 (6.1) | >0.999++ | |
| Psychiatric disorder | 2 (3.1) | 1 (3.1) | 1 (3) | >0.999++ | |
| Autoimmune disorder | 3 (4.6) | 3 (9.4) | 0 (0) | 0.114++ | |
| Mean (SD) | Mean (SD) | Mean (SD) | |||
| Age (years) | 26.2 (5.7) | 29.9 (4.8) | 22.5 (3.9) | <0.001‡ | |
| BMI (kg/m2) before pregnancy | 22.7 (2.2) | 22.7 (2.1) | 22.7 (2.4) | 0.981‡ | |
| BMI (kg/m2) after pregnancy | 24.5 (2.6) | 24.2 (2.4) | 24.8 (2.9) | 0.333‡ | |
| Difference in BMI | 1.84 (1.5) | 1.52 (1.28) | 2.15 (1.65) | 0.095‡ | |
+Pearson’s chi-square test; ++Fisher’s exact test; ‡Student’s t-test.
3.1.2. Glucose, Insulin and HOMA- IR in Roma Pregnancies Compared to Control Pregnancies
Maternal and neonatal characteristics, in total and by race are presented in Table 2.
- Glucose at 0min (p=0.050), at 60min (p=0.001) and at 120min (p=0.034) was significantly lower in the Roma group.
- On the contrary, the mean fasting insulin levels were significantly higher in the Roma group ( p=0.0013)
- As a result,HOMA-IR at 3rd trimester was significantly higher in the Roma group.
3.1.3. Mean Birthweight and Breastfeeding (Table 2)
- Mean birth weight was significantly lower in the Roma group.
- The percentage of breastfeeding in the control group was 90.6% while in the Roma group was significantly lower and equal to 9.1% (p<0.001).
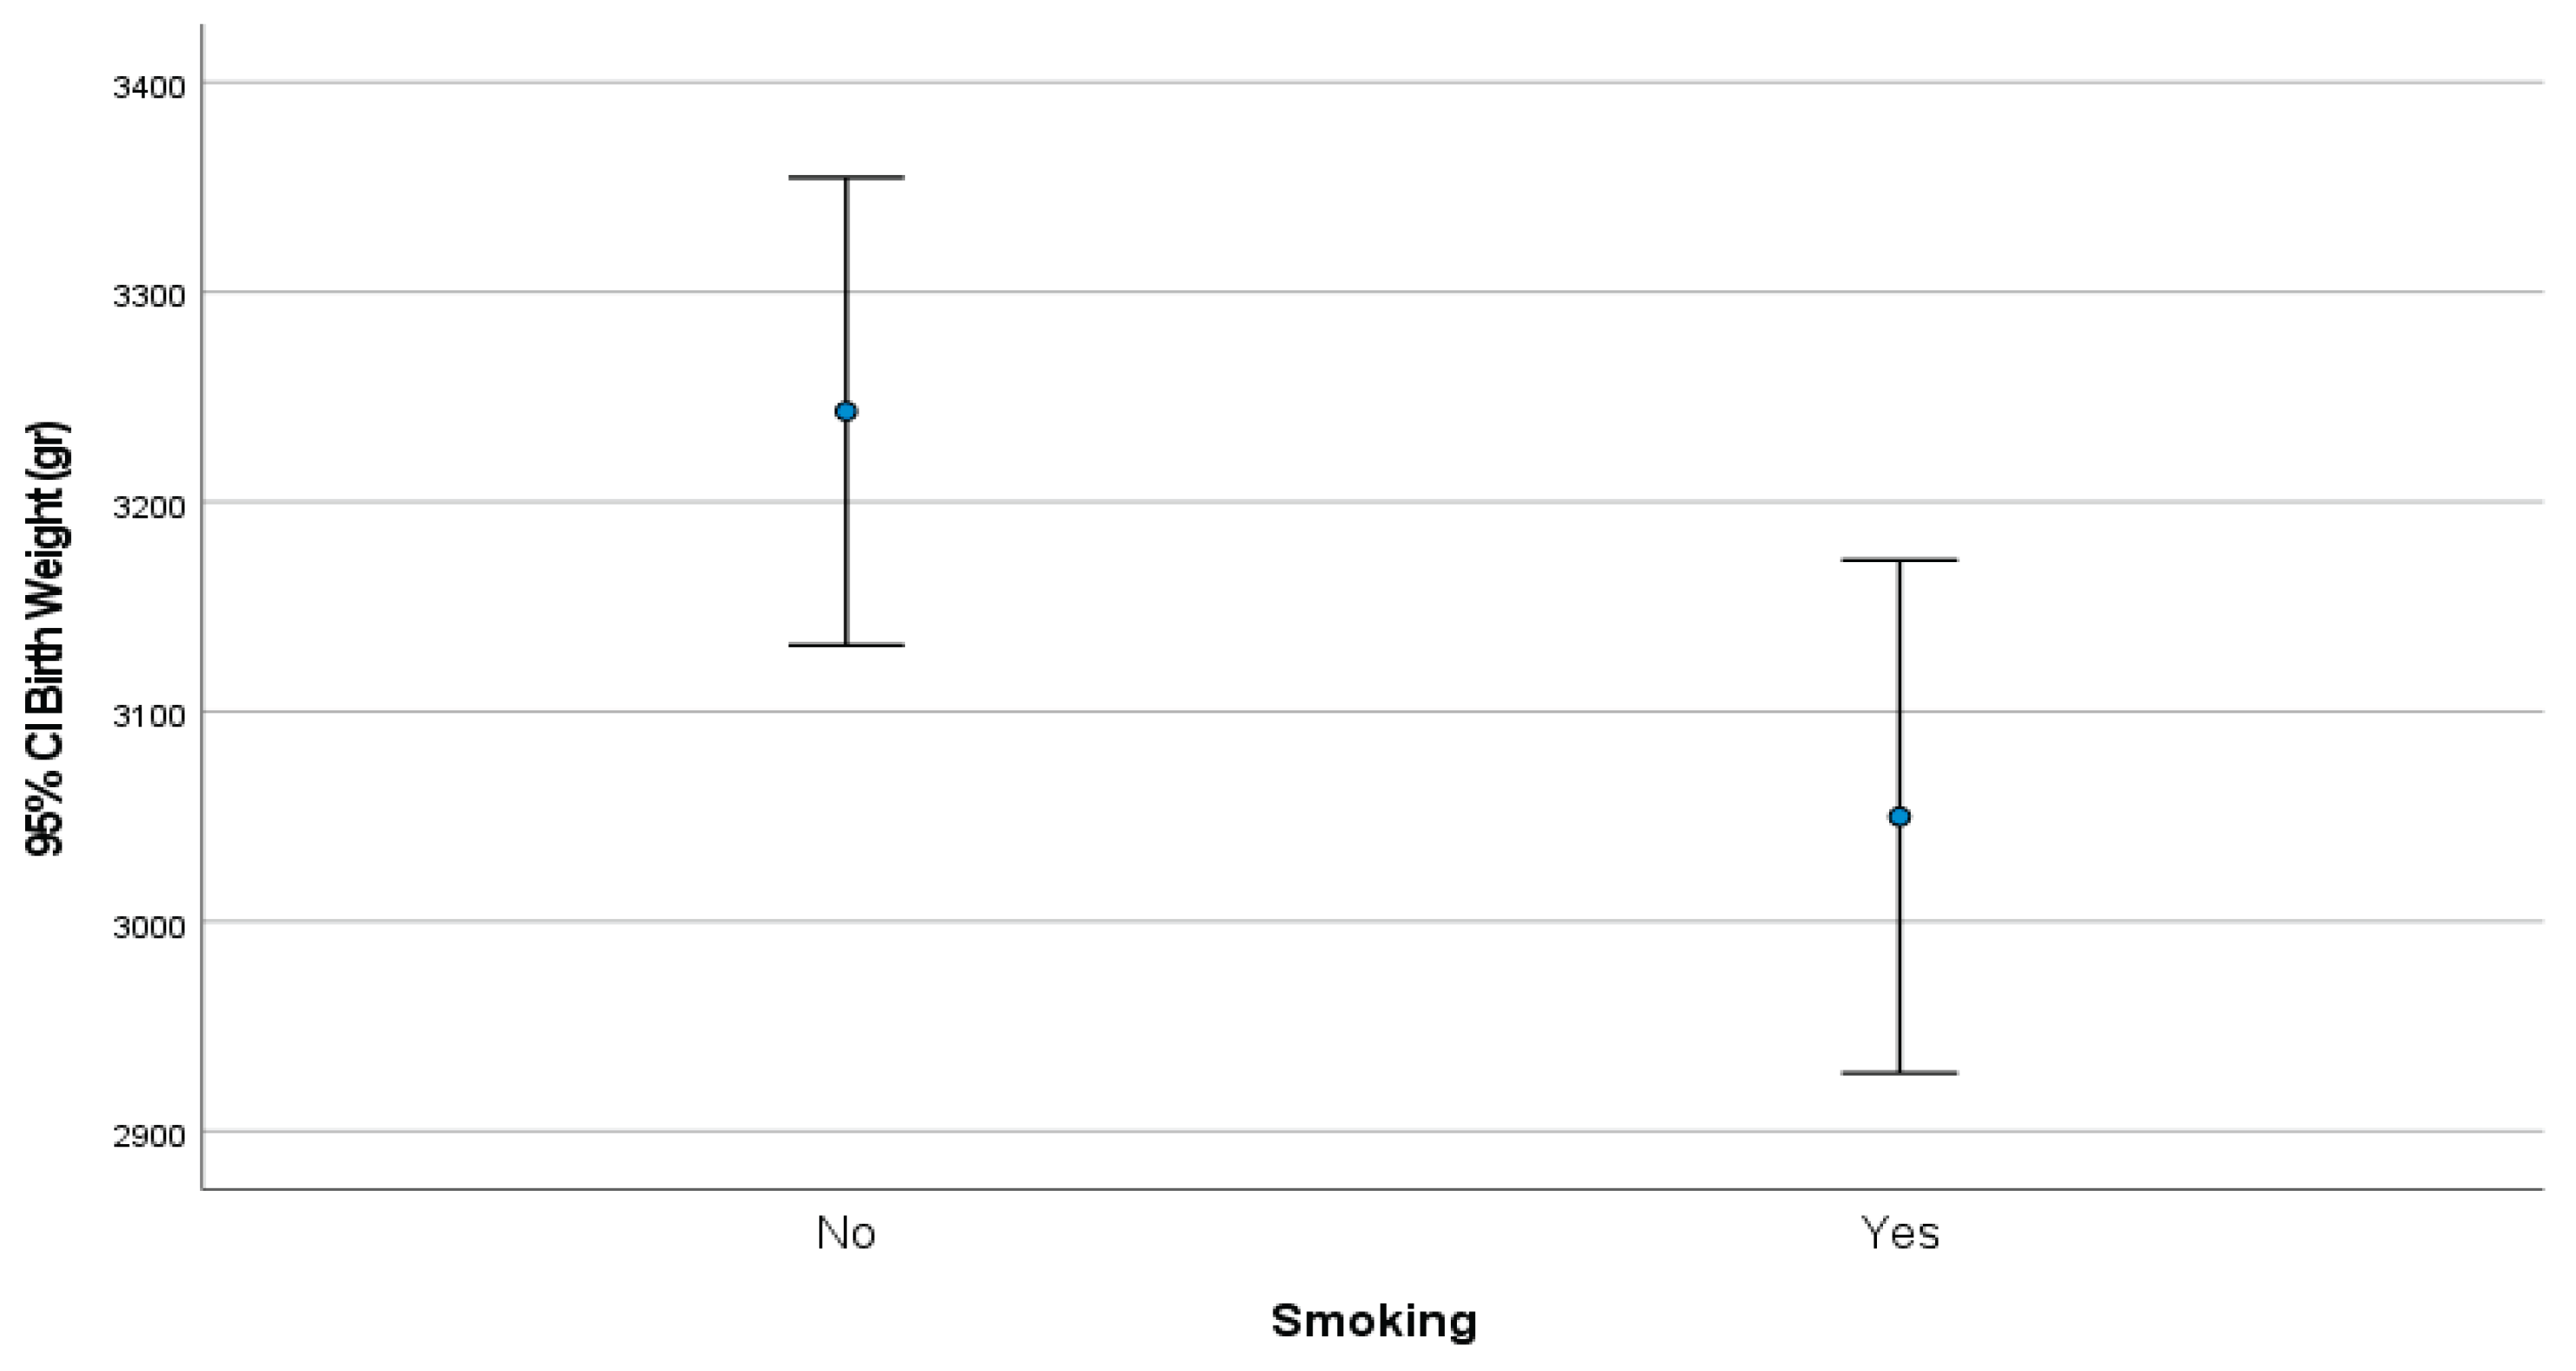
3.1.4. Mean Birthweight Correlated with Smoking Habits (Figure 1)
Mean birthweight for women who smoked was 3,050.0 gr (SD=321.3 gr) while for those who did not smoked it was significantly greater and equal to 3,243.2 gr (SD=329.5 gr), p=0.020, (Figure 1).
Figure 1.
Birthweight by women’s smoking status.
3.1.5. Association of Maternal Age and BMI with HOMA-IR (Table 3)
- After linear regression analysis, it emerged that age and BMI (after pregnancy) was not significantly associated with women’s HOMA-IR values (at 3rd trimester).
- On the other hand, Roma women had significantly greater HOMA-IR values, compared to controls, after adjusting for their age and after pregnancy BMI.
Table 3.
Multiple linear regression results with HOMA-IR (at 3rd trimester) as dependent variable.
| β+ | SE++ | P | |
|---|---|---|---|
| Age (years) | 0.07 | 0.05 | 0.231 |
| Groups(ROMA vs Controls) | 2.02 | 0.62 | 0.002 |
| BMI (kg/m2) after pregnancy | -0.02 | 0.09 | 0.848 |
+regression coefficient; ++Standard Error.
4. Discussion
This study provides evidence for increased insulin resistance among Roma pregnant women in comparison to non-Roma mothers, showing a powerful influence of ethnicity on metabolic processes of pregnancy. This development will add to the existing literature on ethnic disparities in metabolic health and highlights the need for personalized prenatal care regimes.
Pregnant Roma women demonstrate higher insulin resistance when compared with their Control peers, despite being adjusted for certain covariates including age, body mass index (BMI), and parity. This is consistent with prior studies that have identified ethnicity as an independent risk factor for altered glucose metabolism during pregnancy. Retnakaran et al. (2006) found that Asian and South Asian ethnicity independently predicted increased insulin resistance in late pregnancy [23]. The mechanisms behind these disparities are complex and likely involve a combination of genetic predisposition, lifestyle factors, and socioeconomic conditions affecting healthcare access, nutrition, and physical activity [24].
To some extent, the increased insulin resistance found among the Roma women may be due to genetic predisposition. Insulin resistance was found to be higher among Hungarian Roma populations than the general Hungarian population; therefore, genetic predisposition could be put forth as an argument [25]. Insulin resistance may be made exacerbated by environmental variables, such as dietary practices, a lack of physical activity, and a higher prevalence of obesity among Roma populations. Pregnancy-related metabolic outcomes are greatly influenced by the interaction of genetic and environmental variables [26]. The interplay between genetic and environmental factors is crucial in shaping metabolic outcomes during pregnancy. Studies have shown that Roma populations often experience socioeconomic disadvantages, which can lead to unhealthy dietary habits and lower levels of physical activity. For instance, a study on the dietary profile and nutritional status of the Hungarian Roma population found significant differences in nutrient intake and body composition compared to the general population, indicating a higher risk of metabolic syndrome [27].
Although there are not many studies specifically examining gestational diabetes mellitus (GDM) in Roma women, there is ample evidence linking elevated insulin resistance during pregnancy to negative outcomes like preeclampsia, macrosomia, and long-term metabolic disorders in the offspring. For example, the Mayo Clinic lists obesity or overweightness, inactivity, and a history of gestational diabetes mellitus in prior pregnancies to serve as risk factors for GDM. These elements may raise the risk of problems including preeclampsia and macrosomia by causing increased insulin resistance [28].
Socioeconomic disparities can be considered that likely contribute to the observed differences. Limited access to prenatal care, lower health literacy and structural inequities in healthcare systems may impede the timely diagnosis and management of glucose intolerance in Roma pregnancies [29]. Addressing these inequalities is a key for better outcomes. Programs aimed at community education, enhanced access to prenatal care, and culturally sensitive interventions should be prioritized [30].
This study’s strengths include a robust methodology and include a well-characterized population of Roma and control pregnant women of European descent. However, there are some limitations to be recognized. Firstly, the low sample size limits generalization to other Roma populations with diverse genetic and environmental influences. We also lacking the detailed dietary and physical activity data of the participants, which may greatly affect insulin resistance.
Further research is then needed to elucidate the genetic and molecular mechanisms underlying increased insulin resistance in Roma pregnancies. Longitudinal studies examining the progression of glucose intolerance from early to late pregnancy in diverse populations could provide valuable insights [22,31]. Moreover, interventional studies focusing on lifestyle modification and healthcare access in Roma communities are warranted to address the disparities identified in this study.
5. Conclusions
This research emphasizes the necessity of taking ethnic differences in pregnancy-associated insulin resistance into consideration. Increased insulin resistance and therefore an increased risk of gestational diabetes mellitus are observed in Roma pregnancies, according to this study. Therefore, it would be beneficial to provide these women with appropriate counseling regarding their diet and lifestyle, since they belong to a high-risk group.
Author Contributions
For research articles with several authors, a short paragraph specifying their individual contributions must be provided. The following statements should be used “Conceptualization, P. H. and C.P.; methodology, P. H. and S.K.; validation, P. H. ,C.P. and O.C.; formal analysis, Z.S..; investigation, D.O.; data curation, C.P. and D.O.; writing—original draft preparation, P. H. G.P. and C.P; writing—review and editing P.H., C.P., O.C. S.K., E.Z. and G.P; supervision, P.H. and G.P..; project administration, C.H.; All authors have read and agreed to the published version of the manuscript.”.
Funding
This research received no external funding.
Institutional Review Board Statement
The study was conducted in accordance with the Declaration of Helsinki and approved by the Institutional Ethics and Scientific Committee of National and Kapodistrian University of Athens (protocol code 7366 and date of approval 25/01/2023) for studies involving humans, as well as by the Ethics and Scientific Committee of the General Hospital of Kalamata.
Informed Consent Statement
Informed consent was obtained from all subjects involved prior to the study.
Data Availability Statement
The data from this study may be obtained by contacting the corresponding author.
Conflicts of Interest
The authors declare no conflicts of interest.
Abbreviations
The following abbreviations are used in this manuscript:
| OGTT | Oral Glucose Tolerance Test |
| HOMA-IR | Homeostasis Model Assessment- Insulin Resistance |
| GDM | Gestational Diabetes Melitus |
| PCOS | Polycystic Ovary Syndrome |
References
- American Diabetes Association Classification and Diagnosis of Diabetes: Standards of Medical Care in Diabetes—2018. Diabetes Care. 2018;41:S13–S27. [CrossRef]
- International Diabetes Federation . IDF Diabetes Atlas. 8th ed. IDF; Brussels, Belgium: 2017.
- Feig D.S., Moses R.G. Metformin Therapy during Pregnancy Good for the goose and good for the gosling too? Diabetes Care. 2011;34:2329–2330. [CrossRef]
- Butte NF. Carbohydrate and lipid metabolism in pregnancy: normal compared with gestational diabetes mellitus. Am J Clin Nutr 2000; 71(Suppl. 5): 1256S–1261S. [CrossRef]
- Catalano P.M., Tyzbir E.D., et al. Longitudinal changes in insulin release and insulin resistance in nonobese pregnant women. Am. J. Obstet. Gynecol. 1991;165:1667–1672. [CrossRef]
- Phelps R.L., Metzger B.E., et al. Carbohydrate metabolism in pregnancy: XVII. Diurnal profiles of plasma glucose, insulin, free fatty acids, triglycerides, cholesterol, and individual amino acids in late normal pregnancy. Am. J. Obstet. Gynecol. 1981;140:730–736. [CrossRef]
- Di Cianni G., Miccoli R., et al. Intermediate metabolism in normal pregnancy and in gestational diabetes. Diabetes Metab. Res. Rev. 2003;19:259–270. [CrossRef]
- Buchanan T.A., Xiang A.H. Gestational diabetes mellitus. J. Clin. Investig. 2005;115:485–491.
- Plows, J., Stanley, J., et al. (2018). The Pathophysiology of Gestational Diabetes Mellitus. International Journal of Molecular Sciences, 19(11), 3342. [CrossRef]
- World Health Organization. Global Report on Diabetes. 2016. p. 16–8.
- International Diabetes Federation. IDF Diabetes Atlas. 2015. p. 75–87.
- The American College of Obstetrics and Gynecologists. Clinical management guidelines for obstetrician-gynaecologists. ACOG Practice Bulletin. No. 180, 2017.
- 14 ADA. Standards of medical care in diabetes, glycaemic targets. 2017th ed. 2017.
- Ferrannini E, Mari A: How to measure insulin sensitivity. J Hypertens 16:895–906, 1998.
- Matthews DR, Hosker JP, et al (1985). “Homeostasis model assessment: insulin resistance and beta-cell function from fasting plasma glucose and insulin concentrations in man”. Diabetologia. [CrossRef]
- Nigatu Β., Workneh T., et al A. Prevalence of Gestational Diabetes Mellitus among pregnant women attending antenatal care clinic of St. Paul’s Hospital Millennium Medical College, Addis Ababa, Ethiopia. Clinical Diabetes and Endocrinology .2022; 8:2. [CrossRef]
- Fraser A: The Gypsies. Oxford: Blackwell Publishers,1992.
- Liegeois J-P: Roma, Gypsies, Travellers. Strasbourg: Council of Europe Press,. 1994.
- Kalaydjieva L., Gresham D. et al. Genetic studies of the Roma (Gypsies): a review. BMC Medical Romas. 2001; 2:4. [CrossRef]
- Enache, G.; Rusu, E.; et al. Prevalence of Obesity and Newly Diagnosed Diabetes in the Roma Population from a County in the South Part of Romania (Călăra¸si County)-Preliminary Results. Rom. J. Diabetes Nutr. Metab. Dis. 2016, 23. [CrossRef]
- Živkovi’c, T.B.; Marjanovi’c, M.; et al . Screening for Diabetes Among Roma People Living in Serbia. Croat. Med. J. 2010, 51, 144–150.
- Piko P, Werissa NA, et al. Genetic Susceptibility to Insulin Resistance and Its Association with Estimated Longevity in the Hungarian General and Roma Populations. Biomedicines. 2022 Jul 14;10(7):1703. [CrossRef]
- Retnakaran R, Hanley AJ, et al Ethnicity modifies the effect of obesity on insulin resistance in pregnancy: a comparison of Asian, South Asian, and Caucasian women. J Clin Endocrinol Metab. 2006 Jan;91(1):93-7. Epub 2005 Oct 25. PMID: 16249285. [CrossRef]
- Nguyen BT, Cheng YW, et al The effect of race/ethnicity on adverse perinatal outcomes among patients with gestational diabetes mellitus. Am J Obstet Gynecol. 2012 Oct;207(4):322.e1-6. Epub 2012 Jun 29. PMID: 22818875; PMCID: PMC3462223. [CrossRef]
- Ádány R, Pikó P, et al Prevalence of Insulin Resistance in the Hungarian General and Roma Populations as Defined by Using Data Generated in a Complex Health (Interview and Examination) Survey. Int J Environ Res Public Health. 2020 Jul 4;17(13):4833. PMID: 32635565; PMCID: PMC7370128. [CrossRef]
- Nunes MA, Kučerová K, et al. Prevalence of Diabetes Mellitus among Roma Populations-A Systematic Review. Int J Environ Res Public Health. 2018 Nov 21;15(11):2607. PMID: 30469436; PMCID: PMC6265881. [CrossRef]
- Llanaj E, Vincze F, et al. Dietary Profile and Nutritional Status of the Roma Population Living in Segregated Colonies in Northeast Hungary. Nutrients. 2020 Sep 16;12(9):2836. PMID: 32947945; PMCID: PMC7551568. [CrossRef]
- https://www.mayoclinic.org/diseases-conditions/gestational-diabetes.
- LeMasters K, Baber Wallis A, et al Pregnancy experiences of women in rural Romania: understanding ethnic and socioeconomic disparities. Cult Health Sex. 2019 Mar;21(3):249-262. Epub 2018 May 15. PMID: 29764305; PMCID: PMC6237651. [CrossRef]
- Bejenariu, Simona & Mitrut, Andreea, 2014. “Bridging the Gap for Roma Women: The Effects of a Health Mediation Program on Roma Prenatal Care and Child Health,” Working Papers in Economics 590, University of Gothenburg, Department of Economics.
- Retnakaran R, Qi Y, et al. Glucose intolerance in pregnancy and future risk of pre-diabetes or diabetes. Diabetes Care. 2008 Oct;31(10):2026-31. Epub 2008 Jul 15. PMID: 18628572; PMCID: PMC2551649. [CrossRef]
Table 2.
Maternal and neonatal characteristics, in total sample and by population.
| Total sample (n=65; 100%) | Group | P | ||
|---|---|---|---|---|
| Controls (n=32; 49.2%) |
ROMA (n=33; 50.8%) |
|||
| Mean (SD) | Mean (SD) | Mean (SD) | ||
| Glucose (0min) | 82.3 (7.4) | 84.1 (6.6) | 80.5 (7.9) | 0.050‡ |
| Glucose (60min) | 136.4 (28.6) | 147.8 (21.8) | 125.3 (30.3) | 0.001‡ |
|
Glucose (120min) Fasting Insulin |
117.4 (23.5) 15.11(8.87) |
123.6 (19.7) 11.6(6.49) |
111.3 (25.6) 18.63(7.74) |
0.034‡ 0.0013‡ |
| HOMA IR (3rd trimester) | 3.1 (2) | 2.4 (1.4) | 3.9 (2.3) | 0.002‡ |
| Birth Weight (gr) | 3157 (337.5) | 3275.5 (323.4) | 3042.1 (314.4) | 0.004‡ |
| Median (IQR) | Median (IQR) | Median (IQR) | ||
| HBCA1 (1st trimester) | 5 (4.4 ─5.2) | 5 (4.4 ─5.2) | 4.8 (4.3 ─5.2) | 0.782‡‡ |
| n (%) | n (%) | n (%) | ||
| Pathological glucose curve | 7 (10.8) | 2 (6.3) | 5 (15.2) | 0.427++ |
| Gestational diabetes | 7 (10.8) | 2 (6.3) | 5 (15.2) | 0.427++ |
| Gestational hypertension | 3 (4.6) | 0 (0) | 3 (9.1) | 0.238++ |
| Preeclampsia | 2 (3.1) | 0 (0) | 2 (6.1) | 0.492++ |
| Gestational age at delivery | ||||
| 35-36w | 4 (6.2) | 1 (3.1) | 3 (9.1) | 0.366++ |
| 37-38w | 10 (15.4) | 3 (9.4) | 7 (21.2) | |
| 39-40w | 35 (53.8) | 20 (62.5) | 15 (45.5) | |
| >40w | 16 (24.6) | 8 (25) | 8 (24.2) | |
| Delivery mode | ||||
| Cesarian | 28 (43.1) | 11 (34.4) | 17 (51.5) | 0.163+ |
| Vaginal | 37 (56.9) | 21 (65.6) | 16 (48.5) | |
| 5 min Apgar score <4 | 1 (1.5) | 0 (0) | 1 (3) | >0.999++ |
| Neonatal sepsis | 0 (0) | 0 (0) | 0 (0) | - |
| Trauma during labour | 0 (0) | 0 (0) | 0 (0) | - |
| Low birth weight | 1 (1.5) | 0 (0) | 1 (3) | >0.999++ |
| respiratory distress | 2 (3.1) | 0 (0) | 2 (6.1) | 0.492++ |
| neonatal convulsions | 0 (0) | 0 (0) | 0 (0) | - |
| Neonatal death after delivery | 0 (0) | 0 (0) | 0 (0) | - |
| Hypoglycemia | 6 (9.2) | 1 (3.1) | 5 (15.2) | 0.197++ |
| Jaundice | 13 (20) | 5 (15.6) | 8 (24.2) | 0.385+ |
| Breastfeeding | 32 (49.2) | 29 (90.6) | 3 (9.1) | <0.001+ |
+Pearson’s chi-square test; ++Fisher’s exact test; ‡Student’s t-test; ‡‡Mann-Whitney test.
Disclaimer/Publisher’s Note: The statements, opinions and data contained in all publications are solely those of the individual author(s) and contributor(s) and not of MDPI and/or the editor(s). MDPI and/or the editor(s) disclaim responsibility for any injury to people or property resulting from any ideas, methods, instructions or products referred to in the content. |
© 2025 by the authors. Licensee MDPI, Basel, Switzerland. This article is an open access article distributed under the terms and conditions of the Creative Commons Attribution (CC BY) license (http://creativecommons.org/licenses/by/4.0/).
Copyright: This open access article is published under a Creative Commons CC BY 4.0 license, which permit the free download, distribution, and reuse, provided that the author and preprint are cited in any reuse.


