Submitted:
01 August 2025
Posted:
01 August 2025
You are already at the latest version
Abstract
Introduction: Leukoaraiosis (LA) or white matter disease is a significant component of vascular dementia. There is a large overlap noted between normal pressure hydrocephalus (NPH) and LA. A previously reported lumped parameter modelling study of NPH lead to novel findings in this disease. Given the overlap between LA and NPH, the purpose of the current study is to perform a lumped parameter study into LA to see if the vascular pathophysiology is similar to NPH. Methods: A lumped parameter model originally developed to study normal pressure hydro-cephalus was extended to investigate LA. The model was constrained by the known cerebral blood flow and cerebral blood volumes found in LA, as derived from the literature. Results: Similar to NPH, in LA there was a balanced increase in arterial and venous outflow resistance, with the re-sulting ischemia affecting the white matter rather than the grey matter. However, unlike NPH, in LA the findings are irreversible, most likely due to structural venous wall changes. Conclusions: The model suggests the vascular physiology of LA is very similar to NPH. A common patho-physiology is discussed based on a pulsation induced increase in the venous outflow resistance.
Keywords:
cerebral blood flow
; cerebral blood volume
; leukoaraiosis
; normal pressure hydrocephalus
; pulsation
; vascular dementia
1. Introduction
Neuroimaging often shows areas of low density on CT and high T2 signal intensity on MRI within the white matter of the brain. This change is denoted as white matter disease or leukoaraiosis (LA) [1]. The term leukoaraiosis comes from the Greek language, leuko meaning white and araiosis meaning rarefaction [2]. The most significant correlation of leukoaraiosis is with aging [3]. There is also a strong vascular component to the aetiology of LA, with risk factors of hypertension, diabetes mellitis and cardiac disease also being prominent [4]. Indeed, Leukoaraiosis is a major determinant of vascular dementia [5] which is, by definition, known to be of vascular origin. There is also an interesting overlap between normal pressure hydrocephalus (NPH) and LA. Up to 73% of patients with NPH have significant degrees of leukoaraiosis within the deep white matter [6]. This suggests a possible degree of common causation between these two disorders.
In a previous study performed by the current authors, a lumped parameter vascular model was developed to study the vascular pathophysiology of NPH [7]. This model suggested there was a balanced increase in the vascular resistance in the arterial inflow and the venous outflow in this disease. There was a significant difference between the findings in the grey matter and white matter with significant ischemia within the white matter in NPH [8]. Given the models previous findings in NPH, and the overlap between NPH and LA, the purpose of the current study is to extend the NPH lumped parameter modelling study [7], utilizing the parameters gleaned from the literature to study the vascular pathophysiology of leukoaraiosis.
2. Materials and Methods
2.1. Equations
The study begins with Davson’s equation, which relates the intracranial pressure (ICP) to the CSF formation rate, the CSF outflow resistance and the venous sinus pressure [9].
Where ICP is the intracranial pressure, CSFfr is the CSF formation rate, Rout is the CSF outflow resistance and Psss is the pressure in the superior sagittal sinus. Next Ohms law for hydraulic circuits is required:
Where ΔP is the pressure drop across a vascular segment, Q is the flow rate through the segment and R is the resistance. As resistances in series are directly additive, the following can be derived:
Where Rart is the arterial segment resistance, Rcap is the resistance of the capillaries, Rven is the venous resistance, Rcuf is the resistance of the venous outflow cuff and Rtot is the total resistance for the entire vascular system. Poiseuille’s equation calculates the pressure drop across each of these segments:
Where ΔP is the pressure drop, µ is the viscosity, L is the vessel length, Q is the fluid flow rate, π is the circle proportionality constant and r is the radius. Substituting equation (2) into (4) and eliminating Q from both sides gives an equation for the resistance in each segment:
In this modeling study, the viscosity, the length of each vessel segment, and π are constants, so it can be shown that a change in resistance for any segment depends only on a change in the vessel radius i.e.
The volume of a vessel is given by the equation for a cylinder i.e.
Where V is the volume, L is the vessel length and r is the radius of the vessel. Given L and π are constants for any given segment, the change in volume is dependent on the change in radius i.e.
Substituting equation (8) into equation (6) gives
The next equation relates the transmural pressure across a vessel to the vessel cross-sectional area [10]:
Where Ptm is the transmural pressure across the vessel wall (lumen pressure- CSF pressure), E is the circumferential Young’s modulus of the vessel wall, h is the wall thickness, Ro is the radius in the stress free state, Ao is the area in the stress free state and A is the area following the applied transmural pressure. This equation was previously used to show that the volume of the venous outflow varies with the transmural pressure by the equation [7]:
Where ΔTMPven is the normalized increase in venous transmural pressure and ΔVven is the change in venous volume.
2.2. Model input parameters
The input parameters are unchanged from the previous study [7] and will only be briefly described as the details can be obtained from the original study. This study is based on a middle-aged individual with a brain size of 1500g. A normal global CBF is 50 ml/100g/min [7], giving a normal cerebral blood arterial inflow of 750 ml/min. The normal mean arterial inflow pressure is 100 mmHg [11]. The normal precapillary bed pressure is 32 mmHg [12]. The end capillary pressure is estimated to be 15 mmHg [13]. The normal CSF pressure in middle age is 11.5 mmHg [14] and the normal pressure gradient from the CSF to the superior sinus lumen is 4 mmHg [15,16], giving a normal sinus pressure by subtraction of 7.5 mmHg [17]. The normal transmural pressure of the subarachnoid cortical veins in primates is 2.5 mmHg [18]. Using this figure for the model, it can be seen that the pre-venous outflow cuff pressure is 14 mmHg by addition of the TMP to the ICP.
In a 1500g brain, the total CBV would be 51 ml [7]. Hua et al. found the arterial component of the CBV to be 25% [19] or 12.8 ml in total. This leaves the remaining 75% for the capacitance vessels, including the veins and capillaries or 38.2 ml. The estimated percentage of this latter figure for the capillaries is 53% [20], giving a total capillary blood volume of 20.3 ml and a total venous blood volume of 17.9 ml.
2.3. Vessel responses to transmural pressure variations
It is assumed that variations in the arterial resistance and volume in this model depend entirely on the arterial autoregulation and muscle tone and not the vessel transmural pressure. As the arterial pressure is always much higher than the ICP, the arterial transmural pressure will have no effect on the outcome of the current modelling study.
In the capillary bed, the vessels do not actively alter their diameter [22], indicating they react purely to their transmural pressure. In a rat model, extreme hyperventilation decreased the PCO2 from 40 to 21.6 mmHg without affecting PO2, the capillary size was not significantly different to controls despite the expected arteriolar constriction [23]. However, in the opposite case, in rats made extremely hypercapnic secondary to hypoventilation, the PCO2 increased to 95.6 mmHg but PO2 was normal, the capillary diameter increased by 20% consistent with a 44% increase in volume compared to known control values [23]. Thus, a moderate reduction in capillary TMP does not change the capillary size but a maximal increase in TMP increases their volume by 44%. To simplify the current study, it is assumed the volume of the capillaries vary between normal and maximally dilated as a linear function of their transmural pressure. A previous study indicated an increase in capillary TMP from 12 to 37.9 mmHg would increase the capillary volume by 44% or a 1.7% increase in volume for each 1 mmHg pressure rise. Below a TMP of 12 mmHg, the volume is unchanged at 20.3 ml and above a TMP of 37.9, the elastic limit is reached and the volume is set to 29.2 ml.
Similar to the capillaries, the veins alter their size purely depending on their transmural pressures. In a previous modelling study [7], the function for the outflow vein dilatation was found to be summarized by equation (11).
At the distal end of the cortical veins, as they join the sinus wall, the outflow cuff segment resides. The collapse of this segment occurs physiologically and is passively modulated by the transmural pressure between the ICP and the sinus pressure, which is usually negative [24]. The segment is very short, and as it is mostly under a state of collapse with physiological ICPs. The change in volume from this segment will be ignored in this model. However, its resistance will be taken into consideration.
3. Results
3.1. Whole brain findings
The whole brain modelling findings are summarized in Figure 1. The five vascular segments modelled are shown in Fig 1a, with the arterial segment shown in red, the capillaries in orange, the veins in yellow, the outflow cuff in green and the sinus in blue. The pressures obtained from the literature have been appended to the beginning and end of each vascular segment within the vessels in Fig 1a. Given the arterial inflow volume passes through each segment sequentially, the resistance of each segment can be calculated using equation (2). These resistances are appended below the vessels in fig 1. The normal cerebral blood volume (CBV) values for each segment and the total CBV have been obtained from the literature and are shown below the resistances. The blue numbers represent the transmural pressure gradients between the pressure at the beginning and end of each capacitance vessel segment and the ICP, and are obtained by subtraction. The red figure is the average capillary TMP obtained by averaging the TMP before and after the capillaries. Figure 1b represents the findings in leukoaraiosis. Figure 1c was obtained from the previous modelling study into NPH [7] and is appended for comparison. In these later 2 figures, the red segments represent the areas of increased resistance compared to the normal findings and the green represent reduced resistance.
In figure 1b, the whole brain findings in leukoaraiosis are modelled. The arterial inflow and venous outflow pressures, the ICP, the mean blood flow rate and target CBV were obtained from the literature q.v. The sinus pressure was assumed to be unchanged due to the normal ICP.
The pressure drop across the entire system is known from the data as supplied and the total blood flow is specified, so the total resistance is calculated using equation (2) i.e., it is increased to 153.0 mmHg/L/min compared to 123.4 mmHg/L/min in the normal model. The TMP across the outflow cuff is obtained by subtracting the ICP from the sinus pressure and is also normal. Therefore, the cuff outflow resistance was initially assumed to be normal. Knowing the cuff resistance and blood flow will set the blood pressure at the end of the veins by using equation (2) which was therefore also normal. The normal TMP across the veins gave their volume using equation (11), which was normal. Similarly, the capillary resistance was normal. In order for the total resistance to be balanced, the arterial inflow resistance needed to be set very high but this reduced the arterial blood volume using equation (9). The overall CBV at this stage undershot the target value of 59.2 mL by a large margin. Alternatively, placing all of the increased resistance on the venous side meant the CBV overshot the target by a large amount. Similar to the modelling previously performed in NPH [7], a total resistance of 153.0 mmHg/L/min and a CBV of 59.2 mL constrained the model to a single solution, which was likely to be placed somewhere between an isolated increase in arterial or venous outflow resistance. Using an iterative approach from both extremes, it was found the venous outflow resistance of 19.4 mmHg/L/min was the correct one. From this the post venous pressure could be calculated using equation (2). Using this pressure, the venous CBV was calculated from equation (11) and the resistance of this segment calculated using equation (2). This gave the post capillary pressure. Using the capillary tube law as defined, the volume and resistance of this segment was calculated until the average capillary TMP and its resistance gave a volume of 21.7 mL. Knowing the total resistance and the other resistances, the arterial inflow resistance could be calculated using equation (3). Figure 1b is the only valid solution to the constraints of the model, with all of the equations being satisfied. Note, there is an increase in both the arterial and the outflow cuff resistance, with a reduction in resistance of the other segments due to the increased pressures and volumes compared to normal. There is an increase in the mean capillary transmural pressure.
In figure 1c, the findings in NPH from the previous study are appended for comparison [7]. Note, the arterial and venous outflow resistances are almost identical to fig 1b. The overall blood flow is less and the capillary transmural pressure is lower than fig 1b, being closer to the normal figure.
3.2. Differences between the grey and white matter
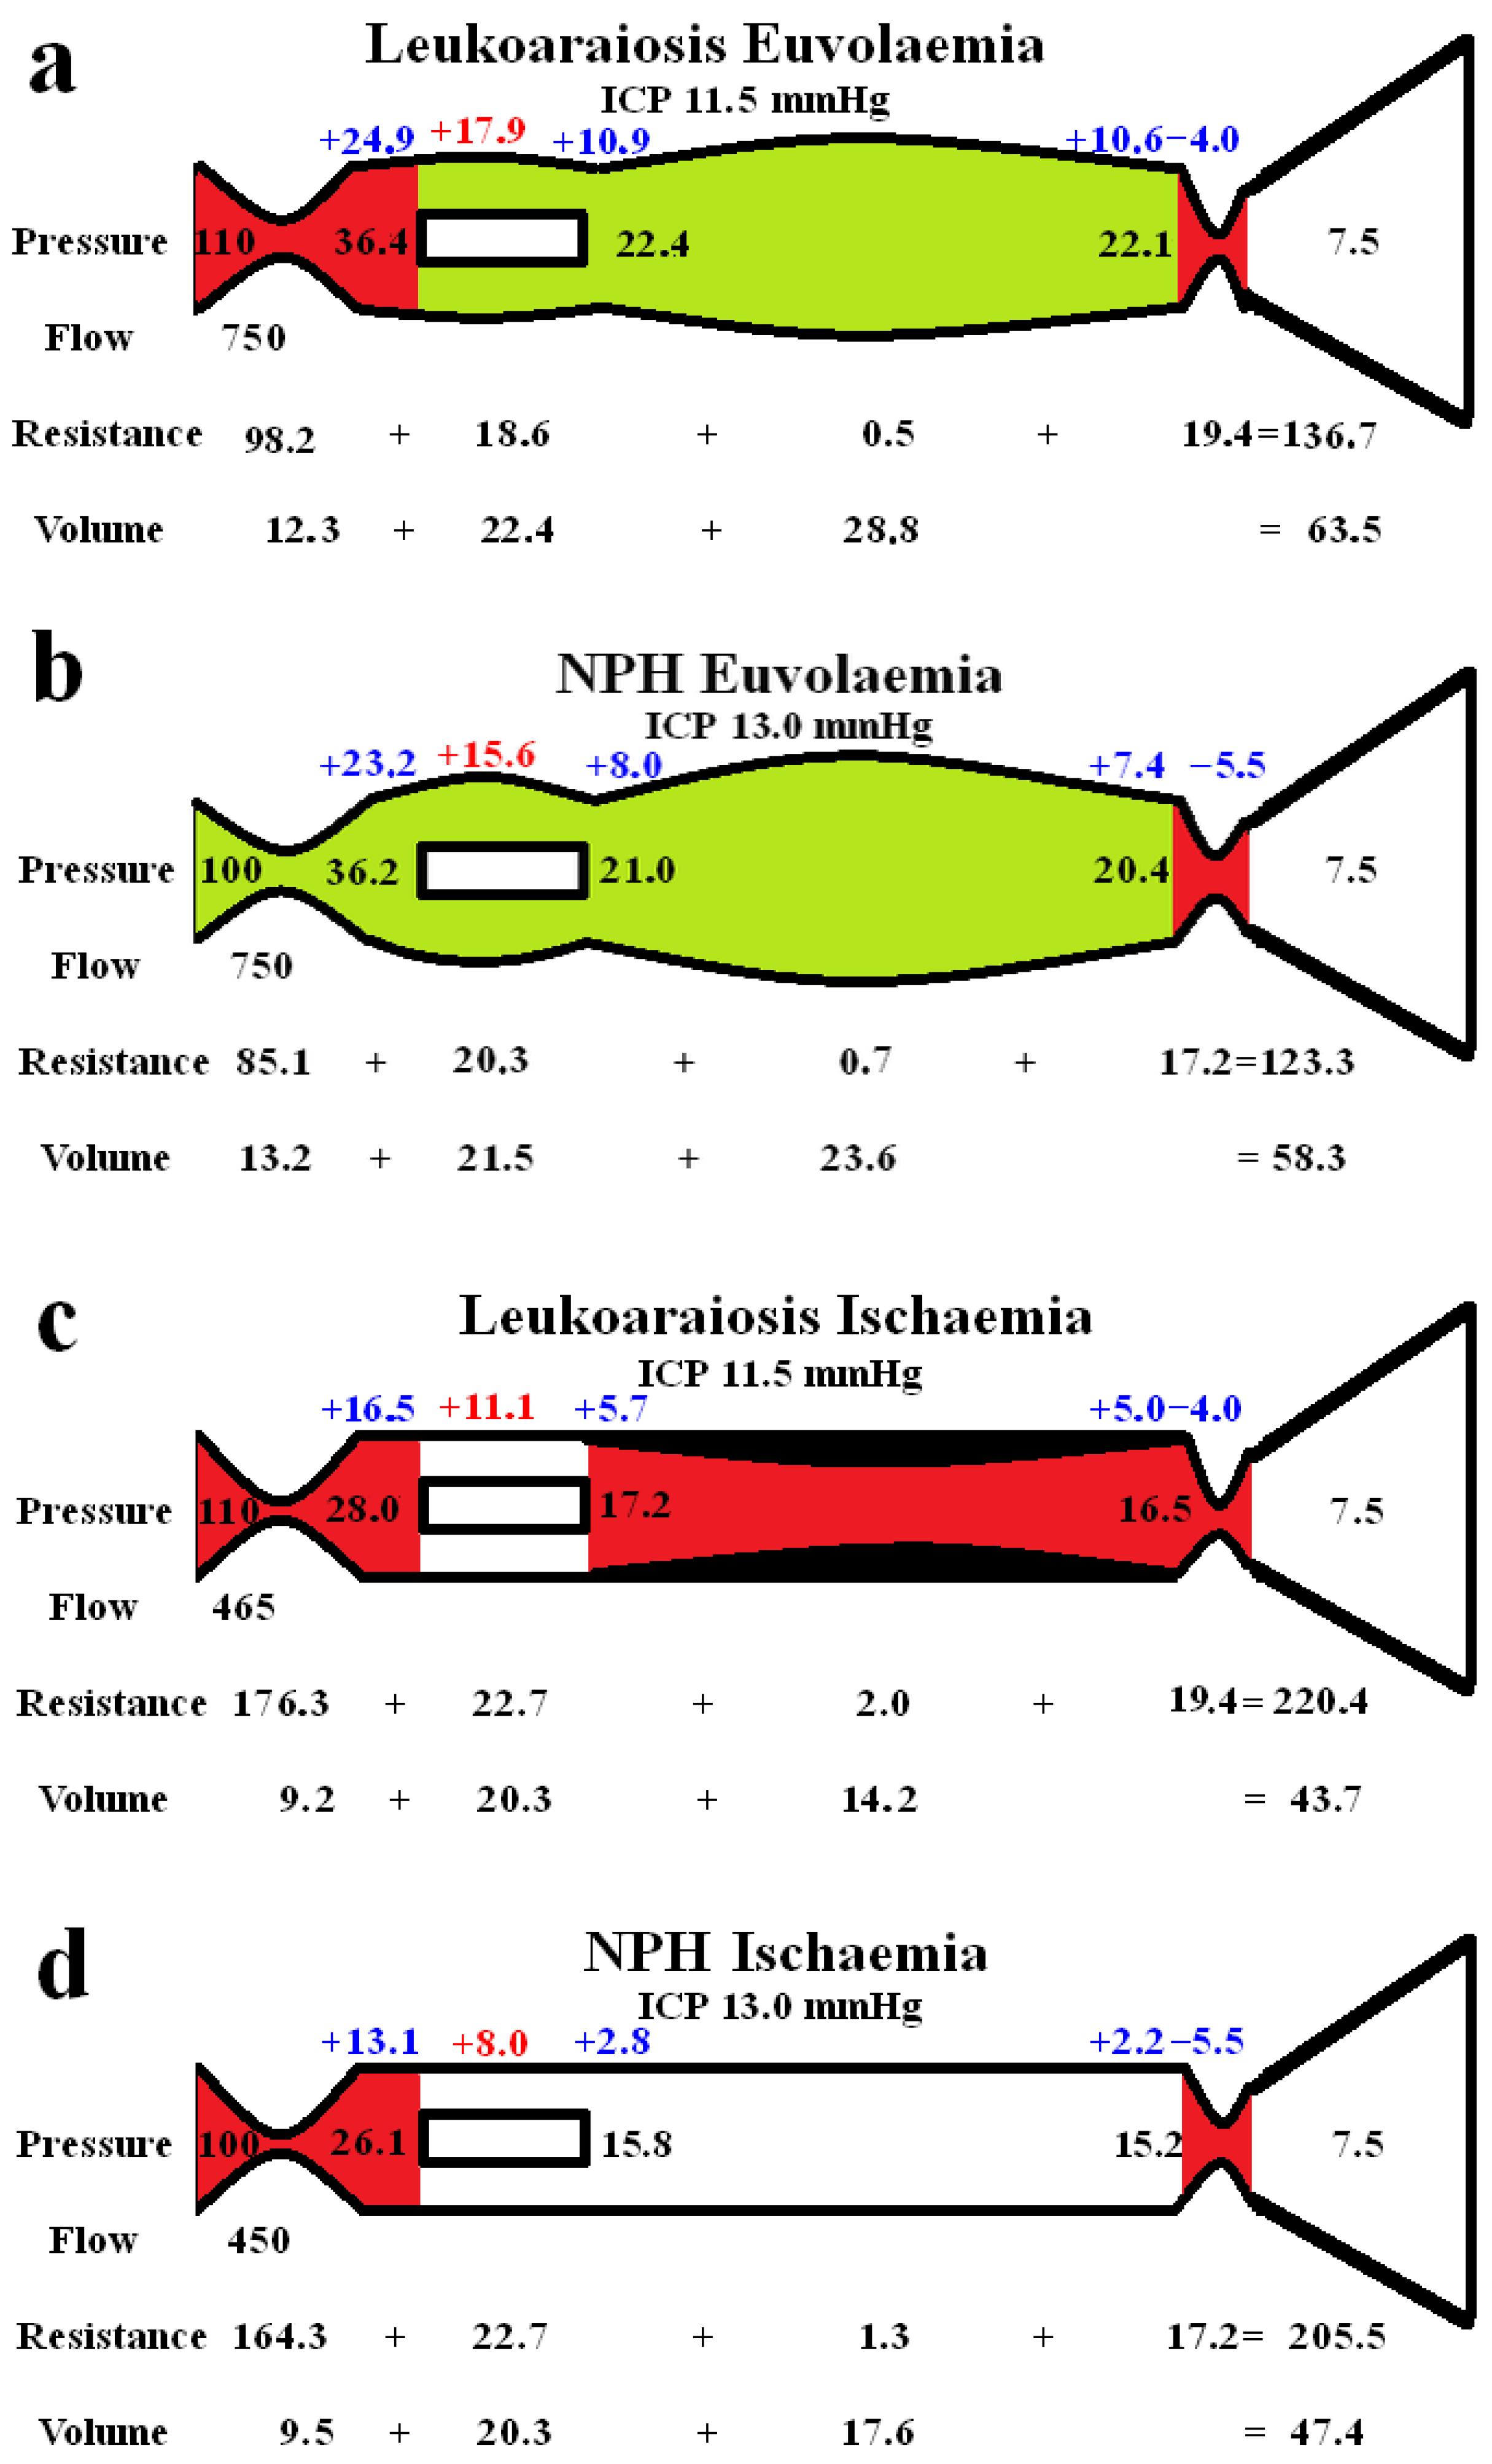
Figure 2 shows extended modelling to gauge the differences between the grey and white matter. The red segments represent the areas of increased resistance compared to the normal findings and the green represent reduced resistance. In figure 2a the brain is modelled as if all of it was being affected in a way similar to the grey matter in LA. In the study by Markus et al. [25] the grey matter CBF was normal and the CBV was increased by 28% in LA. We elected to leave the outflow resistance as unchanged from the previous global model (fig 1b) and reduced the arterial resistance until the CBF increased back to normal at 750 ml/min. The result was a further dilatation of the capillary and venous beds, with an increase in the capillary and venous transmural pressures. The CBV was increased to 63.5 mL which was 2.8% less than the target of value of 65.3 mL as suggested by Markus et al [25].
4. Discussion
In this study we have applied a lumped parameter model, previously developed to investigate NPH, and applied it to leukoaraiosis. The overall findings suggest that the vascular pathophysiology of LA may be similar to NPH. There are many assumptions inherent in lumped parameter modelling. We can test the modelling we have performed by comparing the outcomes predicted by the model with the literature. Previously, the model successfully predicted the cerebral blood volume changes found in the literature at the limits of autoregulation, in both human and animal studies [7]. The model also correctly predicted the cerebral blood volume changes in Alzheimer’s disease [26] and in idiopathic intracranial hypertension [27].
4.1. Global brain changes in leukoaraiosis
The global findings within the brain are summarised in fig 1b. In a study by Marcus et al., using an MRI contrast first pass technique, cerebral blood flow (CBF) in the grey matter was normal but in the white matter the CBF was reduced by 38% [25]. Similarly, another study showed a normal CBF in the grey matter of leukoaraiosis patients without dementia [28]. Given the grey matter averages 65% of the brain volume and the white matter 35% [29], we can calculate the global reduction in CBF in LA to be just over 10%. Thus, in the model a CBF of 670 mL/min was used for the blood flow rate. The mean arterial pressure in patients with significant leukoaraiosis is 10% higher compared to those with minimal disease [30], so we have increased the arterial inflow pressure to 110 mmHg in the model. The ICP in NPH patients without LA (those patients had a normal ICP) was not significantly different compared to those with mild, moderate or severe LA, [31] so we have left the ICP unchanged in the model. Given the ICP is normal in isolated LA, the venous sinuses are unlikely to be compressed, so the venous sinus pressure was left unchanged from normal. The cerebral blood volumes (CBV) in LA found in the study by Markus et al., were an increase of 28% in the grey matter but a reduction of 14% in the white matter [25]. The later result failed to reach significance but this was most likely due to this part of the study being under powered to be able to decern this finding. However, a study using positron emission tomography CT showed similar results to Markus et al., with a reduced white matter CBV of 15% [32]. Given the CBV of the normal grey matter is 4.6 ml/100 g and in the white matter it is 1.3 ml/100g [33] and the percentage of the brain volume that each of these two components makes up (as already discussed), the global CBV would be increased by 16.1% in LA, so we used this as our target value. The CBF and CBF values constrained the model, meaning the findings in fig 1b were the only ones which allowed all of the equations to be satisfied. Note, there is an increase in perfusion pressure due to the increased arterial inflow pressure. The model predicts the arterial resistance in LA is increased by 24.7% above normal. Normally an increase in the perfusion pressure from an increase in arterial pressure constricts the arterioles (as found in the model) and also reduces the CBV [34]. However, the global CBV is elevated in LA. Therefore, we required an increase in the venous outflow resistance to dilate the veins and capillaries to resolve the equations successfully. This outflow resistance increase appears to correlate with the literature. An increased diameter of the basal veins of Rosenthal and internal cerebral veins is associated with the white matter hyperintensity volume in LA [35]. In another study, the internal cerebral veins were enlarged, being related to both aging and increased white matter hyperintensity independently [36]. Using an MRI susceptibility sequence, the number of pixels within the deep white matter (assumed to be within the larger deep medullary veins) was increased by 40% in leukoaraiosis, compared to controls and correlated with white matter disease volumes [30]. Given the dilatation within the veins of the brain also extends into the subarachnoid space, the venous outflow stenosis must be between the distal ends of the veins and the sinuses.
It can be seen from fig 1 that there are similarities between LA and NPH. There is an overall reduction in CBF compared to normal, which is slightly more pronounced in NPH than in LA. There is a 25% increase in arterial resistance compared to normal in both diseases and a 123% increase in venous outflow resistance in LA, which is more pronounced than the 98% increase in venous outflow resistance in NPH. The differences between diseases are that NPH appears to be associated with a CSF outflow resistance increase, manifest as an increased pressure gradient across the arachnoid granulations within the sinus wall compared to no change in LA. The capillary transmural pressure is higher in LA than NPH, which may bring about an increase in the overall CSF formation rate compared to NPH if the blood brain barrier were to be disrupted in the former [7]. Patients with leukoaraiosis showed a 34% increase in the CSF to serum albumen ratio, signifying a breakdown in the blood brain barrier [37]. This finding was independent of the degree of dementia, atrophy or presence of cerebral infarction. Similarly, An MRI contrast technique indicated there was significant BBB breakdown in LA [38]. The lack of a significant increase in ICP in LA would suggest the CSF outflow absorption is not deficient unlike in NPH.
4.2. Differences between the cortex and white matter
Figure 2 highlights the expected differences in the physiology between the cortical grey matter and the deeper white matter. Figure 2a models the effect of increasing the blood flow back to normal, as per the findings within the LA literature in the grey matter, as already discussed. The outflow cuff resistance was unaltered from the previous model and the effect was to dilate the arteries, capillaries and veins with an increase in total CBV to 63.5 ml from 59.2 ml in the original LA model. Thus, the euvolaemia model predicts the CBV to be only 2.8% less than the target of value of 65.3 mL as suggested by Markus et al [25]. This tends to indicate that the modelling may be accurate enough for the current purposes. Figure 2b is the results from previous modelling where the CBF was returned to normal in NPH [8]. The overall findings are very similar to fig 2a., with the only significant difference being the 8.3% increase in arterial resistance in LA compared to normal. This mostly comes about due to the increased perfusion pressure from the increased arterial inflow pressure. It can be seen that LA is likely not predominately a disease of the cortex, despite the increased venous and capillary pressures but is probably a disease of the white matter. Illustrating this, Brown et al., using Xenon CT before and after acetazolamide vasodilatation, found the cortical blood flow increased normally in leukoaraiosis patients but there was no significant increase in the white matter blood flow, indicating exhaustion of autoregulation in the deeper regions and preservation superficially [39]. However, the 61% increase in the cortical venous volume in LA as compared to normal may be expected to narrow the venous perivascular spaces and thus impede the glymphatic outflow as occurs in NPH [40]. Glymphatic disruption is noted to be a feature of LA [41] like NPH.
Figure 2c illustrates the effect of reducing the CBF to match the reduction in blood flow found in the white matter in leukoaraiosis. The modelling was unable to reach the target CBV unless there was also wall thickening and stenosis added to the venous segment. Moody et al. studied the deep medullary veins of the brain from 20- 800 µm diameter and found significant wall thickening in LA [42]. This thickening was termed venous collagenosis and was due to a large amount of collagen deposited within the walls. They found that 65% of subjects older than 60 years had at least 50% stenosis of their periventricular veins [42]. They suggested severe stenosis or occlusion of the deep cerebral veins may promote the development of leukoaraiosis [42]. In another study, collagenosis of small and medium caliber veins was significantly worse in those patients with larger volumes of LA [43]. In fact, the strongest predictor of LA score was stenosis of the large caliber veins [43]. Venous collagenosis is a major difference between pure LA and NPH with the NPH ischaemia model in fig 2d not requiring wall thickening or stenosis. In those with mixed disease (LA and NPH), the LA is associated with more severe symptoms but may not affect the CSF shunting outcome [31].
In both NPH and LA there was a large increase in arterial inflow resistance required in the white matter despite the venous resistance increase. A major difference between NPH and LA is the reversibility of the reduced blood flow and presumably the reversibility of this large increase in arterial resistance. In NPH there was a 53% increase in CBF in those who improved with shunting, indicating retained autoregulation [44]. This suggested to us the brain was electing to limit the CBF in NPH, perhaps to minimize the ICP by reducing the CSF formation rate increase inherent when there is opening of the blood brain barrier [8,45]. There is no apparent residual autoregulation within the white matter in LA [39]. This would suggest there may be some irreversible arterial disease as well as venous collagenosis in the deep white matter in LA. Some authors suggest that arteriolosclerosis is almost always detected within areas of LA [46] but not all studies show such a strong correlation. Both arteriolosclerosis and venular collagenosis are more prevalent with age. However, arterial sclerosis was associated with lacunar infarction and some haemosiderin deposition but not leukoaraiosis severity in one study [47]. Venular collagenosis was not associated with lacunes or haemosiderin but was associated with leukoaraiosis [47]. In another study, arterial wall collagen deposition was not a predictor of white matter disease but venous collagen deposition was [48]. The results of a meta-analysis suggest that although there is lower blood flow in LA, the findings did not strongly support causation. The results suggested the reduced flow may reflect a reduction in supply required by the tissue secondary to decreased neuronal activity or atrophy [49]. The findings indicate there may be a functional arterial cause rather than a structural cause for the lack of irreversibility of the reduced white matter blood flow in LA.
4.3. Pulsatility as a cause of leukoaraoisis
It is apparent that there is a reduction in blood flow to the white matter in LA but as discussed this may not be the causative factor. Previously, one of the current authors developed a theory suggesting there was a common pathophysiology between Alzheimer’s disease, vascular dementia and NPH based on intracranial pulsation energy dissipation [50]. It was suggested there was a spectrum of pulsation differences between these diseases, with the process termed pulse wave encephalopathy. The literature appears to support this hypothesis, the percentage volume of white matter affected by LA increases in accordance with arterial pulse pressure quartiles in male subjects [2]. The severity of LA correlates with the middle cerebral pulsatility and the pulse wave velocity (a measure of aortic arterial stiffness) in multivariate analysis [51]. The authors concluded the increased arterial stiffening causes increased transmission of enhanced aortic pulsatility to the cerebral circulation, causing LA due to either decreased perfusion in diastole, increased endothelial shear stress or impaired autoregulation [51]. However, the increased pulsation is not just limited to the arterial tree. Patients with dementia and moderate leukoaraiosis showed a 69%, 48% and 34% increase in pulsatility in the blood flow of the arteries, sagittal sinus and superficial cortical veins compared to demented patients without leukoaraiosis [52]. In vascular dementia patients, the absolute pulsation volume of the straight sinus (which drains the deep white matter) is increased by 57% compared to normal elderly controls [53]. These venous findings correlate with NPH, where there was a 56% increase in the pulsatility index of the arteries and a 70% increase in this metric in the sagittal sinus compared to demented patients without leukoaraiosis [52]. In NPH, the CSF pulse pressure increases by 6-8 times normal [54]. The CSF pulse pressure has not been measured in LA but given the arterial, cortical vein and sinus pulsation findings, it is likely to be increased similar to NPH. Interestingly, when veins are used as arterial bypass grafts and experience pulsatile flow, they become thickened similar to the collagenosis already discussed. In a porcine venous graft model, after the first week, wall thickening occurs largely due to extracellular matrix deposition (fibrosis) and neointimal smooth muscle cell proliferation [55]. Could pulsation energy deposited within the walls of the veins be behind the venous collagenosis noted in white matter disease as well?
The modelling highlights an apparent paradox. The previous NPH modelling suggested a 37% increase in pressure gradient across the outflow cuff led to a 98% increase in outflow resistance of this segment (see fig 1c) [7]. In the current modelling, a normal pressure gradient across the outflow cuff in LA still resulted in a 123% increase in resistance of this segment (see fig 1b). Where does this increase in resistance come from? We have previously suggested this may be due to the effect of the CSF pulsation pressure inducing a phenomena in the veins known as impedance pumping [56]. However, there may be a simpler explanation for this finding. The cortical veins are a series of collapsible tubes in which the pressure external to the tubes (ICP) exceeds the sinus pressure. This arrangement represents a Starling resistor. The collapse of the distal end of a Starling resistor maintains the pressure across the tube wall upstream to the collapse. This upstream transmural pressure (TMP) it is only very slightly positive in classical Starling resistors [57]. Thus, if the ICP were to increase, the venous TMP would be expected to remain nearly constant and the venous pressure be minimally above the ICP [57]. It is apparent from the modelling the cortical veins do not act as traditional Starling resistors in this regard. The normal vein TMP is 2.5 mmHg (not close to zero as an ideal Starling resistor model would predict) and increases to 4.8 mmHg in our NPH model (see fig 1c). It further increases to 9 mmHg in LA in our model. If the veins were ideal Starling resistors, then the upstream venous pressure should normally be just above the ICP i.e., 11.5 mmHg. This would give a normal venous cuff resistance of 5.3 mmHg/L/min but we estimate this to be 8.7 mmHg/L/min in the normal model. The CSF pulse originates from the intracranial arterial pulse. It is dissipated by shifting CSF backwards and forwards through the foramen magnum and by compressing the cortical veins, making the venous outflow in the sagittal sinus pulsatile [52]. This sinus pulsation occurs due to compression of the outflow cuff. In MRV studies of humans with elevated ICP, 80% showed a narrow segment of the cortical vein, approximately 5mm, long at the level of the cuff. This appeared in only 10% of the control subjects [58]. The diameter of the cortical veins increased by 30% upstream from the cuff in those patients with raised ICP compared to controls, suggesting an increase in venous outflow resistance over and above that required to keep the veins open [58]. Increasing the ICP increases the CSF pulse pressure due to the intracranial compliance being reduced [59]. Suggesting there may be a correlation between the ICP pulse pressure and venous outflow resistance. The peak flow in the cortical veins lags behind the peak flow in the sinus by 100 mS [52]. Despite the sinus being distal to the veins which drain into it. This suggests the cuff pulsation delays the cortical vein emptying by generating a pressure wave going back towards the capillaries [52]. It may be envisaged that a rhythmic contraction of the vein cuff, which reduces its volume by 50% below the mean volume and then increases its volume by 50% above the mean, would increase and decrease the resistance to the outflow by the same amount and therefore they would cancel each other out. However, this may not be the case. The volume of a cylinder changes as the square of the radius but Poiseuille’s equation (18) indicates the outflow resistance varies with the inverse fourth power of the radius. Therefore, a systolic reduction in venous cuff volume of 50% would increase its outflow resistance by 4 times but an increase in volume by 50% would decrease its resistance by only 0.44 times. Given that systole lasts for 40% of the cardiac cycle and diastole for 60% on average [60], the average cuff resistance over the entire cardiac cycle would be increased by 1.9 times normal with such a pulsation. Reducing the resultant cuff volume by 2/3 of the original in systole and increasing it by 2/3 in diastole with a larger pulse pressure, would increase the average outflow resistance by 4.9 times, suggesting increasing the pulsation pressure increases the venous outflow resistance. Thus, we suggest an increase in the CSF pulse pressure in both NPH and LA would increase the outflow resistance and pressure and send a pressure wave back toward the capillaries. In LA we suggest this pulsation energy induces vein wall thickening making the walls less compliant and propagating the pressure waves further towards the capillaries with a greater amplitude [52].
4.4. Clinical utility
If we are correct and the CSF pulsations generate both an increase in the venous outflow pressure and a pulse pressure wave travelling back towards the capillaries, then this could explain the blood brain barrier disruption in both diseases. A mouse model indicates that an increase in venous pressure will disrupt the blood brain barrier without any other requirement [61]. Therefore, in order to limit the effects of this pulsation energy and the progression of LA, strategies aimed at reducing the pulsation amplitude in both the arterial inflow and the subarachnoid space could have therapeutic value. It has been suggested that syringomyelia of the cord (the development of a cystic cavity) secondary to a Chiari I malformation (foramen magnum being blocked by the cerebellum) is analogous to NPH [62]. There is a reduction in spinal canal subarachnoid space compliance, increased CSF pulse pressures and disruption of the blood spinal cord barrier in syringomyelia similar to NPH [62]. A dog model of syringomyelia showed dilatation of the venous outflow of the cord similar to our findings in both NPH and LA [63]. A posterior fossa decompression increases the compliance of the spinal canal, reduces the CSF pulse pressure and collapses the syrinx [62]. Interestingly, increasing the cranial compliance by a posterior fossa decompression also improves Chiari I associated hydrocephalus in 90% of cases without further treatment [64]. Similarly, subtemporal craniectomy is noted to significantly reduce the ventricle size in patients with shunt dependant hydrocephalus [65]. Increasing the intracranial compliance by craniectomy would reduce the ICP pulse pressure. Could the same procedure halt the progression of LA?
4.5. Limitations
Poiseuille’s equation requires flow through a thin, rigid, circular tube of a Newtonian fluid, without turbulence. To the degree that these assumptions hold, the findings would be accurate. However, despite its limitations, this equation is commonly used in modelling the vasculature in the literature.
We have assumed the mean arterial inflow pressure to be increased in LA at 110 mmHg. We decided to perform a sensitivity analysis by increasing the arterial inflow pressure to less than the cut off for autoregulation failure at 150 mmHg [22]. This analysis found the arterial pressure does not alter the capillary pressure because the arterial resistance must increase to keep the blood flow from increasing. The increased pressure drop across the arteries buffers the capillaries and, therefore, means the capillary pressures remain unchanged.
The model sets the capillary volume to be unchanged as the capillary TMP is reduced below normal. This is because the critical buckling pressure for such a small tube as a capillary is very high and is never approached in the model [66].
Some of the data we required is not available from human studies. In its absence, animal studies were utilised. This is exemplified by the data linking dilatation of the capillaries to the changes in TMP, which was taken from rodent studies and the normal venous TMP, which was obtained from primate studies. We have no way of knowing if the animal data closely approximates human findings, so this is a limitation.
5. Conclusions
Our modelling suggests the vascular physiology of leukoaraiosis is very similar to normal pressure hydrocephalus, with the major difference being the non-reversibility of LA. This is perhaps due to venous wall structural changes. An increase in intracranial pulse pressure can increase the venous outflow resistance and also direct a pulse pressure wave back towards the capillary bed. This may be the cause of the blood brain barrier disruption in both diseases.
Author Contributions
Conceptualisation GAB, ARB. Methodology GAB, ARB. Validation ARB. Writing original draft preparation GAB. Writing- Review and editing GAB ARB. All authors read and approved the final manuscript.
Funding
This research received no external funding.
Institutional Review Board Statement
Not applicable.
Informed Consent Statement
Not applicable.
Data Availability Statement
All data is contained within the article.
Conflicts of Interest
The authors declare no conflicts of interest.
References
- iu, C.K.; Miller, B.L.; Cummings, J.L.; Mehringer, C.M.; Goldberg, M.A.; Howng, S.L.; Benson, D.F. A quantitative MRI study of vascular dementia. Neurology 1992, 42, 138–143. [Google Scholar] [CrossRef]
- Kim, S.H.; Shim, J.Y.; Lee, H.R.; Na, H.Y.; Lee, Y.J. The relationship between pulse pressure and leukoaraiosis in the elderly. Arch. Gerontol. Geriatr. 2012, 54, 206–209. [Google Scholar] [CrossRef]
- Pantoni, L.; Garcia, J.H. The significance of cerebral white matter abnormalities 100 years after Binswanger's report. A review. Stroke 1995, 26, 1293–1301. [Google Scholar] [CrossRef]
- Lindgren, A.; Roijer, A.; Rudling, O.; Norrving, B.; Larsson, E.M.; Eskilsson, J.; Wallin, L.; Olsson, B.; Johansson, B.B. Cerebral lesions on magnetic resonance imaging, heart disease, and vascular risk factors in subjects without stroke. A population-based study. Stroke 1994, 25, 929–934. [Google Scholar] [CrossRef]
- Inzitari, D.; Diaz, F.; Fox, A.; Hachinski, V.C.; Steingart, A.; Lau, C.; Donald, A.; Wade, J.; Mulic, H.; Merskey, H. Vascular risk factors and leuko-araiosis. Arch. Neurol. 1987, 44, 42–47. [Google Scholar] [CrossRef] [PubMed]
- Tullberg, M.; Jensen, C.; Ekholm, S.; Wikkelso, C. Normal pressure hydrocephalus: vascular white matter changes on MR images must not exclude patients from shunt surgery. AJNR Am. J. Neuroradiol. 2001, 22, 1665–1673. [Google Scholar]
- Bateman, G.A.; Bateman, A.R. A lumped parameter modelling study of cerebral autoregulation in normal pressure hydrocephalus suggests the brain chooses to be ischemic. Sci. Rep. 2024, 14, 24373. [Google Scholar] [CrossRef] [PubMed]
- Bateman, G.A.; Bateman, A.R. A Lumped Parameter Model Suggests That Infusion Studies Overestimate the Cerebrospinal Fluid Outflow Resistance in Normal Pressure Hydrocephalus. Brain Sci. 2024, 14, 1242. [Google Scholar] [CrossRef] [PubMed]
- Davson, H.; Welch, K.; Segal, M.B. Physiology and Pathophysiology of the Cerebrospinal Fluid; Churchill Livingstone: 1987.
- Zislin, V.; Rosenfeld, M. Impedance Pumping and Resonance in a Multi-Vessel System. Bioengineering 2018, 5, 63. [Google Scholar] [CrossRef] [PubMed]
- Ursino, M. A mathematical study of human intracranial hydrodynamics. Part 1--The cerebrospinal fluid pulse pressure. Ann. Biomed. Eng. 1988, 16, 379–401. [Google Scholar] [CrossRef] [PubMed]
- Salmon, J.H.; Timperman, A.L. Effect of intracranial hypotension on cerebral blood flow. J. Neurol. Neurosurg. Psychiatry 1971, 34, 687–692. [Google Scholar] [CrossRef]
- Cirovic, S.; Walsh, C.; Fraser, W.D. Mathematical study of the role of non-linear venous compliance in the cranial volume-pressure test. Med. Biol. Eng. Comput. 2003, 41, 579–588. [Google Scholar] [CrossRef]
- Fleischman, D.; Berdahl, J.P.; Zaydlarova, J.; Stinnett, S.; Fautsch, M.P.; Allingham, R.R. Cerebrospinal fluid pressure decreases with older age. PLoS One 2012, 7, e52664. [Google Scholar] [CrossRef]
- Benabid, A.L.; De Rougemont, J.; Barge, M. [Cerebral venous pressure, sinus pressure and intracranial pressure]. Neurochirurgie 1974, 20, 623–632. [Google Scholar]
- Pollay, M. The function and structure of the cerebrospinal fluid outflow system. Cerebrospinal Fluid. Res. 2010, 7, 9. [Google Scholar] [CrossRef] [PubMed]
- Bateman, G.A.; Siddique, S.H. Cerebrospinal fluid absorption block at the vertex in chronic hydrocephalus: obstructed arachnoid granulations or elevated venous pressure? Fluids Barriers CNS 2014, 11, 11. [Google Scholar] [CrossRef]
- Johnston, I.H.; Rowan, J.O. Raised intracranial pressure and cerebral blood flow. 3. Venous outflow tract pressures and vascular resistances in experimental intracranial hypertension. J. Neurol. Neurosurg. Psychiatry 1974, 37, 392–402. [Google Scholar] [CrossRef]
- Hua, J.; Liu, P.; Kim, T.; Donahue, M.; Rane, S.; Chen, J.J.; Qin, Q.; Kim, S.G. MRI techniques to measure arterial and venous cerebral blood volume. Neuroimage 2019, 187, 17–31. [Google Scholar] [CrossRef]
- Menéndez González, M. CNS Compartments: The Anatomy and Physiology of the Cerebrospinal Fluid. In Liquorpheresis: Cerebrospinal Fluid Filtration to Treat CNS Conditions, Menéndez González, M., Ed.; Springer Nature Switzerland: Cham, 2023; pp. 1–19. [Google Scholar]
- Qvarlander, S.; Sundstrom, N.; Malm, J.; Eklund, A. CSF formation rate-a potential glymphatic flow parameter in hydrocephalus? Fluids Barriers CNS 2024, 21, 55. [Google Scholar] [CrossRef] [PubMed]
- Claassen, J.; Thijssen, D.H.J.; Panerai, R.B.; Faraci, F.M. Regulation of cerebral blood flow in humans: physiology and clinical implications of autoregulation. Physiol. Rev. 2021, 101, 1487–1559. [Google Scholar] [CrossRef] [PubMed]
- Duelli, R.; Kuschinsky, W. Changes in brain capillary diameter during hypocapnia and hypercapnia. J. Cereb. Blood Flow. Metab. 1993, 13, 1025–1028. [Google Scholar] [CrossRef]
- R, D.E.S.; Ranieri, A.; Bonavita, V. Starling resistors, autoregulation of cerebral perfusion and the pathogenesis of idiopathic intracranial hypertension. Panminerva Med. 2017, 59, 76–89. [Google Scholar] [CrossRef]
- Markus, H.S.; Lythgoe, D.J.; Ostegaard, L.; O'Sullivan, M.; Williams, S.C. Reduced cerebral blood flow in white matter in ischaemic leukoaraiosis demonstrated using quantitative exogenous contrast based perfusion MRI. J. Neurol. Neurosurg. Psychiatry 2000, 69, 48–53. [Google Scholar] [CrossRef]
- Bateman, G.A.; Bateman, A.R. Brain Ischemia in Alzheimer’s Disease May Partly Counteract the Disruption of the Blood–Brain Barrier. Brain Sciences 2025, 15, 269. [Google Scholar] [CrossRef] [PubMed]
- Bateman, G.A.; Bateman, A.R. A Lumped Parameter Modelling Study of Idiopathic Intracranial Hypertension Suggests the CSF Formation Rate Varies with the Capillary Transmural Pressure. Brain Sci. 2025, 15. [Google Scholar] [CrossRef]
- Yao, H.; Sadoshima, S.; Ibayashi, S.; Kuwabara, Y.; Ichiya, Y.; Fujishima, M. Leukoaraiosis and dementia in hypertensive patients. Stroke 1992, 23, 1673–1677. [Google Scholar] [CrossRef]
- Good, C.D.; Johnsrude, I.; Ashburner, J.; Henson, R.N.; Friston, K.J.; Frackowiak, R.S. Cerebral asymmetry and the effects of sex and handedness on brain structure: a voxel-based morphometric analysis of 465 normal adult human brains. Neuroimage 2001, 14, 685–700. [Google Scholar] [CrossRef]
- Yan, S.; Wan, J.; Zhang, X.; Tong, L.; Zhao, S.; Sun, J.; Lin, Y.; Shen, C.; Lou, M. Increased visibility of deep medullary veins in leukoaraiosis: a 3-T MRI study. Front. Aging Neurosci. 2014, 6, 144. [Google Scholar] [CrossRef]
- Cai, H.; Huang, K.; Yang, F.; He, J.; Hu, N.; Gao, H.; Feng, S.; Qin, L.; Wang, R.; Yang, X.; et al. The contribution of cerebral small vessel disease in idiopathic normal pressure hydrocephalus: Insights from a prospective cohort study. Alzheimers Dement. 2025, 21, e14395. [Google Scholar] [CrossRef] [PubMed]
- Hatazawa, J.; Shimosegawa, E.; Satoh, T.; Toyoshima, H.; Okudera, T. Subcortical hypoperfusion associated with asymptomatic white matter lesions on magnetic resonance imaging. Stroke 1997, 28, 1944–1947. [Google Scholar] [CrossRef] [PubMed]
- Helenius, J.; Perkio, J.; Soinne, L.; Ostergaard, L.; Carano, R.A.; Salonen, O.; Savolainen, S.; Kaste, M.; Aronen, H.J.; Tatlisumak, T. Cerebral hemodynamics in a healthy population measured by dynamic susceptibility contrast MR imaging. Acta Radiol. 2003, 44, 538–546. [Google Scholar] [CrossRef] [PubMed]
- Gwinnutt, C.L.; Saha, B. Cerebral blood flow and intracranial pressure. Anaesthesia & Intensive Care Medicine 2005, 6, 153–156. [Google Scholar] [CrossRef]
- Houck, A.L.; Gutierrez, J.; Gao, F.; Igwe, K.C.; Colon, J.M.; Black, S.E.; Brickman, A.M. Increased Diameters of the Internal Cerebral Veins and the Basal Veins of Rosenthal Are Associated with White Matter Hyperintensity Volume. AJNR Am. J. Neuroradiol. 2019, 40, 1712–1718. [Google Scholar] [CrossRef]
- Huang, Z.; Tu, X.; Lin, Q.; Zhan, Z.; Tang, L.; Liu, J. Increased internal cerebral vein diameter is associated with age. Clin. Imaging 2021, 78, 187–193. [Google Scholar] [CrossRef]
- Pantoni, L.; Inzitari, D.; Pracucci, G.; Lolli, F.; Giordano, G.; Bracco, L.; Amaducci, L. Cerebrospinal fluid proteins in patients with leucoaraiosis: possible abnormalities in blood-brain barrier function. J. Neurol. Sci. 1993, 115, 125–131. [Google Scholar] [CrossRef]
- Uh, J.; Yezhuvath, U.; Cheng, Y.; Lu, H. In vivo vascular hallmarks of diffuse leukoaraiosis. J. Magn. Reson. Imaging 2010, 32, 184–190. [Google Scholar] [CrossRef]
- Brown, m.m.; Pelz, D.M.; Hachinski, V. Proceedings of the Association of British Neurologists and the Society of British Neurological Surgeons, Bristol, 4-6 April 1990. Journal of Neurology, Neurosurgery & Psychiatry 1990, 53, 815. [Google Scholar] [CrossRef]
- Kikuta, J.; Kamagata, K.; Taoka, T.; Takabayashi, K.; Uchida, W.; Saito, Y.; Andica, C.; Wada, A.; Kawamura, K.; Akiba, C.; et al. Water Diffusivity Changes Along the Perivascular Space After Lumboperitoneal Shunt Surgery in Idiopathic Normal Pressure Hydrocephalus. Front. Neurol. 2022, 13, 843883. [Google Scholar] [CrossRef] [PubMed]
- Sabayan, B.; Westendorp, R.G.J. Neurovascular-glymphatic dysfunction and white matter lesions. Geroscience 2021, 43, 1635–1642. [Google Scholar] [CrossRef]
- Moody, D.M.; Brown, W.R.; Challa, V.R.; Anderson, R.L. Periventricular venous collagenosis: association with leukoaraiosis. Radiology 1995, 194, 469–476. [Google Scholar] [CrossRef] [PubMed]
- Keith, J.; Gao, F.Q.; Noor, R.; Kiss, A.; Balasubramaniam, G.; Au, K.; Rogaeva, E.; Masellis, M.; Black, S.E. Collagenosis of the Deep Medullary Veins: An Underrecognized Pathologic Correlate of White Matter Hyperintensities and Periventricular Infarction? J. Neuropathol. Exp. Neurol. 2017, 76, 299–312. [Google Scholar] [CrossRef]
- Tanaka, A.; Kimura, M.; Nakayama, Y.; Yoshinaga, S.; Tomonaga, M. Cerebral blood flow and autoregulation in normal pressure hydrocephalus. Neurosurgery 1997, 40, 1161–1165, discussion 1165-1167. [Google Scholar] [CrossRef]
- Bateman, G.A.; Bateman, A.R. A Lumped Parameter Modelling Study of Cerebral Autoregulation in Normal Pressure Hydrocephalus: Does the Brain choose to be Ischemic? Research Square 2024, Preprint. [Google Scholar] [CrossRef]
- Fazekas, F.; Kleinert, R.; Offenbacher, H.; Schmidt, R.; Kleinert, G.; Payer, F.; Radner, H.; Lechner, H. Pathologic correlates of incidental MRI white matter signal hyperintensities. Neurology 1993, 43, 1683–1689. [Google Scholar] [CrossRef]
- Cao, Y.; Huang, M.Y.; Mao, C.H.; Wang, X.; Xu, Y.Y.; Qian, X.J.; Ma, C.; Qiu, W.Y.; Zhu, Y.C. Arteriolosclerosis differs from venular collagenosis in relation to cerebrovascular parenchymal damages: an autopsy-based study. Stroke Vasc. Neurol. 2023, 8, 267–275. [Google Scholar] [CrossRef] [PubMed]
- Lahna, D.; Schwartz, D.L.; Woltjer, R.; Black, S.E.; Roese, N.; Dodge, H.; Boespflug, E.L.; Keith, J.; Gao, F.; Ramirez, J.; et al. Venous Collagenosis as Pathogenesis of White Matter Hyperintensity. Ann. Neurol. 2022, 92, 992–1000. [Google Scholar] [CrossRef] [PubMed]
- Shi, Y.; Thrippleton, M.J.; Makin, S.D.; Marshall, I.; Geerlings, M.I.; de Craen, A.J.M.; van Buchem, M.A.; Wardlaw, J.M. Cerebral blood flow in small vessel disease: A systematic review and meta-analysis. J. Cereb. Blood Flow. Metab. 2016, 36, 1653–1667. [Google Scholar] [CrossRef] [PubMed]
- Bateman, G.A. Pulse wave encephalopathy: a spectrum hypothesis incorporating Alzheimer's disease, vascular dementia and normal pressure hydrocephalus. Med. Hypotheses 2004, 62, 182–187. [Google Scholar] [CrossRef]
- Webb, A.J.; Simoni, M.; Mazzucco, S.; Kuker, W.; Schulz, U.; Rothwell, P.M. Increased cerebral arterial pulsatility in patients with leukoaraiosis: arterial stiffness enhances transmission of aortic pulsatility. Stroke 2012, 43, 2631–2636. [Google Scholar] [CrossRef]
- Bateman, G.A. Pulse-wave encephalopathy: a comparative study of the hydrodynamics of leukoaraiosis and normal-pressure hydrocephalus. Neuroradiology 2002, 44, 740–748. [Google Scholar] [CrossRef] [PubMed]
- Bateman, G.A.; Levi, C.R.; Schofield, P.; Wang, Y.; Lovett, E.C. The venous manifestations of pulse wave encephalopathy: windkessel dysfunction in normal aging and senile dementia. Neuroradiology 2008, 50, 491–497. [Google Scholar] [CrossRef] [PubMed]
- Stephensen, H.; Tisell, M.; Wikkelso, C. There is no transmantle pressure gradient in communicating or noncommunicating hydrocephalus. Neurosurgery 2002, 50, 763–771, discussion 771-763. [Google Scholar] [CrossRef] [PubMed]
- Shi, Y.; Pieniek, M.; Fard, A.; O'Brien, J.; Mannion, J.D.; Zalewski, A. Adventitial remodeling after coronary arterial injury. Circulation 1996, 93, 340–348. [Google Scholar] [CrossRef]
- Bateman, G.A.; Bateman, A.R.; Subramanian, G.M. Dilatation of the bridging cerebral cortical veins in childhood hydrocephalus suggests a malfunction of venous impedance pumping. Sci. Rep. 2022, 12, 13045. [Google Scholar] [CrossRef] [PubMed]
- Portnoy, H.D.; Chopp, M.; Branch, C.; Shannon, M.B. Cerebrospinal fluid pulse waveform as an indicator of cerebral autoregulation. J. Neurosurg. 1982, 56, 666–678. [Google Scholar] [CrossRef]
- Si, Z.; Luan, L.; Kong, D.; Zhao, G.; Wang, H.; Zhang, K.; Yu, T.; Pang, Q. MRI-based investigation on outflow segment of cerebral venous system under increased ICP condition. Eur. J. Med. Res. 2008, 13, 121–126. [Google Scholar]
- Nornes, H.; Aaslid, R.; Lindegaard, K.F. Intracranial pulse pressure dynamics in patients with intracranial hypertension. Acta Neurochir (Wien) 1977, 38, 177–186. [Google Scholar] [CrossRef]
- Bachani, N.; Vijay, S.; Vyas, A.; Jadwani, J.; Panicker, G.; Lokhandwala, Y. The diastolic duration as a percentage of the cardiac cycle in healthy adults: A pilot study. Indian. Heart J. 2025, 77, 73–77. [Google Scholar] [CrossRef]
- Fulop, G.A.; Ahire, C.; Csipo, T.; Tarantini, S.; Kiss, T.; Balasubramanian, P.; Yabluchanskiy, A.; Farkas, E.; Toth, A.; Nyul-Toth, A.; et al. Cerebral venous congestion promotes blood-brain barrier disruption and neuroinflammation, impairing cognitive function in mice. Geroscience 2019, 41, 575–589. [Google Scholar] [CrossRef] [PubMed]
- Bateman, G.A. Pulse wave myelopathy: An update of an hypothesis highlighting the similarities between syringomyelia and normal pressure hydrocephalus. Med. Hypotheses 2015, 85, 958–961. [Google Scholar] [CrossRef] [PubMed]
- Yamada, H.; Yokota, A.; Haratake, J.; Horie, A. Morphological study of experimental syringomyelia with kaolin-induced hydrocephalus in a canine model. J. Neurosurg. 1996, 84, 999–1005. [Google Scholar] [CrossRef] [PubMed]
- Koueik, J.; DeSanti, R.L.; Iskandar, B.J. Posterior fossa decompression for children with Chiari I malformation and hydrocephalus. Childs Nerv. Syst. 2022, 38, 153–161. [Google Scholar] [CrossRef]
- Linder, M.; Diehl, J.; Sklar, F.H. Subtemporal decompressions for shunt-dependent ventricles: mechanism of action. Surg. Neurol. 1983, 19, 520–523. [Google Scholar] [CrossRef] [PubMed]
- Bateman, G.A.; Bateman, A.R. Is the ischemia found in normal pressure hydrocephalus secondary to venous compression or arterial constriction? A comment on Ohmura et al. Fluids Barriers CNS 2025, 22, 29. [Google Scholar] [CrossRef] [PubMed]
Figure 1.
Results of modelling. (a) depicts the normal findings. The red segment is the arterial, orange the capillary, yellow the veins, green the outflow cuff and blue the venous sinus. The vascular pressures are shown within the vessels. The blue numbers are the transmural pressures at each site. The red number is the average capillary transmural pressure. The resistances and volumes for each segment are shown below the vessel. (b) shows the findings in leukoaraiosis. The red area indicates an increase in resistance in the arteries and outflow cuff and the green decreased resistance in the capillaries and veins compared to normal. Both the capillary and venous TMP are increased giving vascular dilatation. (c) shows the findings in NPH from a previous study. The overall findings are similar except the capillary TMP is lower and the pressure gradient across the sinus wall higher than in leukoaraiosis. Fig 1a and c. Reproduced from [7] under a CC BY 4.0 commons licence.
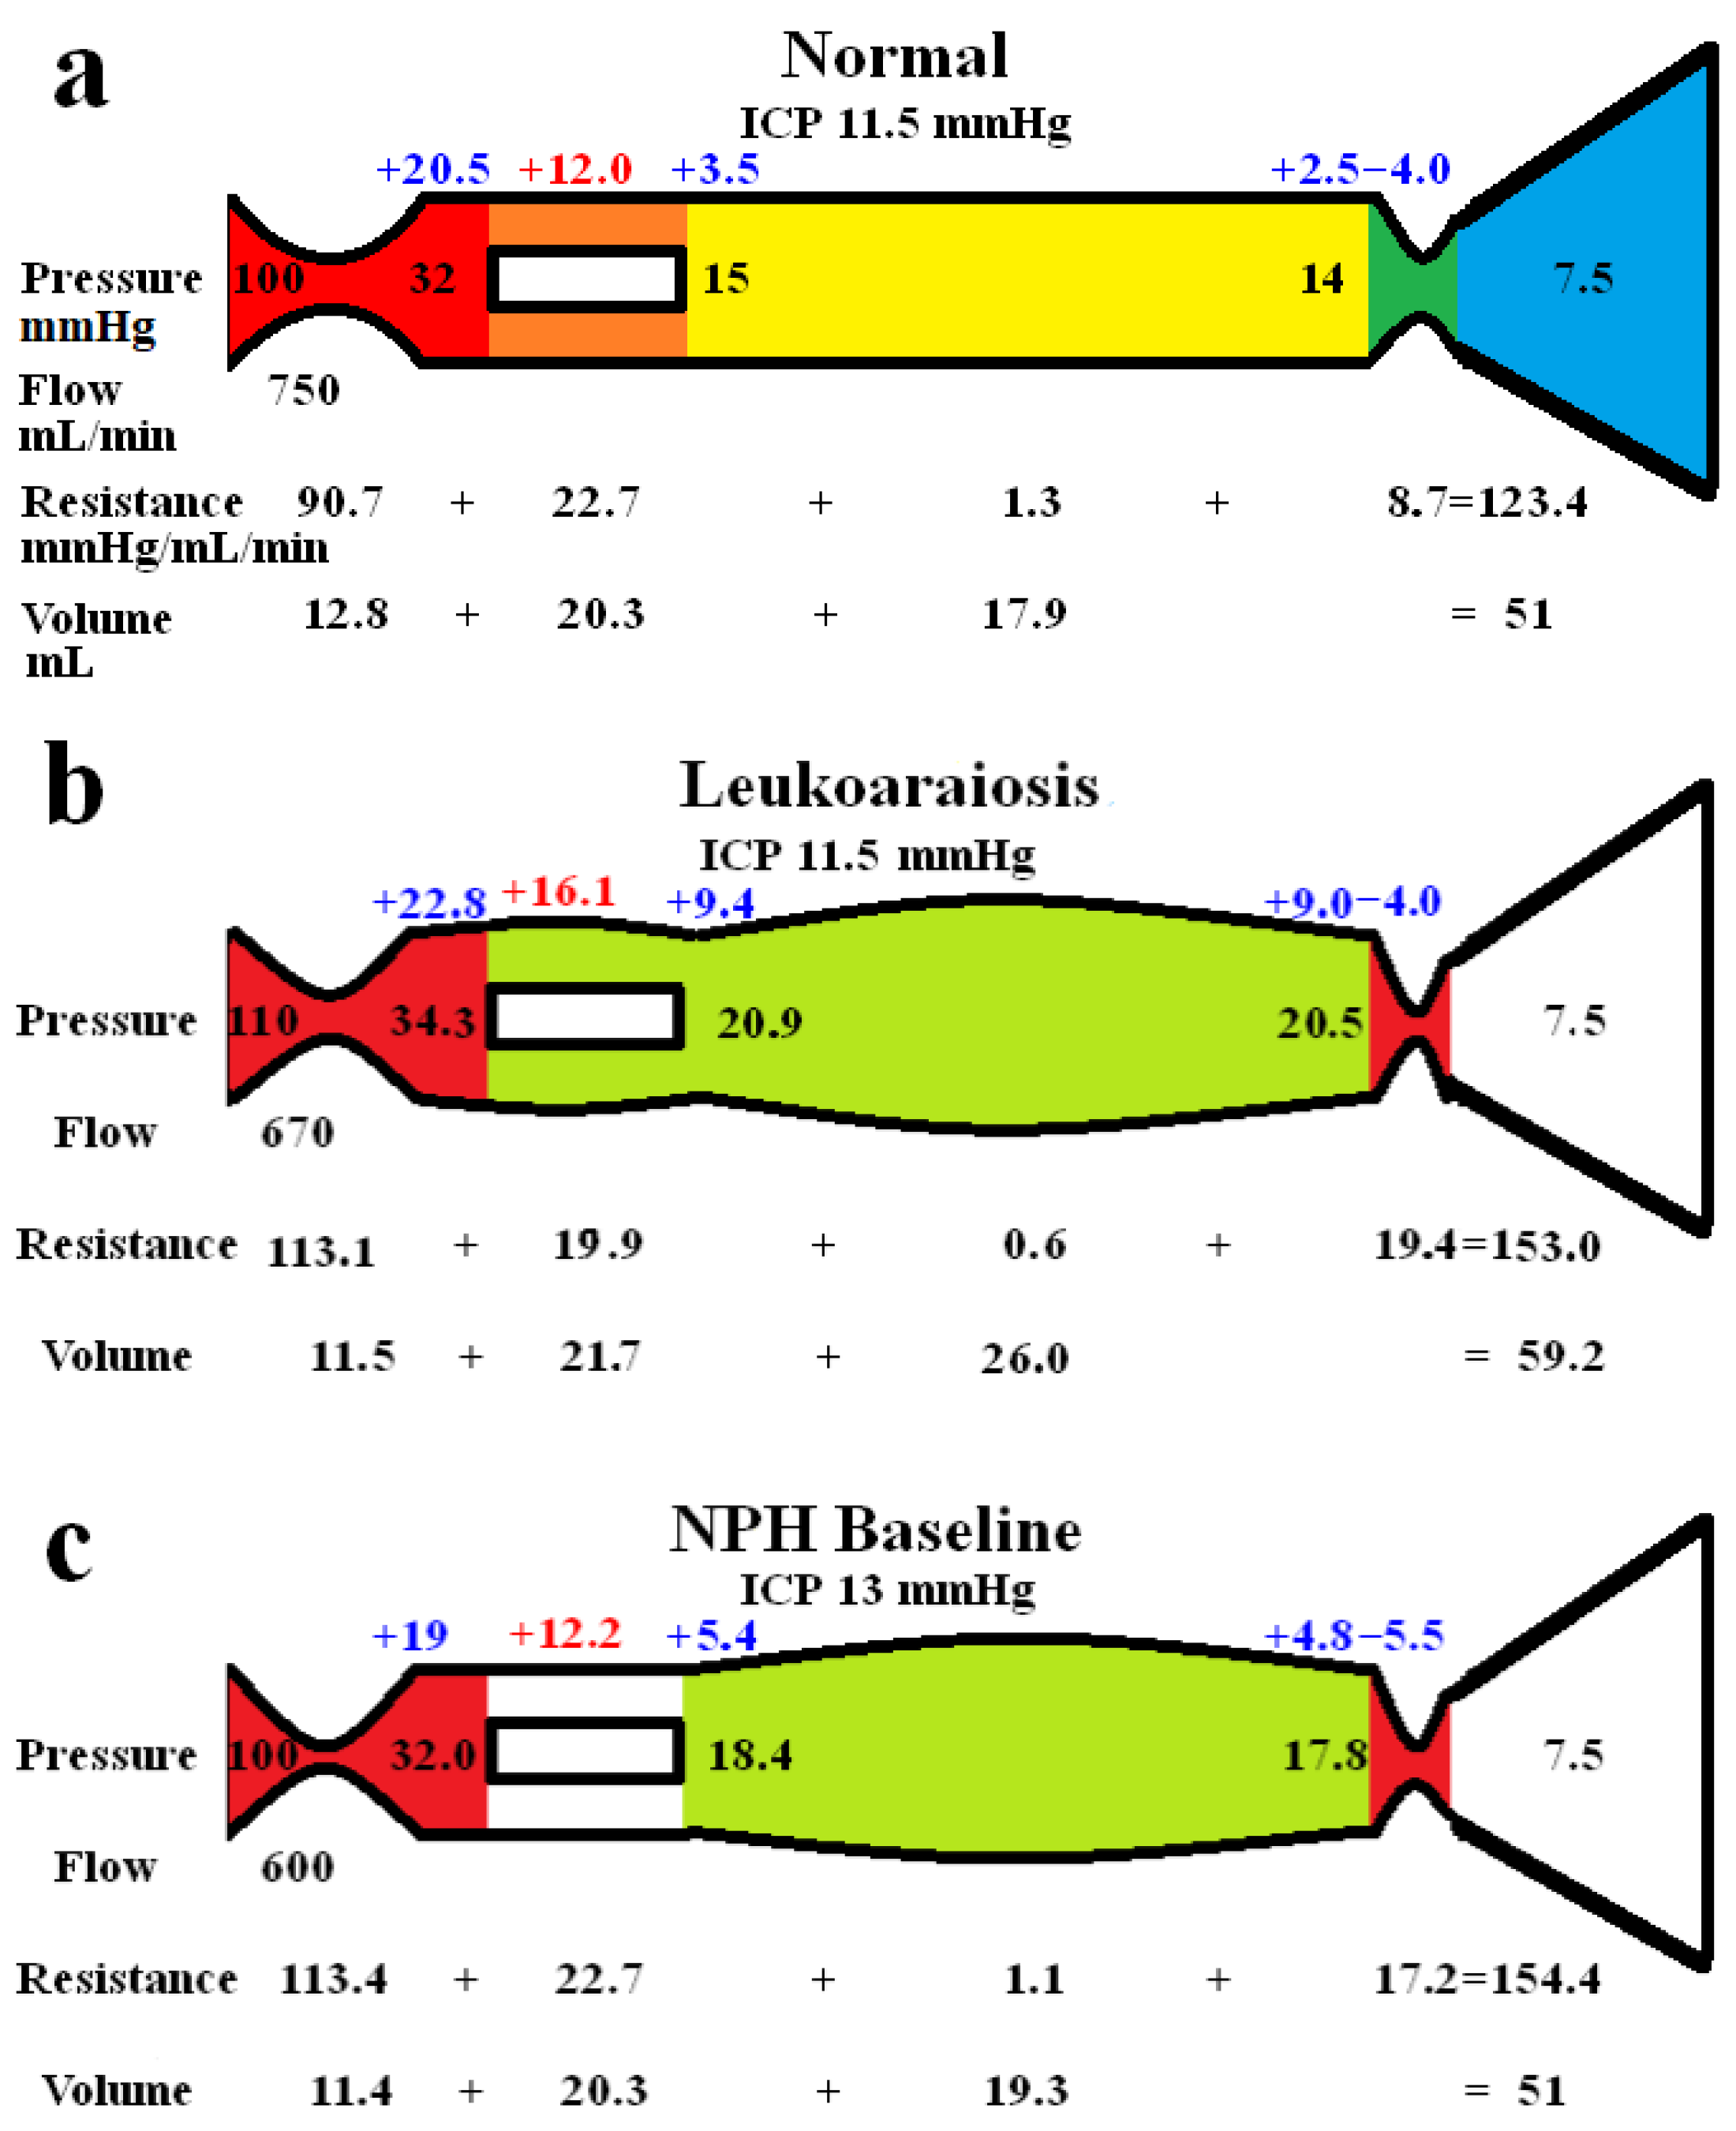
Figure 2.
Modelling of grey and white matter. (a) depicts the findings in leukoaraiosis following an increase in CBF back towards normal. There is an increase in arterial, capillary and venous volumes giving an overall CBV close to the target value. (b) shows the findings in NPH once the arterial inflow had been returned to normal from a previous study [8]. The overall findings are similar except the arterial resistance is slightly higher than normal in leukoaraiosis because of the higher inflow pressure. (c) shows the findings in leukoaraiosis once the CBF was reduced by 38%. The target CBV could not be attained unless there was venous wall thickened giving an overall 50% reduction in venous volume compared to fig 2a. (d) shows the findings in NPH from a previous study where the CBF was reduced. The overall findings are similar fig 2c except the requirement for venous wall thickening as seen in 2c is not required in 2d. Fig 2b and d. Reproduced from [8] under a CC BY 4.0 commons licence.
Disclaimer/Publisher’s Note: The statements, opinions and data contained in all publications are solely those of the individual author(s) and contributor(s) and not of MDPI and/or the editor(s). MDPI and/or the editor(s) disclaim responsibility for any injury to people or property resulting from any ideas, methods, instructions or products referred to in the content. |
© 2025 by the authors. Licensee MDPI, Basel, Switzerland. This article is an open access article distributed under the terms and conditions of the Creative Commons Attribution (CC BY) license (http://creativecommons.org/licenses/by/4.0/).
Copyright: This open access article is published under a Creative Commons CC BY 4.0 license, which permit the free download, distribution, and reuse, provided that the author and preprint are cited in any reuse.


