
Submitted:
29 July 2025
Posted:
30 July 2025
You are already at the latest version
Abstract
Applying the melt quenching method (cooling rate 101-102K/s), new multicomponent vanadate glasses were synthesized, containing different amounts of MoO3 at the expense of B2O3 with the composition 20Li2O:(30-х)B2O3:50V2O5:xMoO3, x = 10, 20 mol%. The obtained samples were characterized by X-ray diffraction, infrared spectroscopy, differential scanning calorimetry and impedance spectroscopy. The density of the glasses was measured by the Archimedes method, on the basis of which the physicochemical parameters molar volume, oxygen molar volume and oxygen packing density were calculated. It was found that the replacement of B2O3 with MoO3 leads to changes in electrical conductivity, which are a consequence of the increase in non-bridging oxygen atoms in the amorphous structure. The electrochemical characterization of the 20Li2O:(30-х)B2O3:50V2O5:20MoO3 glass obtained was performed by assembling an all-solid-state cell, employing 20Li2O:(30-х)B2O3:50V2O5:20MoO3 glass as a cathode active material. The obtained results show that the studied glass composition is interesting in view of their potential application as cathode materials in all-solid-state lithium-ion batteries.
Keywords:
glasses
; structure
; density
; all solid state battery
1. Introduction
Currently, various types of batteries are widely used to power [1,2] consumer electronics, mobile devices, lighting elements, medical equipment, etc. Batteries are applicable [1] in lifting and transport equipment (electric trucks, stackers, etc.), hybrid cars, electric cars, vessels, and others. Stationary energy storage systems provide an alternative source of electricity to industrial and residential users. At the same time, due to the high reliability [1,2] of lithium-ion batteries, their further development and development of new generation samples is of significant interest [3,4,5,6,7,8,9,10,11,12,13,14]. A number of research groups [15,16,17,18,19,20,21,22,23,24,25,26,27,28,29,30,31,32,33,34] studied the structure, physicochemical characteristics and electrochemical behavior of glass materials synthesized in oxide systems with the participation of various glass formers. Distinct areas (with different ratio and concentration of the oxide components) characterized by predominant ionic or electronic conductivity of the synthesized glasses have been established in the Li2O-P2O5-MoO3 system, [17,19,22]. The variation of DC and AC conductivity [22] was investigated varying the compositions of series of phosphate glasses yLi2O–(1-y)[0.35(MoO3)2–0.65(P2O5)]. It has been proven that the modification of glassy materials from the Li2O-P2O5-MoO3 system [26], by introducing low concentrations of LiCl provokes a change in the conductivity mechanism from mixed (ionic-electronic) to predominantly ionic. For glasses [20] with compositions xLi2O–(100-2x)V2O5–xP2O5 (x=15,25,35,40 and 45 mol%), the transition from predominant electronic to ionic conductivity was established at a concentration of 40 mol% Li2O . In vitreous samples with compositions 50V2O5–(50−x)P2O5–xA2O (A=Li, Na, K), a decrease in DC conductivity was found with an increase in the content of alkali oxides [25]. The influence of crystallization on the ionic and electronic conductivity of vitreous materials synthesized in the Li2O–V2O5–P2O5 system was analyzed in ref. [24]. A significant increase in electronic conductivity was found upon crystallization of a sample with the composition 50Li2O–25V2O5–25P2O5. The nanostructured characteristics and ionic conductivity of Li1.3Nb0.3V1.7(PO4)3 glass-ceramic materials, potentially applicable as cathode materials in the production of batteries, were investigated [4]. For glasses with compositions xV2O5–(1-x)B2O3 at low V2O5 concentrations (0.05≤x≤0.5), it was found that the introduced divanadium pentoxide performs the role of a modifier, which favors the formation of boron-oxygen tetrahedra [18]. The higher content (x>0.5) of vanadium oxide provokes the formation of a glassy network made up of vanadium-oxygen tetrahedra. In binary systems xMeO–(100-x)V2O5 (Me=Ba, Mg, Sr), vanadium oxide acts as a glass former and forms an amorphous network of vanadium-oxygen polyhedra [21]. For compositions (100-x)[B2O3•Li2O]–xV2O5 with low values of x, the role of vanadium oxide is mainly that of a modifier during the simultaneous construction of VO4 tetrahedra [16]. The increase in V2O5 content is accompanied by a change in its structural role to a glass former and formation of VO5 trigonal bipyramids [16]. The local structure [29] of glasses synthesized in the Li2O–B2O3–V2O5 system was investigated, the coordination of boron (3 and 4) and vanadium (5 and 6) was determined, and a structural model of the amorphous network was developed. An increase in the fraction of four-coordinated boron with increasing vanadium concentration was found. Vitreous samples were obtained [27] with compositions 0.3Li2O–(0.7-x)B2O3–xV2O5 and x=0.3, 0.325, 0.35, 0.375, 0.4, 0.425, 0.45 and 0.475, in which no boron anomaly characteristic of borates was observed. glasses with a high Li2O content. The dominant role of electronic conductivity has been proven, growing exponentially (7.4×10⁻⁵ S cm−1 at x=0.475) with increasing temperature and with increasing vanadium content [27]. In a series of glasses with compositions 20Li2O-30V2O5-(50-x)SiO2-xB2O3 mol.% (x=10, 20, 30, 40), the structure and electrochemical activity of the samples were investigated [5]. For the composition of 20Li2O-30V2O5-40SiO2-10B2O3, the highest content of fraction V4+, increased electronic conductivity and higher charge-discharge capacity were recorded when compared with other samples. The reduction of the particle size by grinding (while preserving the amorphous structure of the material) stabilizes the charge-discharge cycle in the studied operating mode, lowers the impedance [5], facilitates the migration of Li+ ions and increases the conductivity. The possible states of vanadium from V5+ to V2+ allow [15] under certain structural conditions the realization of a complete charge-discharge cycle with adequate capacity. In the most cases, vanadium ions exist in the form of V3+, V4+ and V5+ with different coordination environments [31]. In glassy materials, vanadium ions exhibit mainly +4 and +5 oxidation states. V4+ ions with four-coordination form tetrahedral structural units, while V5+ ions exist in the amorphous network with coordination 4, 5, and 6, allowing the formation of tetrahedra, bipyramids, and octahedra, respectively [32]. For series of oxide glasses [30] with compositions xMoO3+(30-x)(V2O5)+70(B2O3), the DC conductivity was investigated in the interval 318 K–473 K. An increase in the values was recorded with increasing MoO3 concentration up to x=0, 15 and further decrease at x>0.15. With increasing MoO3 concentration, a non-linear change in density and molar volume was found. Mott's variable-range hopping model has been shown to allow adequate interpretation [30] of DC conductivity data obtained at T<θD/2.
The aim of the present work is to study the synthesis conditions, structure and impedance characteristics of new glassy materials from the Li2O-B2O3-V2O5-MoO3 system. The electrochemical performance of one selected glass composition was also investigated by assembling of all-solid-state cell, using the glass sample obtained as an active material
2. Results and Discussion
2.1. XRD and DCS Studies
Non-transparent and visually non-homogeneous glasses were obtained from the first series of compositions with lower V2O5 content (Table 1) (Figure 1a). According to the XRD data (Figure 1b), glass-crystalline material exhibiting an amorphous hallo and diffraction peaks corresponding to the Li0.66V2O5 (JCPDS-96-153-7322) and to the LiV3O8 (JCPDS-96-231-0691) was obtained from the ternary composition in the second series containing 50 mol% of V2O5 without MoO3 (Table 2). The addition of 10 and 20 mol% MoO3 leads to the formation of visually homogeneous x-ray amorphous samples (Figure 1b), while from the quaternary composition having higher MoO3 content of 30 and 40 mol% glass-crystalline samples containing LiVMoO6 as a crystalline phase were quenched (Figure 1c).
DSC analysis is also performed, as it is a useful method in suggesting structural changes that take place due to the compositional changes [35]. The glass transition temperature Tg gives information for both the strength of interatomic bonds at the glass network connectivity. The higher Tg corresponds to the more rigid structure, whereas the glass having more loose-packed structure have lower Tg [36,37]. The difference ΔT=Tc-Tg between the glass crystallization temperature (Tc) and glass transition temperature (Tg) has been frequently used as a rough measure for the glass thermal stability [38]. The higher ΔT value, the most favored is the glass forming process [39]. The Figure 2 compares the DSC curves of the two homogeneous glass samples x = 10 and x = 20 obtained.
The humps, corresponding to the glass transition temperature Tg, while the exothermic peaks are due to the glass crystallization temperature Tc. Their values and the calculated glass thermal stability ΔT are listed in Table 3. As it is seen Tg and Tc slightly decrease with the increasing MoO3 content. Having in mind that glass transition temperature is very sensitive to any change in the coordinating number of network forming atoms (i.e. short-range order) and to the formation of non-bridging oxygens [40,41] we can explain slight lessening of Tg with the changing of the short range order and with slight depolymerization of the amorphous network (increasing number of non-bridging oxygens) with the changing of the compositions. In addition, the values of Tg were correlated with average single bond enthalpy EB of glasses using the following relationship proposed in the ref [14,15]:
where ELi-O, EV-O, EMo-O and EB-O are the bond dissociation energies for the single bond:Li-O, V-O, Mo-O and B-O respectively, and the values of EB calculated are also included in the Table 3. The higher EB value of the glass x= 10 can be connected with the difference in bond dissociation energies of metal oxide. Since B-O bond enthalpy is 806 kJ mol-1, which is higher than Mo-O bond enthalpy (607 kJ mol-1), the average single bond energy decreases with the addition of MoO3 at the expense of B2O3, because of the formation of weaker Mo-O at the expense of stronger B-O bonds. Both glasses are characterized with low thermal stability criterion ΔT of 25 °C that does not change with the composition, evidencing low thermal stability and low glass forming ability of the compositions.
2.2. IR Spectral Analysis
The structure of the two glasses obtained (x = 10 and x= 20) was investigated by IR spectroscopy (Figure 3a). As it is seen from the figure, the IR spectra of both glasses are very similar and show an IR activity in three spectral regions: 1600-1150 cm-1, 1150-850 cm-1 and 850-400 cm-1. The spectra obtained have been deconvoluted in order to gain more detailed structural information and are shown in Figure 3b, c. In this way in the first spectral region between 1600-1150 cm-1 several peaks have been observed due to the stretching vibration of BO3 groups in meta-, pyro-, orthoborate structures (bands in the range 1196-1461 cm-1) and in superstructural units (BO3+BO4) (band at 1266-1270 cm-1) [42,43]. In the second spectral range 1150-850 cm-1 bands related with the vibrations of BO4 tetrahedral units (bands at 1090 and at 1072 cm-1) [44], VO4 (band at 649-651 cm-1), VO5 (bands at 1000-993 cm-1) and VO6 (band at 932-916 cm-1) 1), and as well as of MoO4 (bands at 910 cm-1) and MoO6 (bands at 923-916 cm-1 and at 980-971 cm-1) structural groups are situated [45,46,47]. The Me-O-Me, Me = V, Mo bonding is also identified, manifested by the presence of the band at 885 cm-1 [48]. Third spectral region from 850-400 cm-1 contains bands connected with the bending vibrations of B-O-B bonds in meta-, pyro- and superstructural borate units (band at 697 cm-1), V-O-V stretching vibrations (band at 767-764 cm-1), bending, asymmetric and symmetric stretching mode of V(Mo)2O2 entities present in V(Mo)2O8 units (bands at 468-472 cm-1, at 573 cm-1 and at 728 cm-1 respectively), and as well vibrations of VO4 tetrahedral groups (band at 649-651 cm-1) [42,43,44,45,46,47]. The detailed assignments of the bands observed in the deconvoluted IR spectra of the present glasses are summarized in Table 4. With increasing MoO3 content , MoO4→MoO6 transformation (disappearance of the band at 910 cm-1 and appearance of the band at 448 cm-1), and Me-O-Me, Me = V and Mo bonding (increased intensity of the band at 885 cm-1) take place [48,49]. On the other hand, some depolimerization of the borate oxygen network and formation of orthoborate BO33- groups also occurs, evidenced by the appearance of the band at 1196 cm-1 and increased intensity of the band at 1253 cm-1 both characteristic for the BO33- units [42] in the spectrum of glass x = 20.
2.3. Density, Molar Volume, Oxygen Packing Density and Oxygen Molar Volume
A structural information of glasses obtained was also gain by measuring the glass density and calculating of molar volume (Vm), oxygen molar volume (Vo) and oxygen packing density (OPD) of the glass system, using the following relations respectively [36].
where xi is the molar fraction of each oxide component i, Mi the corresponding molecular weight, ρg the glass density and ni is the number of oxygen atoms in each oxide, C is the number of oxygen atoms per formula units, and M is the total molecular weight of the glass compositions. The values obtained are listed in Table 5.
It is seen that both density and molar volume of the glass having higher MoO3 content at the expense of B2O3 content is higher as compared with the glass with lower MoO3 concentration. In general, density and molar volume are inversely related. However, this anomalous behavior has been reported in other glass systems [50]. In the present system, the increase in glass density can be attributed to the increase in the average molecular mass of the glasses [51]. As the molar volume (volume occupied by a mass of the glass equal to 1 mole) is strongly affected by the ionic radii of the incorporated ionic species in the glass, the higher Vm for glass x = 20 as compared with Vm of glass x = 10 is due to the replacement of B3+ ions with lower ionic radii (0.27Å) with Mo6+ ions known to have a higher ionic radius (0.59Å), resulting in the formation of an excess free volume, which increases the overall molar volume of this glass. Oxygen molar volume (Vo) and OPD are two parameters that give information on the packing of the oxygen ions in the glass structure [52]. Low Vo and high OPD are indications for high degree of network connectivity. It is observed that glass x = 20 is characterized with a higher Vo and lower OPD values compared with the values of these parameters estimated for the glass x = 10, suggesting lower degree of connectivity (higher number non-bridging oxygens (NBOs)) of the network of the glass having higher MoO3 content. This assumption is in line with the with the DSC and IR spectral data revealing the accumulation of BO3 groups with NBOs (i. e. BO33-) in the glass structure of glass x = 20.
2.4. Diffuse Reflectance Spectra (DRS)
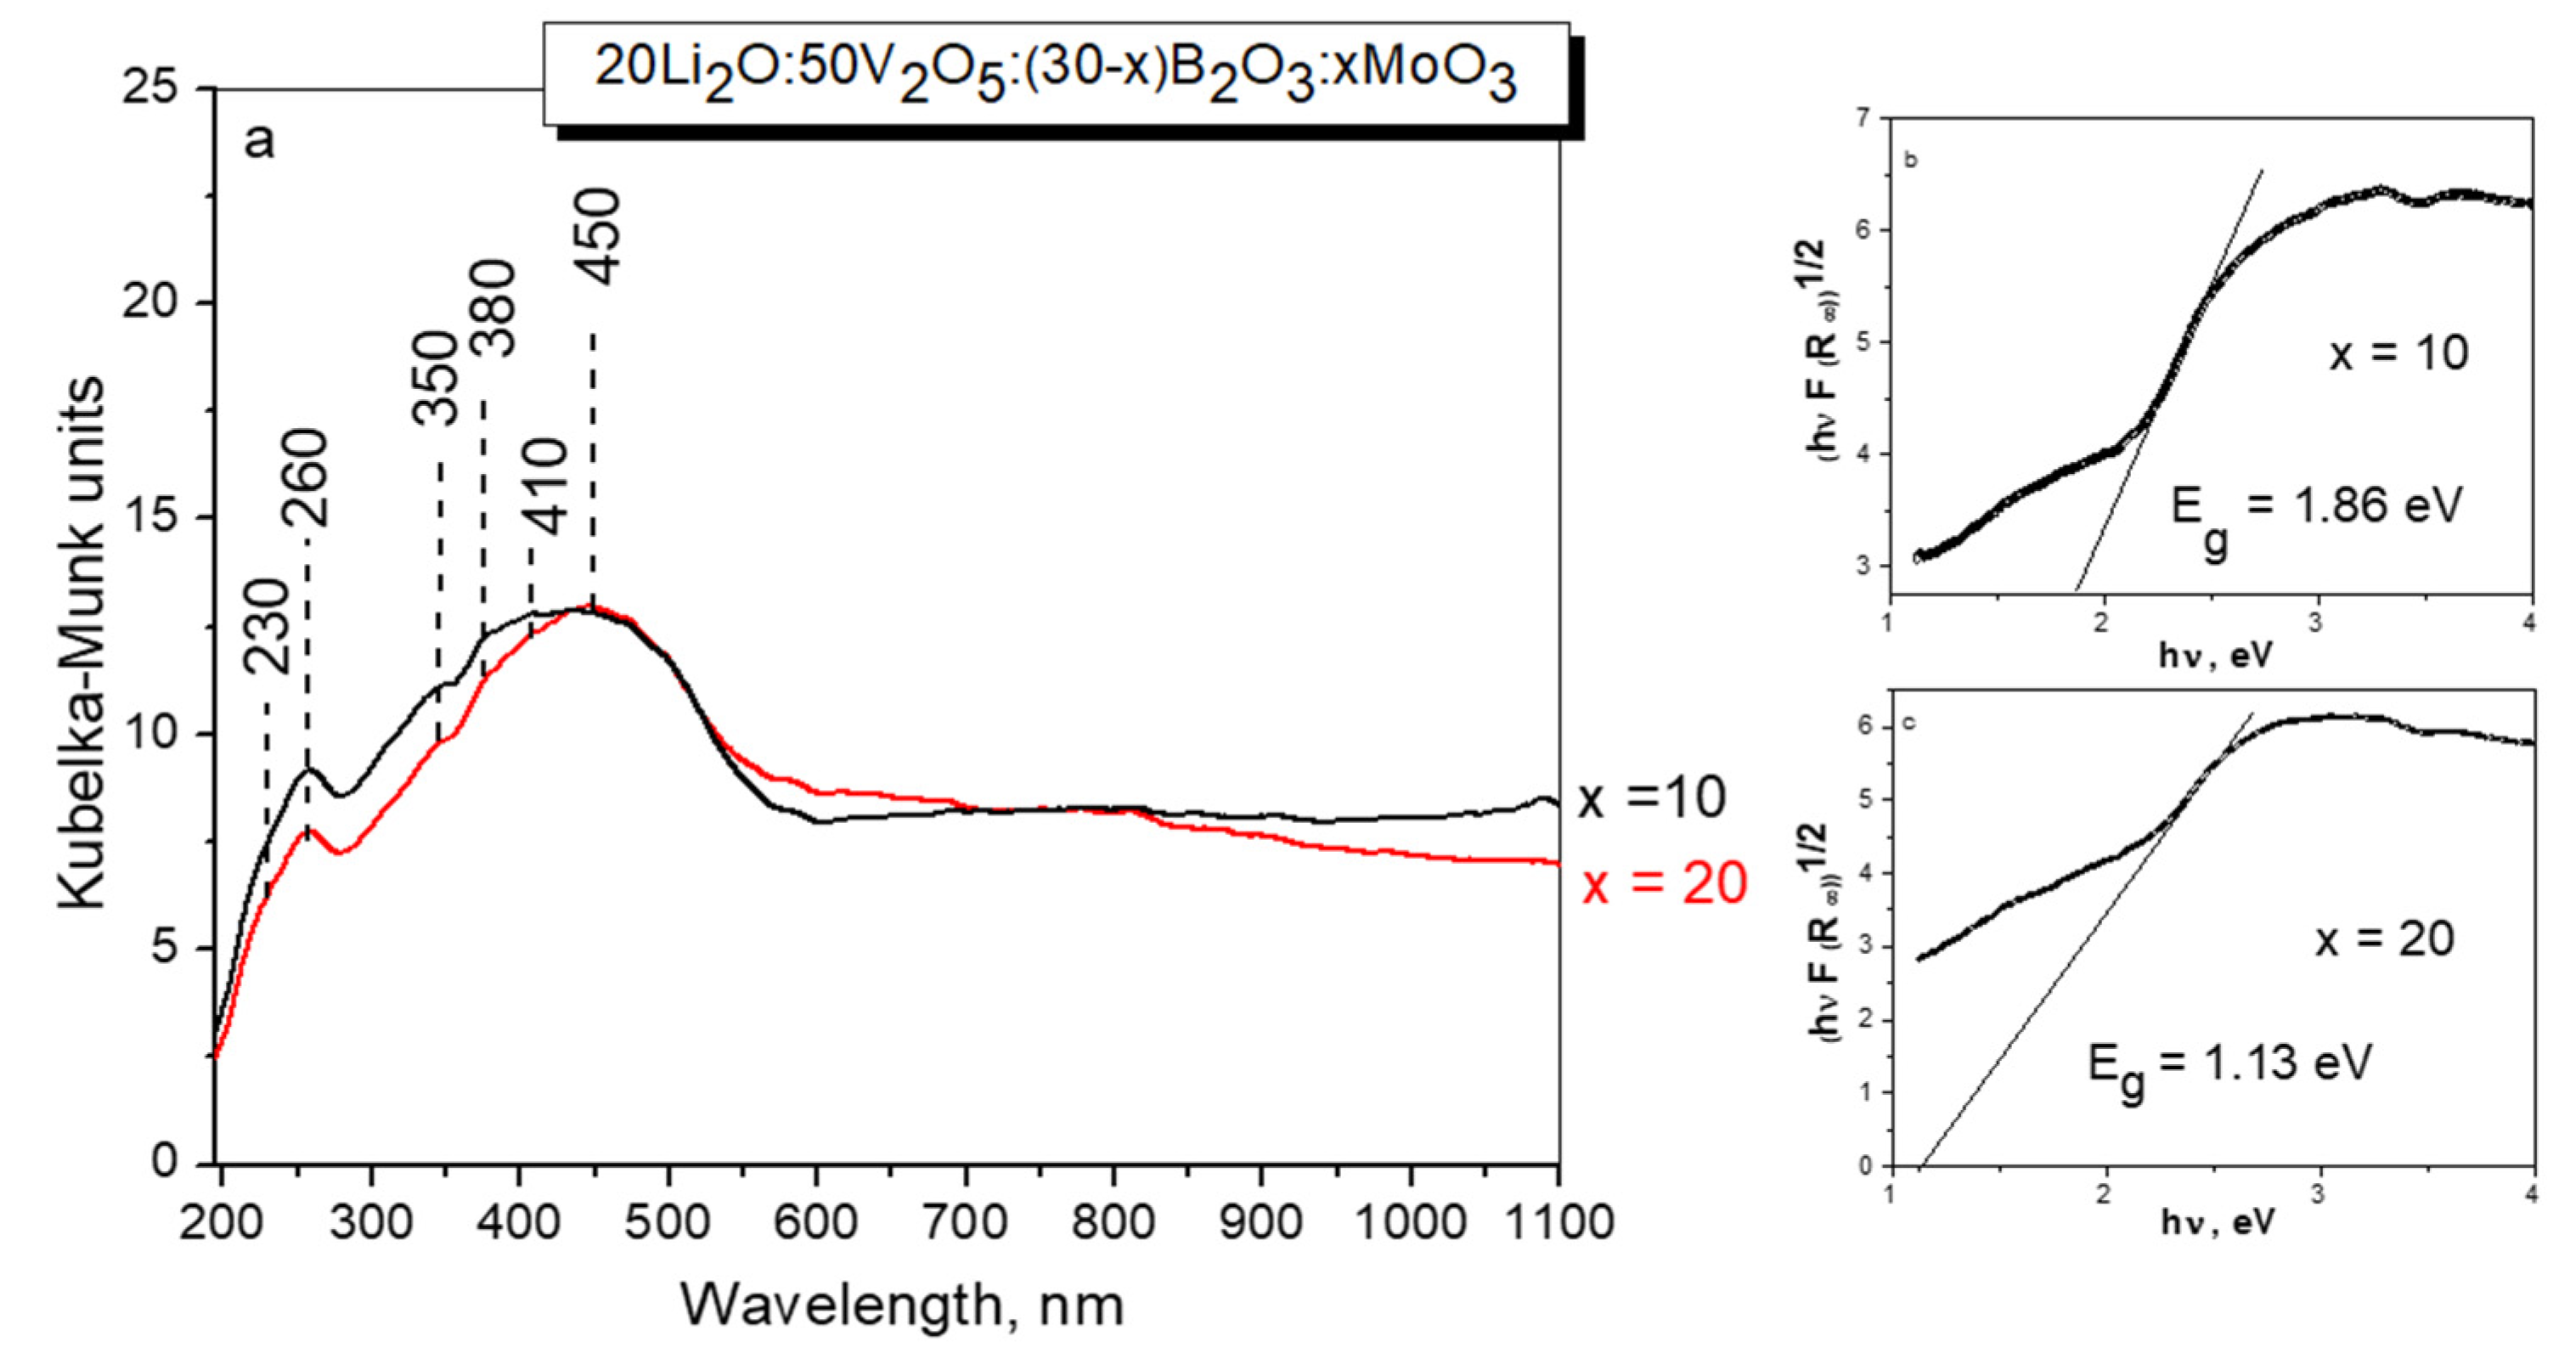
UV-vis diffuse spectroscopy is also used to obtained information about the local structure of glasses via ligand to metal charge transfer (LMCT) band position and the corresponding edge energy (Eg) values. The diffuse reflectance spectra of studied glasses consist of bands in the range 200–600 nm, with maxima at 260, 350 nm, due to the ligand–metal charge transfer (LMCT) from oxygen ligands to Mo6+ in octahedral coordination and/or V5+ ions in tetrahedral coordination, and as well as bands at 380 due to the charge transfer band of the V=O double bond, and bands at 410 and 450 nm due to polymerized VO6 with octahedral coordination [47,53]. The absence of any absorption in the visible range (600-800 nm) indicates that Mo5+and V4+species do not present in the investigated sample Assuming the glass obtained to be indirect semiconductors, the plot of transformed Kubelka–Munk function versus the energy of light (Tauc plot) affords band gap energies, Eg of 1.86 eV for x= 10 and 1.13 eV for x=20 glasses respectively. The decrease of Eg values, with increase in MoO3 content is related with the changes in the bonding during the vitrification, and increase in the number of non-bridging oxygens in the glass structure [54].
Figure 4.
DR-UV-Vis spectra (a) and the band gap energy Eg (b), (c) of glasses with the compositions 20Li2O:50V2O5 :(30-x) B2O3:xMoO3, x = 10, 20 mol% obtained by melt quenching method.
Figure 4.
DR-UV-Vis spectra (a) and the band gap energy Eg (b), (c) of glasses with the compositions 20Li2O:50V2O5 :(30-x) B2O3:xMoO3, x = 10, 20 mol% obtained by melt quenching method.
2.5. Electrical Properties
The samples with x = 10 and x = 20 which proved to be glasses are heated with a heating rate of 10K/min to 180 °C, i.e. below the Tg values obtained by DSC and then the impedance spectra were recorded at different temperatures and frequencies on cooling. After equilibrating the sample at each measurement temperature, the frequency dependence of the impedance modulus and the phase angle is measured. The two samples showed purely resistive behavior at all frequencies in the whole temperature range, i.e. the phase angle was always between 0 and -25°. Thus, the measured samples exhibited behavior which allowed to assume the impedance modulus at 1 Hz equal to the sample resistance. From this resistance, taking into account the sample thickness and electrode surface, the dc-conductivity σ [S/m] is calculated from Eq. 5:
where ρ [Ω.m] – sample resistivity, S [m2}– electrode surface, d [m] – sample thickness, |Z| [Ω] - impedance modulus. The impedance modulus, |Z| [Ω] and phase angle, φ [°] values at 1 Hz, as well as the calculated dc-conductivity σ and the respective activation energies, Ea, assuming, for the glasses x = 10 and x = 20 are given in Table 6 for the different temperatures. In Figure 5 the Arrhenius plots are shown for the glasses x = 10 and x = 20. From the slopes of the Arrhenius plots the dc-conductivity activation energy, Ea is determined and also given in Table 6. The results from the estimation of the activation energies show that the sample with lower MoO3 concentration has higher activation energy which could be attributed to the structural changes occurring in the glass network with the increasing molybdenum concentration, i.e. the occurrence of more NBOs as also observed in the IR spectra of the same glass compositions.
Furthermore, the obtained activation energy is the energy of ionic conductivity established by the Li+ ions under the influence of the applied external electrical field, as the results from the diffuse reflectance spectroscopy reveal that no V4+ and Mo6+ ions are present in the two studied glasses which excludes the possibility for the existence of an electronic component of conduction. V2O5 containing glasses are known for their electronic conduction established by the phonon-assisted hopping of small polarons [55], however, the hopping conduction mechanism is only possible to observe if both V4+ and V5+ ions are present in glass., as for example reported in [23,56,57]. The same suggestion can be made concerning the hopping of polarons between polyvalent molybdenum ions - as also only Mo6+ and no Mo5+ ions are present in the investigated two glasses the electronic component of conduction can be excluded.
2.6. All-Solid-State Battery
The electrochemical characterization of the x = 20 glass (glass sample with lower activation energy) obtained was performed by assembling an all-solid-state cell, employing 20Li2O–50V₂O₅–20MoO₃–10B₂O₃ glass as a cathode active material. Figure 6a illustrates the impedance characteristics of cells with two different active material contents (C35 and C60) prior to electrochemical testing. The interfacial resistance increases from 223 Ω for the C35 electrode to 308 Ω for the C60 electrode. The C35 electrode contains a higher proportion of the 75Li2S-25P2O5 matrix, which provides better encapsulation and densification of the glass particles, thereby reducing the interfacial resistance between the cathode materials. Figure 6b presents the galvanostatic charge-discharge curves of the C35-based cell at two different current levels. The first cycle, conducted at 0.007 mA (corresponding to 2 mA g⁻¹) within a voltage range of 1.6–4.2 V, delivers a charge capacity of 53.42 mA h g⁻¹ and a discharge capacity of 43.31 mA h g⁻¹, with a Coulombic efficiency of 81.07%. In the second cycle, performed at 0.035 mA (10 mA g⁻¹) within a voltage range of 0.9–4.2 V, the cell exhibits a charge capacity of 24.74 mA h g⁻¹ and a discharge capacity of 24.87 mA h g⁻¹, achieving a nearly 100% Coulombic efficiency. However, a noticeable increase in the charge voltage and a decrease in the discharge voltage are observed compared to the first cycle. This behavior suggests that under higher current conditions, Li₂S in the cell becomes electrochemically active, leading to the degradation of the active material. Figure 6c displays the galvanostatic charge-discharge profiles of the C60-based cell at various voltages under a constant current of 0.012 mA (2 mA g⁻¹). In the first cycle (2.0–4.2 V), the cell achieves a charge capacity of 8.86 mA h g⁻¹, a discharge capacity of 7.53 mA h g⁻¹, and a Coulombic efficiency of 84.99%. In the second cycle (2.0–4.6 V), the charge and discharge capacities increase to 10.53 and 10.01 mA h g⁻¹, respectively, with a Coulombic efficiency of 95.06%. In the third cycle (2.0–5.0 V), further improvements are observed, with a charge capacity of 15.06 mA h g⁻¹, a discharge capacity of 14.80 mA h g⁻¹, and a Coulombic efficiency of 98.27%. The C60 cell demonstrates stable cycling performance at low current densities, maintaining effective charge-discharge behavior even under high voltage conditions up to 5 V. While the increase in voltage enhances the charge capacity, it also raises the risk of side reactions due to material limitations.
To further evaluate the cycling stability, the C60 cell was reassembled and subjected to 50 charge-discharge cycles at 60°C, within a voltage range of 2.0–4.2 V and at a current of 0.05 mA (8.33 mA g⁻¹). As shown in Figure 6e, the cell exhibits a gradual improvement in capacity over the cycling process. The charge capacity increases from 7.68 to 9.47 mA h g⁻¹, and the discharge capacity rises from 6.88 to 9.09 mA h g⁻¹, while the Coulombic efficiency improves from 89.58% to 95.99%. The higher content of 75Li2S-25P2O5 in the cathode facilitates the effective encapsulation of 20Li2O–50V₂O₅–20MoO₃–10B₂O₃ glass particles, which enhances the overall ionic transport capability and reduces the interfacial resistance of the battery. As a result, the electrode exhibits improved ionic conductivity. Therefore, under the same current density, the C35 cell demonstrates superior charge-discharge capacity compared to the C60 cell at equivalent charging voltages. However, as the current increases, the C35 cell rapidly fails. Adverse internal reactions deactivate the active material, leading to a sharp drop in discharge voltage below 2 V. Under such low discharge voltage conditions, the Li₂S participates in redox reactions, which further compromises the battery's stability and performance. In contrast, the charge-discharge capacity of the C60 cell is constrained by the limited voltage window, making it difficult to achieve higher capacity. Furthermore, increasing the charging voltage poses a greater risk of triggering side reactions. Nevertheless, within a safe voltage range, the C60 cell exhibits excellent cycling stability and maintains reliable electrochemical performance. These findings highlight that optimizing interfacial resistance to achieve higher charge-discharge capacities at lower charging voltages is a crucial direction for the further development of this class of cathode materials. Enhancing ionic conductivity and mitigating parasitic reactions through interfacial engineering will be essential to unlocking the full potential of glass-based cathodes for advanced solid-state batteries.
3. Materials and Methods
The glass formation ability of two series of compositions with lower and higher V2O5 content from the Li2O-B2O3-V2O5-MoO3 system is investigated by applying the melt quenching method. Reagent grade Li2CO3, H3BO3, V2O5 and MoO3 are used as raw materials. The nominal compositions investigated, the experimental conditions applied and as well as the visually observed results are listed in Table 1 and Table 2. The phase formation of the samples was established by X-ray phase analysis using a Bruker D8 advance diffractometer with Cu Kα radiation in the 10 < 2Ө < 60° range. The glass transition (Tg) and crystallization pak maximum (Tc) temperatures of the glasses were determined by means of Differential Scanning Calorimetry (DSC) using Netzsch 404 F3 Pegasus instrument, Germany in the temperature range 25-750 oC at heating rate of 10 K/min in argon atmosphere. The density of the obtained glasses at room temperature was measured by the Archimedes principle using toluene (ρ = 0.867 g/cm3) as an immersion liquid on a Mettler Toledo electronic balance of sensitivity 10 -4 g. The IR spectra of the glasses were measured using the KBr pellet technique on a Nicolet-320 FTIR spectrometer with a resolution of ± 4 cm−1, by collecting 64 scans in the range 1600–400 cm−1. A random error in the center of IR bands was found as ± 3 cm−1. The optical spectra of powder samples at room temperature were recorded by a spectrometer (Evolution 300 UV-vis Spectrophotometer) employing the integration sphere diffuse reflectance attachment. The spectra of the samples were recorded in the wavelength (λ) range of 190-800 nm with a magnesium oxide reflectance standard used as the baseline. The uncertainty in the observed wavelength is about ± 1 nm. The Kubelka-Munk function (F(R∞)) was calculated from the UV-vis diffuse reflectance spectra. The band gap energy (Eg) for the direct allowed transition (n=2) was determined by preparing a Tauc plot where the function (F(R∞)hν)n, was plotted versus hν (incident photon energy). The tangent to the inflection point was determined, and the band gap energy was found as the intersection of the tangent with the horizontal axis i.e., at [hνF(R∞)]2 = 0. The electrical properties of selected samples were studied by utilizing measurement of the impedance modulus and the phase angle as function of frequency and temperature by an impedance analyzer Zahner IM6, Zahner Elektrik Kronach, Germany and two-contacting points measurement. After gold electrodes were thermally evaporated onto the sample base surface, the 1-3 mm thick samples were mounted in the holder, introduced into a resistive furnace with a dc-power supply and then connected to the impedance analyser. The temperature was measured by an Al-Ni-Cr (K-type) thermocouple with an accuracy of 1°C. The impedance modulus and the phase angle were measured as a function of frequency in the range from 1 Hz to 100 kHz and as a function of temperature from rom room temperature to 180°C, i.e. below the Tg. Always an ac-voltage with amplitude 500 mV was applied during the impedance measurements. The accuracy of the impedance modulus measurement is ≤ ±5% and that of the phase angle ±0.2°. Taking into account the sample geometry, the conductivity as well as several dielectric characteristics of the measured samples were estimated. For the preparation of cathode materials all sample preparation procedures were carried out in an argon-filled glovebox to prevent moisture and oxygen contamination. Two types of cathode composites were prepared: one consisting of 60 mg of 20Li2O-50V2O5-20MoO3-10B2O3 glass, 35 mg of 75Li₂S-25P₂O₅ solid electrolyte, and 5 mg of acetylene black (denoted as C60), and the other consisting of 35 mg of 20Li2O-50V2O5-20MoO3-10B2O3 glass, 60 mg of 75Li2S-25P2O5, and 5 mg of acetylene black (denoted as C35). Each mixture was thoroughly homogenized by dry grinding in a small agate mortar for 10 minutes to ensure uniform dispersion of the active components. For Battery Cell Assembly, 100 mg of 75Li2S-25P2O5 solid electrolyte was placed into a PEEK die and pressed under 80 MPa for 2 minute to form a dense electrolyte pellet. After removing the upper punch, 10 mg of the pre-mixed cathode composite was evenly spread onto the electrolyte surface and pressed again under 80 MPa for 2 minute. The entire assembly was then compressed under 360 MPa for 3 minutes to enhance interfacial contact and mechanical integrity. For the anode, indium foil with a thickness of 0.1 mm was punched into 8 mm diameter discs and placed on the counter electrode side. The full cell was further pressed under 80 MPa for 2 minutes to ensure good contact. The assembled cells were then fixed in a customized clamp in preparation for electrochemical testing. All electrochemical measurements were conducted at room temperature using a Princeton Applied Research PMC200 electrochemical workstation. Galvanostatic charge-discharge tests were performed within a voltage window of 0.5–6 V at various current densities ranging from 2 to 10 mA g⁻¹. The voltage limits were adjusted according to the cathode composition and the applied current density in order to evaluate the maximum charge-discharge capacities under different conditions.
4. Conclusions
New multicomponent vanadate glasses with the composition 20Li2O:(30-х)B2O3:50V2O5:xMoO3, x = 10, 20 mol% have been obtained by applying the conventional melt quenching technique. Several structural units building up the amorphous network as : VO4, VO5, VO6, MoO6, MoO4, V(Mo)2O8, BO33-, BØO22- BØ2O- and BØ4- have been established by combining IR and DRS spectroscopies. The values of the optical band gap (Eg) of the present glass samples lie in the semiconductor range (1.86 eV and 1.13 eV), that make these glass compositions interesting for the investigation as cathode materials in Li-ion batteries. The prepared glassy material exhibits excellent charge-discharge performance, delivering a reversible capacity of 43.31 mAh g⁻¹ at room temperature. Moreover, the material demonstrates remarkable cycling stability, maintaining its capacity without noticeable degradation over 50 cycles at 60 °C, highlighting its potential as an active cathode material for solid-state batteries. However, optimizing interfacial impedance and enhancing the interfacial compatibility between the cathode and solid electrolyte remain significant challenges in all-solid-state systems. This study offers new insights into the application of glassy materials as active cathode components and contributes to the development of all-solid-state lithium metal batteries.
Author Contributions
For research articles with several authors, a short paragraph specifying their individual contributions must be provided. The following statements should be used “Conceptualization, M.M.; methodology, M.M., R.H., N.C.R.N.; software, R. H., M.M.; validation, P. V., M.M., R.H.; formal analysis, X.Y., M. M; investigation, X.Y., P. V., M. M., L. A., R. H., M. S. and S. K.; resources, M.M.; data curation, M.M.; writing—original draft preparation, M. M., B. J., R. H., X.Y.; writing—review and editing, N.C.R.N., R. I.; visualization, M.M.; supervision, N.C.R.N.; project administration, N.C.R.N.; funding acquisition, N.C.R.N. All authors have read and agreed to the published version of the manuscript.
Funding
The authors gratefully acknowledge partial financial support from the Elisa project with ref. CNS2023-145494 funded by the Spanish Ministry of Science and Innovation (MCIN/AEI/10.13039/501100011033) and the European Union through the “NextGenerationEU”/PRTR initiative; and 2024ICT207 project from CSIC.
Institutional Review Board Statement
Not applicable
Informed Consent Statement
Not applicable.
Data Availability Statement
Data are contained within the article.
Acknowledgments
The authors have reviewed and edited the output and take full responsibility for the content of this publication.
Conflicts of Interest
The authors declare no conflicts of interest.
References
- Vermeer, W.; Mouli, G.R.C.; Bauer, P. A Comprehensive Review on the Characteristics and Modeling of Lithium-Ion Battery Aging. IEEE Trans. Transp. Electrif. 2022, 8, 2205–2232. [Google Scholar] [CrossRef]
- Barbosa, J.C.; Gonçalves, R.; Costa, C.M.; Lanceros-Mendez, S. Recent Advances on Materials for Lithium-Ion Batteries, Review. Energies 2021, 14, 1–36. [Google Scholar] [CrossRef]
- Afyon, S.; Krumeich, F.; Mensing, C.; Borgschulte, A.; Nesper, R. New High Capacity Cathode Materials for Rechargeable Li-ion Batteries: Vanadate-Borate Glasses. Sci. rep. 2014, 4, 1–7. [Google Scholar] [CrossRef] [PubMed]
- Hassaan, M.Y.; Salem, S.M.; Moustafa, M.G. Study of nanostructure and ionic conductivity of Li1.3Nb0.3V1.7(PO4)3 glass ceramics used as cathode material for solid batteries. J. Non-Cryst Solids 2014, 391, 6–11. [Google Scholar] [CrossRef]
- Zhao, E.L.; Zhao, S.X.; Wu, X.; Li, J.W.; Yu, L.Q.; Nan, C.W.; Cao, G. Electrochemical performance of Li2O-V2O5-SiO2-B2O3 glass as cathode material for lithium ion batteries. J. Materiomics 2019, 5, 663–669. [Google Scholar] [CrossRef]
- Gao, Y.; Liu, K.; Zhu, C.; Zhang, X.; Zhang, D. ; Co-Estimation of State-of-Charge and State-of- Health for Lithium-Ion Batteries Using an Enhanced Electrochemical Model. IEEE Trans. Ind. Electron. 2021, 69, 2684–2696. [Google Scholar] [CrossRef]
- Zhang, W.; Wang, L.; Wang, L.; Liao, C.; Zhang, Y. Joint State-of-Charge and State-of-Available-Power Estimation Based on the Online Parameter Identification of Lithium-Ion Battery Model. IEEE Trans. Ind. Electron 2021, 69, 3677–3688. [Google Scholar] [CrossRef]
- Wei, Z.; Quan, Z.; Wu, J.; Li, Y.; Pou, J.; Zhong, H. Deep Deterministic Policy Gradient-DRL Enabled Multiphysics-Constrained Fast Charging of Lithium-Ion Battery. IEEE Trans. Ind. Electron. 2022, 69, 2588–2598. [Google Scholar] [CrossRef]
- Ni, Z.; Yang, Y. A Combined Data-Model Method for State-of-Charge Estimation of Lithium-Ion Batteries. IEEE Trans. Instrum. Meas. 2022, 71, 2503611. [Google Scholar] [CrossRef]
- Mustafa, J.; Alqaed, S.; Husain, S.; Jamil, B.; Sharifpur, M.; Cheraghian, G. Effect of Phase Change Materials on Lithium-Ion Plate Batteries. Batteries 2023, 9, 1–18. [Google Scholar] [CrossRef]
- Wei, Z.; Hu, J.; He, H.; Yu, Y.; Marco, J. Embedded Distributed Temperature Sensing Enabled Multistate Joint Observation of Smart Lithium-Ion Battery. IEEE Trans. Ind. Electron. 2023, 70, 555–565. [Google Scholar] [CrossRef]
- Kittaneh, O. On the Theory of the Arrhenius-Normal Model with Applications to the Life Distribution of Lithium-Ion Batteries. Batteries 2023, 9, 1–10. [Google Scholar] [CrossRef]
- Shui, Z.Y.; Li, X.H.; Feng, Y.; Wang, B.C.; Wang, Y. Combining Reduced-Order Model with Data-Driven Model for Parameter Estimation of Lithium-Ion Battery. IEEE Trans. Ind. Electronics 2023, 70, 1521–1531. [Google Scholar] [CrossRef]
- Krishnamoorthy, U.; Ayyavu, P.G.; Panchal, H.; Shanmugam, D.; Balasubramani, S.; Al-rubaie, A.J.; Al-khaykan, A.; Oza, A.D.; Hembrom, S.; Patel, T.; Vizureanu, P.; Burduhos-Nergis, D.P. Efficient Battery Models for Performance Studies-Lithium Ion and Nickel Metal Hydride Battery. Batteries 2023, 9, 1–14. [Google Scholar] [CrossRef]
- Delmas, C.; Cognac-Auradou, H.; Cocciantelli, J.M.; Menetrier, M.; Doumerc, J.P. The LixV2O5 system: an overview of the structure modifications induced by the lithium intercalation. Solid State Ionics. 1994, 69, 257–264. [Google Scholar] [CrossRef]
- Attos, O.; Massot, M.; Mavi, H.S.; Julien, C. Spectroscopic investigations of the network structure in borovanadate glasses, Mat. Res. Soc. Symp. Proc. 1997, 455, 477–482. [Google Scholar] [CrossRef]
- Bih, L.; Omari, M. El; Reau, J.M.; Haddad, M.; Boudlich, D.; Yacoubi, A.; Nadiri, A. Electronic and ionic conductivity of glasses inside the Li2O–MoO3–P2O5 system. Solid State Ionics 2000, 132, 71–85. [Google Scholar] [CrossRef]
- Maniu, D.; Iliescu, T.; Ardelead, I.; Bratu, I.; Dem, C. Studies of borate vanadate glasses using Raman and IR spectroscopy. Stud. U. Babes-Bol. Phys (Special issue) 2001, 366–371. [Google Scholar]
- Bih, L.; Nadiri, A.; El Omari, M.; Yacoubi, A.; Haddad, M. FTIR, EPR and X-ray investigation of mixed valence molybdenum phosphate A2O–(MoO3)2–P2O5 (A=Li,Na) glasses. Phys Chem Glasses 2002, 43, 153–157. [Google Scholar]
- Jozwiak, P.; Garbarczyk, J.E. Mixed electronic–ionic conductivity in the glasses of the Li2O–V2O5–P2O5 system. Solid State Ionics 2005, 176, 2163–2166. [Google Scholar] [CrossRef]
- Al-Hajry, A.; Al-Shahrani, A.; El-Desoky, M.M. Structural and other physical properties of barium vanadate glasses. Mater. Chem. Phys. 2006, 95, 300–306. [Google Scholar] [CrossRef]
- Bih, L.; Abbas, L.; Nadiri, A.; Amraoui, Y.E.; Mezzane, D.; Khemakhem, H. DC and AC conductivities of the yLi2O–(1-y)[0.35(MoO3)2–0.65(P2O5)] glasses. M.J. Condenced Mater. 2006, 7, 70–73. [Google Scholar]
- Rao, L.S.; Reddy, M.S.; Reddy, M.R.; Veeraiah, N. Dielectric dispersion in Li2O–MoO3–B2O3 glass system doped with V2O5. J. Alloys Compd. 2008, 464, 472–482. [Google Scholar] [CrossRef]
- Takahashi, H.; Karasawa, T; Sakuma, T.; Garbarczyk, J.E. Electrical conduction in the vitreous and crystallized Li2O–V2O5–P2O5 system. Solid State Ionics 2010, 81, 27–32. [Google Scholar] [CrossRef]
- Barczyński, R.J.; Król, P.; Murawski, L. AC and DC conductivities in V2O5–P2O5 glasses containing alkaline ions. J. Non-Cryst Solids 2010, 356, 1965–1967. [Google Scholar] [CrossRef]
- Gowda, V.C.; Chethana, B.K.; Reddy, C.N. Ion transport studies in lithium phospho-molybdate glasses containing Cl− ion. Mat Sci Eng B-Adv. 2013, 178, 826–833. [Google Scholar] [CrossRef]
- Saetova, N. S.; Raskovalov, A.A.; Antonov, B.D.; Yaroslavtseva, T.V.; Reznitskikh, O.G.; Zabolotskaya, E.V.; Kadyrova, N.I.; Telyatnikova, A.A. Conductivity and spectroscopic studies of Li2O-V2O5-B2O3 glasses. Ionics 2018, 24, 1929–1938. [Google Scholar] [CrossRef]
- Kindle, M.; Kmiec, S.; d'Anciães, I.; Silva, A.; Eckert, H.; Martin, S.W.; Song, M.K.; McCloy, J.S. Structural properties of alumina-doped lithium borovanadate glasses and glass-ceramics. J. Non-Cryst. Solids 2019, 521, 119551. [Google Scholar] [CrossRef]
- Saetova, N.S.; Raskovalov, A.A.; Antonov, B.D.; Denisova, T.A.; Zhuravlev, N.A. Structural features of Li2O–V2O5–B2O3 glasses: Experiment and molecular dynamics simulation, J. Non-Cryst. Solids 2020, 545, 120253. [Google Scholar] [CrossRef]
- Banagar, A.V.; Kumar, M.P.; Nagaraja, N. Effect of Mixed Transition Metal Ions in B2O3-V2O5-MoO3 Glass System. J. Electron. Mater. 2020, 49, 7370–7378. [Google Scholar] [CrossRef]
- Ori, G.; Montorsi, M.; Pedone, A.; Siligardi, C. Insight into the structure of vanadium containing glasses: a molecular dynamics study. J. Non-Cryst. Solids 2011, 357, 2571–2579. [Google Scholar] [CrossRef]
- Attos, O.; Massot, M.; Mavi, H.S.; Julien, C. Spectroscopic investigations of the network structure in borovanadate glasses. Mat. Res. Soc. Symp. Proc. 1997, 455, 477–482. [Google Scholar] [CrossRef]
- Boora, M.; Malik, S.; Kumar, V.; Bala, M.; Arora, S.; Rohilla, S.; Kumar, A.; Dalal, J. Investigation of structural and impedance spectroscopic properties of borate glasses with high Li+ concentration. Solid State Ionics 2021, 368, 115704. [Google Scholar] [CrossRef]
- Ukpong, A.M. Controlling the crystallization of lithium borovanadate phases in an oxide glass composite using the CALPHAD approach. Mater. Today Proc. 2021, 38, 1059–1070. [Google Scholar] [CrossRef]
- Swapna, G.; Upender, M.P. ; Raman, FTIR, thermal and optical properties of TeO2 -Nb2O5 -B2O3 -V2O5 quaternary glass system. JTUSCI 2017, 11, 583–592. [Google Scholar] [CrossRef]
- Ray, N.H. Composition-properties relationship in Inorganic Oxide Glasses. J. Non-Cryst. Solids 1974, 15, 423–434. [Google Scholar] [CrossRef]
- Saddeek, Y.; Azooz, M.; Saddek, A. Ultrasonic investigations of some bismuth borate glasses doped with Al2O3. Bull. Mater. Sci. 2015, 38, 241–246. [Google Scholar] [CrossRef]
- Saddeek, Y. Effject of B2O3 on the structure and properties of tungsten-tellurite glasses. Philos. Mag. 2009, 89, 41–54. [Google Scholar] [CrossRef]
- Zhu, L.; Xu, T.F.; Nie, Q.H.; Shen, X. Spectral properties and thermal stability of erbium TeO2 -WO3 -La2O3 glass. J. Inorg. Mater. 2006, 21, 351–356. [Google Scholar]
- Hamad, A.H.; Marzouk, M.A.; ElBatal, H.A. The Effect of Bi2O3 on Optical, FTIR and Thermal Properties of SrO-B2O3 glasses. Silicon 2016, 8, 121–131. [Google Scholar] [CrossRef]
- Soliman, A.A.; Kashif, I. Copper oxide content dependence of crystallization behavior, glass forming ability, glass stability and fragility of lithium borate glasses. Phys. B 2010, 405, 247–253. [Google Scholar] [CrossRef]
- Varsamis, C.P.; Makris, E.N.; Valvi, C.; Kamitsos, E.I. Short-range structure, the role of bismuth and property-structure correlations in bismuth borate glasses. Phys. Chem. Chem Phys. 2021, 23, 10006–1020. [Google Scholar] [CrossRef]
- Milanova, M.; Aleksandrov, L.; Yordanova, A.; Iordanova, R.; Tagiara, N.S.; Herrmann, A.; Gao, G.; Wondraczek, L.; Kamitsos, E.I. Structural and luminescence behavior of Eu3+ ions in ZnO-B2O3-WO3 glasses. J. Non-Cryst. Solids 2023, 600, 122006. [Google Scholar] [CrossRef]
- Iordanova, R.; Milanova, M.; Aleksandrov, L.; Khanna, A. Structural study of glasses in the system B2O3-Bi2O3-La2O3-WO3. J. Non-Cryst. Solids 2018, 481, 254–259. [Google Scholar] [CrossRef]
- Markova-Velichkova, M.; Iordanova, R.; Dimitriev, Y. Glass formation in the V2O5-MoO3-ZnO system. Phys. Status Solidi C 2011, 8, 3159–3162. [Google Scholar] [CrossRef]
- Khan, S.; Singhm, K. Structual, optical, thermal and conducting properties of V2-xLixO5-δ (0.15≤x≤0.30) system. Sci. Rep. 2020, 10, 1089–11. [Google Scholar] [CrossRef]
- Bachvarova-Nedelcheva, A.; Iordanova, R.; Kostov, K.L.; Ganev, V.; Yordanov, St.; Dimitriev, Y. Synthesis and structural chatacterization of a glass in the Ag2O-SeO2-MoO3 system. J. Non-Cryst. Solids 2018, 481, 138–147. [Google Scholar] [CrossRef]
- Milanova, M.; Iordanova, R.; Tatsumisago, M.; Hayashi, A.; Tzvetkov, P.; Nihtianova, D.; Markov, P.; Dimitriev, Y. Soft mechanochemical synthesis and electrochemical behavior of LiVMoO6 for all-solid-state lithium batteries. J Mater Sci 2016, 51, 3574–3584. [Google Scholar] [CrossRef]
- Milanova, M.; Iordanova, R.; Aleksandrov, L.; Hassan, M.; Dimitriev, Y. Glass formation and structure of glasses in the ZnO―Bi2O3―WO3―MoO3 system. J. Non-Cryst. Solids 2011, 357, 2713–2718. [Google Scholar] [CrossRef]
- Saddeek, Y.B.; Azooz, M.A.; Saddek, A.B. Ultrasonic investigations of some bismuth borate glasses doped with Al2O3. Bull. Mater. Sci. 2015, 38, 241–246. [Google Scholar] [CrossRef]
- Aryal, P.; Kesavulu, C.R.; Kim, H.J.; Lee, S.W.; Kang, S.J.; Kaewkhao, J.; Chanthima, N.; Damdee, B. Optical and luminescence characteristics of Eu3+-doped B2O3: SiO2: Y2O3: CaO glasses for visible red laser and scintillation material applications. J. Rare Earths 2018, 36, 482–491. [Google Scholar] [CrossRef]
- Villegas, M.A.; Fernández Navarro, J.M. Physical and structural properties of glasses in the TeO2–TiO2–Nb2O5 system. J. Eur. Ceram. Soc. 2007, 27, 2715–2723. [Google Scholar] [CrossRef]
- Centi, G.; Perathoner, S.; Trifiro, F.; Aboukals, A.; Aissi, C.F.; Guelton, M. Physicochemiacl Characterizationof V-Silicates. J. Phus. Chem. 1992, 96, 2617–2629. [Google Scholar] [CrossRef]
- Aleksandrov, L.; Iordanova, R.; Dimitriev, Y.; Georgiev, N.; Komatsu, T. Eu3+ doped 1La2O3:2WO3:1B2O3 glass and glass–ceramic. Opt. Mater. 2014, 36, 1366–1372. [Google Scholar] [CrossRef]
- Margha, F.H.; El-Bassyouni, G.T.; Turky, G.M. Enhancing the electrical conductivity of vanadate glass system (Fe2O3, B2O3, V2O5) via doping with sodium or strontium cations. Ceram Int. 2018, 45, 11838–11843. [Google Scholar] [CrossRef]
- Arunkumar, V.; Banagar, M.; Kumar, P.; Nagaraja, N. Effect of Mixed Transition Metal Ions in B2O3-V2O5-MoO3 Glass System. J. Electron. Mater. 2020, 49, 7370–7378. [Google Scholar]
- Srinivasa Rao, L. AC conductivity and polarization phenomenon of Li2O-MoO3-B2O3:V2O5 glasses. J. Alloys Compd. 2019, 787, 1280–1289. [Google Scholar] [CrossRef]
Figure 1.
XRD patterns of glass: a, b and glass-crystalline materials: b, c, obtained by quenching of the melts with various compositions from the Li2O-B2O3-V2O5-MoO3 system.
Figure 1.
XRD patterns of glass: a, b and glass-crystalline materials: b, c, obtained by quenching of the melts with various compositions from the Li2O-B2O3-V2O5-MoO3 system.
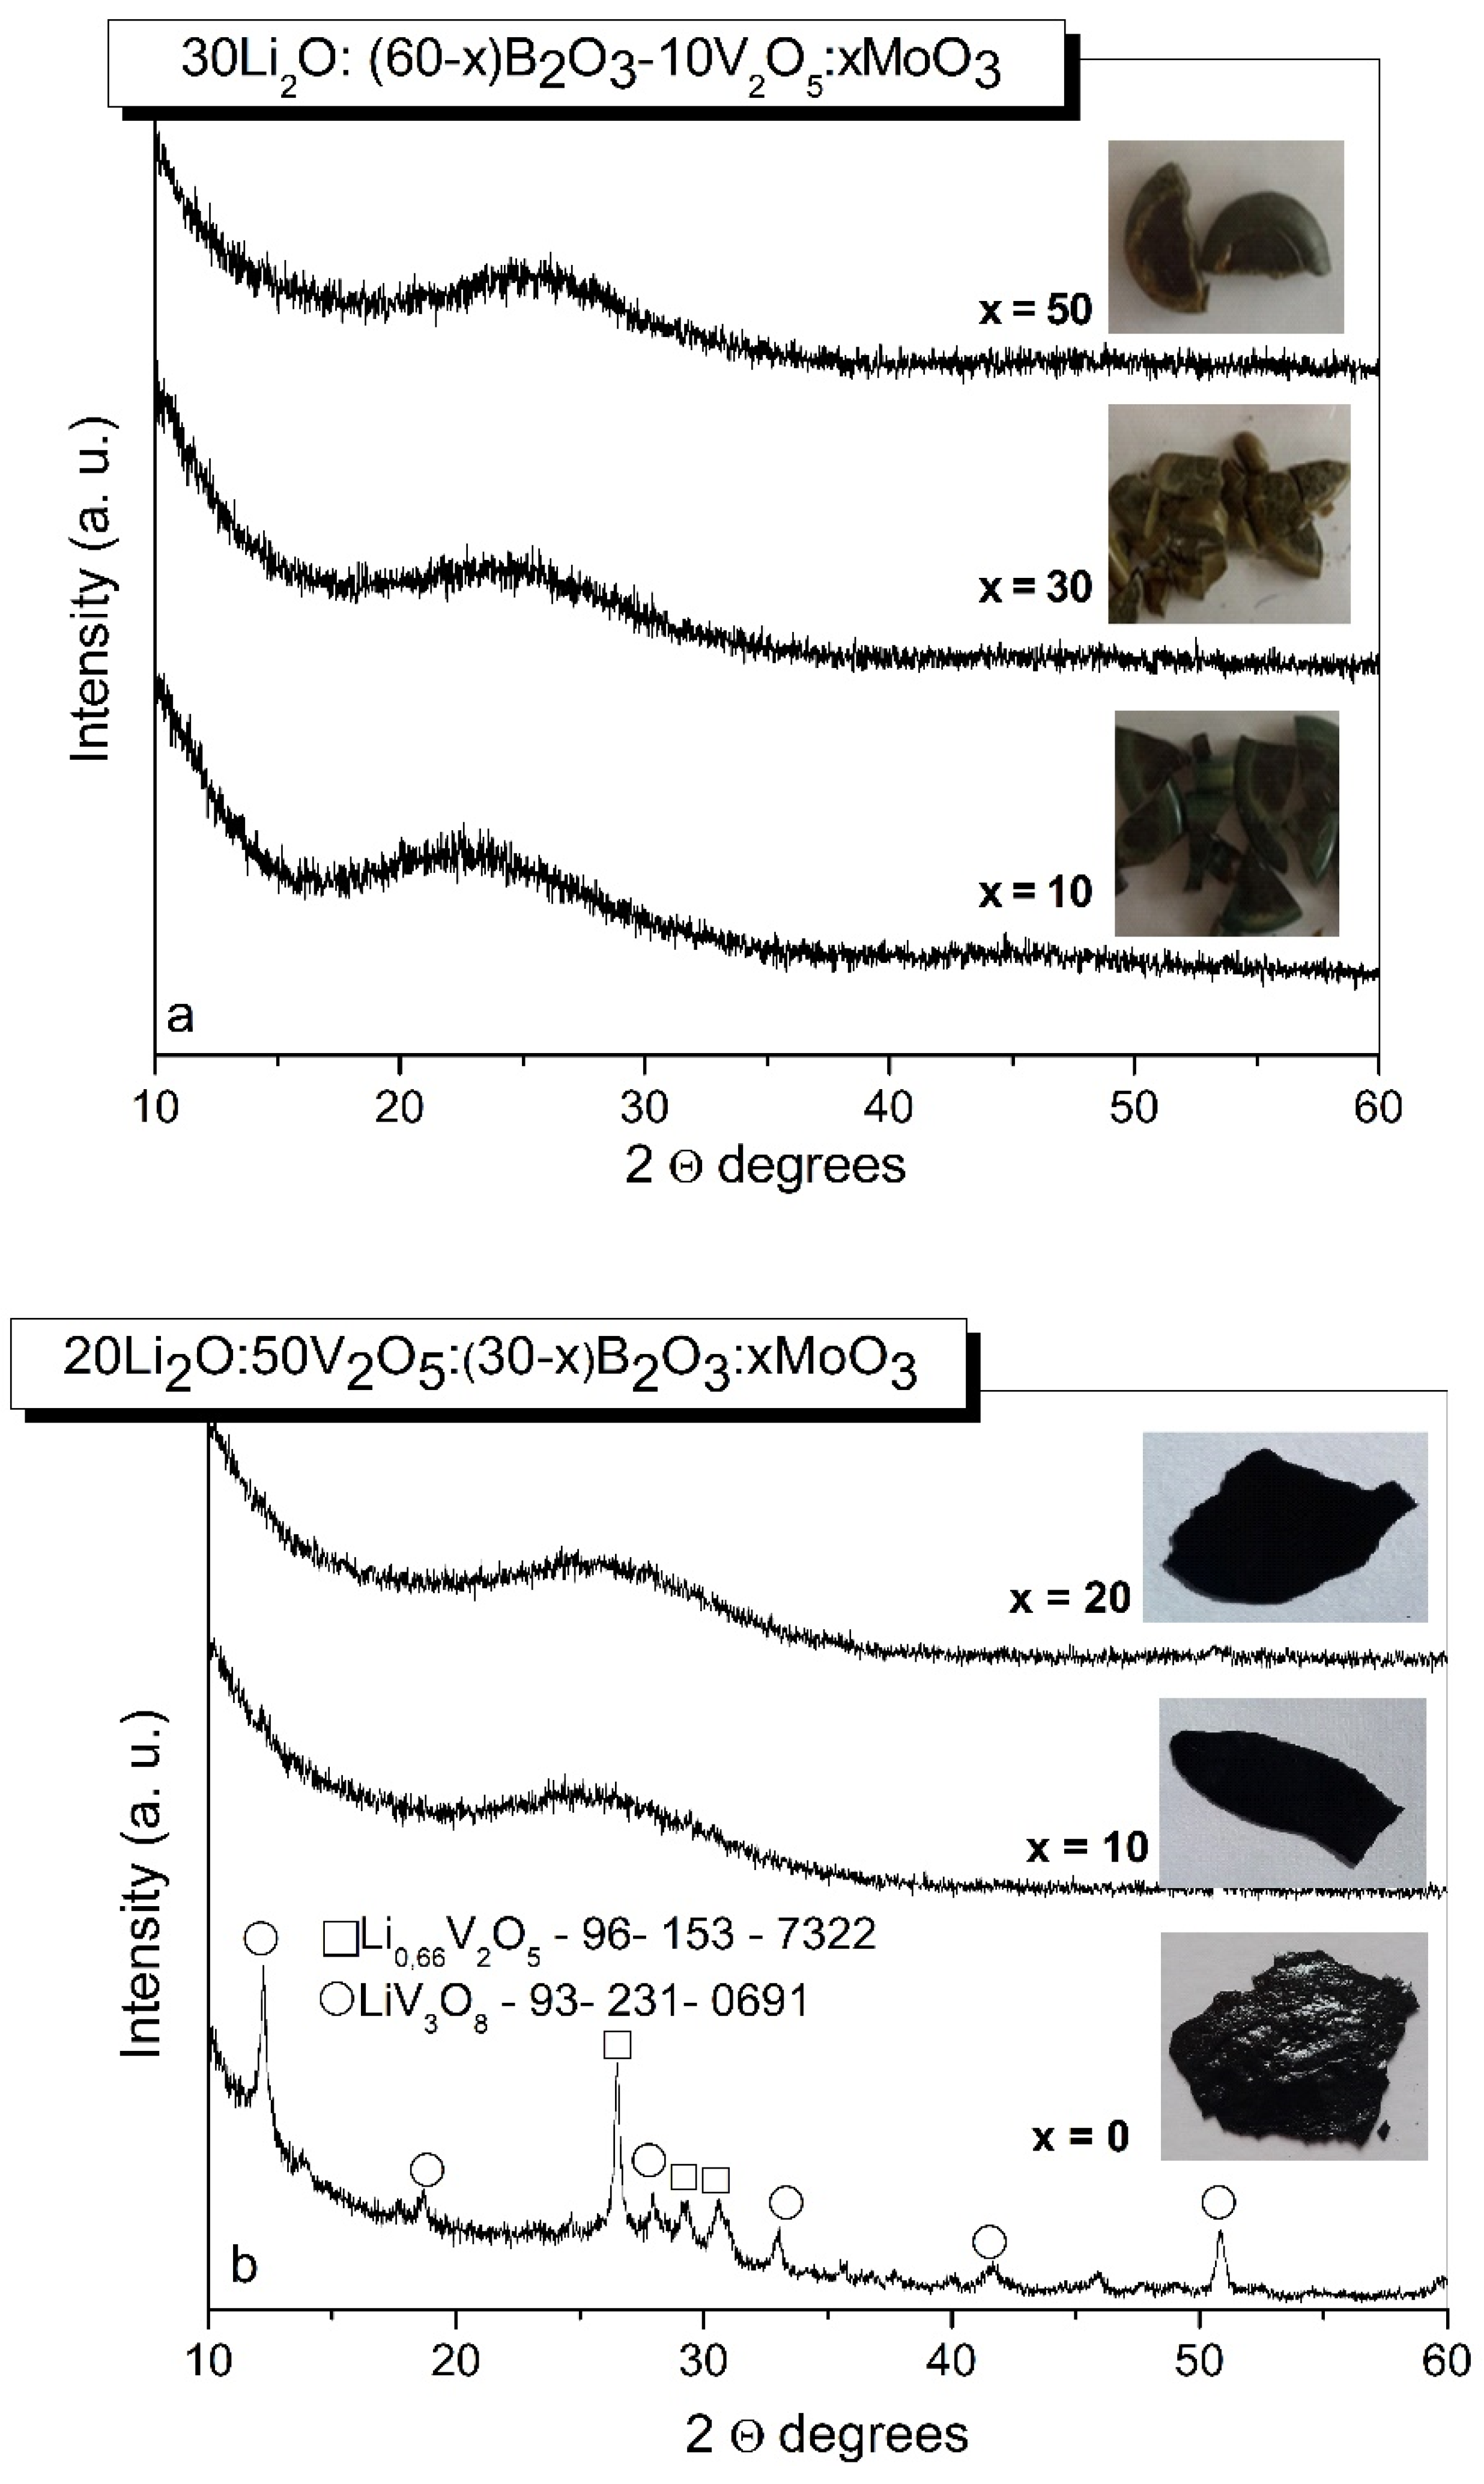
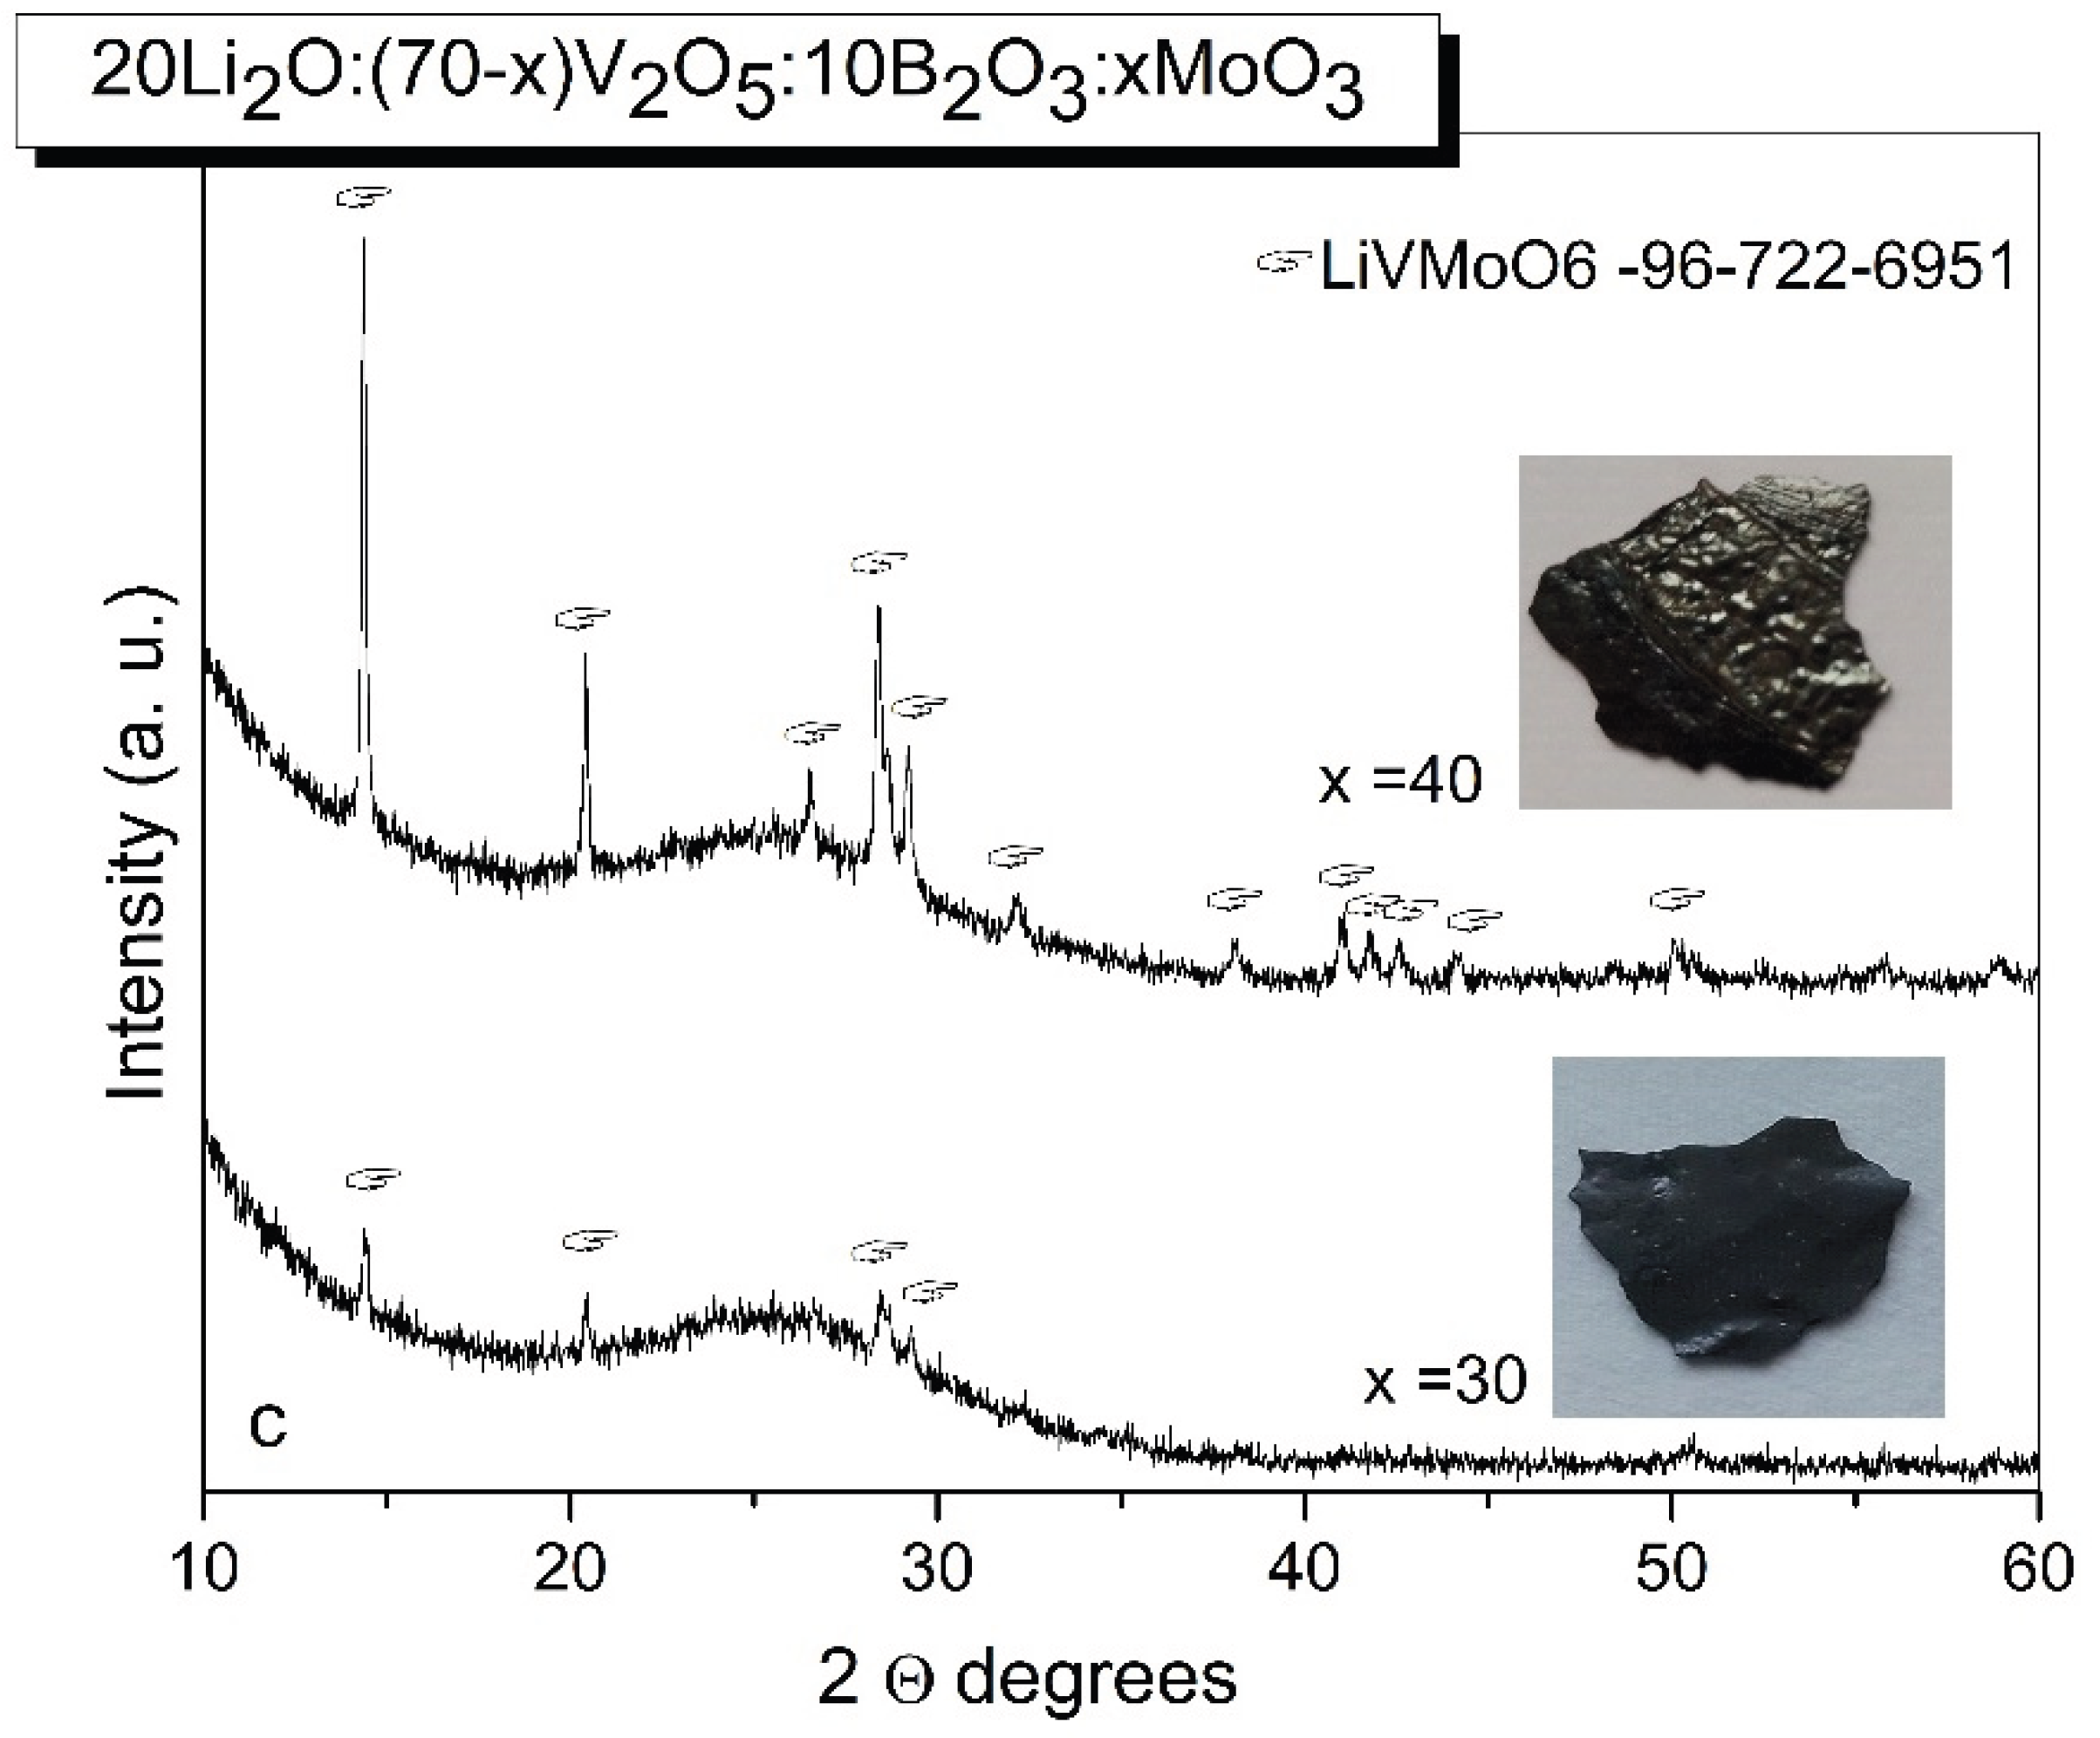
Figure 2.
DSC curves of glasses with the compositions 20Li2O:50V2O5 :(30-x) B2O3:xMoO3, x = 10, 20 mol% obtained by melt quenching method.
Figure 2.
DSC curves of glasses with the compositions 20Li2O:50V2O5 :(30-x) B2O3:xMoO3, x = 10, 20 mol% obtained by melt quenching method.
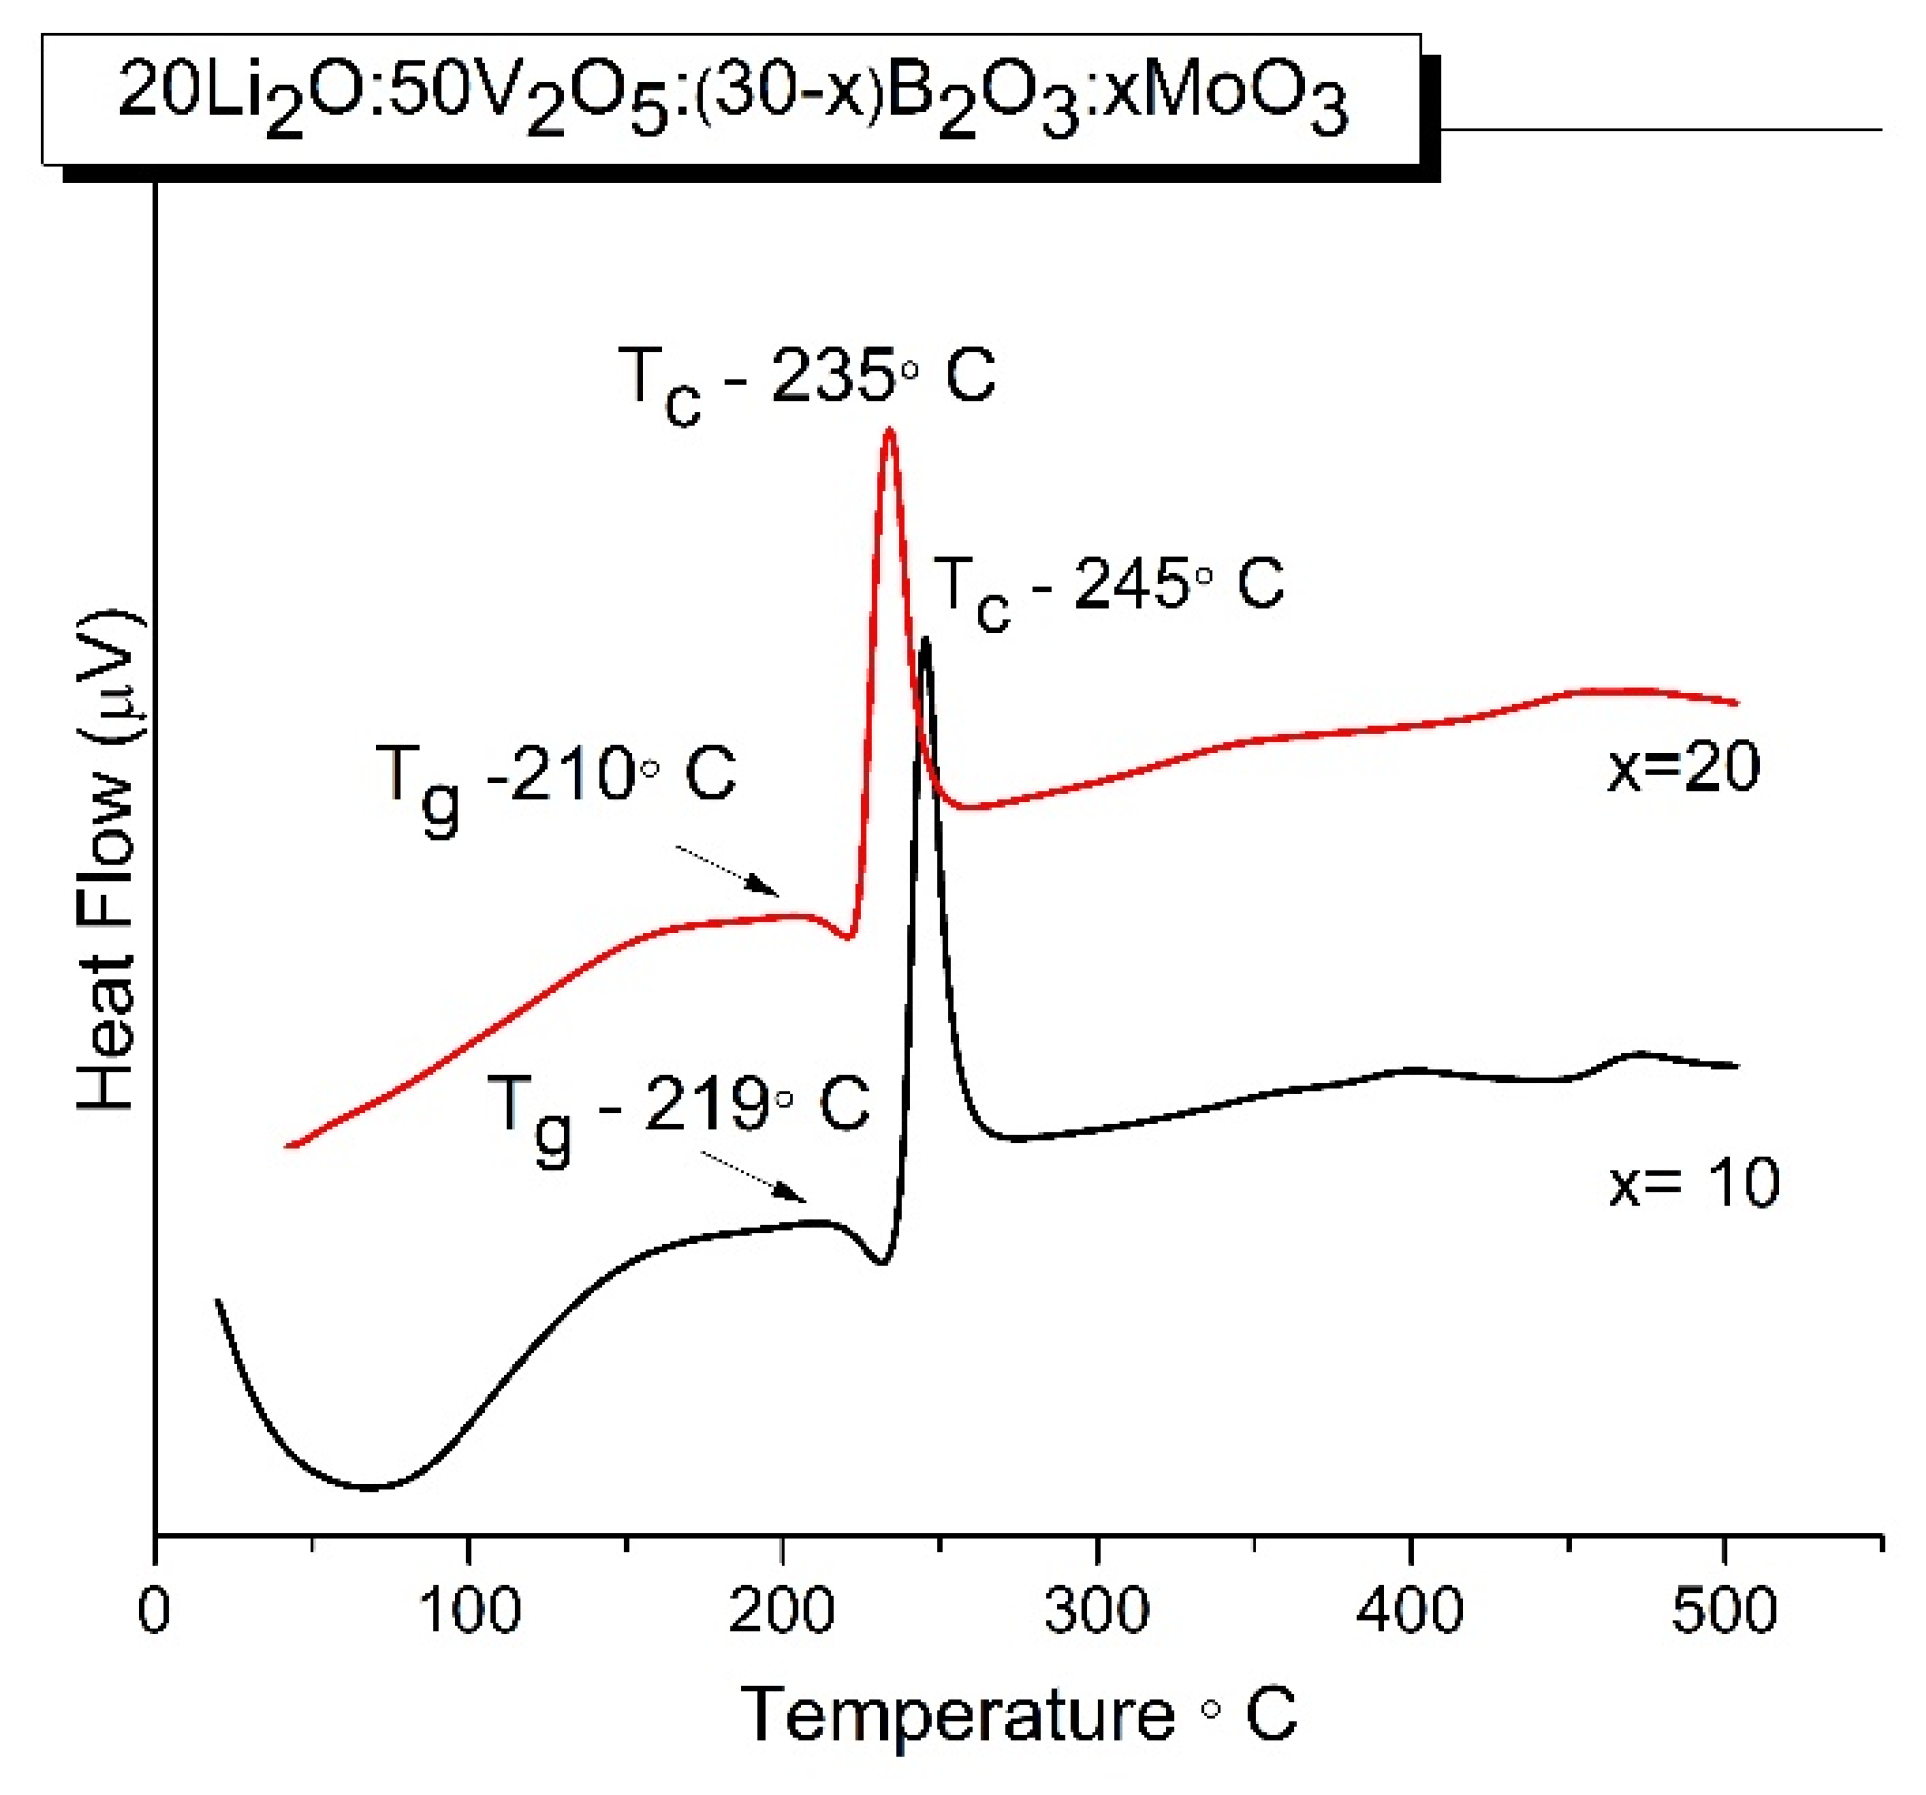
Figure 3.
IR spectra (a) and deconvoluted IR spectra (b), (c) of glasses with the compositions 20Li2O:50V2O5 :(30-x) B2O3:xMoO3, x = 10, 20 mol% obtained by melt quenching method.
Figure 3.
IR spectra (a) and deconvoluted IR spectra (b), (c) of glasses with the compositions 20Li2O:50V2O5 :(30-x) B2O3:xMoO3, x = 10, 20 mol% obtained by melt quenching method.
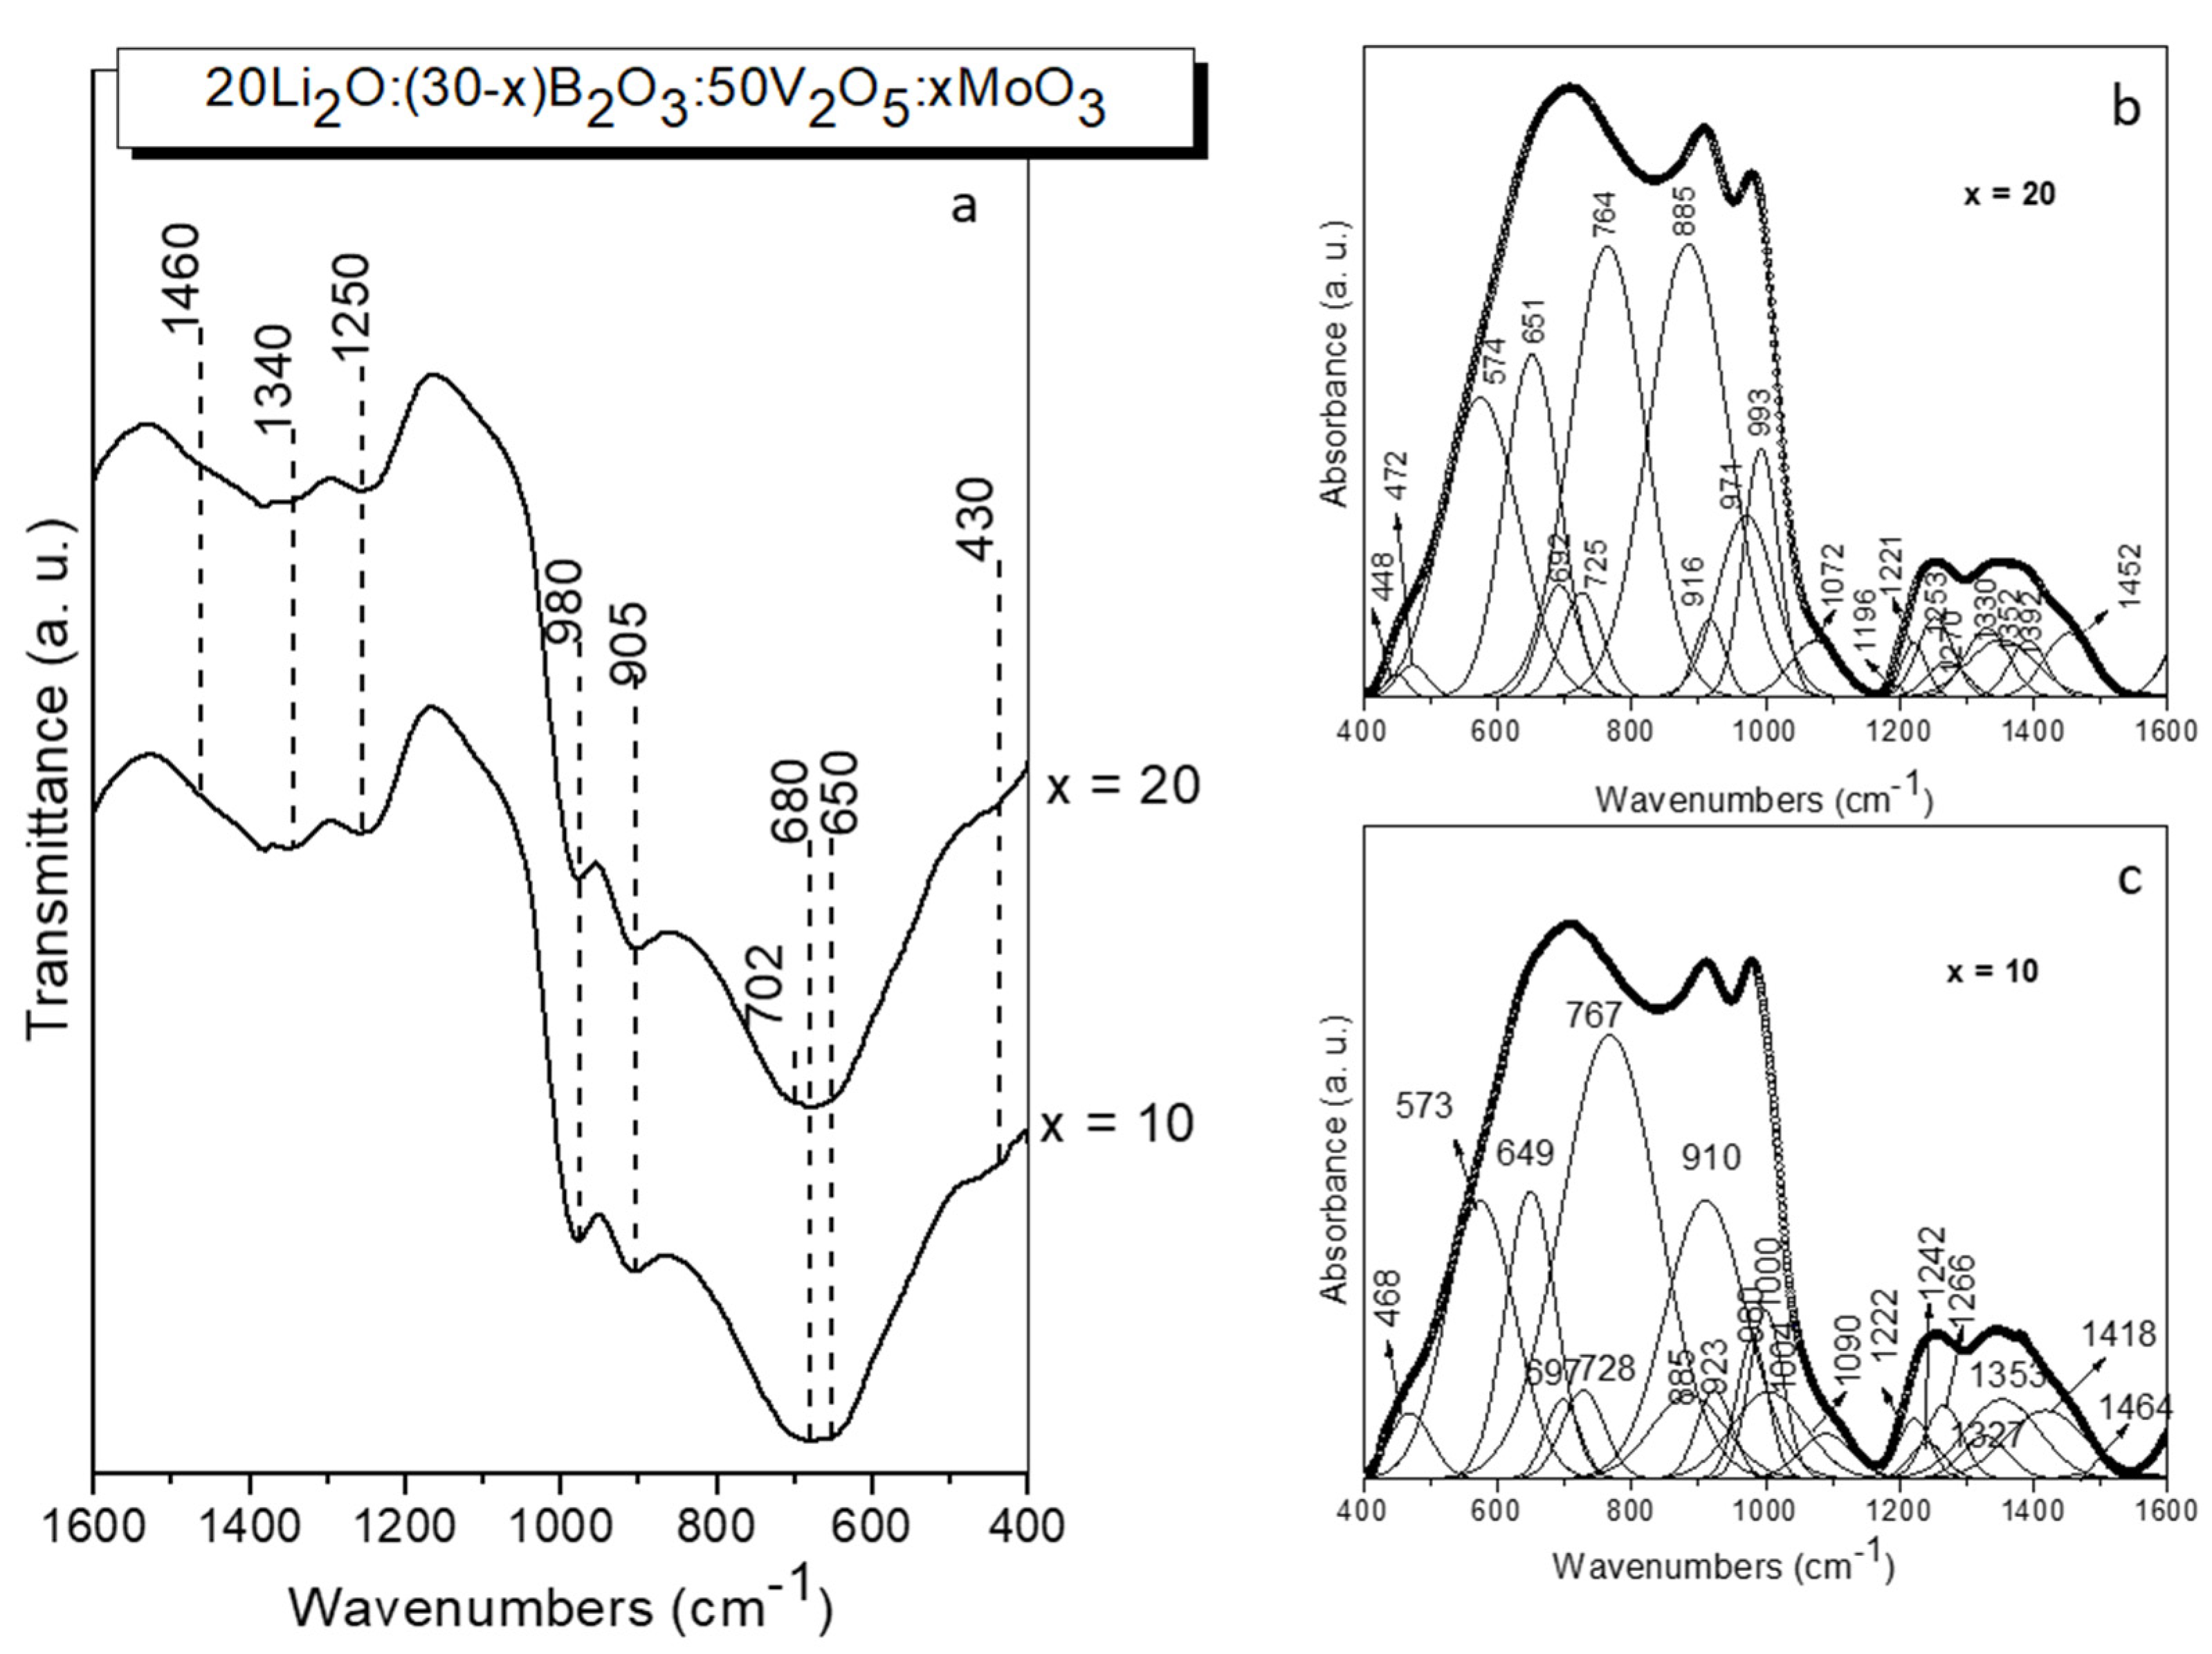
Figure 5.
Arrhenius plots of the glasses with the compositions 20Li2O:50V2O5 :(30-x) B2O3:xMoO3, x = 10, 20 mol%.
Figure 5.
Arrhenius plots of the glasses with the compositions 20Li2O:50V2O5 :(30-x) B2O3:xMoO3, x = 10, 20 mol%.
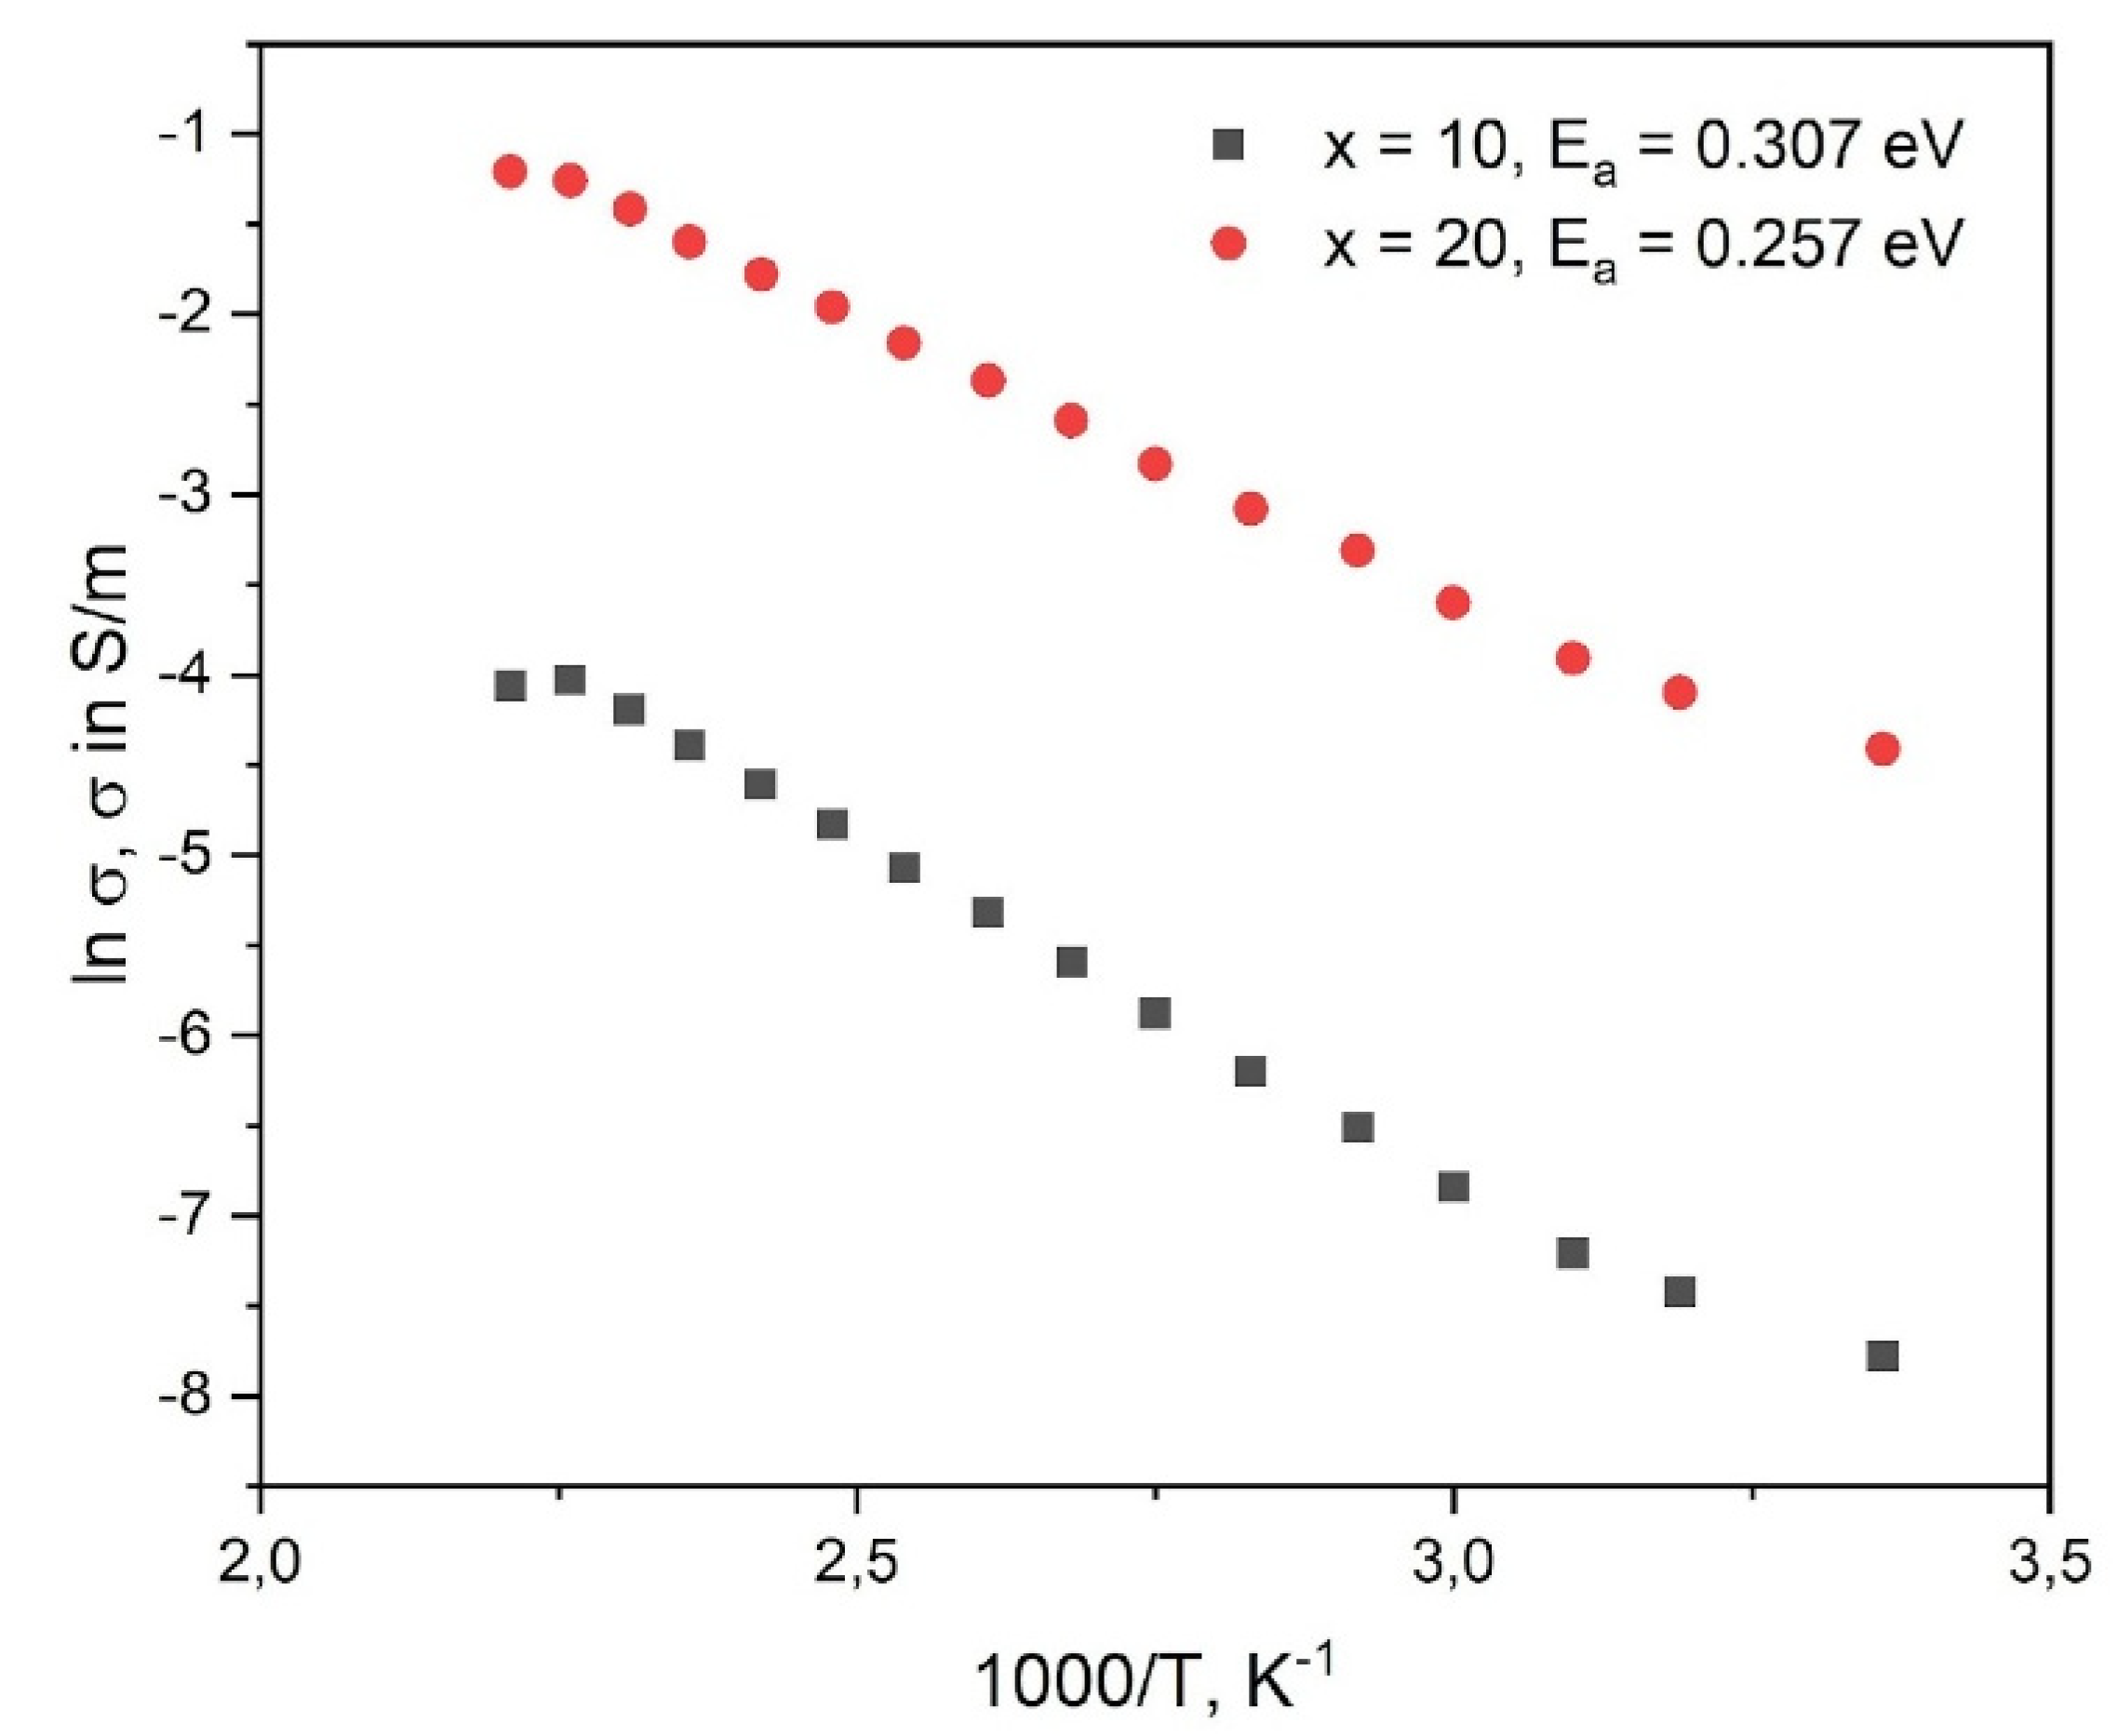
Figure 6.
(a) Electrochemical impedance spectra of the C35 and C60 cells prior to electrochemical testing;(b) Galvanostatic charge-discharge curves of the C35 cell at different current densities;(c) Galvanostatic charge-discharge curves of the C60 cell within different voltage windows; (d) Electrochemical impedance spectra of the C60 cell measured after charging and after discharging during the 50th cycle within the voltage range of 2.0–4.2 V; (e) Charge-discharge profiles of the C60 cell over 50 cycles within the voltage range of 2.0–4.2 V.
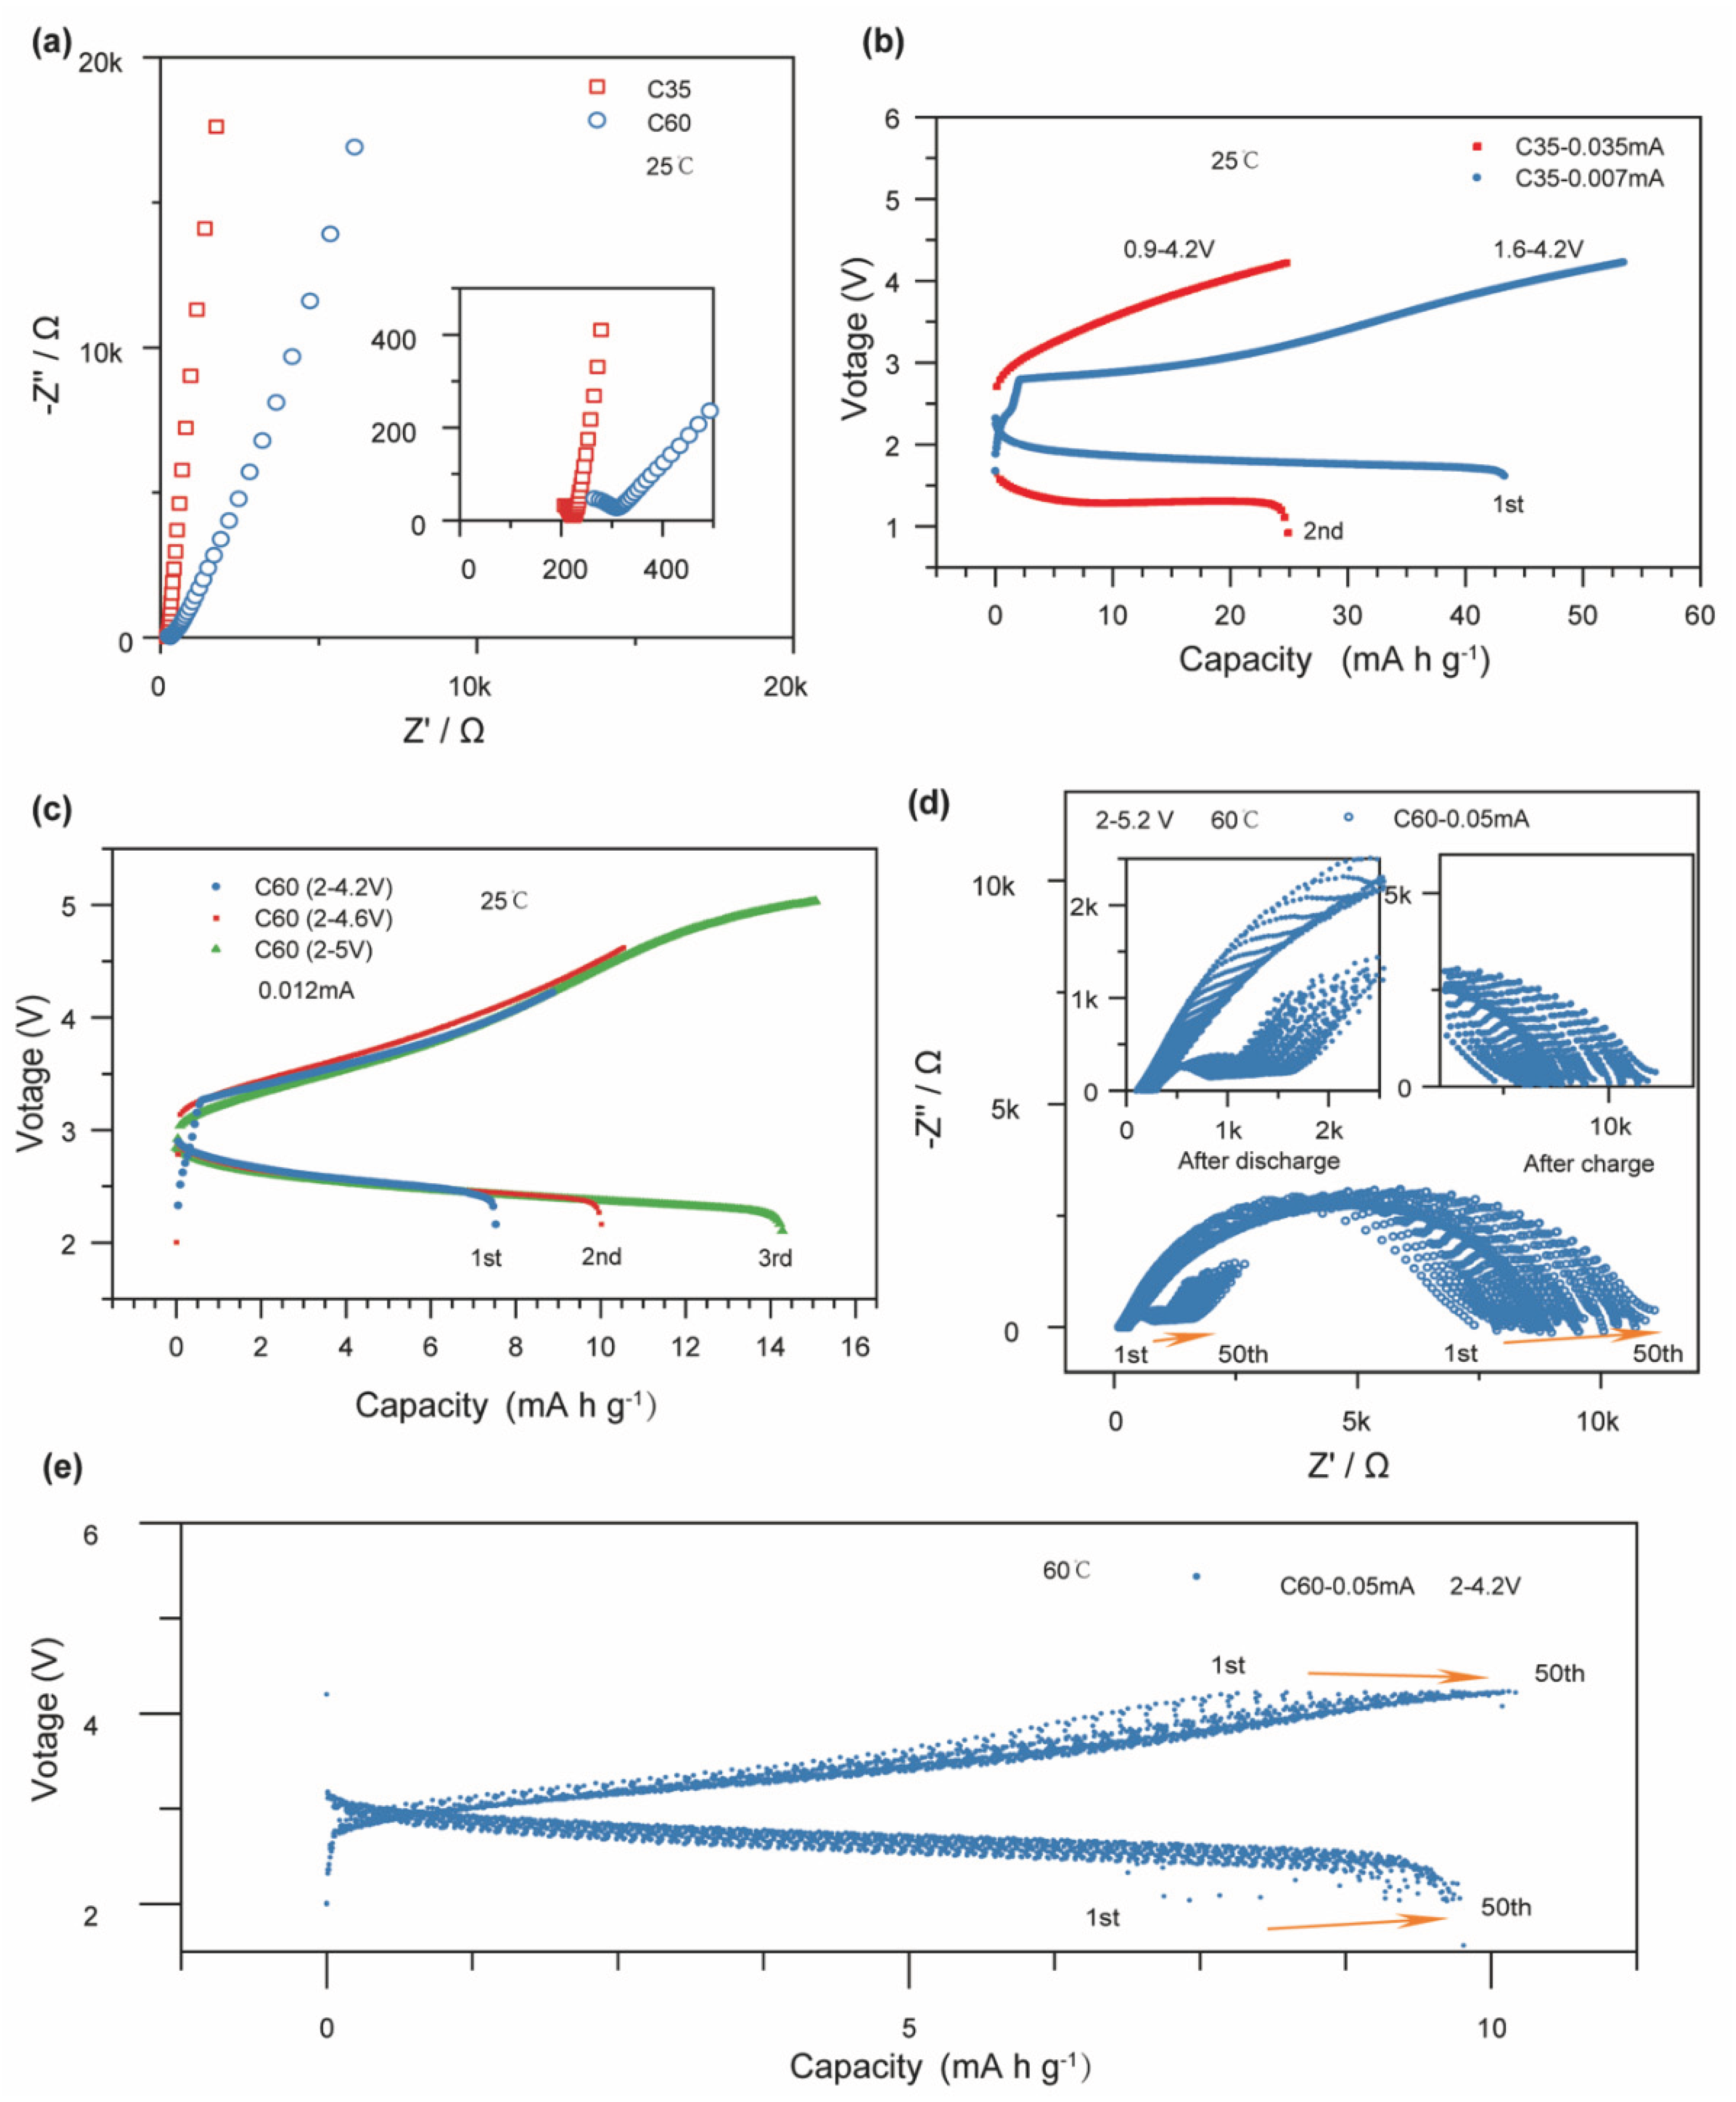

Table 1.
Nominal compositions, experimental conditions applied and visual observations of the quenched samples.
Table 1.
Nominal compositions, experimental conditions applied and visual observations of the quenched samples.
| Sample | Li2O (mol.%) |
B2O3 (mol.%) |
V2O5 (mol.%) |
MoO3 (mol.%) |
Melting temperature (° С) |
Colling rate К/s |
Visual assessment |
| 1. | 30 | 10 | 10 | 50 | 850 | ≤101-102 | Hygroscopic/Non homogeneous glass |
| 2. | 30 | 30 | 10 | 30 | 850 | ≤101-102 | Hygroscopic/Non homogeneous glass |
| 3. | 30 | 50 | 10 | 10 | 850 | ≤101-102 | Hygroscopic/Non homogeneous glass |
Table 2.
Nominal compositions, experimental conditions applied and visual observations of the quenched samples.
Table 2.
Nominal compositions, experimental conditions applied and visual observations of the quenched samples.
| Sample | Li2O (mol.%) |
B2O3 (mol.%) |
V2O5 (mol.%) |
MoO3 (mol.%) |
Melting temperature (° С) |
Colling rate К/s |
Visual assessment |
| 1. | 20 | 20 | 50 | - | 950 | 101-102 | Glass+crystals |
| 2. | 20 | 20 | 50 | 10 | 950 | 101-102 | Non hygroscopic/Homogeneous glass |
| 3. | 20 | 10 | 50 | 20 | 950 | 101-102 | Non hygroscopic/Homogeneous glass |
| 4. | 20 | 10 | 40 | 30 | 950 | 101-102 | Glass+crystals |
| 5. | 20 | 10 | 30 | 40 | 950 | 101-102 | Glass+crystalls |
Table 3.
Values of glass transition temperature Tg, crystallization temperatures (Tc), thermal stability ΔT and average single-bond enthalpy EB of investigated glasses.
Table 3.
Values of glass transition temperature Tg, crystallization temperatures (Tc), thermal stability ΔT and average single-bond enthalpy EB of investigated glasses.
| Sample ID | Tg/°C | Tc/°C | ΔT/°C | EB/KJ mol-1 |
| x = 10 | 219 | 245 | 24 | 612 |
| x = 20 | 210 | 235 | 25 | 592 |
Table 4.
Infrared bands (in cm-1) and their assignments for glasses 20Li2O:50V2O5 :(30-x) B2O3:xMoO3, x = 10, 20 mol%.
Table 4.
Infrared bands (in cm-1) and their assignments for glasses 20Li2O:50V2O5 :(30-x) B2O3:xMoO3, x = 10, 20 mol%.
| Infrared bands position (cm-1) | Assignment | Ref. |
| 468-472 | δ V2O2 (VO5) | 46 |
| 573 | νs (Me2O8), Me= V/Mo | 48 |
| 649-651 | νas (VO4) | 45 |
| 697 | ν3 (MoO4) | 49 |
| 728 | νs (Me2O8), Me= V/Mo | 48 |
| 767-764 | ν (V - O - V) | 46 |
| 885 | ν (Me - O - Me), (Mo/VO6) Me= V/Mo |
48 |
| 910 | ν1 (MoO4) | 49 |
| 923-916 | ν (Me = O), (Mo/VO6) Me= V/Mo |
45, 49 |
| 980-971 | ν (Mo = O), MoO6 | 47 |
| 1000-993 | ν (V=O), (VO5) | 46 |
| 1090-1072 | ν BØ4- | 44 |
| 1196; 1242-1253 | ν3 BO33- | 42 |
| 1221; 1237-1330 | B-O-B stretch in pyroborate units, BØO22- ;B-O- stretch in in pyroborate units, BØO22- | 42 |
| 1266-1270; 1352, 1392-1418; 1452-1464 |
BØ stretch in metaborate unuts, BØ2O+ νas(B–O–B); B–O–B bridges connect BO3 units ν(B–O-) stretch in BØ2O- units |
42, 43 42, 43 |
Table 5.
Values of physical parameters of glasses 20Li2O:50V2O5 :(30-x) B2O3:xMoO3, x = 10, 20 mol%: density (ρg), molar volume (Vm), oxygen molar volume (Vo), oxygen packing density (OPD).
Table 5.
Values of physical parameters of glasses 20Li2O:50V2O5 :(30-x) B2O3:xMoO3, x = 10, 20 mol%: density (ρg), molar volume (Vm), oxygen molar volume (Vo), oxygen packing density (OPD).
| Sample ID | ρ (g/cm3) | Vm (cm3/mol) | Vo (cm3/mol) | OPD (g atom/l) |
| x = 10 | 2.964±0.006 | 39.90 | 11.08 | 90.22 |
| x = 20 | 3.051±0.002 | 43.48 | 12.08 | 82.80 |
Table 6.
Data from the electrical measurements: impedance modulus, |Z| and phase angle, φ at 1 Hz, calculated dc-conductivity, σ and the respective activation energies, Ea for the samples x = 10 and 20.
Table 6.
Data from the electrical measurements: impedance modulus, |Z| and phase angle, φ at 1 Hz, calculated dc-conductivity, σ and the respective activation energies, Ea for the samples x = 10 and 20.
| x (mol%) | t (°C) | |Z| (Ω) | φ (°) | σ (S/m) | Ea (eV) |
|
20 |
RT | 1.0699e+03 | - 0.03 | 0,0121 |
0.257±0.001 |
| 40 | 7.8543e+02 | - 0.03 | 0,0165 | ||
| 50 | 6.4880e+02 | - 0.03 | 0,02 | ||
| 60 | 4.7676e+02 | - 0.04 | 0,0273 | ||
| 70 | 3.5601e+02 | - 0.05 | 0,0365 | ||
| 80 | 2.8176e+02 | - 0.05 | 0,0461 | ||
| 90 | 2.1960e+02 | - 0.06 | 0,0592 | ||
| 100 | 1.7293e+02 | - 0.05 | 0,0751 | ||
| 110 | 1.3925e+02 | - 0.05 | 0,0933 | ||
| 120 | 1.1285e+02 | - 0.06 | 0,115 | ||
| 130 | 9.2586e+01 | - 0.06 | 0,14 | ||
| 140 | 7.7259e+01 | - 0.07 | 0,168 | ||
| 150 | 6.4038e+01 | - 0.07 | 0,203 | ||
| 160 | 5.3605e+01 | - 0.08 | 0,242 | ||
| 170 | 4.5850e+01 | - 0.10 | 0,283 | ||
| 180 | 4.3496e+01 | - 0.11 | 0,299 | ||
| 10 | RT | 3.0617e+04 | - 0.05 | 4,16E-4 | 0.307±0.002 |
| 40 | 2.1214e+04 | - 0.03 | 6E-4 | ||
| 50 | 1.7194e+04 | - 0.03 | 7,41E-4 | ||
| 60 | 1.1905e+04 | - 0.03 | 0,00107 | ||
| 70 | 8.5299e+03 | - 0.03 | 0,00149 | ||
| 80 | 6.2686e+03 | - 0.03 | 0,00203 | ||
| 90 | 4.5696e+03 | - 0/03 | 0,00279 | ||
| 100 | 3.4185e+03 | - 0.04 | 0,00373 | ||
| 110 | 2.6089e+03 | - 0.04 | 0,00488 | ||
| 120 | 2.0284e+03 | - 0.04 | 0,00628 | ||
| 130 | 1.5909e+03 | - 0.05 | 0,00801 | ||
| 140 | 1.2780e+03 | - 0.05 | 0,00997 | ||
| 150 | 1.0293e+03 | - 0.06 | 0,0124 | ||
| 160 | 8.4183e+02 | - 0.06 | 0,0151 | ||
| 170 | 7.1487e+02 | - 0.08 | 0,0178 | ||
| 180 | 7.3508e+02 | - 0.11 | 0,0173 |
Disclaimer/Publisher’s Note: The statements, opinions and data contained in all publications are solely those of the individual author(s) and contributor(s) and not of MDPI and/or the editor(s). MDPI and/or the editor(s) disclaim responsibility for any injury to people or property resulting from any ideas, methods, instructions or products referred to in the content. |
© 2025 by the authors. Licensee MDPI, Basel, Switzerland. This article is an open access article distributed under the terms and conditions of the Creative Commons Attribution (CC BY) license (http://creativecommons.org/licenses/by/4.0/).
Copyright: This open access article is published under a Creative Commons CC BY 4.0 license, which permit the free download, distribution, and reuse, provided that the author and preprint are cited in any reuse.


