Submitted:
29 July 2025
Posted:
30 July 2025
You are already at the latest version
Abstract
In this case series, we describe two patients with spinal involvement of gout. The first case involved a 67-year-old female who presented to the emergency department with a one-week history of weakness in both upper and lower limbs, despite no prior history of gout. Cervical spine MRI revealed spinal cord compression at the C4 level from a posterior lesion. During surgery, chalky white deposits consistent with gouty tophi were observed in the ligamentum flavum within the epidural space at C4. These intraoperative findings correlated with elevated serum uric acid levels. The second case concerned a 68-year-old male who presented with a five-day history of right lower limb pain along with bilateral knee discomfort. Radiologic and laboratory evaluations revealed elevated inflammatory markers, negatively birefringent crystals in knee joint aspirate, spondylodiscitis at the L5-S1 level, and a right-sided synovial cyst at the T10–T11 level causing spinal cord compression. Following initiation of anti-gout therapy, the patient experienced significant clinical improvement, normalization of inflammatory markers, and radiologic resolution of the thoracic synovial cyst.
Keywords:
gout
; cord compression
; facet joint cyst
; anti gout medications
1. Introduction
Gout is an inflammatory arthritis characterized by chronic hyperuricemia, leading to the deposition of monosodium urate (MSU) crystals in joints and connective tissues. It stands as the most prevalent crystal-induced arthropathy, with a global prevalence estimated at 0.08% [1]. While gout predominantly affects peripheral joints, involvement of the spine is considered rare [2]. Over the past two decades, the global incidence of gout has increased by approximately 63.44%, impacting both men and women. However, it remains more common in males, with a reported male-to-female ratio of 3:1, particularly in regions with a high sociodemographic index [3]. Spinal gout often presents with symptoms such as back or neck pain, and elevated serum uric acid levels are frequently observed. The first documented case of spinal tophaceous gout was reported by Kersley et al. in 1950. Although uncommon, spinal gout can affect various components of the spinal anatomy, including the ligamentum flavum, epidural and intradural spaces, neural foramina, laminae, pedicles, and vertebral bodies. Such involvement can lead to a range of neurological manifestations, including radiculopathy, myelopathy, cauda equina syndrome, or neurogenic claudication, depending on the specific spinal segment affected.
Moreover, MSU crystal deposition in the facet joints may induce joint inflammation, cartilage degeneration, and soft tissue damage, potentially resulting in fluid-filled synovial cysts that exacerbate neurological symptoms. Unlike peripheral gout, which typically presents with recognizable clinical features, spinal gout often lacks classic signs, making diagnosis challenging and increasing the risk of misdiagnosis. This underscores the importance of heightened clinical suspicion, especially in atypical presentations [4,5].
Diagnostic Challenges
Atypical Presentation: Spinal gout does not always manifest with the classical signs associated with peripheral gout, such as podagra. Its symptoms can mimic other conditions like spinal stenosis, disc herniation, or infections [6].
Imaging Limitations: Conventional imaging modalities, including X-rays and MRI, may not effectively distinguish gouty tophi from other spinal pathologies. While CT scans can sometimes reveal calcified tophi, they are not definitive. Dual-energy computed tomography (DECT) has emerged as a valuable imaging tool in diagnosing and managing gout, particularly in identifying gouty tophi. DECT employs two different energy X-ray beams to differentiate materials based on their atomic composition, allowing for the specific identification of urate crystals [7]. Its sensitivity and specificity for gout are 90% and 83%, respectively, and it has been effective in diagnosing gout even in cases with negative synovial fluid analysis [18].
Crystal Studies: The identification of monosodium urate crystals in synovial fluid or tophi is diagnostic of gout. However, these studies can sometimes yield negative results, possibly due to technical difficulties in obtaining samples from spinal locations or prior treatments altering the crystal composition [6].
Biopsy and Histopathology: In many instances, a biopsy may be necessary to achieve a definitive diagnosis. Histopathological examination can reveal tophaceous deposits and chronic inflammatory changes consistent with gout. A high index of suspicion is required in suspected cases, and crystal study samples should be taken separately and not fixed in formalin solution [9].
Given the nonspecific symptoms and the potential for spinal gout to mimic other more common spinal conditions like disc herniation, spinal infections, and neoplastic lesions, maintaining a high index of suspicion is crucial [9,10,11]. This is particularly true for patients with a known history of gout or hyperuricemia, even if they do not present with typical peripheral joint involvement at the time of spinal symptoms. Additionally, while crystal studies can confirm the presence of monosodium urate crystals, these tests may sometimes yield negative results due to difficulties in obtaining spinal samples or previous treatments altering the crystal composition. In some cases, a biopsy may be necessary to achieve a definitive diagnosis, with histopathological examination revealing tophaceous deposits and chronic inflammatory changes consistent with gout [12,13].
2. Cases Presentation
2.1. Case 1
A 67-year-old woman with well-controlled diabetes mellitus, hypertension, hyperlipidemia, and peripheral vascular disease presented to the emergency department with a one-week history of worsening neck pain, along with numbness and weakness in both the upper and lower limbs. She was a non-smoker and non-alcoholic, and remained independent in her activities of daily living. She reported no urinary retention, bowel incontinence, headache, dizziness, fever, or history of gout.
On initial assessment, her vital signs were stable: blood pressure was 137/82 mmHg, body temperature was mildly elevated at 37.7 °C, and her Glasgow Coma Scale (GCS) score was 15. There was no spinal tenderness on examination.
Neurological assessment of the lower limbs showed bilateral weakness, more pronounced on the right side. Muscle power was graded 4/5 (Medical Research Council scale) in hip flexion, knee extension, and big toe dorsiflexion. Sensory examination was intact, and the digital rectal exam (DRE) was normal.
In the upper limbs, muscle power was reduced bilaterally to grade 3/5 in wrist dorsiflexion, shoulder abduction, and finger abduction. A positive Hoffmann sign and brisk reflexes in both upper and lower limbs raised suspicion of cervical spinal cord compression.
Initial blood investigations revealed a white blood cell count of 15.13, an elevated erythrocyte sedimentation rate (ESR) of 85, and a C-reactive protein (CRP) level of 14.0, indicating inflammation. Bone metabolism tests were normal, but Vitamin D 25-Hydroxy levels were low.
Lumbar spine X-ray showed loss of normal lumbar lordosis, grade 1 retrolisthesis of L3 over L4, moderate compression fractures at L4 and L5, and mild anterior wedging at L1 and L2. The orthopedic spine team assessed the patient and made a preliminary diagnosis of cervical myelopathy, recommending an MRI of the whole spine.
The following day, upper limb strength deteriorated further, prompting an urgent whole-spine MRI. Intravenous dexamethasone (8 mg stat, followed by 4 mg three times daily) was initiated, and the patient was kept nil per os (NPO) in preparation for potential emergency surgery. ASIA scoring was conducted every two hours, and a CT brain scan was requested to rule out a cerebrovascular event.
2.1.1. Imaging Findings
CT Brain: Normal.
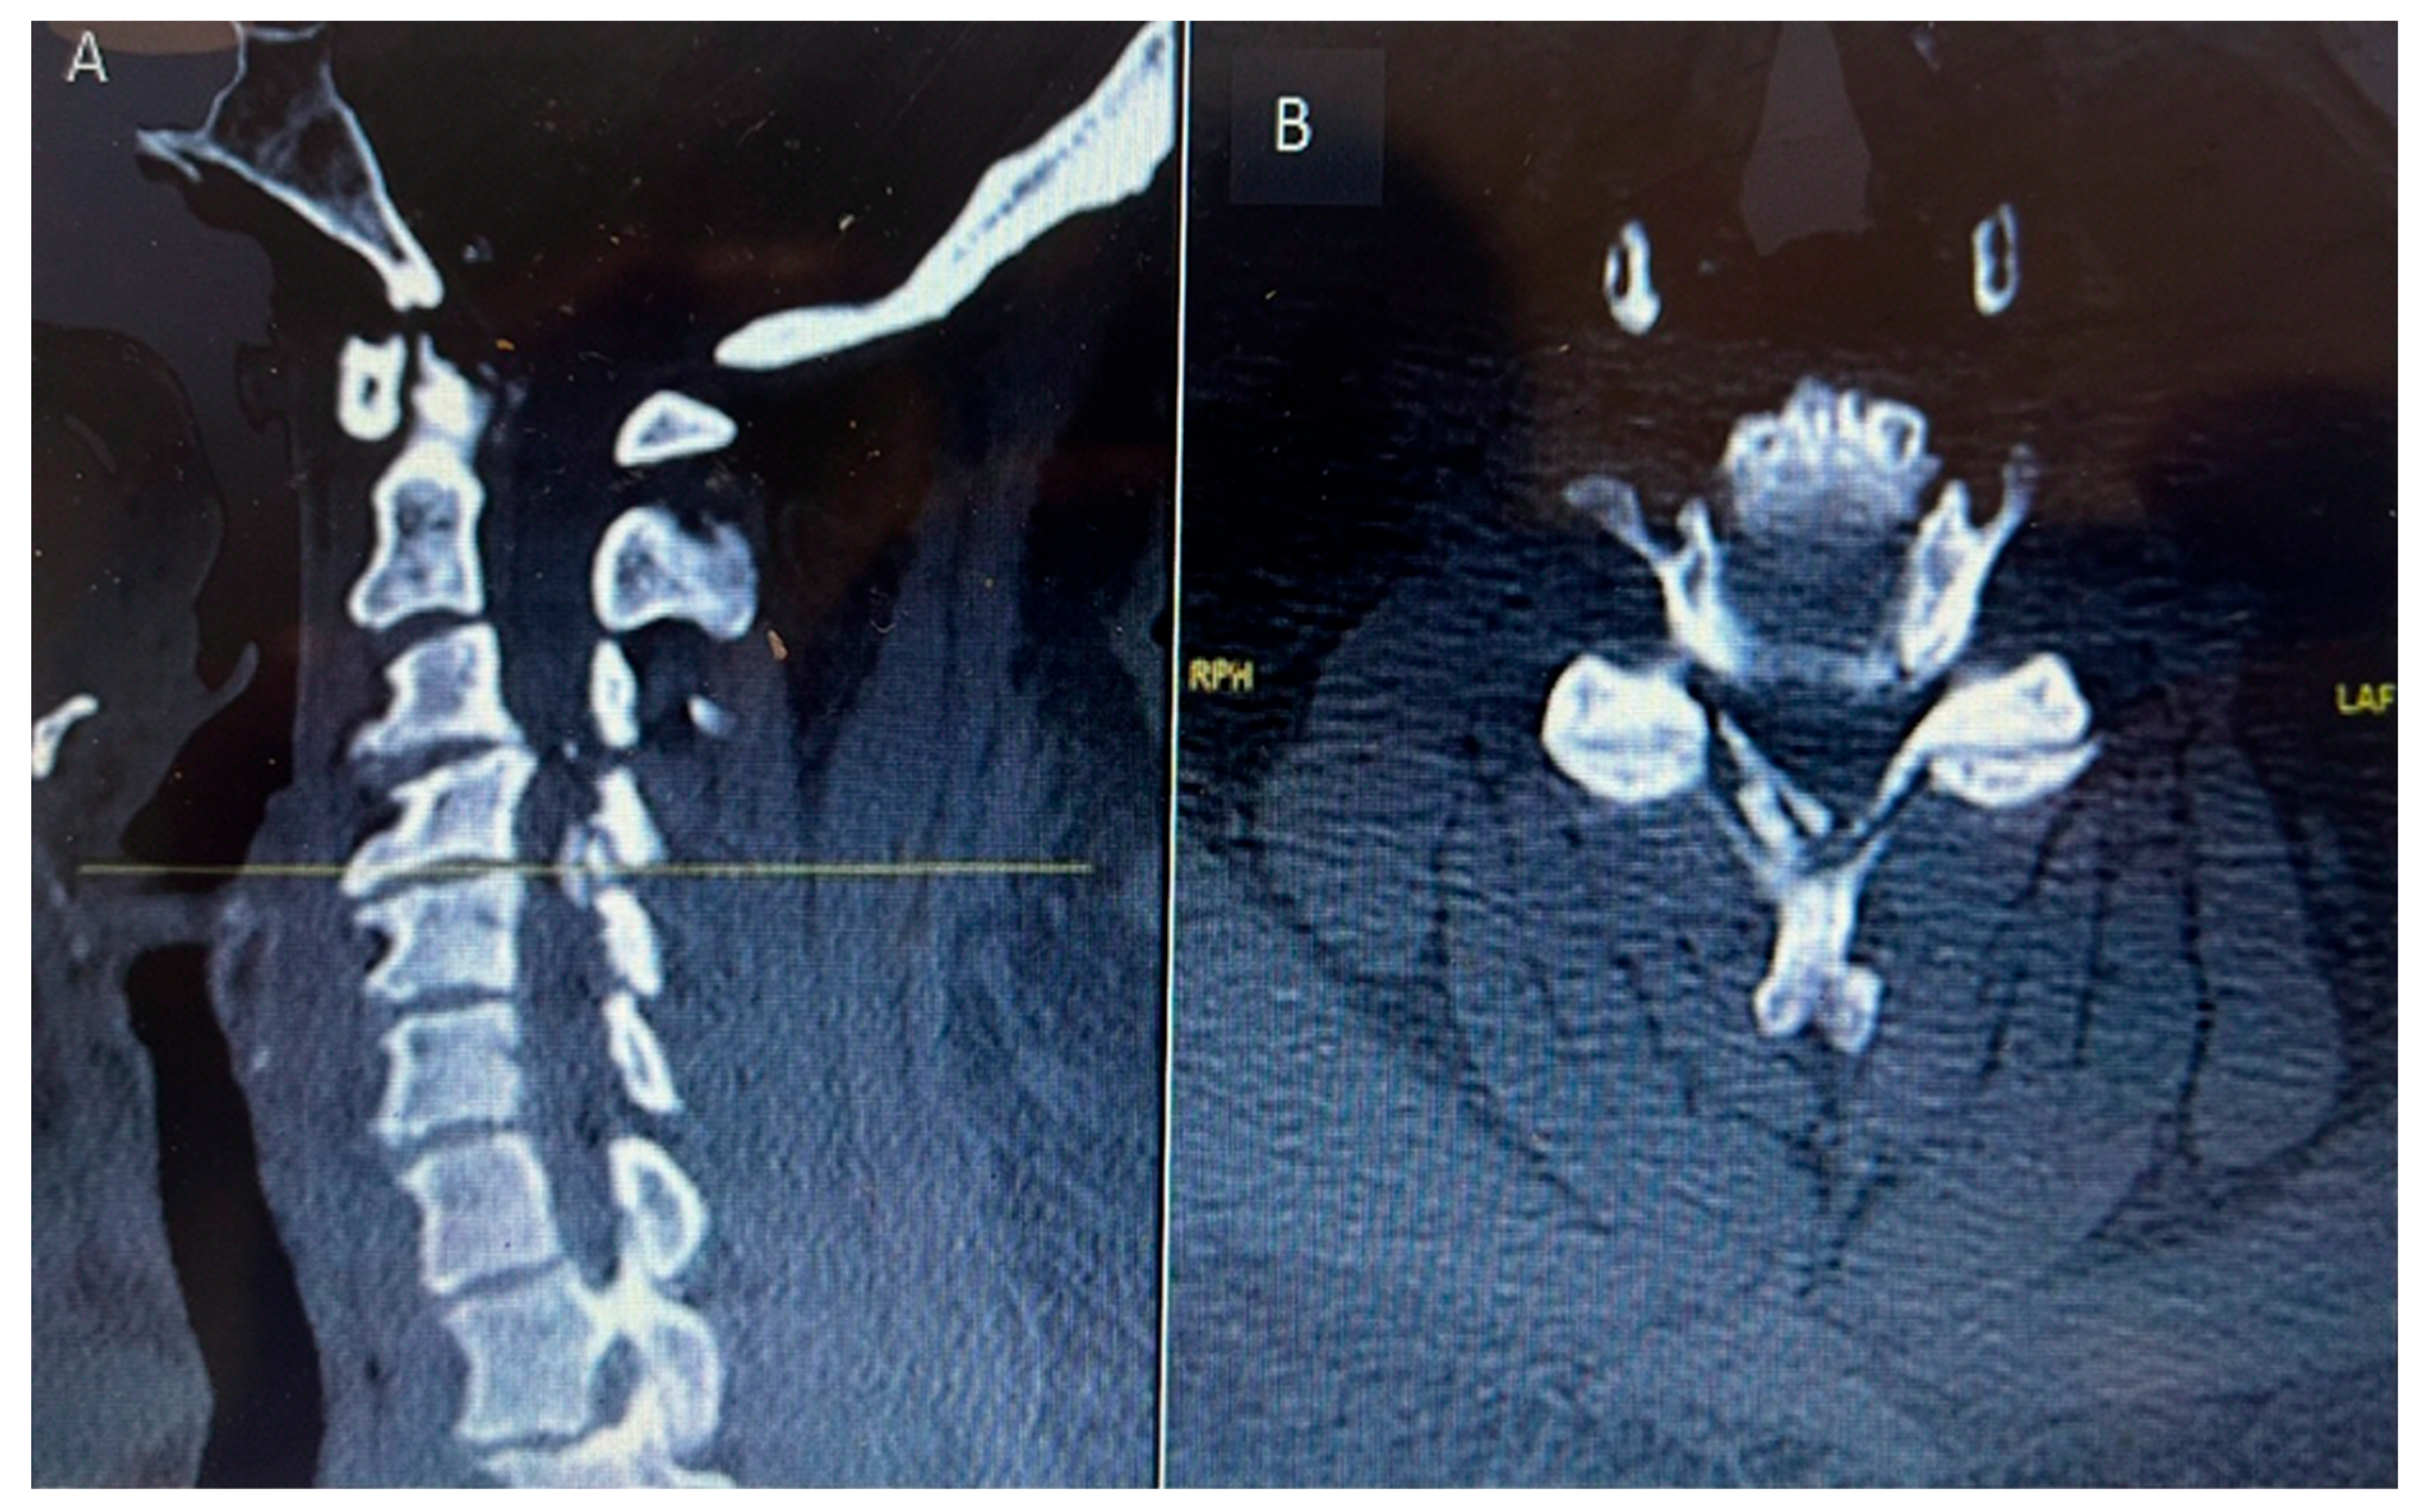
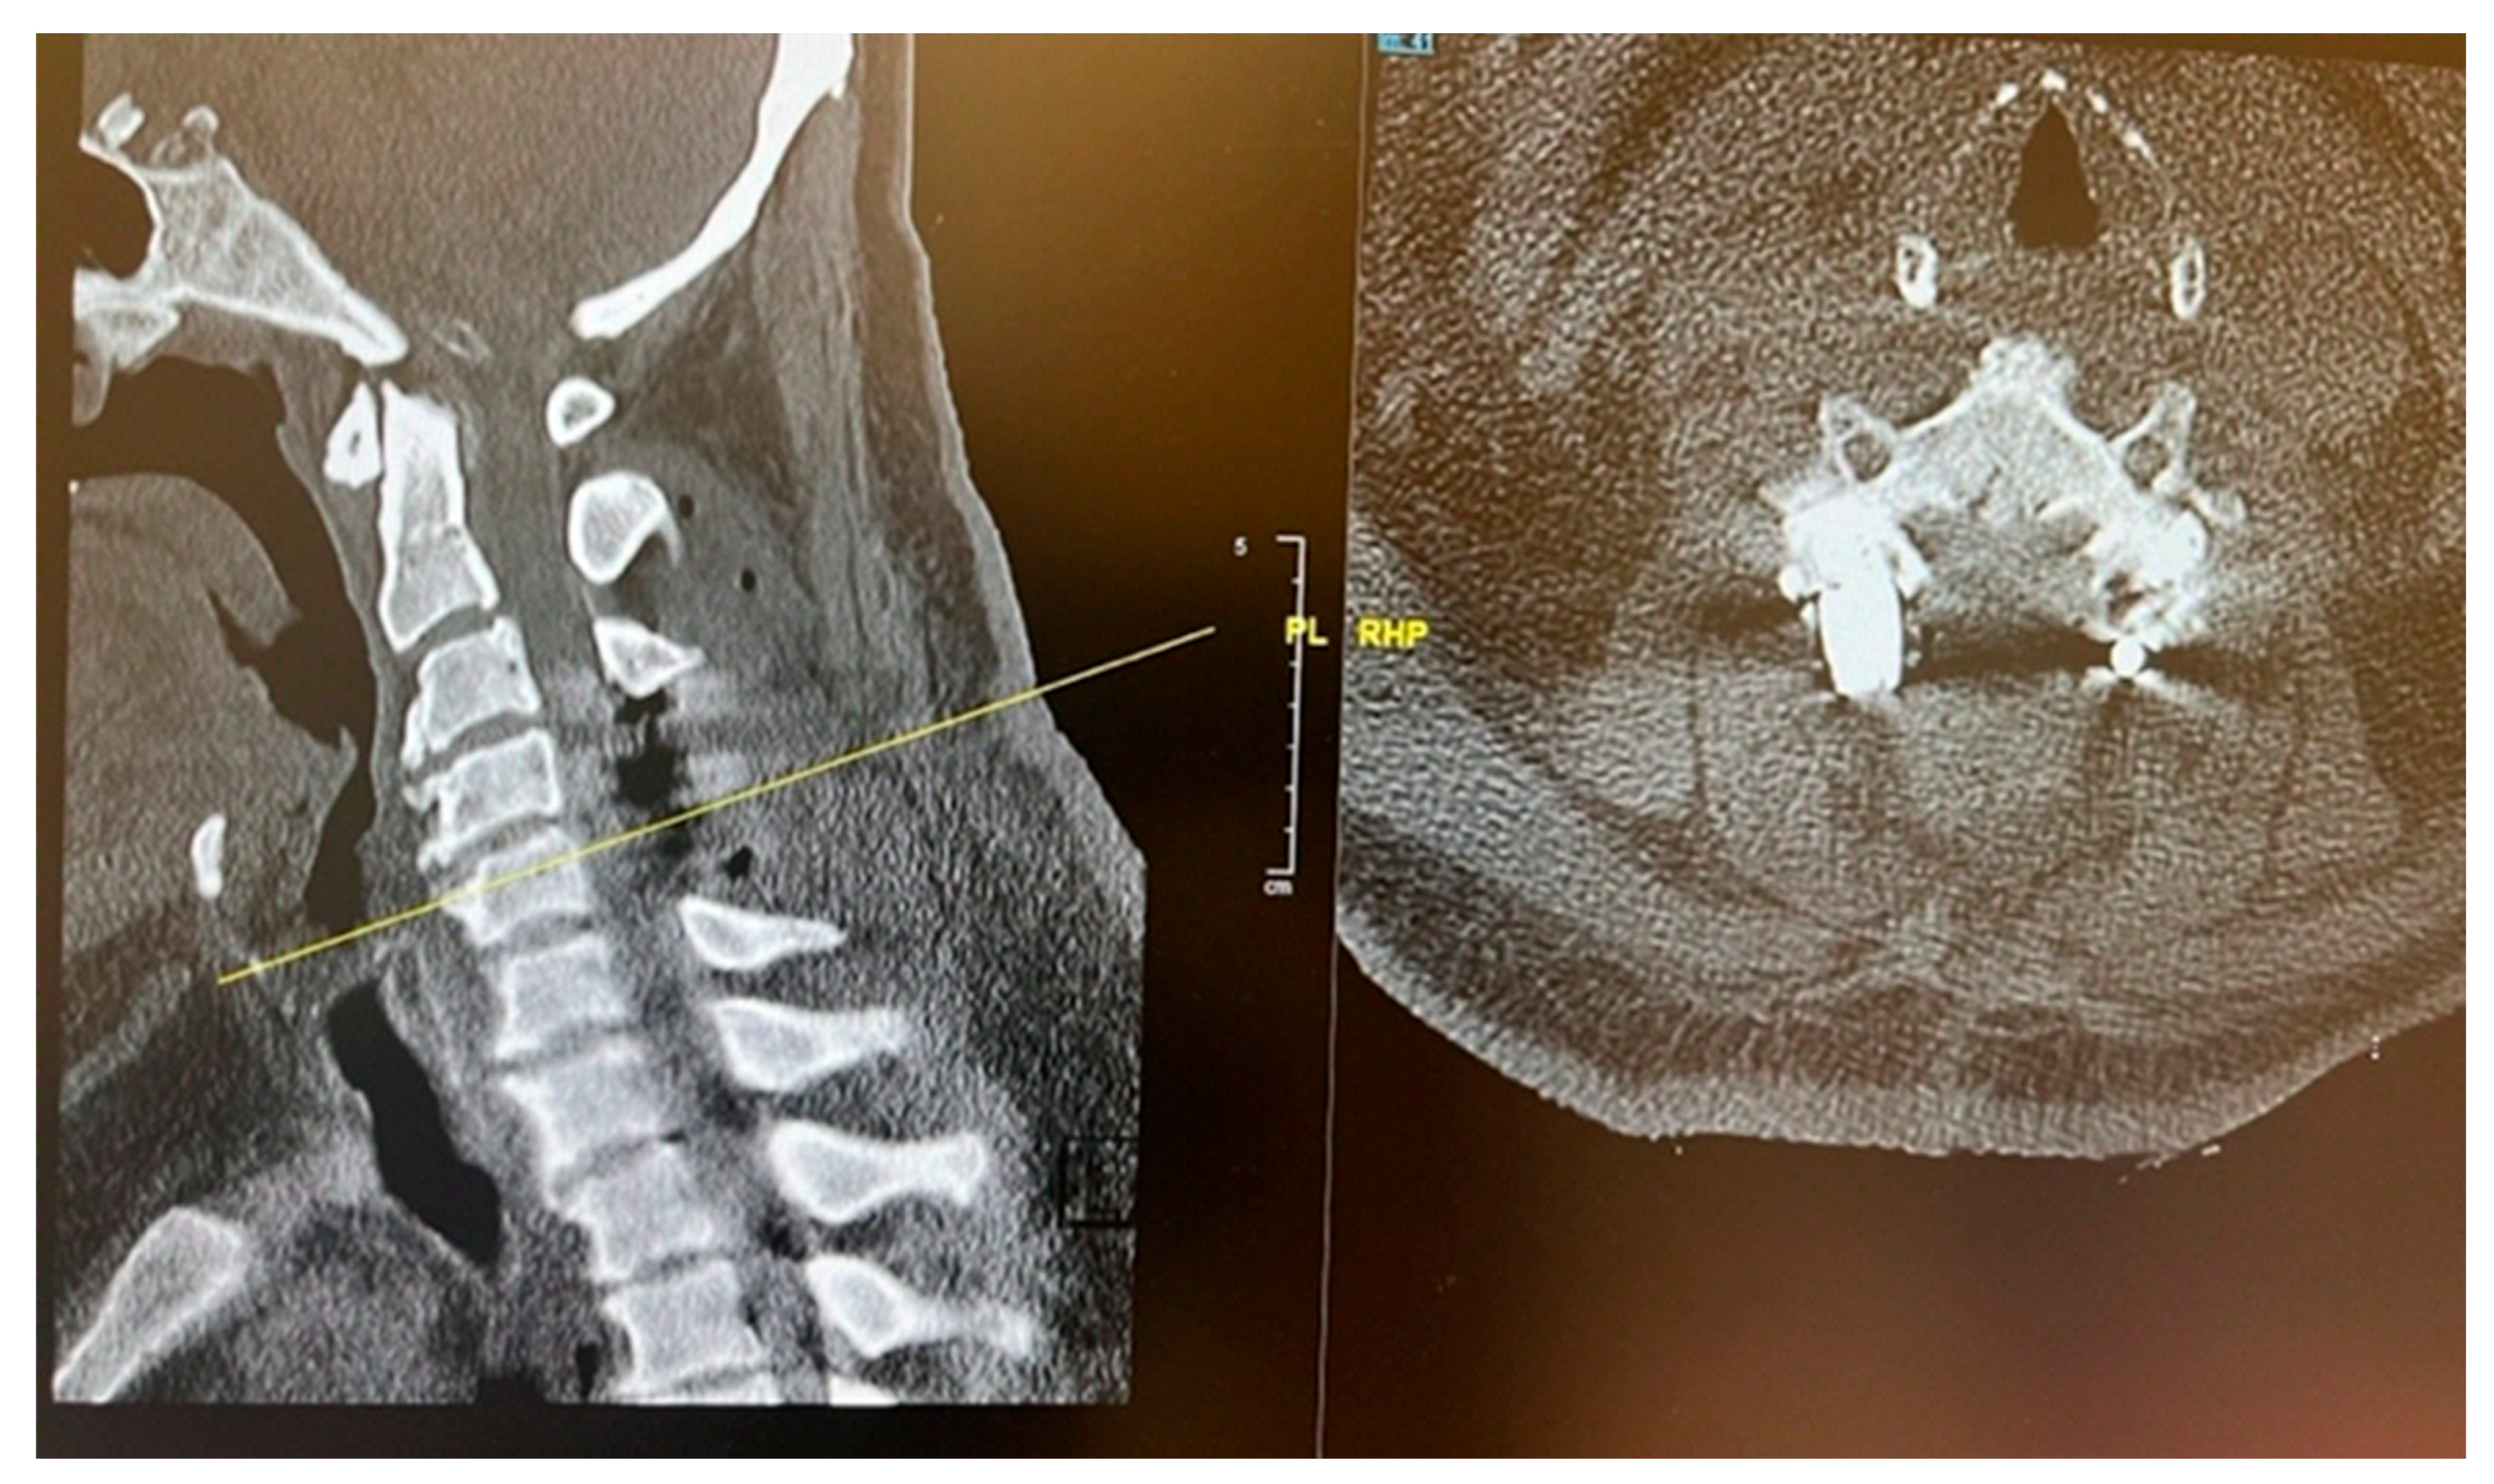
CT C Spine: Ossification of the right-side ligamentum flavum noted at C4/C5 and C5/C6 levels, with associated spinal canal narrowing, more severe at C4/C5.
Figure 1.
Preoperative sagittal (A) and axial (B) CT cervical spine showing calcific deposit at the cervical 4 level causing spinal stenosis.
Figure 1.
Preoperative sagittal (A) and axial (B) CT cervical spine showing calcific deposit at the cervical 4 level causing spinal stenosis.
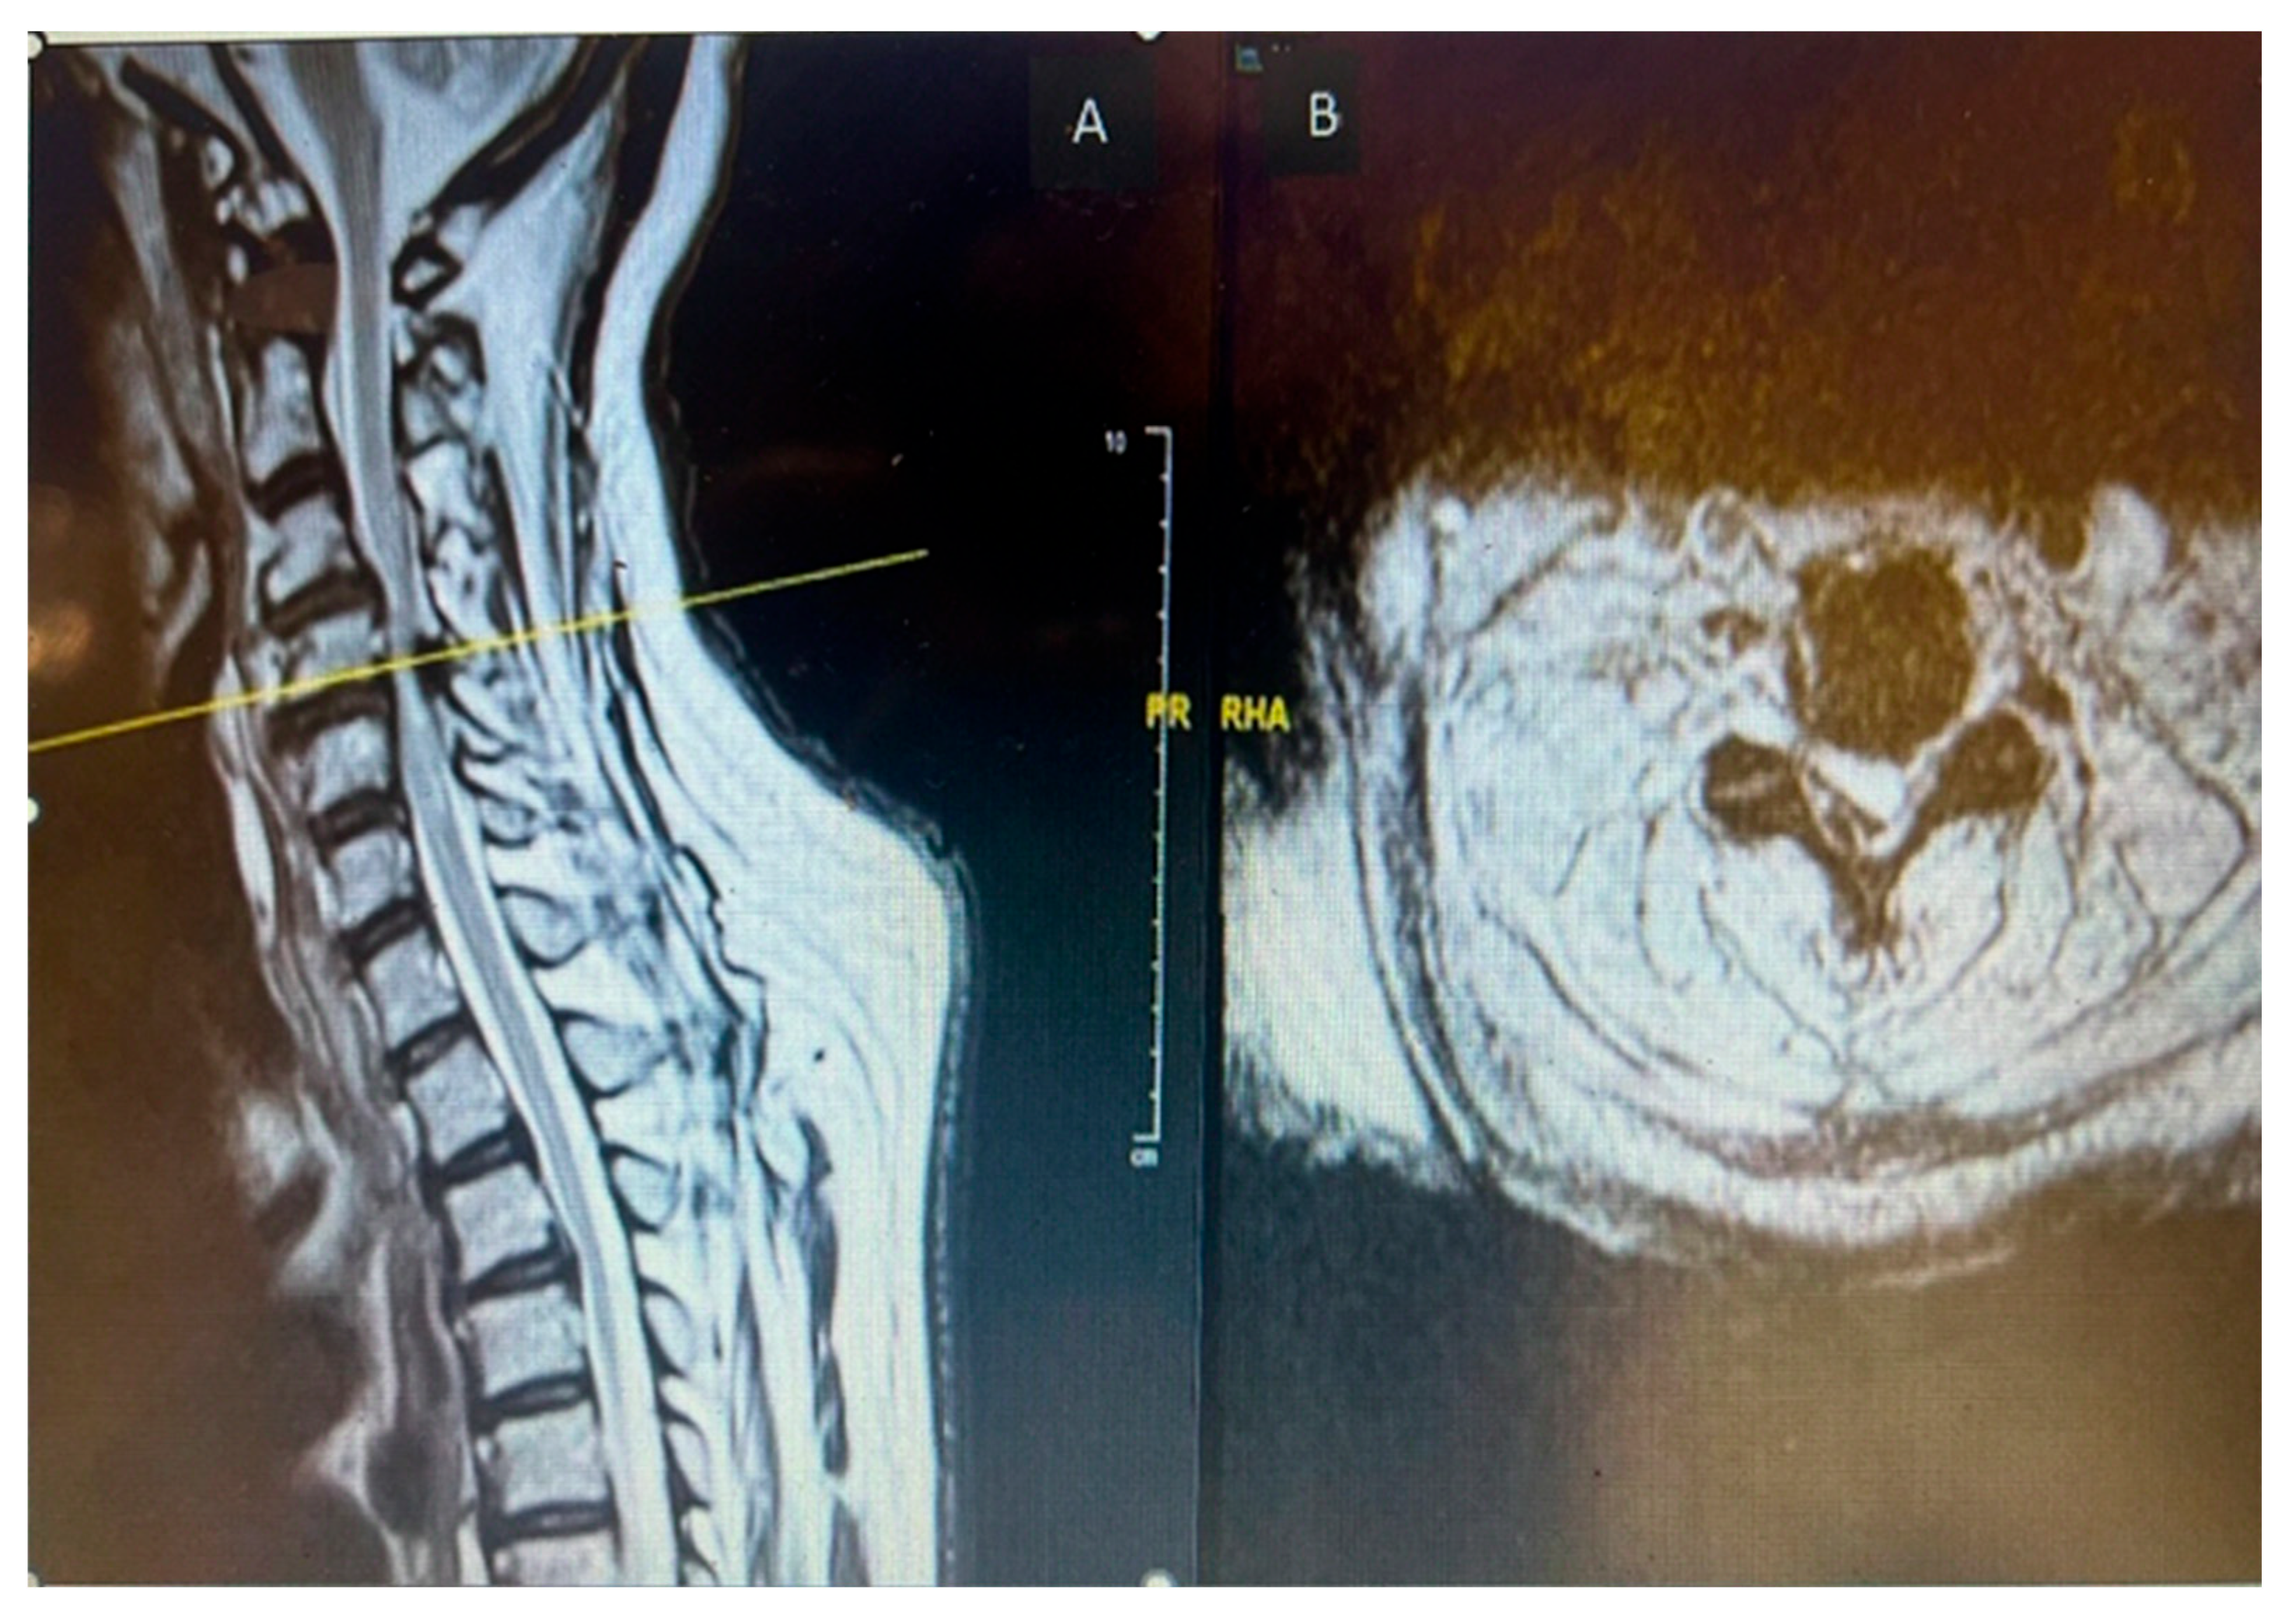
MRI Whole Spine: Severe central canal narrowing causing compression of the spinal cord with myelomalacia at C4/C5 level, with mild retrolisthesis at C4 over C5, thickening of the posterior longitudinal ligament, and ligamentum flavum hypertrophy. Various degrees of central canal narrowing and neural foraminal narrowing were noted at C3/C4, C4/C5, C5/C6, and C6/C7 levels, with additional findings including a small synovial cyst at C6/C7.
Figure 2.
Preoperative MRI cervical spine T2 weighted sagittal (A) and axial (B) showing cord compression posteriorly with cord signal change at cervical 4 level.
Figure 2.
Preoperative MRI cervical spine T2 weighted sagittal (A) and axial (B) showing cord compression posteriorly with cord signal change at cervical 4 level.
2.1.2. Treatment and Management
The patient and her family were informed about her clinical condition and the MRI findings. Surgical management was planned, involving posterior cervical instrumentation from C3 to C5, along with decompressive laminectomy at the C4 and C5 levels. Preoperative intravenous antibiotics were administered. The posterior cervical spine was surgically exposed, and central decompression was achieved through complete laminectomy of C4 and C5. Lateral mass screw fixation was carried out from C3 to C5.
During the procedure, chalky white deposits were observed in the right-sided epidural space at the level of C4, overlying the ligamentum flavum. These deposits were removed in a piecemeal fashion, decompressing the spinal cord. Specimens were collected and sent for histopathological examination and culture. Baseline neuromonitoring showed weak somatosensory evoked potentials (SSEP) and motor evoked potentials (MEP) in both the upper and lower limbs, with no signs of nerve irritation detected on electromyography (EMG).
2.1.3. Postoperative Findings
The chalky white deposits were sent for histopathological analysis; however, they were preserved in formalin, which precluded crystal analysis. Cultures taken from the epidural space showed no bacterial growth. Postoperatively, the patient's serum uric acid level was elevated at 445 µmol/L (normal range: 150–370 µmol/L). She was referred to rheumatology for further management of hyperuricemia and commenced postoperative rehabilitation, which led to noticeable improvement in both upper and lower limb weakness. A Dual Energy CT (DECT) scan of the cervical spine was performed to detect urate crystal deposition. However, the findings were inconclusive, likely due to the extensive removal of tophaceous material and thorough decompression during surgery.
Figure 3.
Intraoperative image showing chalky white deposit over the ligamentum flavum at.cervical 4 level.
Figure 3.
Intraoperative image showing chalky white deposit over the ligamentum flavum at.cervical 4 level.
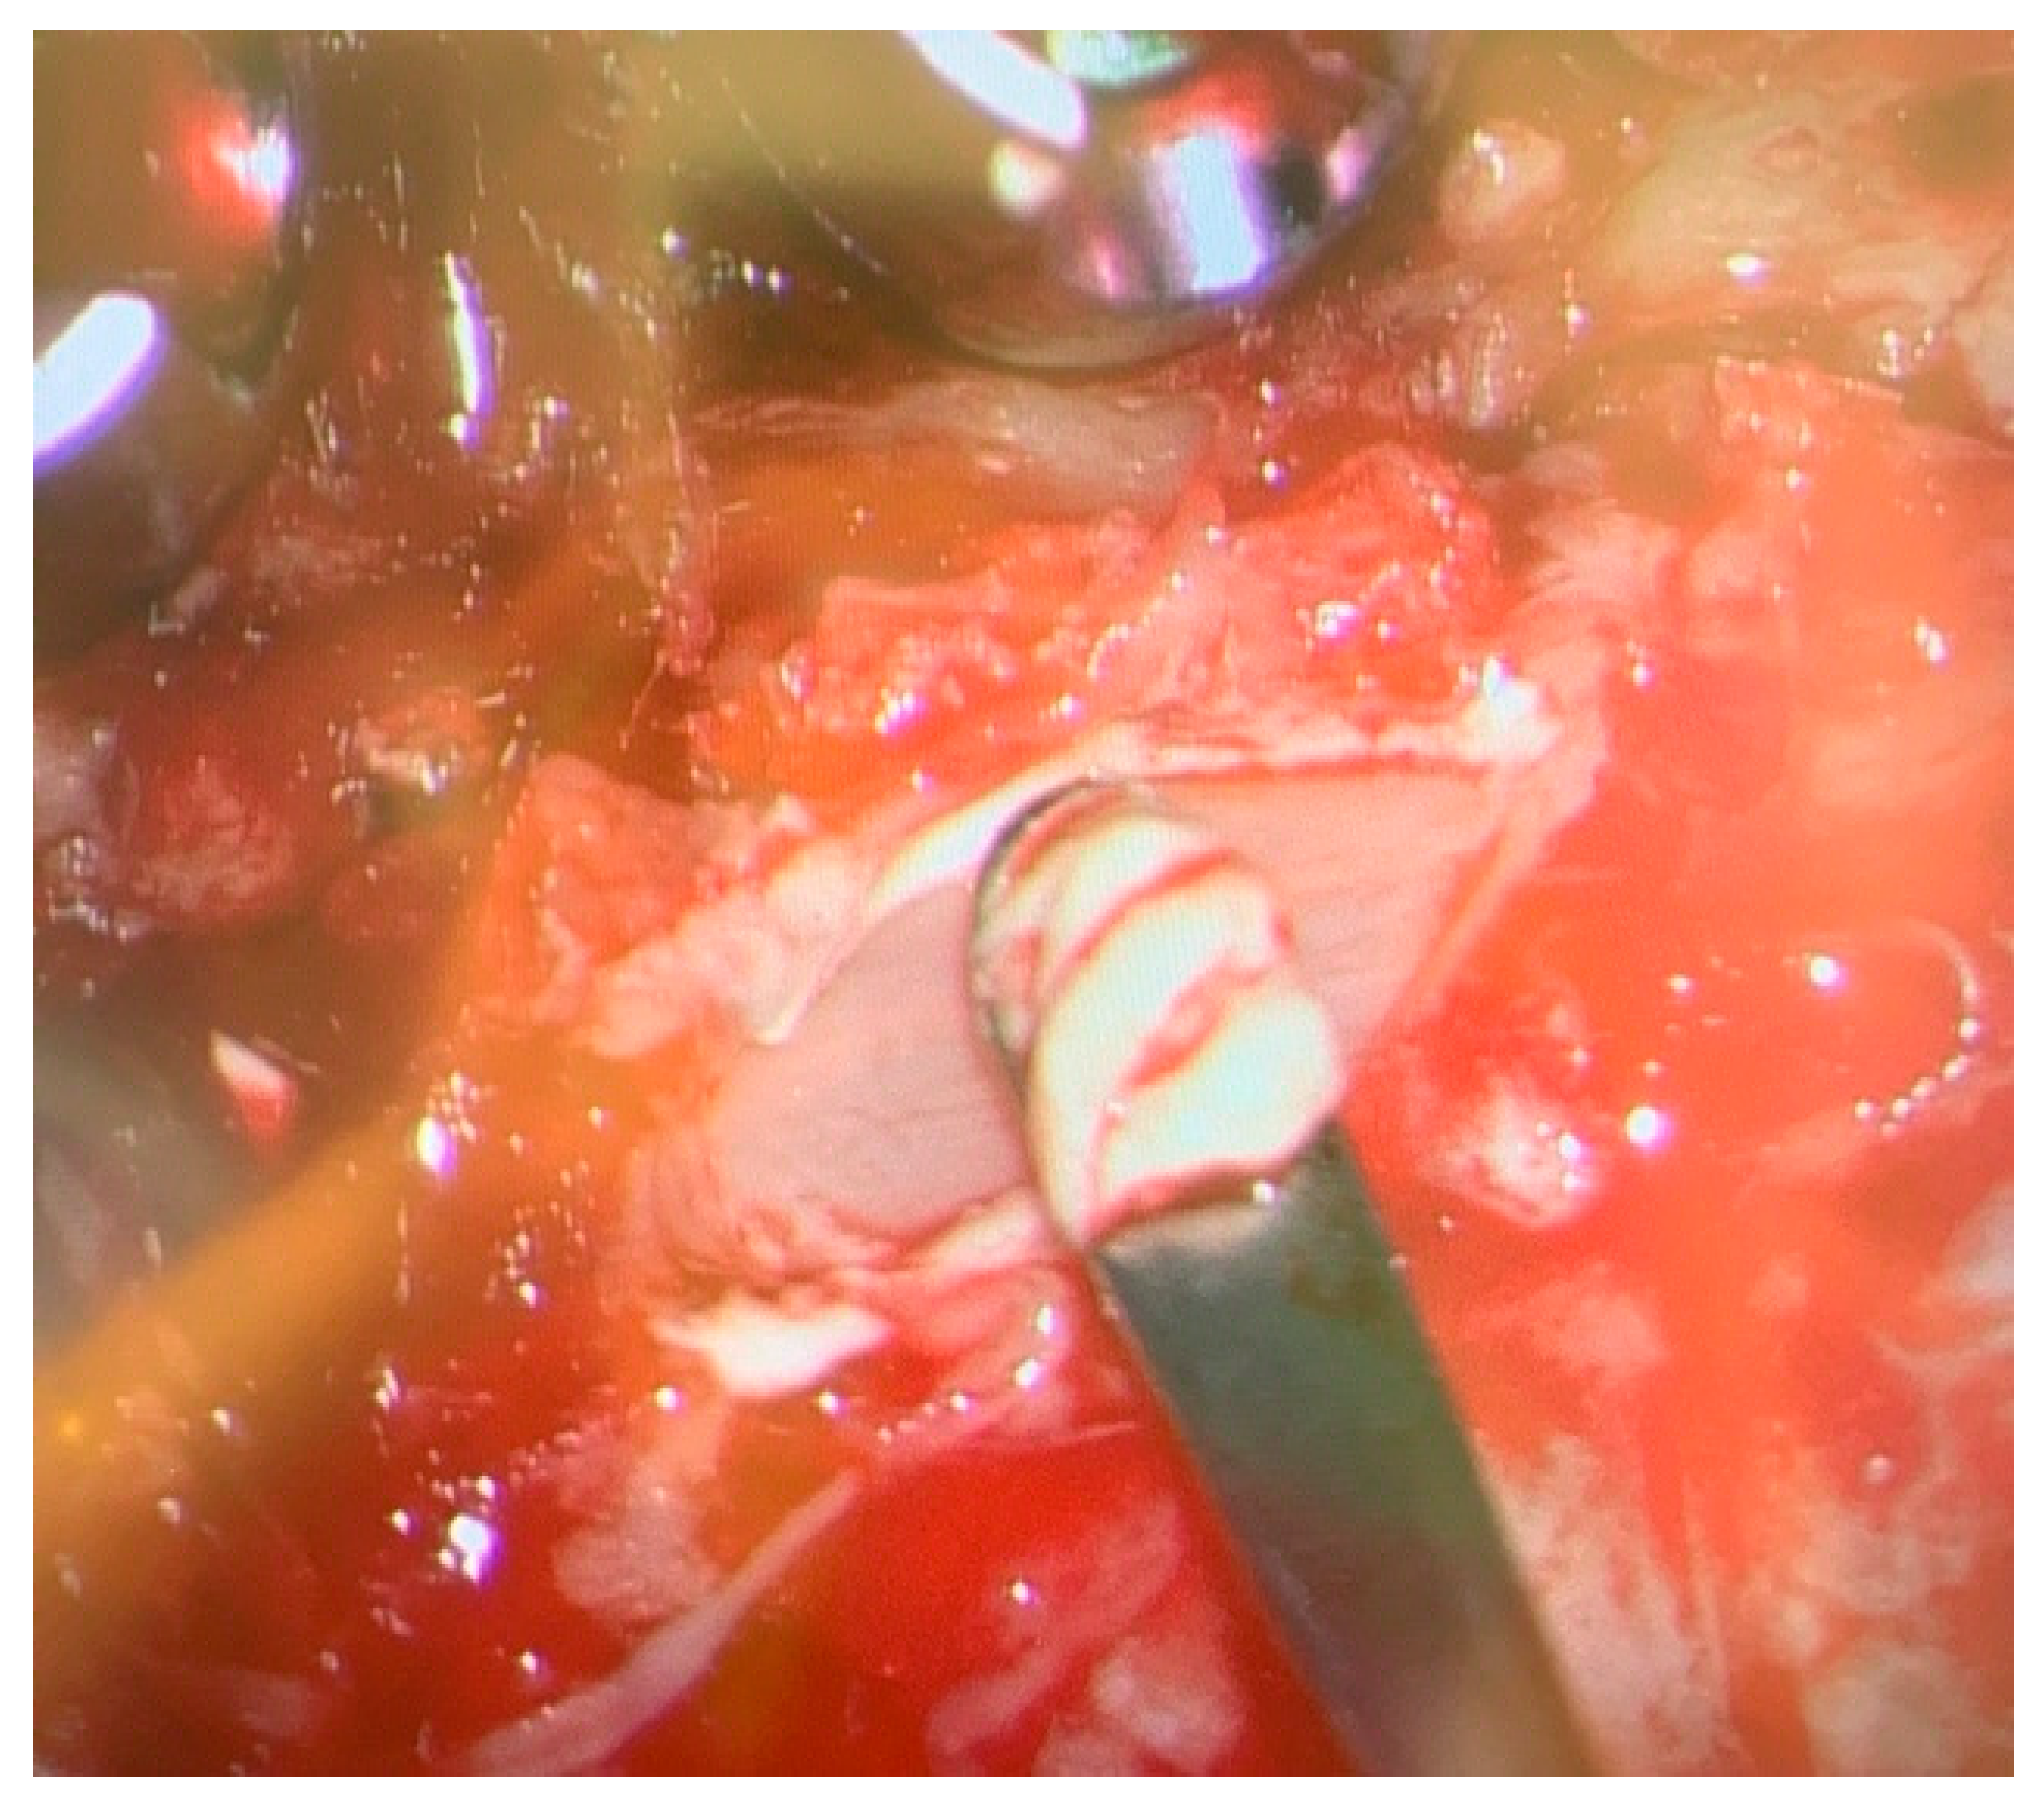
Figure 4.
Post operative dual energy CT scan of cervical spine showing.absence green color urate Crystals at the site of the surgery due to removal of Gout tophi.
Figure 4.
Post operative dual energy CT scan of cervical spine showing.absence green color urate Crystals at the site of the surgery due to removal of Gout tophi.
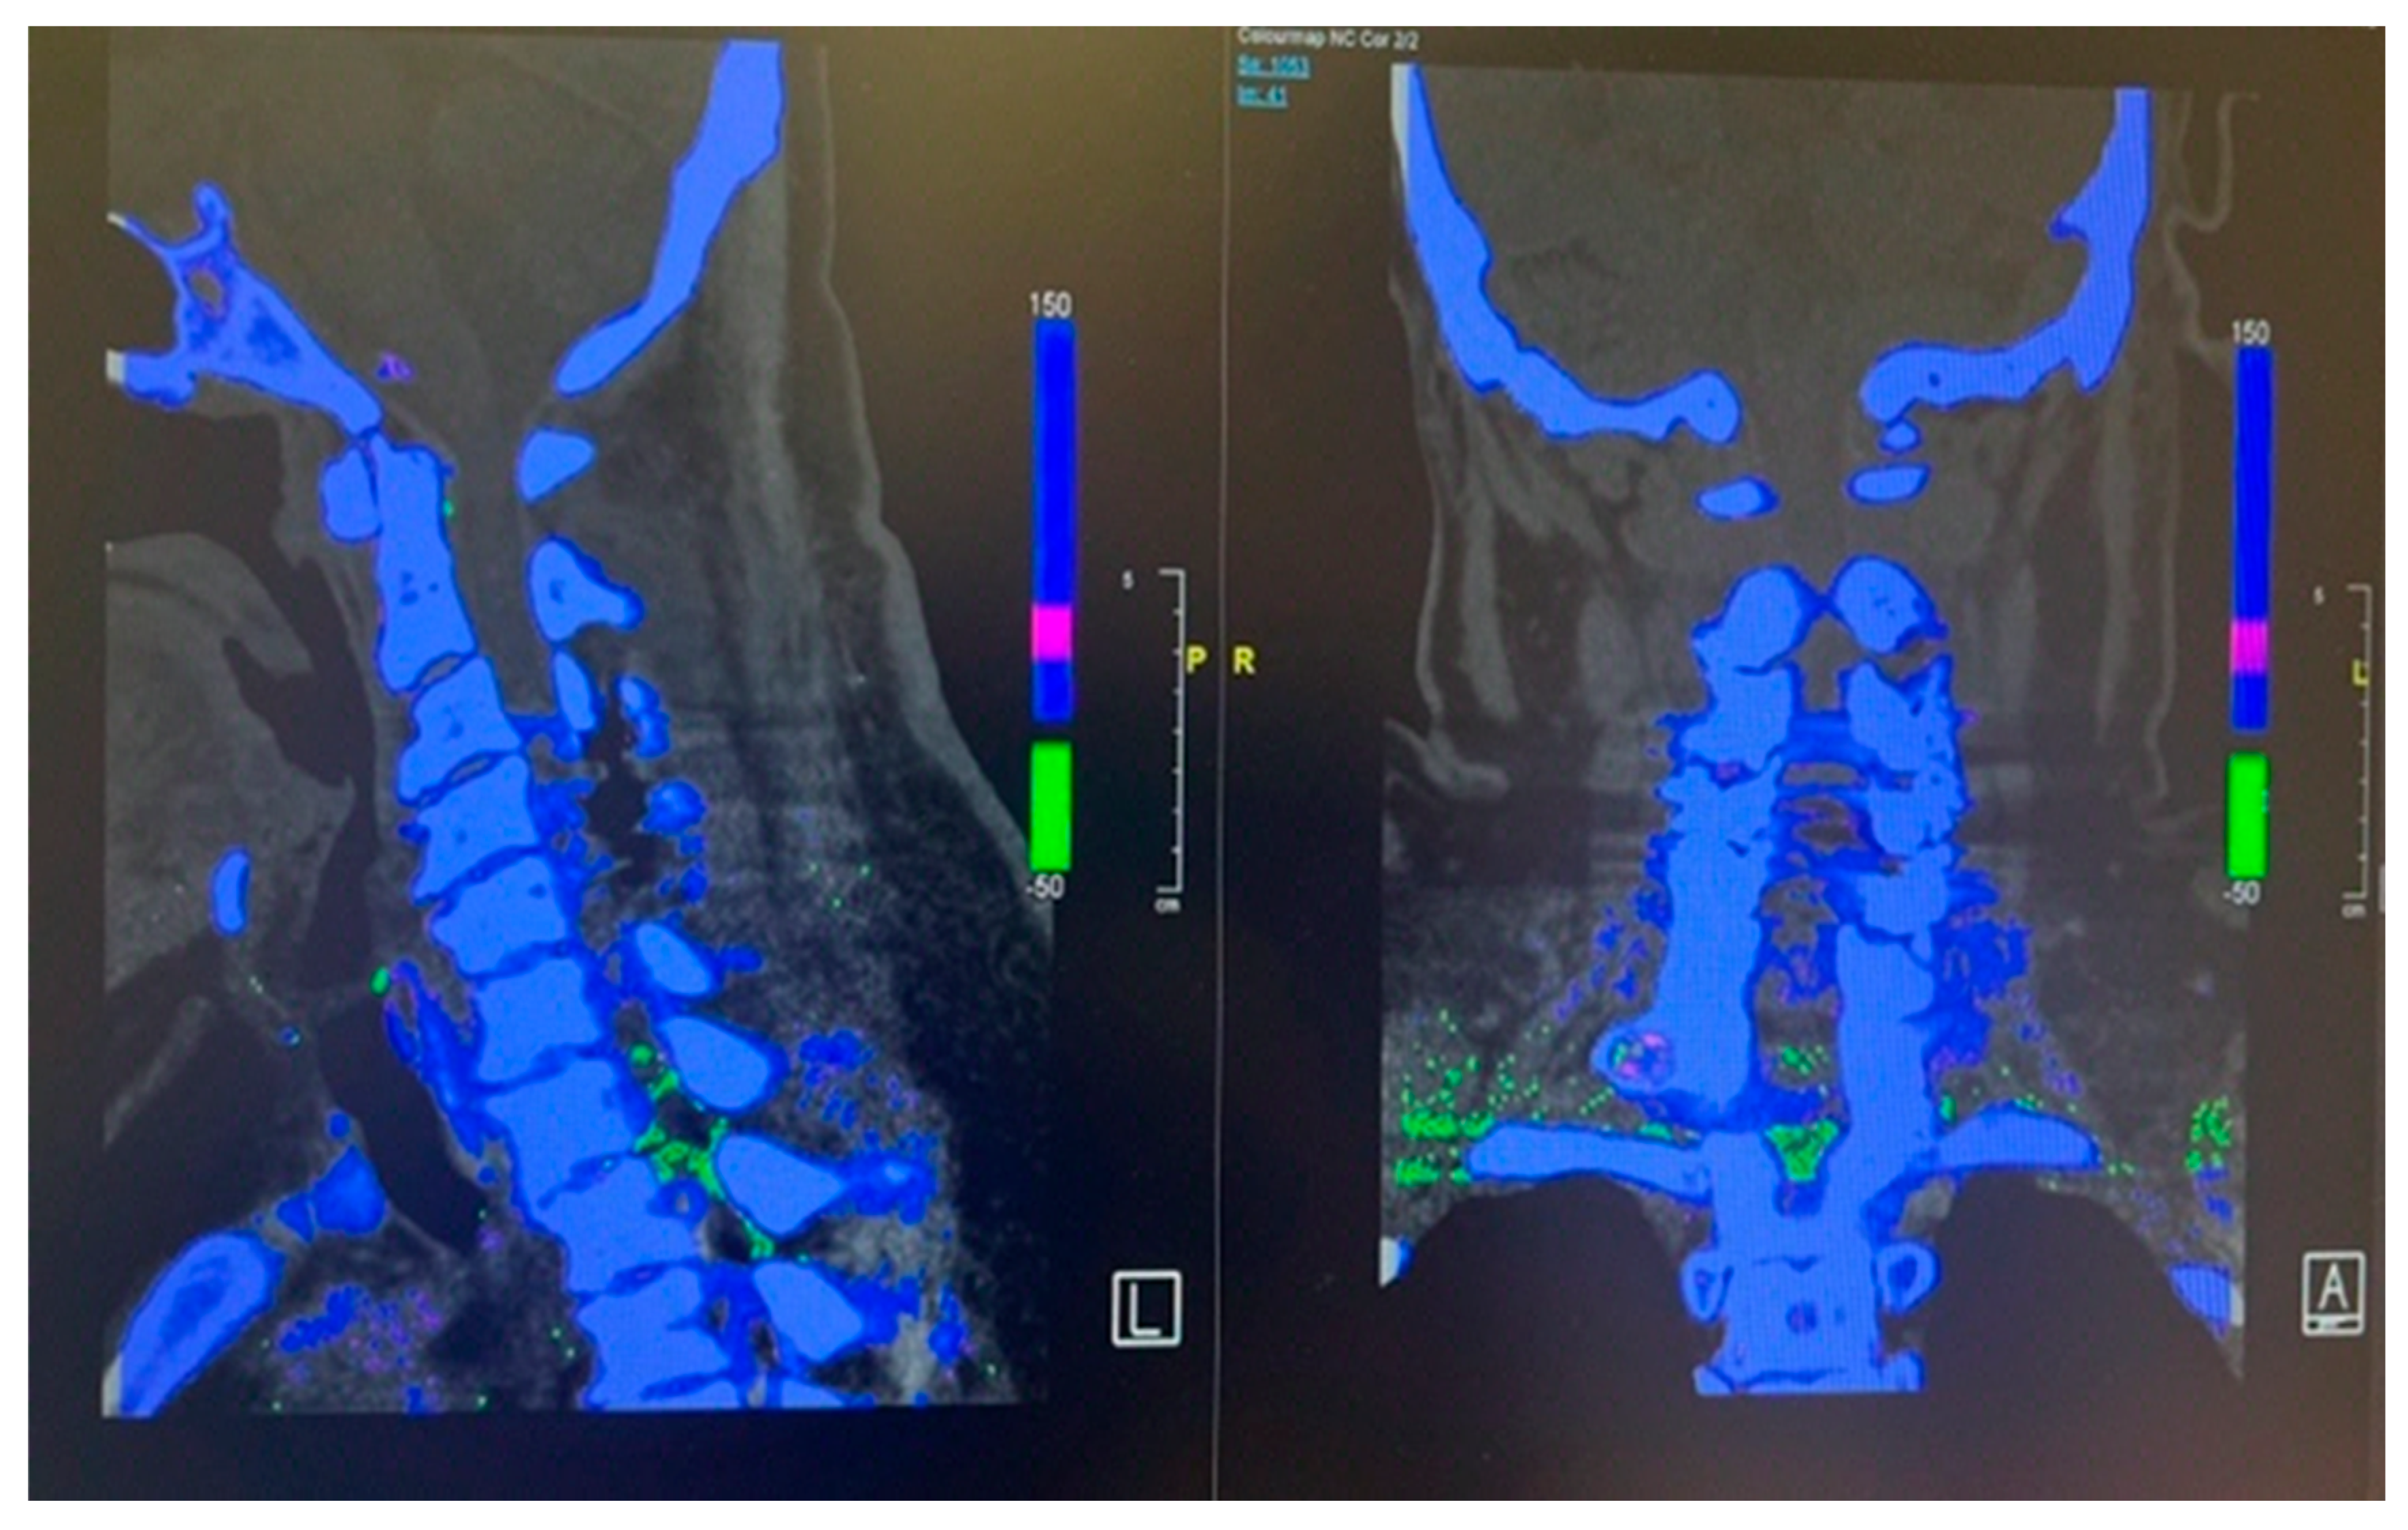
Figure 5.
Post operative CT scan of the cervical spine showing complete decompression at the cervical 4 and 5 levels.
Figure 5.
Post operative CT scan of the cervical spine showing complete decompression at the cervical 4 and 5 levels.
2.2. Case 2
This 68 years old male having past medical history of Obesity, Diabetes Mellitus, hypertension, chronic kidney disease 3b, Knee osteoarthritis, Psoriasis, ureteric calculus and right-side Meralgia paresthetica presented to emergency department with the complaint of 3 days history of abdominal pain radiating to towards right lower back worst on bending forward. There was associated foul smelling urine without fever, frequency, dysuria and hematuria. On examination patient was vitally stable, having generalized psoriatic rashes with negative bilateral negative renal punches and normal testicular examination. Laboratory tests showed flat total white cells count with Neutrophil count of 7.10. Renal functions test was unremarkable. Urine dipstick result was suggestive of UTI therefore urine culture and sensitivity test were sent. X Ray KUB revealed 0.5 cm radio density along right hemi pelvis likely a phlebolith as seen before on prior CT with no calculus along the urinary tract. Degenerative changes were reported in lumbar spine and left pelvis on X Ray Lumbar spine, pelvis and hip joints. Patient was discharged from emergency with Orthopedics and spine follow up.
2 days after discharge from emergency, patient again presented to the emergency department with the complaint of right iliac fossa pain for 1 day, therefore after relieving pain was referred to general surgery. CT abdomen and pelvis was ordered by General surgery team reported left stage horn calculus and left upper ureter inflammatory urethritis, with possible secondary minimal left pyelonephritis. He was referred to Urology for further management. Subsequently, patient developed right lower limb pain along entire right thigh, posterior leg and both surfaces of right foot. There was also associated bilateral knee pain. There was 2/5 power in bilateral L2 and L3 myotomes limited by pain with the rest neurological examinations unremarkable. The patient was referred to Hip and Knee and ortho spine. On suggestion of spine team, the primary team arranged MRI Lumbar spine with contrast and sent inflammatory markers. MRI report revealed fluid within the right L5/S1 and edema in the adjacent L5/S1 vertebral bodies suspicious for L5/S1 spondylodiscitis with osteomyelitis involving right side more than left. Other than this at the same level L5/S1 posterior annular fissure and posterior disc protrusion causing moderate right exit foraminal narrowing abutting the right L5 exiting nerve root as shown in the Figure 6 (A). Additionally, right sided facet joint synovial cyst at T11/12 was noted having size of 12 mm causing severe right sided sub articular stenosis compressing right T12 descending nerve root and moderate right exit foraminal narrowing abutting the right T11 exiting nerve root as shown in the Figure 8 (A).
Inflammatory markers showed raised CRP level of 292. Meanwhile Hip and Knee team advised X Rays both knees reported as bilateral osteoarthritis with bilateral moderate to large suprapatellar effusion. Later on, they did bilateral knee joints aspiration and sent aspirate for laboratory evaluation which showed raised nucleated cells (35415), neutrophils (92%) and negatively birefringent crystals Based on knee joint aspiration result the patient was referred to Rheumatology for further assessment and serum Uric acid was sent as per their suggestion showed raised level of 532. Patient was counselled for image guided biopsy of the reported levels on MRI spine in order to exclude infective spondylodiscitis and septic arthritis but due to patient reluctance it was not done. While keeping in mind the patient clinical, radiological and lab tests picture dual energy CT whole spine was done reported as Urate deposits at the T10/11 and lower lumbar discs especially at L5/S1. Green pixelation in the rest of the thoracolumbar spine appears to represent artifact rather than further urate deposits. In particular, there does not appear to be urate deposits at the region of right the right T11/12 facet joint as shown in the Figure 7 (A) and (B). In order to start a definitive treatment, image guided biopsy was discussed with the patient but not done due to patient reluctance. Meanwhile multidisciplinary meeting was held between Infectious disease and Rheumatology teams while keeping in mind the differential diagnosis and a conclusion was made to treat the patient for Gout. Rheumatology team started the patient on 3 weeks tapering dose of prednisolone followed by 5 mg OD dose for few months for Gout prophylaxis. He was also started on Allopurinol an anti-Gout medication with a dose of 50 mg OD. Later on, Patient was transferred under the care of rehabilitation team. Patient CRP and serum Uric acid were trended over the time and showed progressive declined in their levels along with clinical improvement. Follow up MRI lumbar and thoracic spine revealed improvement in the form of slight signals improvement at L5/S1 shown in Figure 5 (B) and disappearance of right T10/11 facet cyst shown in the Figure 8 (B). After completing rehabilitation, the patient was discharged to the home with the follow up schedule with different concerned specialties.
Figure 6.
MRI Lumbar spine short tau inversion recovery sequency sagittal views first MRI before starting anti gout medications (A) and follow up MRI after starting anti gout medications (B) showing spondylodiscitis at the level of lumbar 5, sacral 1 level.
Figure 6.
MRI Lumbar spine short tau inversion recovery sequency sagittal views first MRI before starting anti gout medications (A) and follow up MRI after starting anti gout medications (B) showing spondylodiscitis at the level of lumbar 5, sacral 1 level.
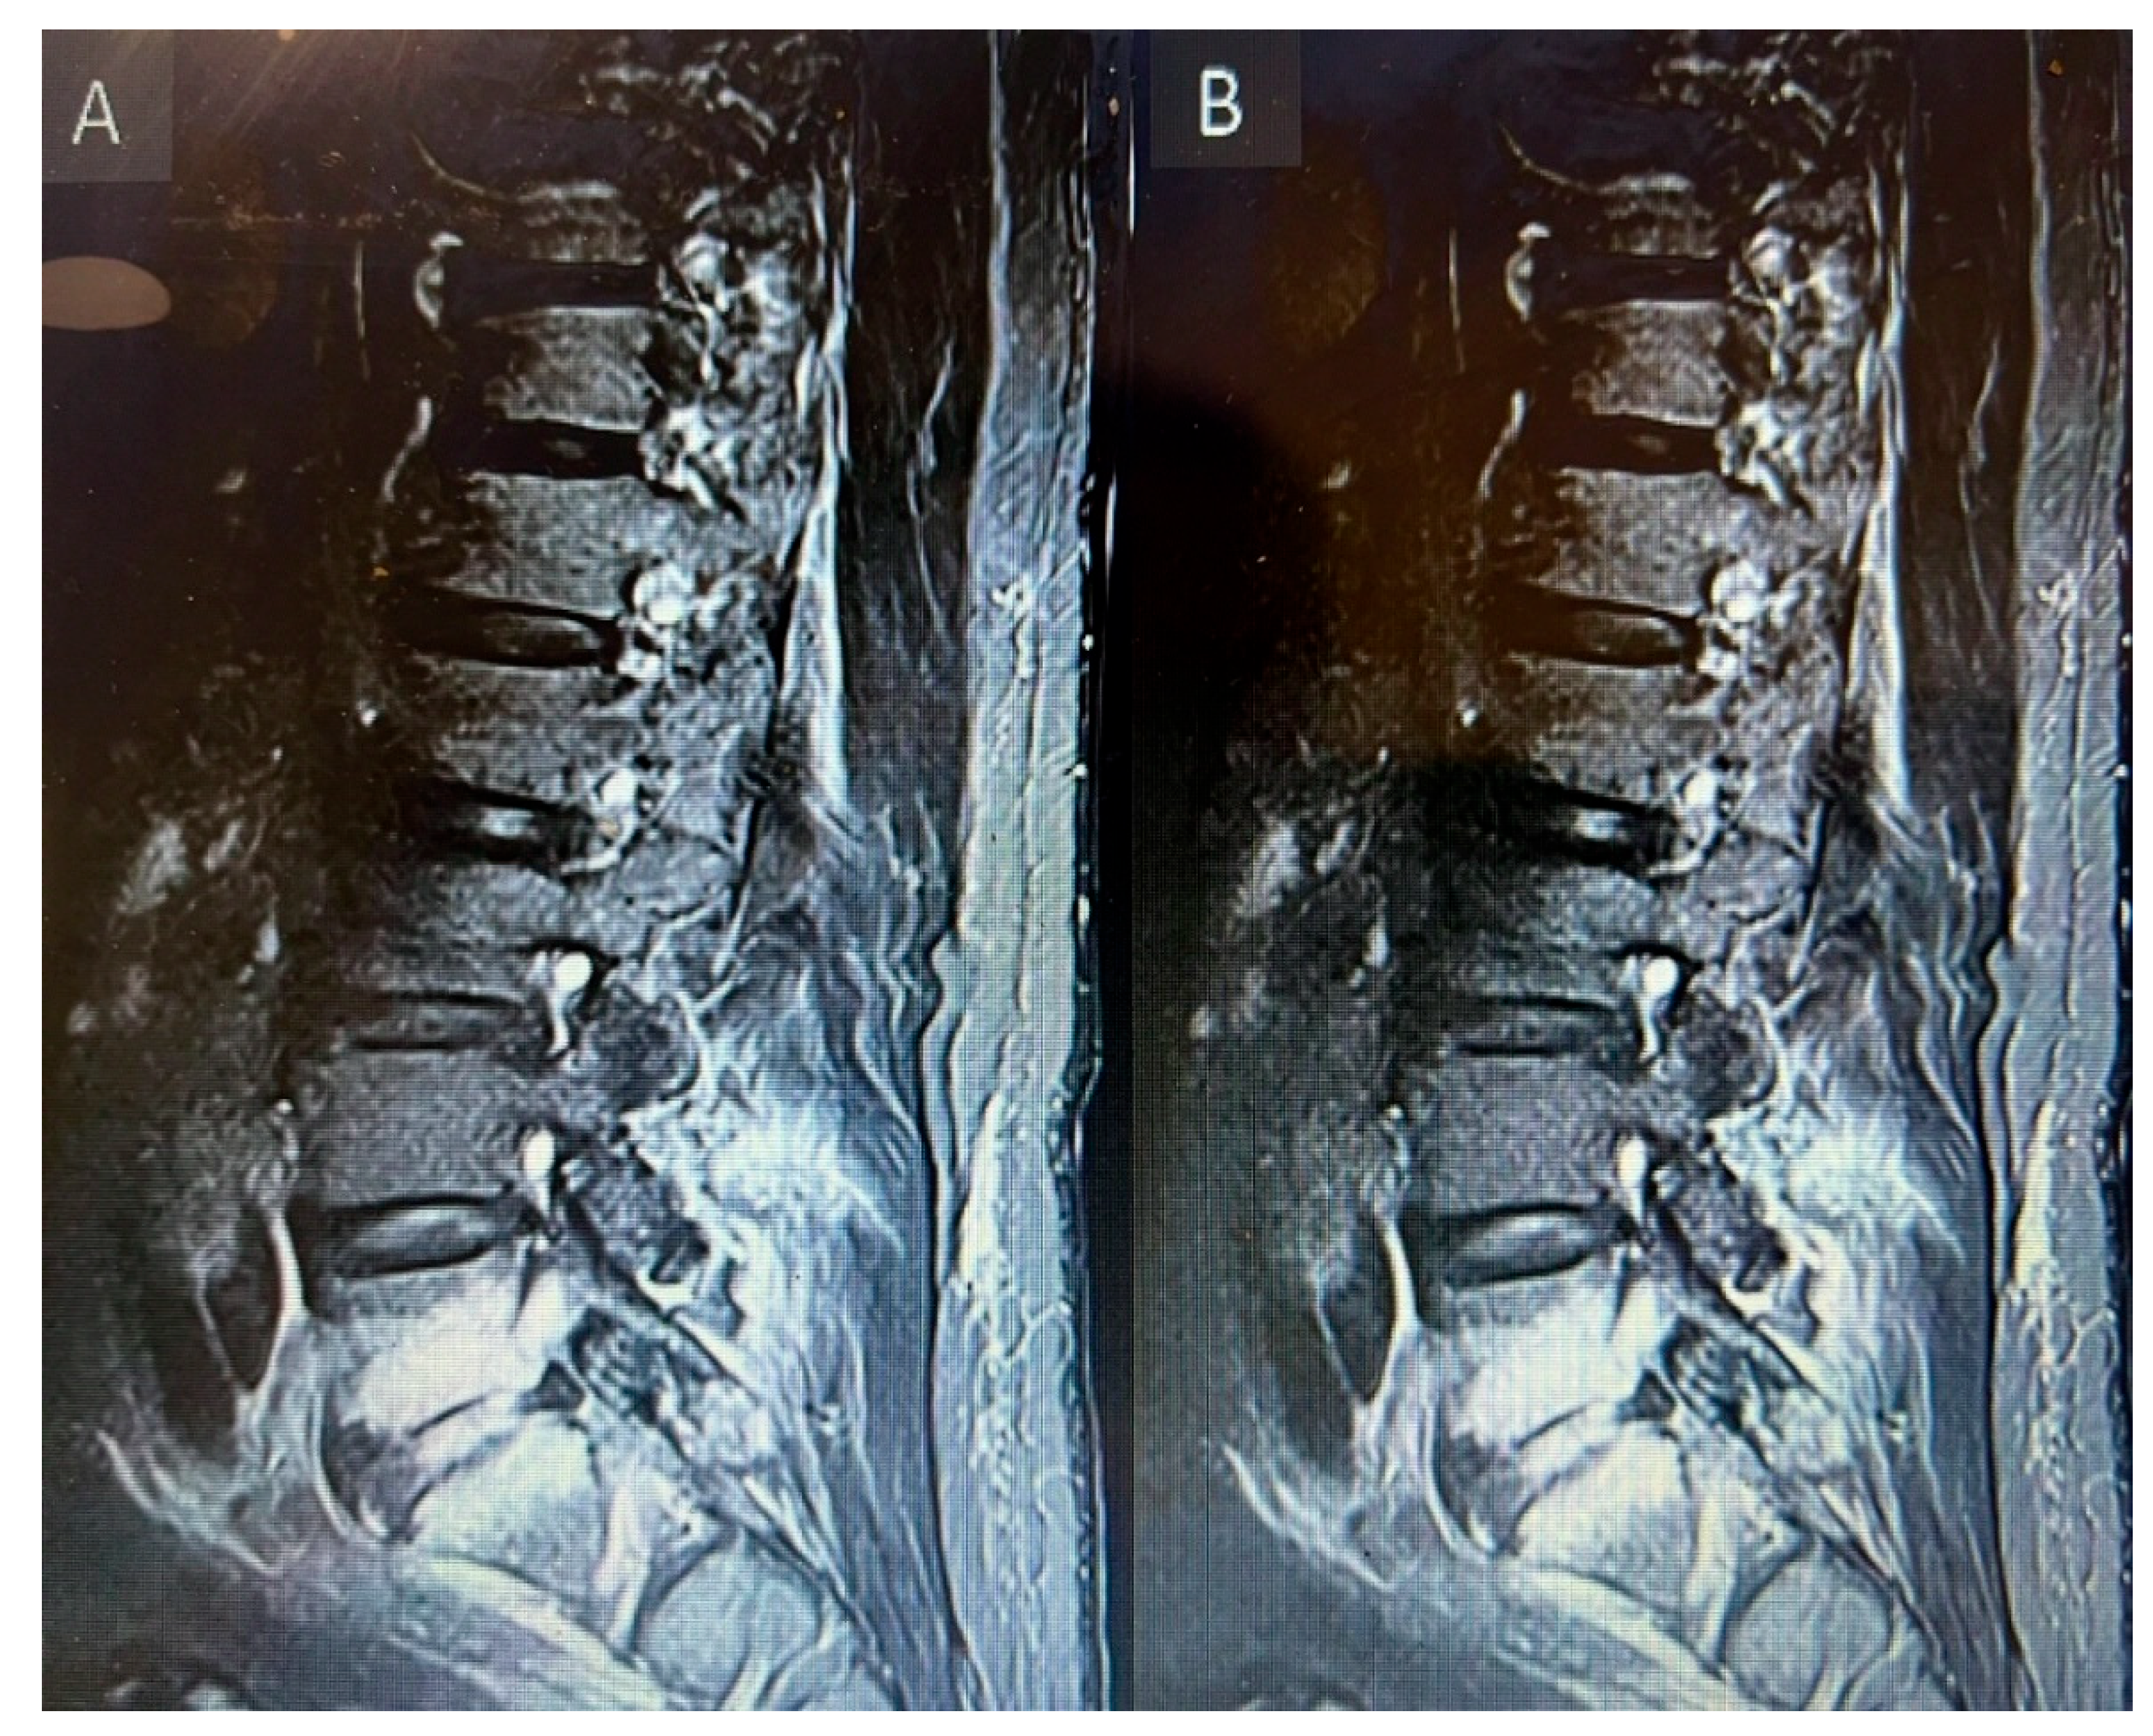
Figure 7.
Dual energy CT of whole spine sagittal view (A) and coronal view (B) showing Urate crystal deposits at the levels of T10/11 and L5/S1. The rest of the green pixelation is an artifact rather than urate crystals.
Figure 7.
Dual energy CT of whole spine sagittal view (A) and coronal view (B) showing Urate crystal deposits at the levels of T10/11 and L5/S1. The rest of the green pixelation is an artifact rather than urate crystals.
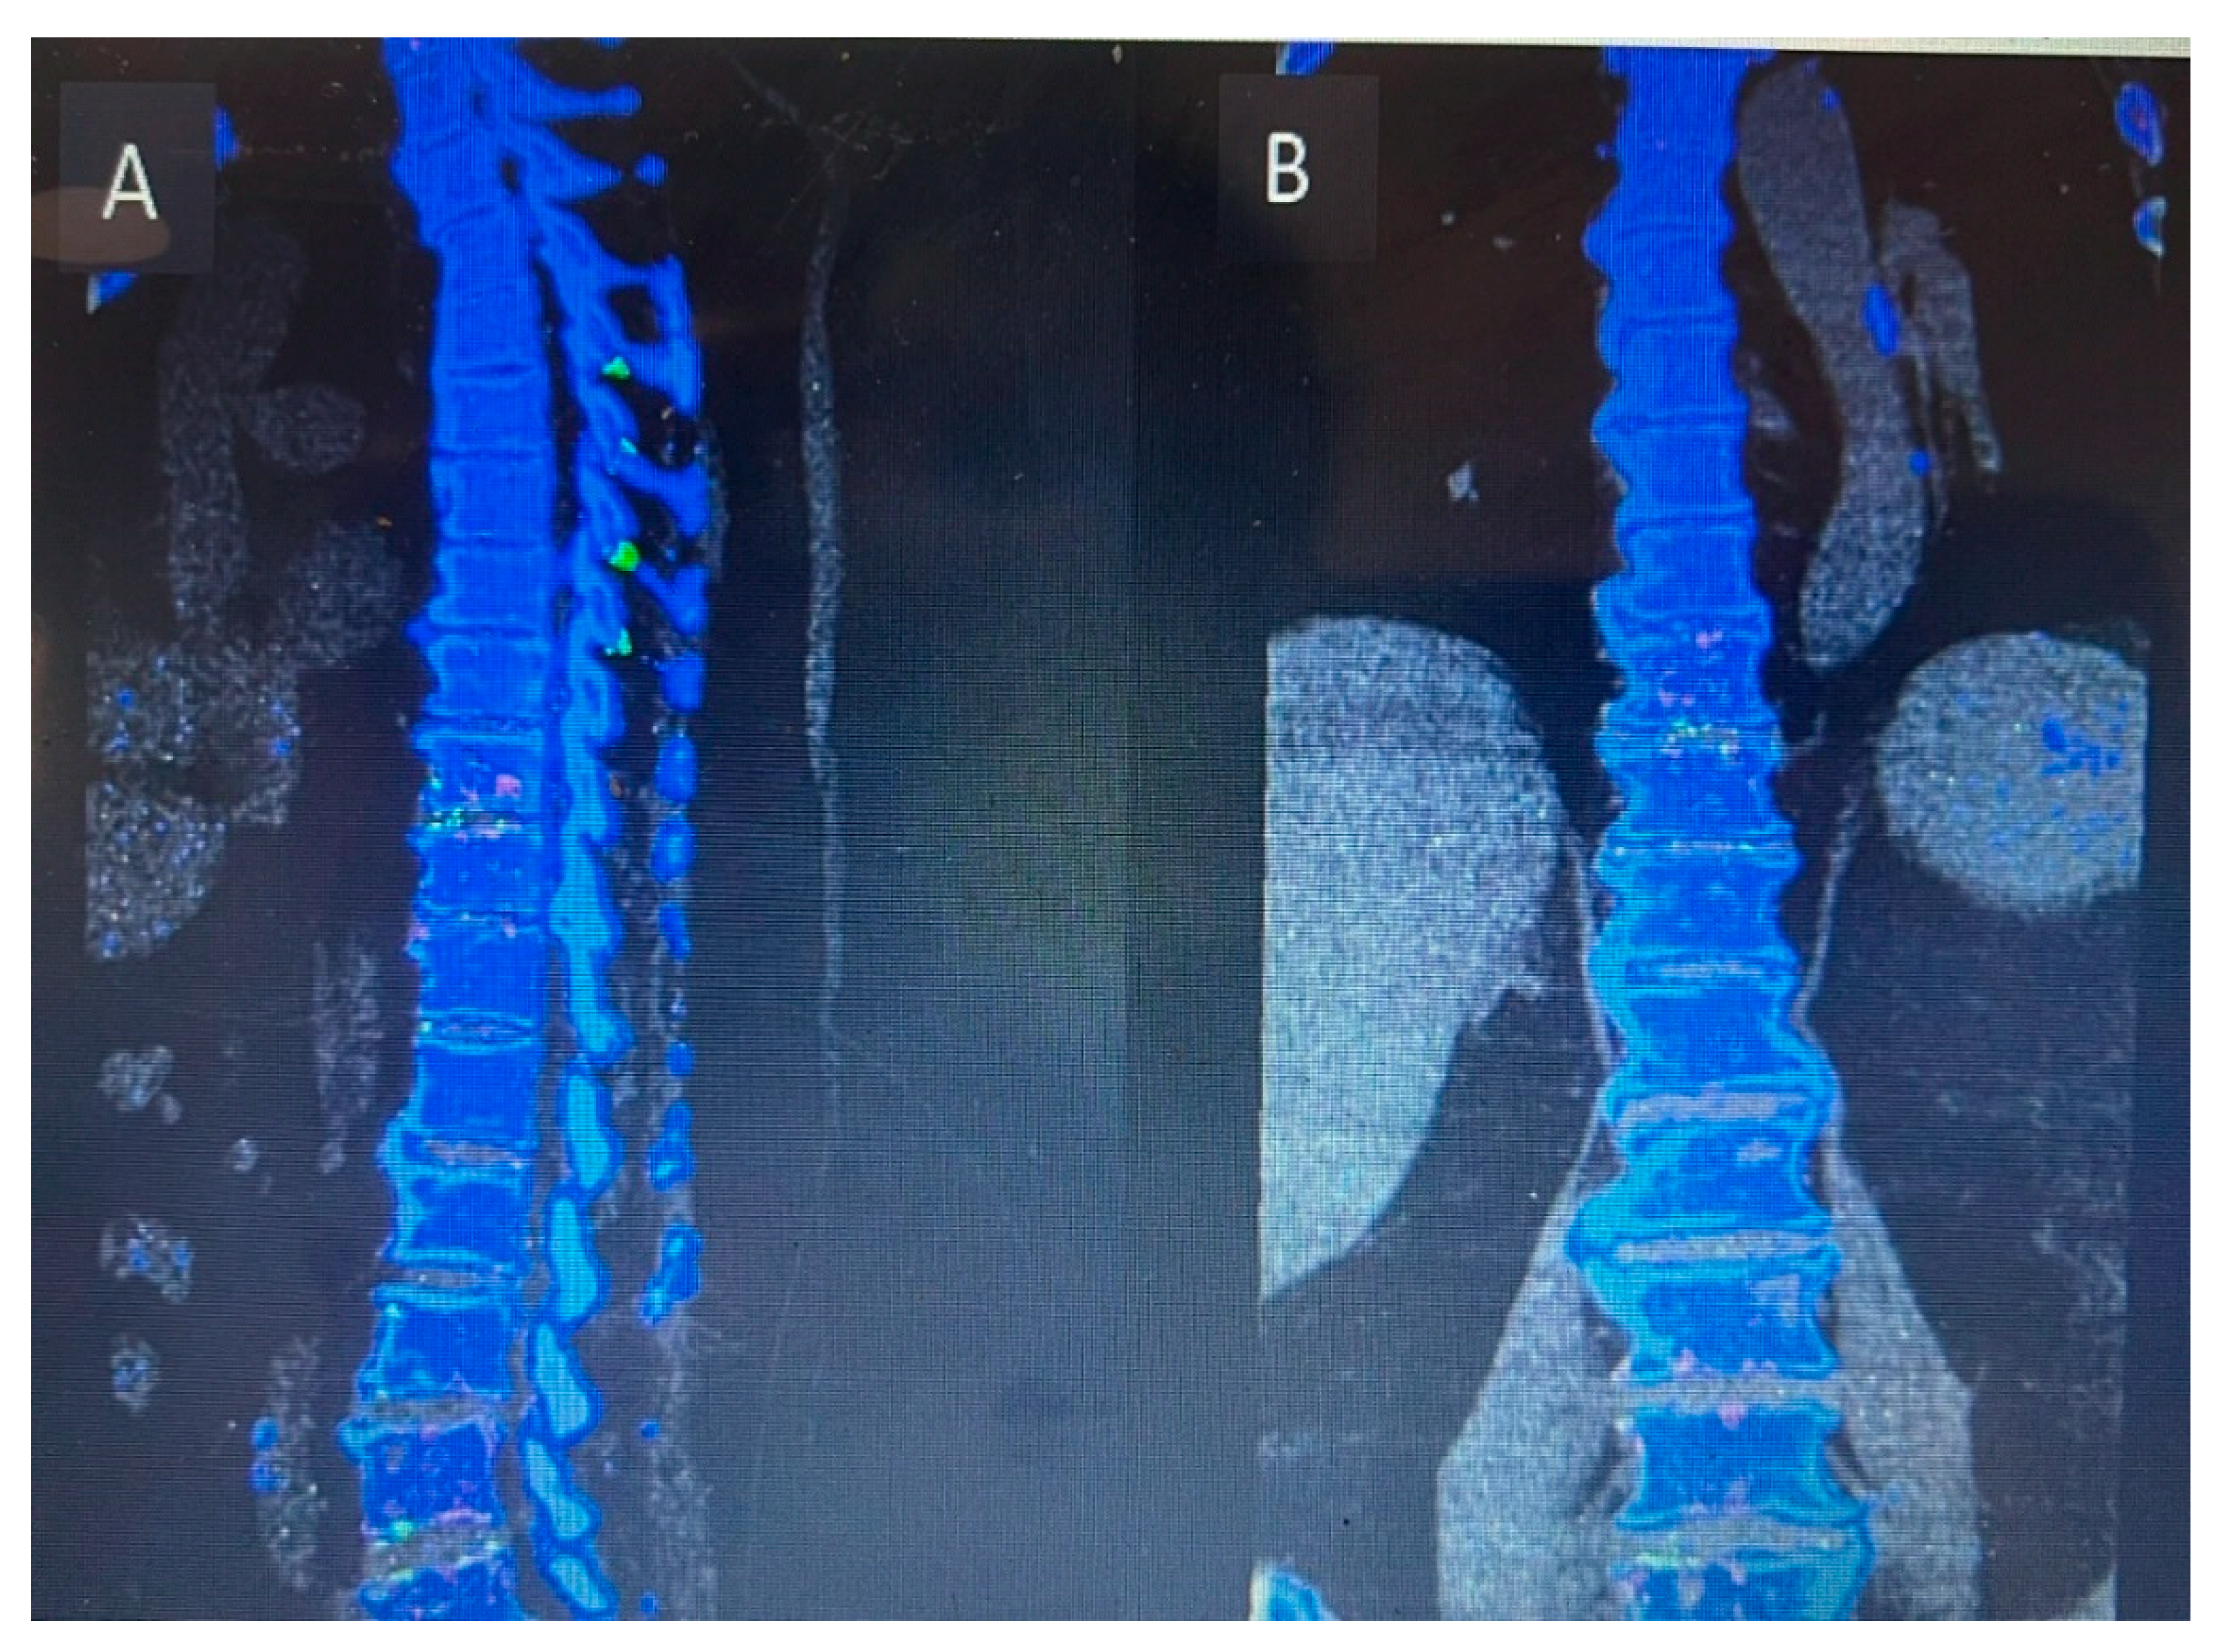
Figure 8.
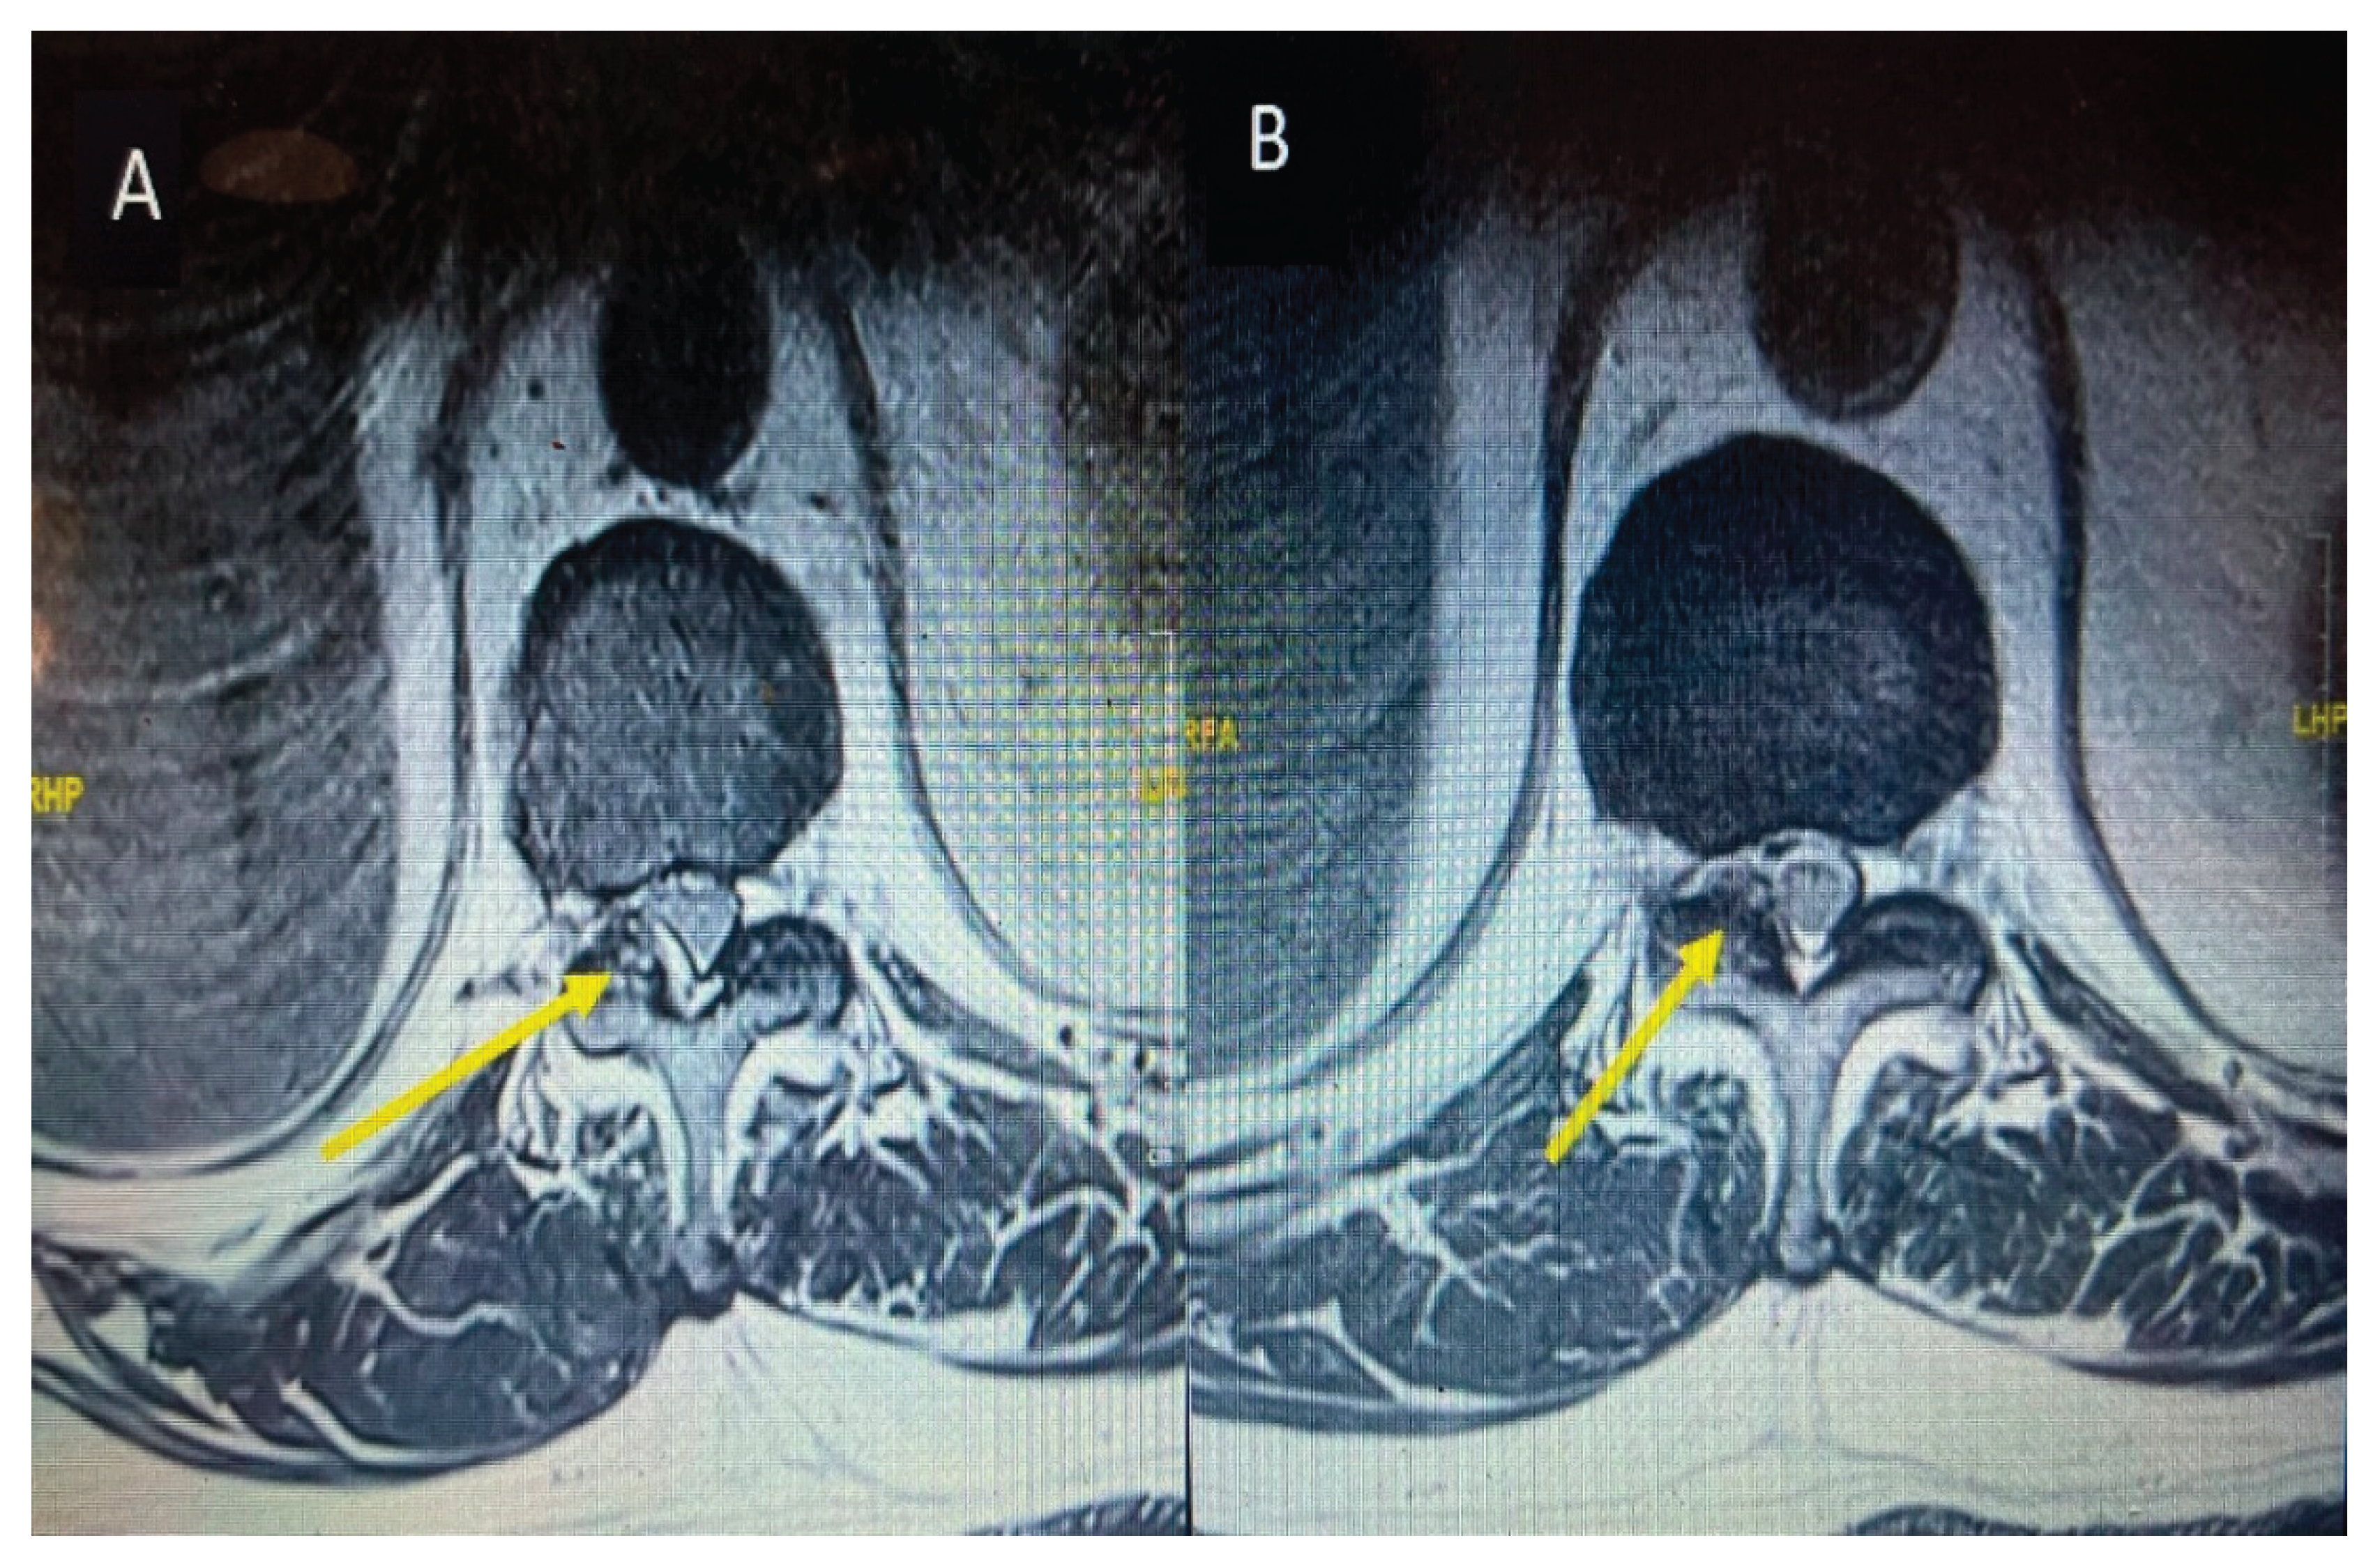
MRI thoracic spine T2 weighted at the level of T10/11 axial section before starting anti gout. Medications (A) and axial section of follow up MRI after starting anti gout medications (B) showing a cyst on the right side as indicated by yellow arrow and total disappearance as shown by yellow arrow after starting anti gout medications.
Figure 8.
MRI thoracic spine T2 weighted at the level of T10/11 axial section before starting anti gout. Medications (A) and axial section of follow up MRI after starting anti gout medications (B) showing a cyst on the right side as indicated by yellow arrow and total disappearance as shown by yellow arrow after starting anti gout medications.
4. Discussion
Gout is a metabolic disorder in which chronic hyperuricemia leads to monosodium urate crystals deposition occurs in joints. It either involves peripheral joints or axial skeleton. Peripheral joints involvement including first metatarsophalangeal joint, knee, ankle and sometimes first interphalangeal joint is more common than the axial skeleton [14,15]. Axial gouty arthropathy which is less common but have more neurological consequences because of the involvement of spine leading to axial spine pain, radiculopathy, myelopathy, cauda equina, and neurological deficit because of the compression of the nerve roots and spinal cord [15,16]. Elgafy H et al in their systemic review documented that lumbar spine is more commonly involved as compared to thoracic and cervical segments, but the most frequent symptoms are neck and back pain followed by symptoms of spinal cord compression, radiculopathy, fever and atlantoaxial instability [17]. In our case series there were only two cases, in which the first one having involvement of cervical spine with symptoms of neck pain and cervical myelopathy while the second one having simultaneous involvement of lumbar and thoracic spinal segments with symptoms of low back pain and lumbar radiculopathy. Because of the rarity of gout involving spine especially cervical spine and limited number of cases in our case series it is difficult for us to calculate the frequency of involvement of spinal segments and symptoms. Furthermore, statistical analysis is impossible with only two cases therefore studies having larger number of cases are more helpful in this regard.
Literature review of spinal gout cases shows that the most common laboratory tests finding is increased uric acid level in the blood having level more than 7 mg/dl which is the cut off value for the definition of hyperuricemia. Most of the radiological findings on the plain x rays and MRI spine are variable and nonspecific. MRI of tophaceous gout mostly shows low to intermediate intensity of T1 weighted sequence while T2 weighted images are highly variable ranging from homogenous low to homogenous high intensity. MRI spine with contrast varies from homogenous to peripheral heterogenous enhancement. Because of the variable and nonspecific radiological picture of MRI it is difficult to differentiate from the other mass occupying lesions in the spinal cord. The most helpful radiological investigation is dual energy CT scan which can differentiate it from other inflammatory mimicking conditions especially Rheumatoid arthritis which is considered as Calcium Phosphate deposition disease and the main reason is that it has two X rays’ tubes having with different peak kilovoltages (80 and 120 kVp) which can differentiate Urate crystals of Gout from Calcium Phosphate of Rheumatoid arthritis. The sensitivity and specificity of dual energy CT is for Mono Sodium Urate crystals is 90% and 83%, respectively. Other than dual energy CT scan cytological or histopathological studies can help to make a definitive diagnosis because of high sensitivity and specificity for urate crystal [13,17,18]. In our case series the level of blood uric acid level was considerably high values having 445 mg/dl in the first case and 552 mg /dl in the second case consisted with statement mentioned before. Similarly, we did dual energy CT scan in both cases gave more definitive clue of Gout involvement of the targeted locations in spine which were detected by prior MRI images. The limitations in our study are that we were unable to perform the histological examination of the sample taken during the surgery because in first case of cervical spine we took sample for histological examination during the surgery but the sample was sent in Formalin due to which crystal examination was unable to perform while the 2nd case was managed conservatively with subsequent resolution of Thoracic spine facet joint cyst with anti-gout medications reported in follow up MRI spine. Based on these limitations it is suggested that the tissues samples should be sent in normal saline in spite of fixing in Formalin.
Spinal Gout cases are treated either conservatively or surgically based on presence or absence of neurological deficit. Pharmacological treatment is reserved for less severe cases without having signs and symptoms of radiculopathy and myelopathy. Medications such as NSAIDS, Colchicine and corticosteroids are used mainly used for symptoms relief in acute attacks without effecting deposition of tophi in tissues and boney erosions. If the patient has a history of hypertension, heart disease, chronic kidney disease, gastric or duodenal ulcers, NSAIDS allergy and receiving anticoagulant therapy then colchicine should be used in spite of NSAIDS. Anti gout medications which are divided into first- and second-lines medications are used to prevent further gout attacks with a goal to keep uric acid level less than 6 mg/dl. First line anti Gout medications mainly reduce uric acid production which include Xanthine oxidase inhibitors include allopurinol, oxypurinol and febuxostat and second line medications are Uricosuric agents which increase uric acid excretion having sulfinpyrazone and probenecid in the list. Surgical treatment is indicated when there is spinal cord or nerve roots compression with neurological deficit. The main goal of the surgery is to decompress the spinal cord and nerves with removal of tophi which looks like chalky white material [17]. We did decompression of the cervical spine in our first case with removal of chalky white material during the surgery because radiological images were showing compression of cervical spinal cord with progressive neurological deficit and the 2nd case was managed conservatively because the patient gave a good response to anti gout medications with improvement in clinical symptoms, declining uric acid level and complete resolution of thoracic spine facet cyst on follow up MRI spine.
5. Conclusion
Spinal gout, though rare, is an important differential diagnosis in patients presenting with unexplained back or neck pain and neurological symptoms, especially among those with a history of gout or hyperuricemia. Due to its nonspecific presentation and diagnostic challenges—including limitations of conventional imaging and crystal studies—maintaining a high index of suspicion is essential. Advanced imaging modalities like DECT and biopsy with histopathology can aid in accurate diagnosis and appropriate management; however, their limitations include cost, availability, and radiation exposure.
In non-surgical cases, to differentiate spinal gout from spondylodiscitis during image-guided biopsy, samples should be sent for crystal studies along with histopathology and culture with sensitivity testing. If the patient is unwilling to undergo image-guided biopsy, dual-energy CT (DECT) serves as a valuable non-invasive diagnostic tool with high sensitivity and acceptable specificity.
For patients presenting with neurological deficits who meet surgical criteria, tissue samples should be preserved in normal saline rather than formalin to maintain crystal structural integrity
Author Contributions
Conceptualization, Rajeesh George and Muhammad Ishfaq; methodology Muhammad Ishfaq; software, Muhammad Ishfaq and Rohan De Silva; validation, Rajeesh George and Muhammad Ishfaq. and Rohan De Silva.; formal analysis, Muhammad Ishfaq and Rohan De Silva.; investigation.; resources, Muhammad Ishfaq and Rohan De Silva; data curation, Muhammad Ishfaq and Rohan De Silva; writing—original draft preparation, Muhammad Ishfaq and Rohan De Silva; writing—review and editing, Muhammad Ishfaq and Rohan De Silva; visualization, Muhammad Ishfaq and Rohan De Silva; supervision, Rajeesh George.; project administration, Rajeesh George; funding acquisition, Rajeesh George. All authors have read and agreed to the published version of the manuscript.
Funding
This research study did not receive any external funding.
Institutional Review Board Statement
Ethical review and approval of this study were not required by the institutional review board / ethics committee of Ng Teng Fong General Hospital, because case reports are not considered research. The patient’s information has been de- identified.
Informed Consent Statement
Written informed consents has been obtained from the patients to publish this paper.
Data availability statement
Data results are stored in electronic medical system of the hospital and may be requested from the corresponding author.
Conflict of interest
All the authors declare no conflict of interest.
Abbreviations
| GCS | Glasgow comma scale |
| DRE | Direct rectal examination |
| FBC | Full blood count |
| TW | Total white cell count |
| CRP | C reactive proteins |
| ESR | Erythrocyte sedimentation rate |
| CT | Computer tomography |
| MRI | Magnetic Resonance imaging |
| SSEP | Somatosensory evoked potential |
| EMG | Electromyography |
| MEP | Magnetic motor evoked potential |
| DECT | Dual-energy computed tomography |
| MRC scale | Medical Research Council’s scale |
References
- Bardin T, Richette P. Definition of hyperuricemia and gouty conditions. Curr Opin Rheumatol. 2014 Mar;26(2):186-91. [CrossRef] [PubMed]
- Konatalapalli RM, Demertzis JL, Jelinek JS, Murphey MD, Gibofsky A, Schwarz EM. Gout in the axial skeleton. J Rheumatol. 2009 Jul;36(7):1445-6. [CrossRef] [PubMed]
- Safiri S, Kolahi AA, Hoy D, Smith E, Bettampadi D, Mansournia MA, et al. Global, regional and national burden of rheumatoid arthritis 1990-2017: a systematic analysis of the Global Burden of Disease Study 2017. Ann Rheum Dis. 2019 Dec;78(12):1463-1471. [CrossRef] [PubMed]
- Calniquer A, Hwang W, Nguyen Q, Child Z, Jegapragasan M. A Case of Tophaceous Gout in the Lumbar Spine: A Review of the Literature and Treatment Recommendations. Evidence-Based Spine-Care Journal. 2014 Mar 28;05(01):052–6.
- Mahmud T, Basu D, Dyson PHP. Crystal arthropathy of the lumbar spine. J Bone Joint Surg Br. 2005 Apr 1;87-B(4):513-517. U8.
- Toprover, M., Krasnokutsky, S. & Pillinger, M.H. Gout in the Spine: Imaging, Diagnosis, and Outcomes. Curr Rheumatol Rep 17, 70 (2015). [CrossRef]
- Wang, J.X., Ng, B., Bak, H. et al. The utility of dual energy computed tomography in the management of axial gout: case reports and literature review. BMC Rheumatol 4, 22 (2020).
- Brahmbhatt P, Vibhute P, Gupta V, Murray J, Desai A, Agarwal A. Spinal gout diagnosed by dual-energy CT: A case report. Radiol Case Rep. 2022 Sep 6;17(11):4135-4138. [CrossRef]
- Abreu Casas D, López-Piloto OR, Rodríguez de la Paz NJ, Plasencia-Leonardo JM, Íñiguez-Avendaño D, Gutierrez JV. Spinal Cord Compression Due to Tophaceous Vertebral Gout: A Case Report. Cureus. 2022 Jul 21;14(7):e27101. [CrossRef] [PubMed] [PubMed Central]
- Lumezanu, E., Konatalapalli, R. & Weinstein, A. Axial (Spinal) Gout. Curr Rheumatol Rep 14, 161–164 (2012).
- Ding Y, Wang W, Jiang W, Zhang L, Wang T, Li Z. Tophaceous gout causing thoracic spinal cord compression: Case report and review of the literature. Neurochirurgie. 2018 Jun;64(3):171-176. Epub 2018 May 3. [CrossRef] [PubMed]
- Ma S, Zhao J, Jiang R, An Q, Gu R. Diagnostic challenges of spinal gout: A case series. Medicine (Baltimore). 2019 Apr;98(16):e15265. [CrossRef] [PubMed] [PubMed Central]
- Richette P, Bardin T. Gout. Lancet. 2010 Jan 23;375(9711):318-28. [CrossRef]
- Ning TC, Keenan RT. Unusual clinical presentations of gout. Curr Opin Rheumatol. 2010 Mar;22(2):181-7. [CrossRef]
- Paquette S, Lach B, Guiot B. Lumbar radiculopathy secondary to gouty tophi in the filum terminale in a patient without systemic gout: case report. Neurosurgery. 2000 Apr;46(4):986-8. [CrossRef]
- Elgafy H, Liu X, Herron J. Spinal gout: A review with case illustration. World J Orthop. 2016 Nov 18;7(11):766-775. [CrossRef]
- Yip CM, Lee HP. Spinal gouty tophus presenting as an epidural mass lesion - A case report. Int J Surg Case Rep. 2021 Jul; 84:106063. [CrossRef]
- Brahmbhatt P, Vibhute P, Gupta V, Murray J, Desai A, Agarwal A. Spinal gout diagnosed by dual-energy CT: A case report. Radiol Case Rep. 2022 Sep 6;17(11):4135-4138. [CrossRef]
Disclaimer/Publisher’s Note: The statements, opinions and data contained in all publications are solely those of the individual author(s) and contributor(s) and not of MDPI and/or the editor(s). MDPI and/or the editor(s) disclaim responsibility for any injury to people or property resulting from any ideas, methods, instructions or products referred to in the content. |
© 2025 by the authors. Licensee MDPI, Basel, Switzerland. This article is an open access article distributed under the terms and conditions of the Creative Commons Attribution (CC BY) license (http://creativecommons.org/licenses/by/4.0/).
Copyright: This open access article is published under a Creative Commons CC BY 4.0 license, which permit the free download, distribution, and reuse, provided that the author and preprint are cited in any reuse.


