Submitted:
29 July 2025
Posted:
30 July 2025
You are already at the latest version
Abstract
Background/Objectives: The extended-release once-daily tacrolimus (LCP-Tac) formulation demonstrates enhanced bioavailability and a sustained pharmacokinetic profile compared to the immediate-release twice-daily tacrolimus (IR-Tac) formulation. Switching from IR-Tac to LCP-Tac is emerging as a viable immunosuppressive strategy in clinical settings. This study aimed to examine the influence of genetics and other covariates on the general conversion ratio of 1:0.7. Methods: A population pharmacokinetic model was developed using rich sampling data from 30 stable renal transplant patients who received both IR-TAC and LCP-TAC formulations. Results: The pharmacokinetic (PK) profile was best described by a two-compartment model with first-order absorption and linear elimination for both formulations. The model effectively captured differences in the absorption phases of the two formulations by estimating distinct absorption rate constants and lag times. It also accounted for circadian rhythm effects on apparent elimination clearance and absorption rate constants for IR-Tac. A key finding was the significant impact of the CYP3A5 genetic polymorphism on apparent clearance and the dose conversion rate from IR-Tac to LCP-Tac. CYP3A5*1 expressers had higher clearance and achieved lower exposure with the same IR-Tac dose regimen compared to non-expressers. Conclusion: The enhanced oral bioavailability of LCP-Tac necessitates dose reductions across the patient cohort following conversion from IR-Tac. However, CYP3A5*1 expressers require a more pronounced reduction (1:0.6 conversion ratio) compared to non-expressers (1:0.7) to maintain steady-state concentrations achieved initially with IR-Tac.
Keywords:
tacrolimus
; IR-Tac
; LCP-Tac
; population pharmacokinetics
; conversion ratio
; CYP3A5
; immunosuppression
1. Introduction
Optimizing tacrolimus (Tac) dosing in transplant patients remains a significant challenge due to the drug's narrow therapeutic window and high inter and intra-individual pharmacokinetic (PK) variability[1,2]. This variability translates to difficulties in achieving optimal drug concentrations, which could lead to increased risk of graft rejection or toxicity[2,3,4].
Originally tacrolimus was formulated as twice daily immediate-release formulation (IR-Tac), which offers rapid absorption from the gastrointestinal and a PK profile with high fluctuation between peak (Cmax) and trough (Ctrough) concentrations[2,5,6,7]. LCP-Tac formulation was developed to increase bioavailability and reduce the PK fluctuations. The melt-dose technology enhances the oral bioavailability of the poorly water-soluble tacrolimus allowing for a gradual release along the entire gastrointestinal tract from the small intestine to the colon[5,8,9,10,11,12,13]. The different release profiles between both formulations significantly impact drug absorption requiring a lower dose of LCP-Tac than IR-Tac to achieve similar total tacrolimus exposure in the bloodstream[8,14,15]. Indeed, the current European guidelines recommend a conversion ratio of 1:0.7 for the daily tacrolimus dose between IR-Tac and LCP-Tac, regardless of the genetics[16].
Tacrolimus is primarily metabolized by cytochrome P450 enzymes CYP3A5 and CYP3A4 in the liver and gut[2,17,18,19,20]. However, the intrinsic metabolic capacity of CYP3A5 predominates over that of CYP3A4[21]. CYP3A5 genetic polymorphism is a key factor influencing the wide variability in tacrolimus exposure observed among patients[2,22,23], affecting both IR-Tac[24,25] and LCP-Tac[26,27]. In addition to the Consensus[28], guidelines for using the CYP3A5 genotype to adjust tacrolimus dosing are only available for IR-Tac[23]. Recently some publications have described the effect of CYP3A5 polymorphisms[26,27] or CYP3A4/A5 SNPs combined cluster on tacrolimus exposure after LCP-Tac[26,27,29]. Furthermore, dose recommendations focusing on CYP3A5 SNPs have been provided for LCP-Tac[26,27]. However, no suggestions have been published regarding the consideration of CYP3A5 genotype in the dose conversion ratio from IR-Tac to LCP-Tac.
To date, the ASERTAA study is the only crossover study that has compared tacrolimus exposure following IR-Tac and LCP-Tac administration in the same patients. This study included stable African American kidney transplant recipients. No significant differences in tacrolimus exposure were observed between CYP3A5 expressors and non-expressors for either IR-Tac or LCP-tac, when non-expressors received doses that were 20% lower than those administered to expressors. A trend to higher exposures for LCP-Tac compared to IR-Tac was observed in both groups due to the higher bioavailability of the extended-release formulation, however, the study did not provide conclusive evidence regarding potential differences in the dose ratio of LCP-Tac to IR-Tac based on genotype. No conversion studies have exclusively focused on a Caucasian population. Due to variation in SNPs prevalence across racial groups, the ASERTAA results might not fully represent the Caucasian population. Additionally, while several population pharmacokinetic (PopPK) models have been developed to study the effects of CYP3A SNPs on IR-Tac[24] and LCP-Tac[26,27], no PopPK study has focused on the conversion.
Our previous study[30] showed that conversion of IR-Tac to LCP-Tac with a unique conversion ratio for CYP3A5 phenotypes does not result in the same tacrolimus exposures. Specifically, CYP3A5*1 expressers exhibited higher tacrolimus exposures with LCP-Tac compared to IR-Tac despite receiving approximately 30% lower doses (dose conversion ratio 1:07). In contrast, non-expressers showed similar exposures between LCP-Tac and IR-Tac with the same conversion ratio. Consequently, results suggest an individualization for the conversion ratio depending on the CYP3A5 metabolizer phenotype.
Given the previous results, a population pharmacokinetic model incorporating data from both formulations in the same patients accounting for key predictors of variability in tacrolimus pharmacokinetics such as genetics, circadian rhythm as well as age, body composition and biochemical variables could be a useful tool to establish the conversion ratio to achieve optimal drug exposures. Our study aimed at developing a population pharmacokinetic model specifically investigating the conversion ratio from IR-Tac to LCP-Tac in stable renal transplant patients, and the factors that might influence it, with a special emphasis on genetic variations.
2. Methods
2.1. Study Design
This study was conducted in the Bellvitge University Hospital (Barcelona) in compliance with the Declaration of Helsinki and approved by the ethics committee. All the participants provided written informed consent. Thirty patients participated in an open-label, prospective, non-randomized investigator-driven single-center clinical trial (clinicalTrials.gov NCT02961608). All the patients underwent a kidney transplant at least six months prior to the recruitment in study and were treated with an immunosuppressive drug regimen therapy combining tacrolimus, mycophenolate mofetil and prednisone. The patients received oral twice-daily IR-Tac (Prograf; Astellas Pharma Europe Ltd, Staines, UK), before conversion to once-daily LCP-Tac oral (Envarsus; Chiesi Farmaceutici, Parma, Italy). Pregnant and lactating women, patients with current infection, HIV, neoplasms, severe gastrointestinal disorders, hepatitis B or C, and patients receiving concomitant drugs interacting with the CYP3A enzyme were excluded from this study.
2.2. Blood Sampling and Data Recording
From each patient, 10-18 samples were collected over two 24-hour periods before and after conversion. The initial pharmacokinetic profile for IR-Tac was obtained at steady-state, 1 week before the conversion, meanwhile the pharmacokinetic profile for LCP-Tac was obtained, also at steady-state, four weeks after conversion. Blood samples were drawn from each patient at the following times: pre-dose, and at 0.5, 1, 1.5, 2, 3, 4, 6, 8, 12, 12.5, 13, 13.5, 14, 15, 20, and 24 hours after IR-Tac and LCP-Tac administration.
Tacrolimus daily doses and demographic characteristics of the patients were retrieved from the medical files at the start of the treatment. Hematocrit (%) and serum creatinine concentrations (µmol.L-1) at each occasion at which concentrations were monitored were also recorded. Clinical outcome variables that were assessed were renal function (eGFR), estimated using the Chronic Kidney Disease Epidemiology Collaboration formula, delayed graft function (DGF) and graft loss.
2.3. Tacrolimus Measurement
Tacrolimus was measured using a LC-MS/MS method, previously developed and validated[31]. Chromatographic determination was performed using the Acquity (®) UPLC (®) with a C18 BEH ™ reversed phase column (2.1 × 50mm id, 1.7μm). The limit of quantitation was set at 1.0 ng/mL.
2.4. Genotyping
Genomic DNA was extracted from a peripheral whole-blood sample using Maxwell RSC® (Promega Corporation, Sydney, Australia) and was stored at −80° C. Genotyping of the CYP3A5*3 G > A (rs776746) polymorphism (SNPs) was carried out using TaqMan SNP Genotyping Assay with the 7900HT Fast Real-time PCR System, Applied Biosystems (Thermo Fisher Scientific, Waltham, MA, United States).
2.5. Statistical Analysis
Demographic and biochemistry continuous variables are presented in Table 1 as mean and interquartile range. Categorical variables such as clinical and genetic characteristics were given as number of observations and percentages. Trough concentrations (Ctrough) were reported as geometric means and interquartile ranges. Ctrough were the observed values just before each given dose. The areas under the curve from 0 to 24 h (AUC24) were calculated using the linear-log trapezoidal rule of the non-compartmental analysis with PKNCA package in R. Normalized by dose AUC24 and Ctrough are also calculated and presented as geometric means (interquartile range) in Table 2. Relative bioavailability between IR-Tac and LCP-Tac was calculated within the same genetic variant as follows,
F values were compared statistically with an unpaired t-test considering the genetic variant as fixed factor Log-transformed values of F were used according to normal practice[32]. R package (ver4.0.3) was used in all the statistical comparisons and statistical significance was set to p<0.05.
2.6. Population Pharmacokinetic Analysis
Population pharmacokinetic (PopPK) analysis was performed with the nonlinear mixed-effects modeling approach using NONMEM® version 7.5 (ICON Development Solutions, Hanover, MD, USA). Perl-Speaks-NONMEM (PsN) version 5.2.6, R package version 4.0.3, Pirana Modelling Workbench version 3.0 (Certara L.P. (Pharsight), St. Louis Louis, MO), and Xpose 4.7.2 were used for data management, exploratory data analysis, graph plotting and model evaluation. The first-order conditional estimation (FOCEI) method with interaction was used throughout the modelling process.
2.6.1. Base Model Development
The one- and two-compartment open models with linear elimination were tested. First-order oral absorption with or without lag time, as well as transit compartment models, were tested to describe the absorption processes. Inter-individual variability (IIVs) and inter-occasion variability (IOVs) were tested in all PK parameters assuming a log-normal distribution. The models were parameterized in terms of apparent blood elimination clearance (CL/F), apparent central and peripheral compartment distribution volumes (Vc/F and Vp/F), apparent inter-compartmental clearance (CLD/F), absorption rate constant (Ka), lag time (ALAG) for classical lag time models. For transit compartment models, mean transit time (MTT) and the number of compartments (NN) were used. Due to the different absorption profiles of each formulation (IR-Tac and LCP-Tac), two different absorption rate constants, and lag times were tested. Bioavailability (F) could not be estimated due to the lack of intravenous data. F value was fixed to 1 for the combination of formulation and genetic variant group taken as reference. In the other cases, the relative bioavailability with respect to the reference group was estimated as follows,
Where is the fraction representing the actual relative bioavailability value of formulation genetic variant x with respect to the reference.
In addition, as in our previous study[33], the modelling of the effect of 24 hours-circadian rhythms on the PK parameters of IR-Tac, previously reported[34], was tested. Thus, as before, a cosine function with a period of 24 hours (1440 minutes) was implemented in the model as follows:
Where P represents the studied PK parameter on which the influence of circadian rhythms is tested (i.e., CL/F and Ka), the mesor (individual value of the PK parameter around which it oscillates), the amplitude, and ACROPHASE the acrophase (time of the peak of the cosine function). TIME represents the time in minutes starting at midnight of the first PK profile.
Additive, proportional, and combined error models were tested to describe residual error (RE) variability. To distinguish across hierarchical models, the likelihood ratio test was used, based on the reduction of the minimum objective function value (MOFV). A significance level of p < 0.005 was applied, corresponding to ΔMOFV = -7.879 for 1 degree of freedom. For the non-hierarchical models, the most parsimonious model with the lowest MOFV according to the Akaike information criterion (AIC) was chosen[35]. The decrease in MOFV, parameter precision expressed as percentage relative standard error (RSE%), reductions in IIV associated with parameters, η- and ε-shrinkage values[36], model completion status, condition number and visual inspection of goodness-of-fit plots were also considered for model selection and evaluation.
2.6.2. Covariate Analysis
Demographic and biochemistry variables, including patient age, gender, total body weight, body mass index, and haematocrit which could be considered physiologically and clinically meaningful, were investigated for their influence on the pharmacokinetic parameters of tacrolimus. The effect of CYP3A5 phenotypes was also studied.
Covariates were initially explored univariately, and then the forward inclusion (p<0.05) and backward elimination (p<0.001) stepwise procedures were applied. Significance levels of 5% (∆MOFV= –3.841 units) and 0.1% (∆MOFV = 10.8 units) were considered during the forward addition and backward elimination steps, respectively.
2.7. Model Evaluation and Internal Validation
Goodness-of-fit plots were analysed throughout the modelling process to assess the descriptive capability of the model. The predictive capability was evaluated using prediction-corrected visual predictive checks (pcVPC) based on 1000 simulations[37]. The median and 5th and 95th percentiles of the simulated data and their respective 95% prediction intervals were calculated and visually compared with the same percentiles obtained from the original raw data. A non-parametric resampling bootstrap procedure with replacement, of 1000 replicates from the original dataset was performed to further evaluate the stability and precision of the model parameters. Also, npde (normalized prediction distribution errors) diagnostics were performed. Model adequacy was also evaluated by checking the evenly distribution of predicted discrepancies and comparing the shape, location and variance of distribution parameters to the theoretical normal distribution.
2.8. Simulations
The final estimated fixed- and random-effects parameters were fixed in the model to stochastically simulate 1000 time-concentration profiles for IR-Tac and LCP_Tac in CYP3A5*1 expresser and CYP3A5*1 non-expresser patients. Concentrations at steady-state (after at least 10 days of treatment) from a wide range of IR-Tac (from 0.5 to 10 mg) and LCP-Tac doses were simulated with conversion ratios between both formulations ranging from 0.5 to 1 in steps of 0.1. A 12-hour dosing schedule (twice a day) for IR-Tac formulation and 24-hour dosing schedule for LCP-Tac were simulated. From these simulations, the AUC24 and Ctrough were calculated using the non-compartmental analysis with PKNCA package in R. Thus, 1000 sets of IR-Tac and LCP-Tac AUC24 and Ctrough values for each IR-Tac dose/CYP3A5 genotype (CYP3A5*1 expressers and non-expressers)/conversion ratio from IR-tac to LCP-Tac combination were generated. Then, geometric means and 90% confidence intervals were calculated for each set of values of each combination using the R software (ver4.0.3).
3. Results
3.1. Patient Characteristics and Datasets
A total of 932 blood tacrolimus concentration-time data from 30 stable adult renal transplant recipients were simultaneously analyzed: 481 samples were obtained 1 week before conversion when patients were taking IR-Tac. The remaining 451 samples were obtained 4 weeks after the patients were converted to the LCP-Tac formulation. Demographic, laboratory, and genetic characteristics of the patients are summarized in Table 1. Patients showed mean body weights around 70 kg and mean ages around 60 years, without a wide range of variation between minimum and maximum values.
Renal functions and haematocrit levels were within the expected values for stable kidney transplant patients. Only one patient of CYP3A5 *1/*1 genotype was available in the study and could not be included in the analysis. Instead, we categorised both CYP3A5 *1/*1 and CYP3A5 *1/*3 (N=10) as expressers and CYP3A5 *3/*3 (N=20) as non-expressers for the statistical analysis and model development.
Upon conversion from the IR-Tac to LCP-Tac formulation, the normalized by dose exposure increases significantly. The relative bioavailability of IR-Tac vs LCP-Tac based on AUC24 was different between CYP3A5*1 expressers and non-expressers; specifically, the relative bioavailability for CYP3A5*1 expressers was 60%, whereas for non-expressers was of 72% (Table 2).
3.2. Population PK Analysis
3.2.1. Base Model
The tacrolimus PK was best described by a two-compartment model with first-order absorption and linear elimination for both formulations. IIV could be associated with CL/F, Vc/F, and with both Ka of each formulation assuming a log-normal distribution. A partial OMEGA block structure with an OMEGA block on Vc/F, Ka IR-Tac, and Ka LCP-Tac was the most appropriate structural model. Inclusion of IOV in CL/F caused a statistically significant reduction in the model OFV (∆MOFV= -246 units). In the case of IOV in Vc/F the MOFV reduction was reduced by 146 units, and it contributed to 33% reduction of IIV associated with Vc/F.
Two distinct Ka and lag time values for each formulation were found to be statistically significant leading to reductions of the MOFV of -411 and -196 units, respectively. Considering two ka also led to a relative reduction of 47% in inter-individual variability associated with this parameter. The peripheral compartment distribution volume had to be fixed to the estimated amount from the model, a value which is similar with our previous model[38]. This approach was employed to increase the estimation precision of the remaining parameters of the model and to avoid collinearities. The proportional error model best described the residual error associated with concentrations. Inclusion of IOV in CL/F and Vc/F improved RE by 17% and 13% respectively. The estimation of lag-time and inclusion of circadian rhythm variation on the IR-Tac absorption constant also contributed to a reduction of RE by 13% and 14% respectively.
Incorporation of the circadian rhythm variation in the apparent elimination clearance and in the absorption rate constant of the IR-Tac formulation significantly improved the model leading to reductions of the MOFV of -56 units and -195 units, respectively.
3.2.2. Covariate Model
Graphical exploration of Bayesian estimates of the pharmacokinetic parameters vs demographic and biochemical covariates did not show any significant trend. When covariates were entered univariately, none of the size descriptors (body weight, body mass index) entered allometrically or with any other relationship provided a significant drop in the MOFV (p > 0.05) or improved the overall model. Similarly, occurred with age and haematocrit.
The influence of CYP3A5 genotypes, categorized as CYP3A5*1 expressers (i.e., *1/*3, and *1/*1)) and non-expressers (CYP3A5*3/*3) was tested in F and CL/F. Statistical significance was superior when tested in F than CL/F. Indeed, the inclusion in F, significantly improved the model by decreasing the OFV (∆MOFV= -51 units). In addition, it resulted in an overall improvement in the IIV of the most parameters of the model by about 10%. It led to a reduction in unexplained IIV associated with CL/F, Vc/F and Ka by more than 30%, 10% and 8%, respectively. Then, the final model only supported the inclusion of CYP3A5 polymorphisms as a covariate in F. Goodness-of-fit plots confirmed the descriptive capability of the data (Figure 1). Plots of observed versus population and individual predicted concentrations showed a random distribution around the identity line without bias and trends. Conditional weighted residuals were homogeneously spread around zero over all the time after dose range, this suggesting that the structural part of the model was well described. Individual weighted residuals were also randomly scattered around zero over the concentration range suggesting a good description of residual error.
The final population pharmacokinetic parameters are displayed in Table 3. The final model estimated the relative bioavailability of CYP3A5*1 expressers-IR-Tac, CYP3A5*1 expressers-LCP-Tac and CYP3A5*1 non-expressers-IR-Tac with respect to CYP3A5*1 non-expressers-LCP-Tac resulting in values of 42.7%, 69.3% and 74.5%, respectively. Within each genetic variant (CYP3A5*1 expressers or non-expresser), bioavailability was significantly higher for LCP-Tac than IR-Tac. Within each formulation, bioavailability was lower for CYP3A5*1 expressers than for non-expressers.
Residual error variability associated with the final model was 13.3%, and the corresponding shrinkage was 9.95%. Most of the parameters were estimated precisely (relative standard error, %RSE < 20%), the absorption rate constant of the IR-Tac formulation and the amplitude of the circadian rhythm variation in it had higher %RSE (~40%). The shrinkage of the IIV related to parameters were within acceptable values (< 26%).
3.2.3. Model Evaluation
According to the bootstrap results (Table 3) the mean values of all the fixed effect and random effect parameters were within 90% confidence interval of those obtained by the final model confirming the reliability of them. Model parameters were identifiable from the data as indicated by the corresponding 90% confidence interval which did not include the zero. The Predcorr VPC (Figure 2) showed that the model properly describes the mean tendency and variability of the entire data.
The scatter plots of NPDE vs. time and individual predicted concentrations (Figure S1) showed a random distribution around the null line with most of the predicted NPDE values within the 95% confidence interval of the theoretical normal distribution, proving the descriptive capability of the model.
3.3. Model Simulations
Figure 3 and Figure 4 display the boxplots of AUC24 and Ctrough simulated values for IR-Tac and LCP-Tac at steady-state after IR-Tac doses from 3 to 6 mg in steps of 1 mg (corresponding to 0.042 mg/kg to 0.085 mg/kg, for a 70 kg-based bodyweight corresponding to the mean of the studied population) and conversion ratios from IR-Tac to LCP-Tac from 0.5 to 1, in steps of 0.1. These simulations were performed for patients CYP3A5*1 expressers and non-expressers.
Table S1 displays the geometric means (90% confidence intervals) of Ctrough and AUC24 for each IR-Tac dose and conversion ratio from IR-Tac to LCP-Tac and CYP3A5 genetic variant.
According to these results, within the same dose lower tacrolimus exposures given by either Ctrough or AUC24, are achieved for IR-Tac in CYP3A5*1 expressers compared to non-expressers. In addition, regardless of the conversion ratio, tacrolimus exposures for LCP-Tac are also lower in CYP3A5*1 expressers compared to non-expressers. On the other hand, tacrolimus exposures for LCP-Tac increase with the conversion ratio applied. This behaviour is observed within each dose regimen but as expected tacrolimus exposures for both IR-Tac and LCP-Tac increase proportionally with dose.
Comparison of simulated Ctrough and AUC24 values for IR-Tac (0-24 h) and LCP-Tac, CYP3A5 expressers have higher tacrolimus exposure with LCP-Tac compared to IR-Tac when the LCP-Tac dose is reduced by 30%, whereas non-expressers show similar exposures between LCP-Tac and IR-Tac with the same conversion ratio. This suggests the optimal conversion ratio at steady state for CYP3A5*1 non-expresser is 0.70, meanwhile a conversion ratio of 0.60 should be applied for expressers to achieve similar exposures.
4. Discussion
This study marks a significant advancement in the understanding of tacrolimus pharmacokinetics in stable renal transplant patients, particularly in the context of conversion from IR-Tac to LCP-Tac. Notably, the importance of our research lies in the introduction of the first PopPK model that specifically investigates the dose conversion ratio of tacrolimus between these formulations based on genetic polymorphism in a stable renal transplant population.
The model developed confirms the findings of our previous study[30]. Certainly, the model showed that the standard conversion ratio from IR-Tac to LCP-Tac, at steady-state conditions, proposed by current guidelines[16] (0.7-0.8 of the IR-Tac dose) to achieve similar tacrolimus daily exposures between both formulations would not be appropriate for both genotypes of CYP3A5 (CYP3A5*1 expressers vs non-expressers). This is particularly important considering that there are few conversion studies[5,10] which were either conducted solely in African American patients or in a mixed population of Caucasian and non-Caucasian individuals.
As previously[24,27,38,39,40], the tacrolimus pharmacokinetic profile was best described by a two-compartment model with delayed first order absorption. Previous studies[27,38], used the transit compartment models to better describe delayed absorption. However, in our case they were not supported by the data, probably due to overparameterization. This would explain the differences in the absorption rate constant Ka for IR-Tac and for LCP-Tac formulations when comparing the current model (Ka: 2.04 and 0.111 h-1 for IR-Tac and LCP-Tac, respectively) to previous (Ka: 0.47 and 0.72 h-1 for IR-Tac[27,38] and LCP-Tac[27,38], respectively). Similarly occurred with lag-times that were 0.465 and 1.42 h for IR-Tac and LCP-Tac, respectively in our model and 2.49 and 5.82 h for IR-Tac[27,38] and LCP-Tac[27,38] formulations in earlier studies.
In any case, the intensive sampling scheme allowed an adequate description of the whole PK profile for both day and night IR-Tac administrations and during the 24-hour LCP-Tac period. Unlike previously[24,27] the inclusion of data from only 30 patients who were also stable did not allow the influence of covariates other than the CYP3A5 genetic polymorphism on apparent bioavailability of each formulation (IR-Tac and LCP-Tac) to be identified. This led to different relative apparent bioavailability of IR-Tac versus LCP-Tac between CYP3A5*1 expressers (61.6%) and non-expressers (74.5%), these values are in agreement with those obtained through the non-compartmental analysis (Table 2). According to the estimated relative F values (Table 3), the model provided apparent elimination clearance values of 11.9, 15.97, 17.17 and 27.87 L/h for CYP3A5*1 non-expresser-LCP-Tac, CYP3A5*1 non-expressers-IR-Tac, CYP3A5*1 expressers-LCP-Tac, and CYP3A5*1 expressers-IR-Tac, respectively, these values being in line with previous studies[27,41]. All these results supported the descriptive capability of the model meanwhile the visual predictive checks confirmed its predictive capability. Simulations from the final model (Table S-1) confirmed that regardless of the administered dose, a conversion ratio of 1:0.7 is required for CYP3A5*1 non-expressers to achieve similar exposures between both formulations, meanwhile the conversion ratio 1:0.6 is enough for CYP3A5*1 expressers. For patients with higher clearance such as CYP3A5*1 expressers, the initial dose needed to achieve target steady-state concentrations with the IR-Tac formulation was higher. With the same IR-Tac dose regimen, lower exposures were achieved in CYP3A5*1 expressers compared to non-expressers (Figure 3 and Figure 4). When switching to LCP-Tac with increased bioavailability (F), the fractions of Tac that enter circulation increase and because steady-state concentrations are proportional to F, higher F results for the same dose regimen in higher exposure, this explaining the required dose reduction in all the patients. However, patients with higher clearance such as CYP3A5*1 expressers require a lower LCP-Tac dose than non-expressers to maintain the lower steady-state concentrations achieved after the IR-Tac compared to non-expressers. This is a key focus of the current study.
This finding should also be taken into account for other patients with high clearance, such as those receiving concomitant treatment with corticosteroids, also requiring careful dose adjustments to maintain the previous steady-state drug levels.
Consequently, once the steady-state for a given dosage regimen of IR-Tac is achieved, dose requirements of LCP-Tac are different between both genotypes, i.e., CYP3A5*1 expressers require 40% less dose of LCP-Tac than IR-Tac meanwhile for non-expressers LCP-Tac dose should be 30% less than that of IR-Tac (Table S1). As expected, regardless of the conversion ratio used, tacrolimus exposure at steady state with the modified-release formulation (LCP-Tac) remains lower in CYP3A5*1 expressers than in non-expressers, regardless of the administered dose of IR-Tac.
The observed higher AUC0-24 for LCP-Tac compared to IR-Tac, and the lower AUC0-24 for CYP3A5*1 expressers compared to non-expresser within the same formulation, align with findings from previous studies[5,10,13,27,42]. Several factors can contribute to the higher bioavailability of LCP-Tac compared to IR-Tac but the most important is the used MeltDose™ drug-delivery technology, which enhances oral bioavailability, controls drug release and produces a more distal distribution of tacrolimus within the gut[9,10]. In ASERTAA study, the authors suggested that the minor susceptibility of LCP-Tac to the CYP3A5 genotype may be because LCP-Tac is absorbed in the more distal gastrointestinal tract where CYP3A5 activity is decreased[43,44,45]. However regional distribution of CYP3A5 seems not to have a relevant impact on bioavailability[45].
The limitation of our study lies in the relatively small sample size, underscoring the need for larger clinical trials to validate and strengthen our findings. Additionally, our model could not explore the cluster genotype combination of CYP3A4 and CYP3A5 due to data limitations. It's important to note that this cluster has been previously demonstrated to play a crucial role in contributing to the clearance variation of tacrolimus in both formulations, extending beyond the influence of CYP3A5 alone[24,27]. Future research endeavors should aim to incorporate this aspect for a more comprehensive understanding of the pharmacogenetic factors influencing tacrolimus pharmacokinetics.
In essence, our study not only contributes to the evolving understanding of tacrolimus pharmacokinetics in renal transplant patients but also emphasizes the need for tailored dosing strategies, considering genetic factors in the conversion from IR-Tac to LCP-Tac. Our findings underscore the imperative to move beyond a one-size-fits-all conversion approach and prompt a re-evaluation of dosing strategies, integrating genetic factors and formulation-specific pharmacokinetics for a more precise and personalized immunosuppressive therapy in renal transplant recipients.
- Study Highlights
-
What is already known?
- -
- LCP-TAC has higher oral bioavailability and lower total daily dose requirement compared to IR-TAC.
- -
- The current conversion ratio of IR-Tac to LCP-Tac is 0.7-0.8 for all patient populations
-
What this study adds?
- -
- Identifies factors influencing IR-TAC to LCP-TAC conversion ratios across different patient population.
- -
- Emphasizes genetic polymorphism’s role in optimizing tacrolimus dosing post-conversion in renal transplant patients.
-
Clinical significance?
- -
- Supports genotype-guided IR-TAC to LCP-TAC conversion ratios
- -
- Enables personalized dosing strategies, reducing rejection risk and adverse effects post-transplant.
Supplementary Materials
The following supporting information can be downloaded at the website of this paper posted on Preprints.org.
Author Contributions
Conceptualization, H.C. and N.L.; Methodology, Z.M.A., B.F., P.F., A.V-A, and R. R-B.; Software, H.C.; Acquisition of data Z.M.A., B.F., P.F. and A.V-A , Analysis and interpretation of data Z.M.A., A.V-A., E.M., JM.C., JM.G., N.M., A.M., A.C., H.C., N.L. Writing–Original Draft Preparation, Z.M.A., A.V-A, JM.C., JM.G., H.C., N.L.; Writing–Review & Editing, Z.M.A., A.V-A, JM.C., JM.G., H.C., N.L.; Supervision, H.C. and N.L.; Project Administration, H.C. and N.L.; Funding Acquisition, H.C and N.L. All authors have read and agreed to the published version of the manuscript.
Funding
None
Institutional Review Board Statement
This study was conducted in the Bellvitge University Hospital (Barcelona) in compliance with the Declaration of Helsinki and approved by the ethics committee (Ref. PR175/18; approved on 20 September 2018).
Data Availability Statement
The data presented in this study are available on request from the corresponding author due to privacy or ethical restrictions.
Acknowledgments
We are especially grateful to Gema Cerezo of the nephrology laboratory team for her crucial technical assistance in this study. We thank CERCA Programme/Generalitat de Catalunya for institutional support. The present study was supported by Instituto de Salud Carlos III and Ministerio de Sanidad y Consumo (PI18/01740, PI21/00559) (co-founded by FEDER funds/European Regional Development Fund (ERDF), a way to Build Europa, RICORS (kidney disease, RD21/00050021), CERCA Programme/Generalitat de Catalunya for the institutional support and the renal diseases funding (VAR22002, HUB).
Conflicts of Interest
None of the authors have a conflict of interest to disclose.
References
- Kuypers, DRJ. Intrapatient Variability of Tacrolimus Exposure in Solid Organ Transplantation: A Novel Marker for Clinical Outcome. Clin Pharmacol Ther. 2020;107(2):347-358. [CrossRef]
- Staatz CE, Tett SE. Clinical pharmacokinetics and pharmacodynamics of tacrolimus in solid organ transplantation. Clin Pharmacokinet. 2004;43(10):623-653. [CrossRef]
- Venkataramanan, R.; Swaminathan, A.; Prasad, T.; Jain, A.; Zuckerman, S.; Warty, V.; McMichael, J.; Lever, J.; Burckart, G.; Starzl, T. Clinical pharmacokinetics of tacrolimus. Clin Pharmacokinet. 1995;29(6):404-430. [CrossRef]
- Katari, S.R.; Magnone, M.; Shapiro, R.; Jordan, M.; Scantlebury, V.; Vivas, C.; Gritsch, A.; McCauley, J.; Starzl, T.; Demetris, A.J.; et al. Clinical features of acute reversible tacrolimus (FK 506) nephrotoxicity in kidney transplant recipients. Clin Transplant. 1997;11(3):237. Accessed August 18, 2022. /pmc/articles/PMC2967284/.
- Tremblay, S.; Nigro, V.; Weinberg, J.; Woodle, ES.; Alloway, RR. A Steady-State Head-to-Head Pharmacokinetic Comparison of All FK-506 (Tacrolimus) Formulations (ASTCOFF): An Open-Label, Prospective, Randomized, Two-Arm, Three-Period Crossover Study. Am J Transplant. 2017;17(2):432-442. [CrossRef]
- Wallemacq, PE.; Verbeeck, RK. Comparative clinical pharmacokinetics of tacrolimus in paediatric and adult patients. Clin Pharmacokinet. 2001;40(4):283-295. [CrossRef]
- Wallemacq, P.E.; Furlan, V.; Möller, A.; Schäfer, A.; Stadler, P.; Firdaous, I.; Taburet, A.-M.; Reding, R.; Clement De Clety, S.; De Ville De Goyet, J.; et al. Pharmacokinetics of tacrolimus (FK506) in paediatric liver transplant recipients. Eur J Drug Metab Pharmacokinet. 1998;23(3):367-370. [CrossRef]
- Nigro, V.; Glicklich, A.; Weinberg, J. Improved Bioavailability of MELTDOSE Once-Daily Formulation of Tacrolimus (LCP-Tacro) with Controlled Agglomeration Allows for Consistent Absorption over 24 Hrs: A Scintigraphic and Pharmacokinetic Evaluation. American Journal of Transplants. 2013.
- Rostaing, L.; Bunnapradist, S.; Grinyó, J.M.; Ciechanowski, K.; Denny, J.E.; Silva, H.T., Jr.; Budde, K.; Envarsus Study Group. Novel Once-Daily Extended-Release Tacrolimus Versus Twice-Daily Tacrolimus in De Novo Kidney Transplant Recipients: Two-Year Results of Phase 3, Double-Blind, Randomized Trial. Am J Kidney Dis. 2016;67(4):648-659. [CrossRef]
- Trofe-Clark, J.; Brennan, D.C.; West-Thielke, P.; Milone, M.C.; Lim, M.A.; Neubauer, R.; Nigro, V.; Bloom, R.D. Results of ASERTAA, a Randomized Prospective Crossover Pharmacogenetic Study of Immediate-Release Versus Extended-Release Tacrolimus in African American Kidney Transplant Recipients. American Journal of Kidney Diseases. 2018;71:315-326. [CrossRef]
- Langone, A.; Steinberg, S.M.; Gedaly, R.; Chan, L.K.; Shah, T.; Sethi, K.D.; Nigro, V.; Morgan, J.C.; STRATO Investigators. Switching STudy of Kidney TRansplant PAtients with Tremor to LCP-TacrO (STRATO): An open-label, multicenter, prospective phase 3b study. Clin Transplant. 2015;29(9):796-805. [CrossRef]
- Gaber, AO.; Alloway, RR.; Bodziak, K.; Kaplan, B.; Bunnapradist, S. Conversion from twice-daily tacrolimus capsules to once-daily extended-release tacrolimus (LCPT): A phase 2 trial of stable renal transplant recipients. Transplantation. 2013;96(2):191-197. [CrossRef]
- Fontova, P.; Colom, H.; Rigo-Bonnin, R.; Bestard, O.; Vidal-Alabró, A.; van Merendonk, L.N.; Cerezo, G.; Polo, C.; Montero, N.; Melilli, E.; et al. Sustained Inhibition of Calcineurin Activity With a Melt-Dose Once-daily Tacrolimus Formulation in Renal Transplant Recipients. Clin Pharmacol Ther. 2021;110(1):238-247. [CrossRef]
- Bunnapradist, S.; Ciechanowski, K.; West-Thielke, P.; Mulgaonkar, S.; Rostaing, L.; Vasudev, B.; Budde, K. Conversion From Twice-Daily Tacrolimus to Once-Daily Extended Release Tacrolimus (LCPT): The Phase III Randomized MELT Trial. American Journal of Transplantation. 2013;13(3):760. [CrossRef]
- Budde, K.; Bunnapradist, S.; Grinyó, J.M.; Ciechanowski, K.; Denny, J.E.; Silva, H.T.; Rostaing, L.; Envarsus Study Group. Novel Once-Daily Extended-Release Tacrolimus (LCPT) Versus Twice-Daily Tacrolimus in De Novo Kidney Transplants: One-Year Results of Phase III, Double-Blind, Randomized Trial. American Journal of Transplantation. 2014;14(12):2796-2806. [CrossRef]
- Staatz, CE.; Tett, SE. Clinical Pharmacokinetics of Once-Daily Tacrolimus in Solid-Organ Transplant Patients. Clin Pharmacokinet. 2015;54(10):993-1025. [CrossRef]
- Lampen, A.; Christians, U.; Guengerich, F.P.; Watkins, P.B.; Kolars, J.C.; Bader, A.; Gonschior, A.K.; Dralle, H.; Hackbarth, I.; Sewing, K.F. Metabolism of the immunosuppressant tacrolimus in the small intestine: cytochrome P450, drug interactions, and interindividual variability. 1995;23(12).
- Iwasaki K. Metabolism of tacrolimus (FK506) and recent topics in clinical pharmacokinetics. Drug Metab Pharmacokinet. 2007;22(5):328-335. [CrossRef]
- Iwasaki, K.; Shiraga, T.; Matsuda, H.; Teramura, Y.; Kawamura, A.; Hata, T.; Ninomiya, S.; Esumi, Y. Absorption, Distribution, Metabolism and Excretion of Tacrolimus (FK506) in the Rat. Drug Metab Pharmacokinet. 1998;13(3):259-265. [CrossRef]
- Lloberas, N.; Vidal-Alabró, A.; Colom, H. Customizing Tacrolimus Dosing in Kidney Transplantation: Focus on Pharmacogenetics. Ther Drug Monit. 2025;47(1):141-151. [CrossRef]
- Dai, Y.; Hebert, M.F.; Isoherranen, N.; Davis, C.L.; Marsh, C.; Shen, D.D.; Thummel, K.E. Effect of CYP3A5 polymorphism on tacrolimus metabolic clearance in vitro. Drug Metab Dispos. 2006;34(5):836-847. [CrossRef]
- De Jonge, H.; De Loor, H.; Verbeke, K.; Vanrenterghem, Y.; Kuypers, DR. In vivo CYP3A4 activity, CYP3A5 genotype, and hematocrit predict tacrolimus dose requirements and clearance in renal transplant patients. Clin Pharmacol Ther. 2012;92(3):366-375. [CrossRef]
- Birdwell, K.A.; Decker, B.; Barbarino, J.M.; Peterson, J.F.; Stein, C.M.; Sadee, W.; Wang, D.; Vinks, A.A.; He, Y.; Swen, J.J.; et al. Clinical Pharmacogenetics Implementation Consortium (CPIC) Guidelines for CYP3A5 Genotype and Tacrolimus Dosing. [CrossRef]
- Andreu, F.; Colom, H.; Elens, L.; van Gelder, T.; van Schaik, R.H.N.; Hesselink, D.A.; Bestard, O.; Torras, J.; Cruzado, J.M.; Grinyó, J.M.; et al. A New CYP3A5*3 and CYP3A4*22 Cluster Influencing Tacrolimus Target Concentrations: A Population Approach. Clin Pharmacokinet. 2017;56(8):963-975. [CrossRef]
- Woillard, JB.; De Winter, BCM.; Kamar, N.; Marquet, P.; Rostaing, L.; Rousseau, A. Population pharmacokinetic model and Bayesian estimator for two tacrolimus formulations--twice daily Prograf and once daily Advagraf. Br J Clin Pharmacol. 2011;71(3):391-402. [CrossRef]
- Henin, E.; Govoni, M.; Cella, M.; Laveille, C.; Piotti, G. Therapeutic Drug Monitoring Strategies for Envarsus in De Novo Kidney Transplant Patients Using Population Modelling and Simulations. Adv Ther. 2021;38(10):5317-5332. [CrossRef]
- Mohammed Ali, Z.; Meertens, M.; Fernández, B.; Fontova, P.; Vidal-Alabró, A.; Rigo-Bonnin, R.; Melilli, E.; Cruzado, J.M.; Grinyó, J.M.; Colom, H.; et al. CYP3A5*3 and CYP3A4*22 Cluster Polymorphism Effects on LCP-Tac Tacrolimus Exposure: Population Pharmacokinetic Approach. Pharmaceutics 2023, Vol 15, Page 2699. 2023;15(12):2699. [CrossRef]
- Brunet, M.; van Gelder, T.; Åsberg, A.; Haufroid, V.; Hesselink, D.A.; Langman, L.; Lemaitre, F.; Marquet, P.; Seger, C.; Shipkova, M.; et al. Therapeutic Drug Monitoring of Tacrolimus-Personalized Therapy: Second Consensus Report. Ther Drug Monit. 2019;41(3):261-307. [CrossRef]
- Crespo, E.; Vidal-Alabró, A.; Jouve, T.; Fontova, P.; Stein, M.; Mocka, S.; Meneghini, M.; Sefrin, A.; Hruba, P.; Gomà, M.; et al. Tacrolimus CYP3A Single-Nucleotide Polymorphisms and Preformed T- and B-Cell Alloimmune Memory Improve Current Pretransplant Rejection-Risk Stratification in Kidney Transplantation. Front Immunol. 2022;13:869554. [CrossRef]
- Vidal-Alabró, A.; Fontova, P.; Rigo-Bonnin, R.; Mohammed Ali, Z.; Melilli, E.; Montero, N.; Manonelles, A.; Coloma, A.; Grinyó, J.M.; Cruzado, J.M.; et al. Nephrology Department, Hospital Universitari de Bellvitge- IDIBELL, Barcelona, Spain. 2025, (manuscript in preparation; to be submitted).
- Rigo-Bonnin, R.; Arbiol-Roca, A.; de Aledo-Castillo, JMG.; Alía, P. Simultaneous Measurement of Cyclosporine A, Everolimus, Sirolimus and Tacrolimus Concentrations in Human Blood by UPLC–MS/MS. Chromatographia. 2015;78(23-24):1459-1474. [CrossRef]
- Davit, B.M.; Chen, M.-L.; Conner, D.P.; Haidar, S.H.; Kim, S.; Lee, C.H.; Lionberger, R.A.; Makhlouf, F.T.; Nwakama, P.E.; Patel, D.T.; et al. Implementation of a reference-scaled average bioequivalence approach for highly variable generic drug products by the US Food and Drug Administration. AAPS J. 2012;14(4):915-924. [CrossRef]
- Fernández-Alarcón, B.; Mohammed Ali, Z.; Fontova, P.; Vidal-Alabró, A.; Rigo-Bonnin, R.; Melilli, E.; Montero, N.; Manonelles, A.; Coloma, A.; Grinyó, J.M.; et .al, Nephrology Department, Hospital Universitari de Bellvitge- IDIBELL, Barcelona, Spain. 2025, (manuscript in preparation; to be submitted).
- Fontova, P.; Colom, H.; Rigo-Bonnin, R.; van Merendonk, L.N.; Vidal-Alabró, A.; Montero, N.; Melilli, E.; Meneghini, M.; Manonelles, A.; Cruzado, J.M.; et al. Influence of the Circadian Timing System on Tacrolimus Pharmacokinetics and Pharmacodynamics After Kidney Transplantation. Front Pharmacol. 2021;12. [CrossRef]
- Yamaoka, K.; Nakagawa, T.; Uno, T. Application of Akaike’s information criterion (AIC) in the evaluation of linear pharmacokinetic equations. J Pharmacokinet Biopharm. 1978;6(2):165-175. [CrossRef]
- Savic, RM,; Karlsson, MO. Importance of Shrinkage in Empirical Bayes Estimates for Diagnostics: Problems and Solutions. AAPS J. 2009;11(3):558. [CrossRef]
- Bergstrand, M.; Hooker, AC.; Wallin, JE.; Karlsson, MO. Prediction-corrected visual predictive checks for diagnosing nonlinear mixed-effects models. AAPS J. 2011;13(2):143-151. [CrossRef]
- Andreu, F.; Colom, H.; Grinyó, JM.; Torras, J.; Cruzado, JM.; Lloberas, N. Development of a population PK model of tacrolimus for adaptive dosage control in stable kidney transplant patients. Ther Drug Monit. 2015;37(2):246-255. [CrossRef]
- Fernández-Alarcón, B.; Nolberger, O.; Vidal-Alabró, A.; Rigo-Bonnin, R.; Grinyó, J.M.; Melilli, E.; Montero, N.; Manonelles, A.; Coloma, A.; Favà, A.; et al. Guiding the starting dose of the once-daily formulation of tacrolimus in “de novo” adult renal transplant patients: a population approach. Front Pharmacol. 2024;15:1456565. [CrossRef]
- Andrews, L.M.; Hesselink, D.A.; van Schaik, R.H.N.; van Gelder, T.; de Fijter, J.W.; Lloberas, N.; Elens, L.; Moes, D.J.A.R.; de Winter, B.C.M. A population pharmacokinetic model to predict the individual starting dose of tacrolimus in adult renal transplant recipients. Br J Clin Pharmacol. 2019;85(3):601-615. [CrossRef]
- Åsberg, A.; Midtvedt, K.; van Guilder, M.; Størset, E.; Bremer, S.; Bergan, S.; Jelliffe, R.; Hartmann, A.; Neely, M.N. Inclusion of CYP3A5 genotyping in a nonparametric population model improves dosing of tacrolimus early after transplantation. Transplant International. 2013;26(12):1198. [CrossRef]
- Sanghavi, K.; Brundage, R.C.; Miller, M.B.; Schladt, D.P.; Israni, A.K.; Guan, W.; Oetting, W.S.; Mannon, R.B.; Remmel, R.P.; Matas, A.J.; et al. Genotype-guided tacrolimus dosing in African-American kidney transplant recipients. The Pharmacogenomics Journal 2017 17:1. 2015;17(1):61-68. [CrossRef]
- Baccarani, U.; Velkoski, J.; Pravisani, R.; Adani, G.L.; Lorenzin, D.; Cherchi, V.; Falzone, B.; Baraldo, M.; Risaliti, A. MeltDose Technology vs Once-Daily Prolonged Release Tacrolimus in De Novo Liver Transplant Recipients. Transplant Proc. 2019;51(9):2971-2973. [CrossRef]
- Baraldo, M. Meltdose Tacrolimus Pharmacokinetics. Transplant Proc. 2016;48(2):420-423. [CrossRef]
- Tsunashima, D.; Kawamura, A.; Murakami, M.; Sawamoto, T.; Undre, N.; Brown, M.; Groenewoud, A.; Keirns, J.J.; Holman, J.; Connor, A.; et al. Assessment of tacrolimus absorption from the human intestinal tract: open-label, randomized, 4-way crossover study. Clin Ther. 2014;36(5):748-759. [CrossRef]
Figure 1.
Goodness-of-fit plots of the final model. (A) Observed tacrolimus concentrations vs. population predicted concentrations. (B) Observed tacrolimus concentrations vs. individual predicted concentrations. Black line: identity line; red line: smooth line indicating the general data trend. (C) Individual weighted residuals (IWRES) vs. individual predicted concentrations. (D) Conditional weighted residuals (CWRES) vs. time from the start of the study. Red line: smooth line indicating the general data trend. Black line represents the line y = 0. Time in hours. Concentrations given in ng.mL−1.
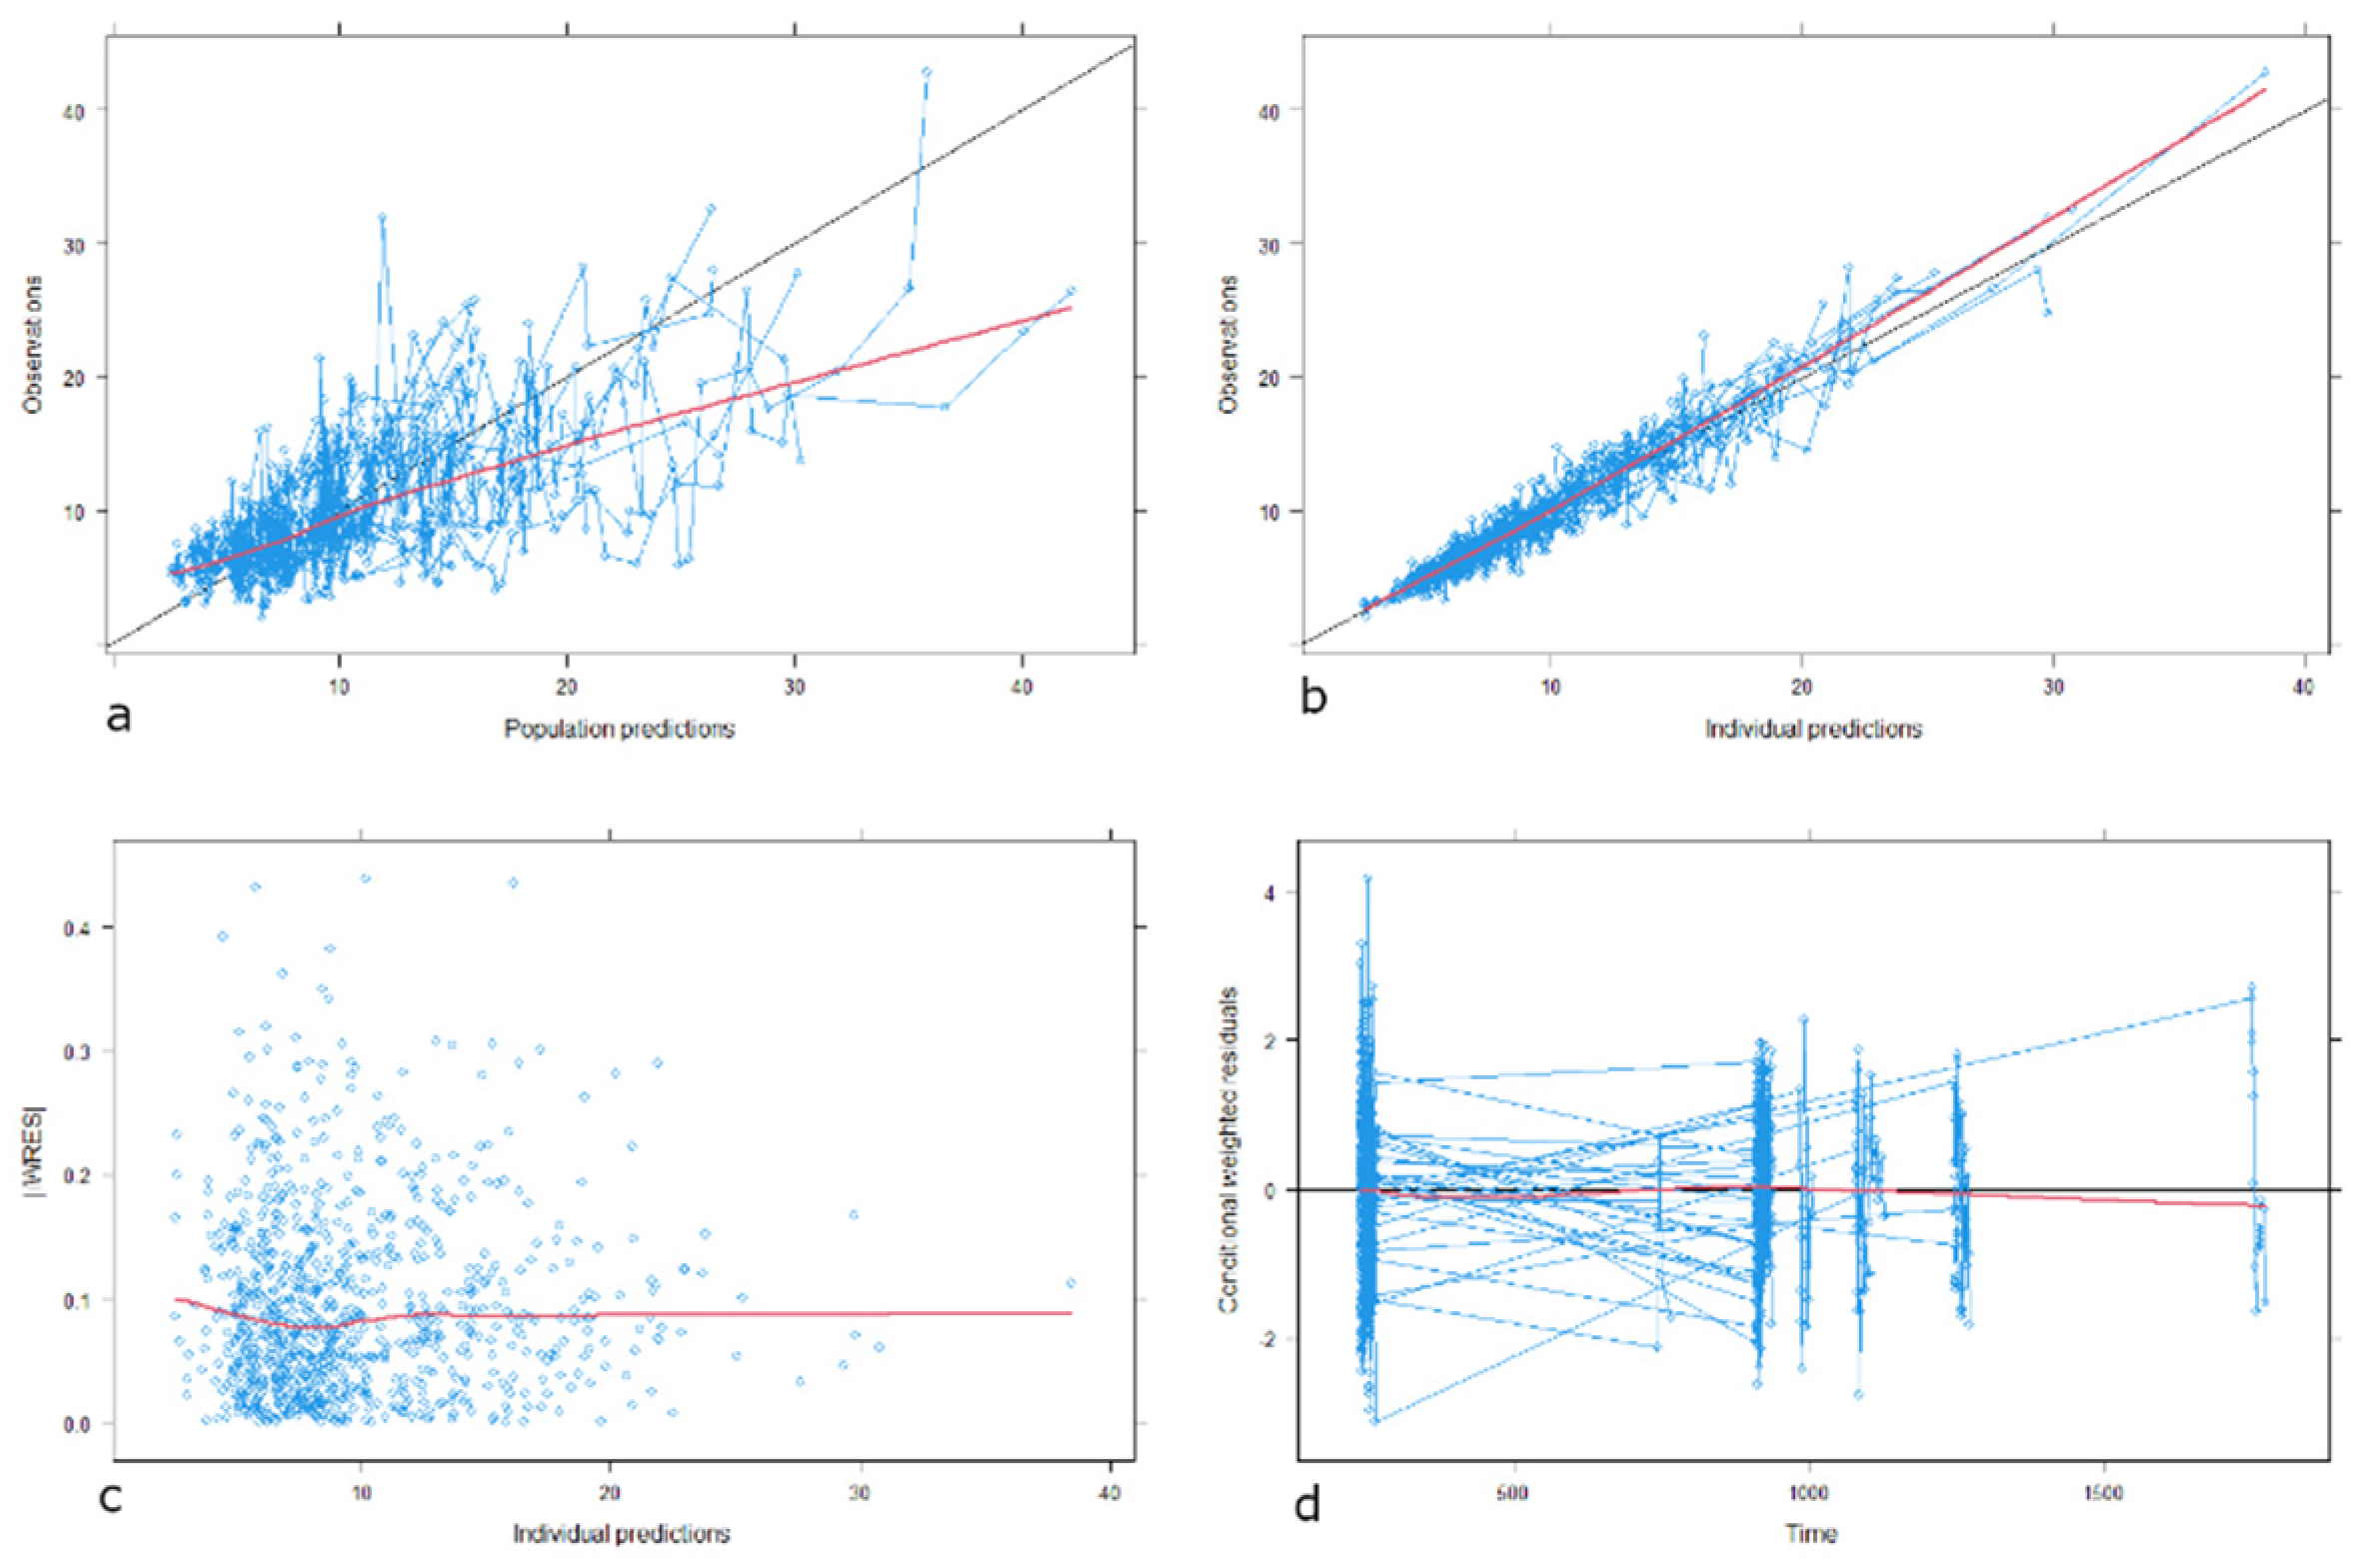
Figure 2.
Prediction-corrected visual predictive check (pcVPC) for the final model A- IR-Tac day dose. B- IR-Tac night dose. C- LCP-Tac. Tacrolimus concentration given in ng·mL-1, time after dose given in hours. The solid line represents the median observed prediction-corrected whole blood concentrations (ng·mL-1), and the red band represents a simulation-based 95% confidence interval for the median. The observed 5% and 95% percentiles are presented with dashed red lines, and the 95% confidence intervals for the corresponding model predicted percentiles are shown as blue bands. The observed whole blood concentrations (prediction corrected in the pcVPC) are represented by blue circles.
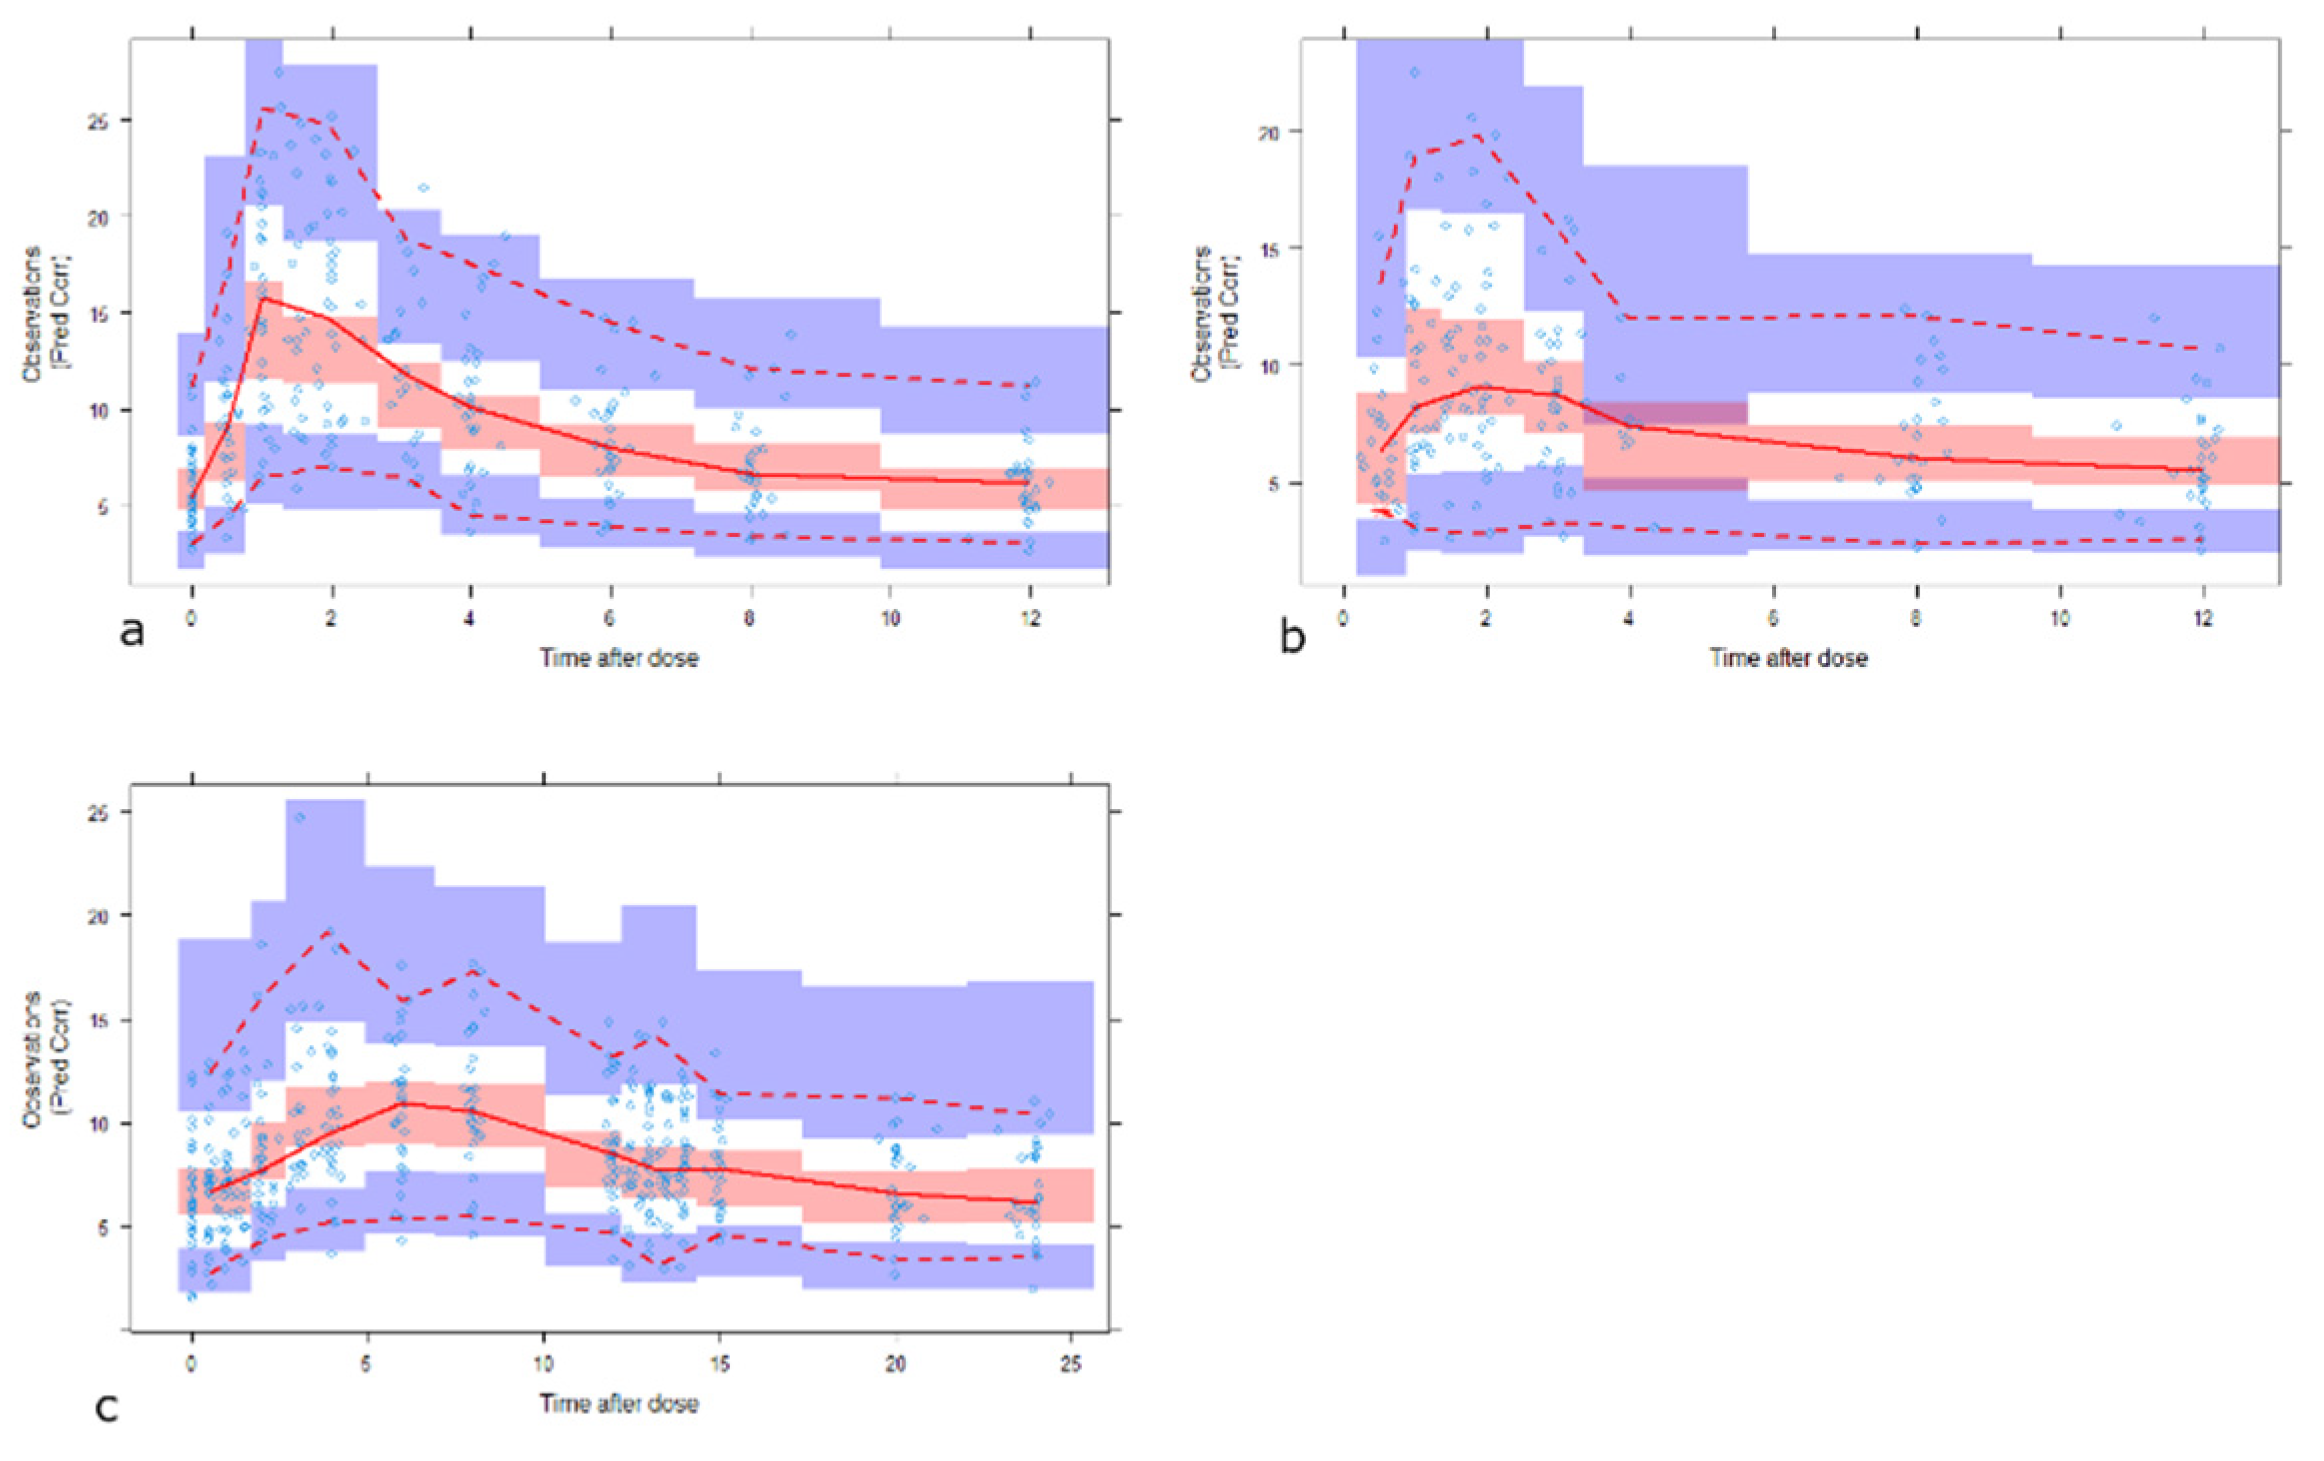
Figure 3.
Boxplots of simulated Areas Under the Curve at steady-state conditions (AUC24) for IR-Tac and LCP-Tac after IR-Tac total daily doses from 3 to 6 mg (equivalent to 0.042 to 0.085 mg/kg based on 70 kg of bodyweight, in steps of 1 mg) and conversion ratios from 0.5 to 1 (in steps of 0.1). Lower and upper box limits represent the first and the third quartile. Outliers are not shown. The middle solid line is the median.
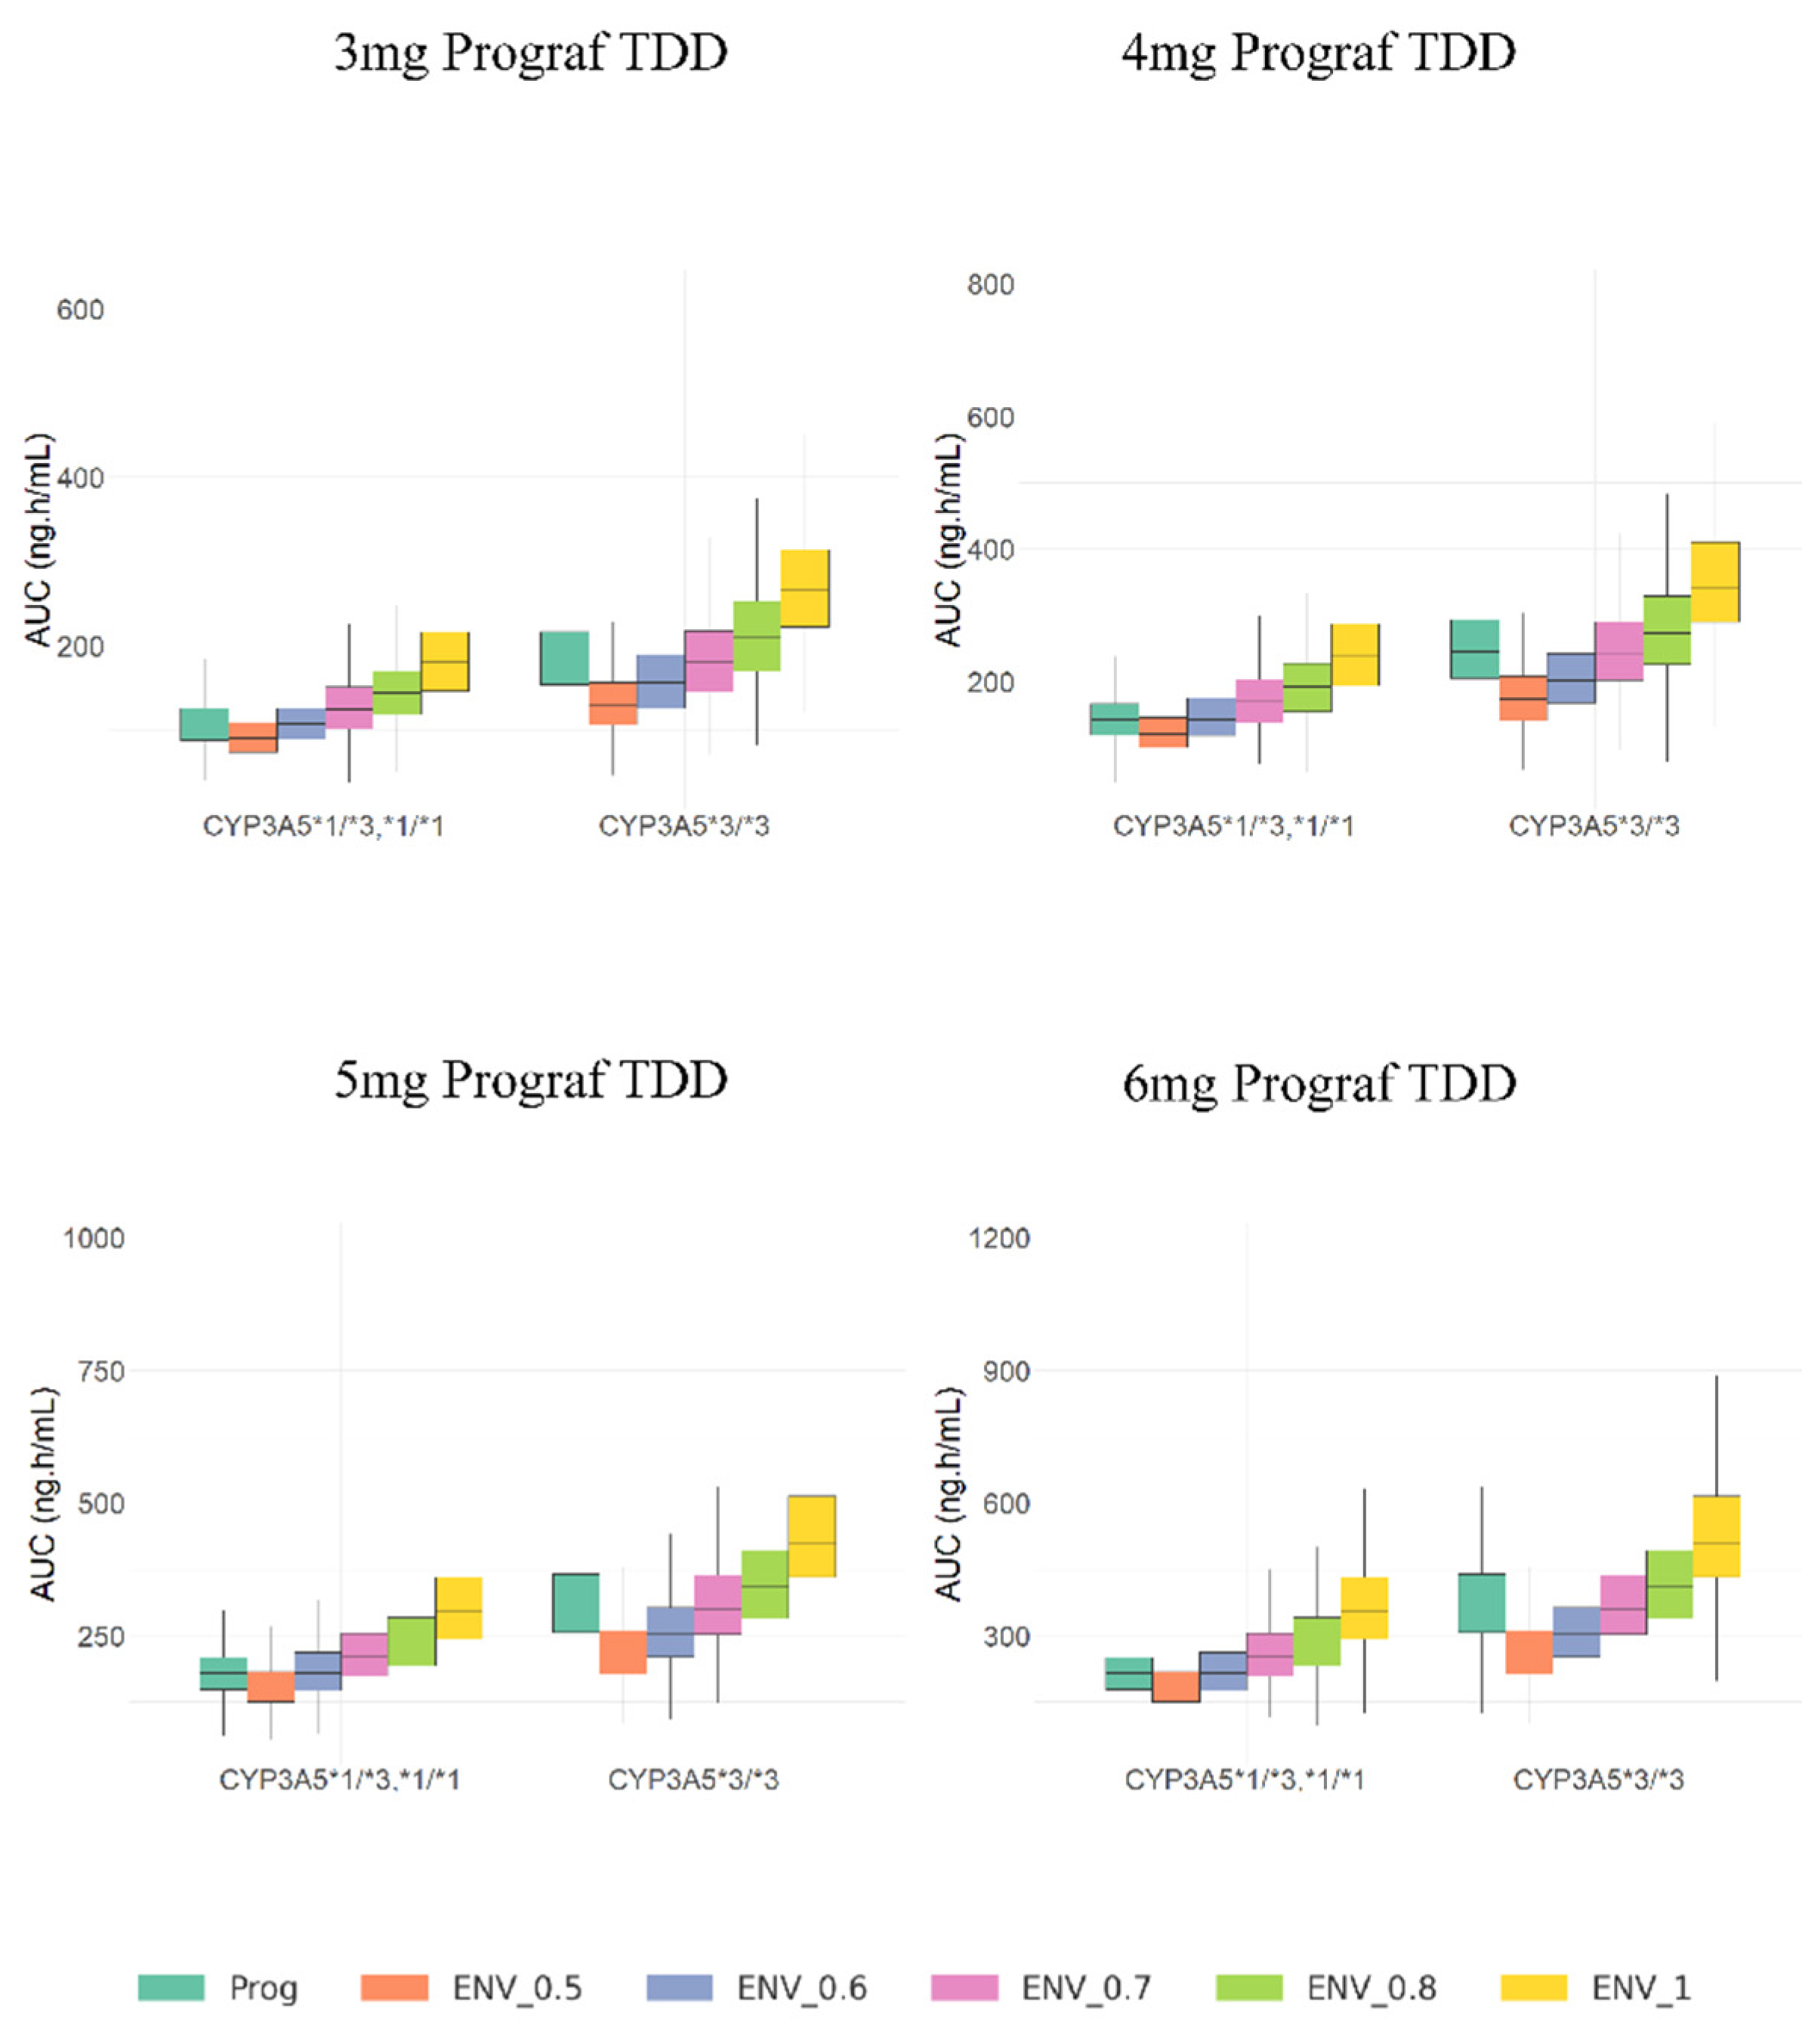
Figure 4.
Boxplots of simulated Ctrough values at steady-state conditions for IR-Tac and LCP-Tac after IR-Tac total daily doses from 3 to 6 mg (equivalent to 0.042 to 0.085 mg/kg based on 70 kg of bodyweight, in steps of 1 mg) and conversion ratios from 0.5 to 1 (in steps of 0.1). Lower and upper box limits represent the first and the third quartile. Outliers are not shown. The middle solid line is the median.
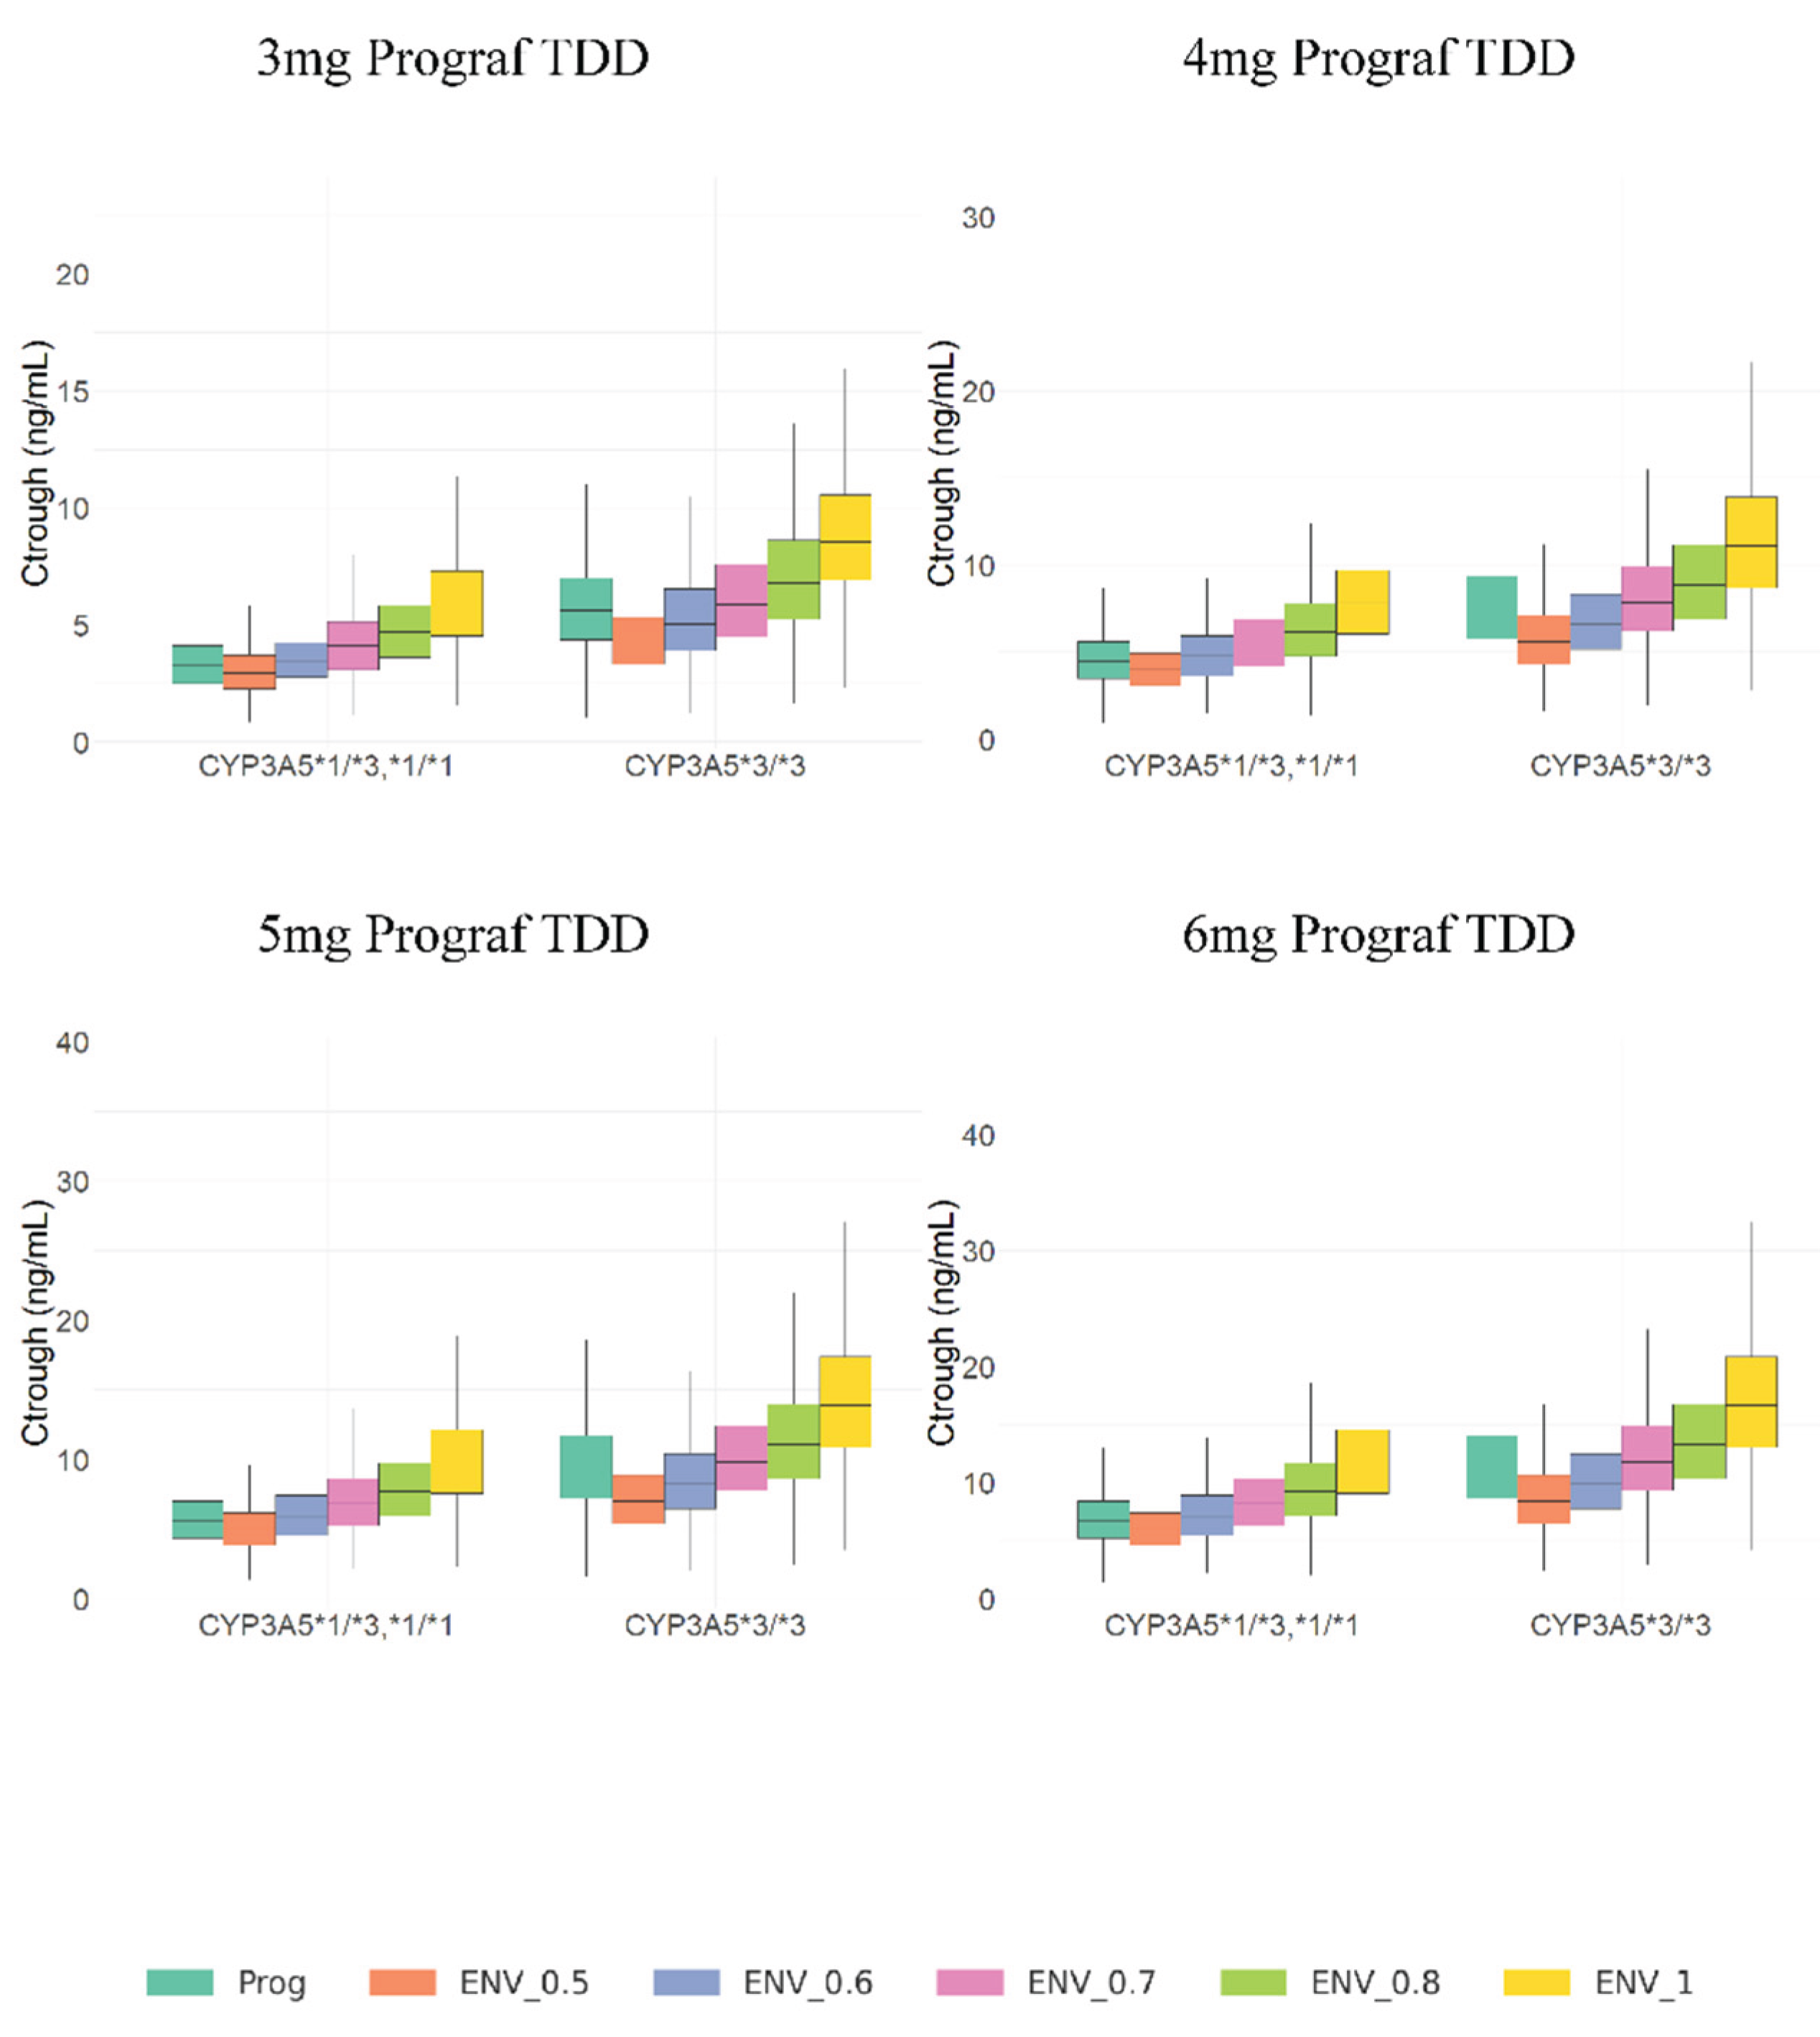

Table 1.
Demographic, biochemical and clinical characteristics of the patients included in the study.
Table 1.
Demographic, biochemical and clinical characteristics of the patients included in the study.
| Characteristics | IR-Tac | LCP-Tac |
| Patients (n) | 30 | 30 |
| Samplings (n) | 481 | 451 |
| Gender Male/Female, n/n) | 22/8 | 22/8 |
| Weight (Kg) | 72 (64-80) | 73 (64-80) |
| Age (Years) | 58 (48-68) | 58 (48-68) |
| BMI (Kg.m-2) | 26 (21.5-29.3) | 27 (21.5-29.3) |
| HTC (%) | 40.9 (37.6-44.8) | 40.1 (37.1-43) |
| GFR (mL.min-1) | 49.6 (34-57) | 49.3 (42-58) |
| Cr (μmol.L-1) | 141.9 (108-166) | 147.6 (111-155) |
| CYP3A5 Genotype | ||
| *1/*3 n (%) | 9 (30%) | 9 (30%) |
| *1/*1 n (%) | 1 (3%) | 1 (3%) |
| *3/*3 n (%) | 20 (67%) | 20 (67%) |
Values are given as arithmetic mean (interquartile range) for continuous variables, and as count (n) or count and percentage for categorical variables BMI, body mass index; HTC, hematocrit; GFR, glomerular filtration rate estimated by the CKD-EPI formula; Cr, serum creatinine.
Table 2.
Comparative Ctrough and AUC24 values sorted by formulation and CYP3A5 genotypes normalized by dose values are also presented.
Table 2.
Comparative Ctrough and AUC24 values sorted by formulation and CYP3A5 genotypes normalized by dose values are also presented.
|
Formulation / Genotype Group |
Dose (mg.day-1) | N |
Ctrough (ng.mL-1) |
Ctrough/D |
AUC24 (ng.h.mL-1) |
AUC24/D | Relative Bioavailability |
p-Value |
| IR-Tac | ||||||||
| CYP3A5 *1/*1, *1/*3 | 5 (3-12) | 20 | 4.9 (4.6-5.2) | 1.6(1.4-2) | 195 (184-224) | 32 (27-43) | ||
| LCP-Tac | 0.60 | <0.001 * | ||||||
| CYP3A5 *1/*1, *1/*3 | 3.75 (2-8.5) | 10 | 5.6 (4.5-6.7) | 1.28 (0.9-1.8) | 232(173-286) | 53 (38-71) | ||
| IR-Tac | ||||||||
| CYP3A5 *3/*3 | 3 (1.5-8) | 20 | 5.7 (4.7-7.2) | 3.6(2.9-4.6) | 212 (169-250) | 68 (56-81) | <0.001 # | |
| LCP-Tac | 0.72 | |||||||
| CYP3A5 *3/*3 | 2 (1-4.75) | 10 | 5.7 (4.7-6.7) | 2.7(2.2-3.3) | 199 (163-265) | 94 (76-122) |
AUC24; Area Under the blood Concentration-Time Curve from 0 to 24 hours. Ctrough: trough blood concentrations. Values are given as geometric means (Interquartile range) for AUC24 and Ctrough. Dose are expressed as median (range). p-values are statistical comparisons for mean AUC/D values, * differences between IR-Tac and LCP-Tac for CYP3A5 expresser, # differences between IR-Tac and LCP-Tac for CYP3A5 non-expresser.
Table 3.
Tacrolimus population pharmacokinetic parameter estimates and bootstrap results for the final model.
Table 3.
Tacrolimus population pharmacokinetic parameter estimates and bootstrap results for the final model.
| Final model parameter estimates (RSE%) | Bootstrap results * | |||||
| Parameter | Description | Value | Bootstrap median | 90 % CI | ||
| Disposition PK parameters | ||||||
| CL/F (L.h-1) | Apparent Elimination Clearance | 11.9 (8.5%) | 11.85 | 10.34-13.53 | ||
| Vc/F (L) | Apparent Distribution Volume of central compartment | 78 (14.7%) | 81 | 63-100.22 | ||
| CLd/F (L.h-1) | Apparent Distributional Clearance | 25.8 (8.5%) | 25.75 | 22.08-29.39 | ||
| Vp/F (L) | Apparent Distribution Volume of peripheral compartment | 500 FIX | - | - | ||
| Absorption parameters | ||||||
| Ka IR-Tac | Absorption rate constant (IR-Tac) | 2.04 (40%) | 2.17 | 1.23-3.72 | ||
| Ka LCP_Tac | Absorption rate constant (LCP-Tac) | 0.111 (16.9%) | 0.115 | 0.08-0.15 | ||
| F LCP-Tac_PM | Reference group for Relative Bioavilability (LCP-Tac_CYP3A5*1 non-expresser) | 1 FIX | - | - | ||
| F IR-Tac_PM | Relative bioavailability of IR-Tac_ CYP3A5*1 non-expresser compared to reference | 0.745 (7.6%) | 0.757 | 0.66-0.84 | ||
| F LCP-Tac_HM | Relative bioavailability of LCP-Tac_CYP3A5*1 expresser compared to reference | 0.693 (13.7%) | 0.695 | 0.52-0.85 | ||
| F IR-Tac_HM | Relative bioavailability of IR-Tac_ CYP3A5*1 expresser compared to reference | 0.427 (13.4%) | 0.428 | 0.34-0.52 | ||
| Lag-Time IR-Tac(h) | lag time for IR-Tac formulation in hours | 0.465 (0.1%) | 0.465 | 0.42-0.47 | ||
| Lag-Time LCP-Tac(h) | lag time for LCP-Tac formulation in hours | 1.4 (2.4%) | 1.39 | 1.32-1.57 | ||
| Circadian rhythms parameters | ||||||
| AcrophaseCL/F (h) | peak time of the cosine function | 17 (3.6%) | 16.94 | 15.94-17.98 | ||
| AmpCL/F | Amplitude | 3.42 (17.1%) | 3.41 | 2.33-4.39 | ||
| Acrophaseka (h) | peak time of the cosine function | 3.13 (18.3%) | 3.17 | 1.82-4.52 | ||
| Ampka | Amplitude | 1.55 (44.5%) | 1.64 | 0.91-2.97 | ||
| RE. (-) | Combined residual error | 13.30 (8.2%) | 13.11 | 11.83-14.14 | ||
| Interindividual patient variability | Description |
CV% (RSE %) |
||||
| IIVCL/F | IIV associated with Elimination Clearance | 26.49 (29.1%) | 25.49 | 18.7-31.14 | ||
| IIV Vc/F | IIV associated with Distribution Volume of central compartment | 53.47 (42%) | 52.15 | 33.46-72.20 | ||
| Vc/F / Ka IR-Tac Correlation | Correlation between IIV of Vc/F and Ka of IR-Tac | 75.63(16%) | 72.3 | 43-92.33 | ||
| Vc/F / Ka LCP-Tac Correlation | Correlation between IIV of Vc/F and Ka of LCP-Tac | 44.38(10%) | 44.11 | 12.76-65.68 | ||
| IIV Ka IR-Tac | IIV associated with Absorption rate constant (IR-Tac) | 150.66 (25.6%) | 146.62 | 87.6-184.44 | ||
| Ka IR-Tac/ Ka LCP-Tac Correlation | Correlation between IIV of Ka IR-Tac and Ka LCP-Tac | 45(20.3%) | 41.24 | 38.69-75.55 | ||
| IIV Ka LCP_Tac | IIV associated with Absorption rate constant (LCP-Tac) | 67.23 (46.5%) | 72.25 | 46.96-88.67 | ||
| IOVCL | IOV associated with Elimination Clearance | 20.85 (23.9%) | 20 | 16.9-24.51 | ||
| IOV Vc | IOV associated with Distribution Volume of central compartment | 58.82 (28.9%) | 58.05 | 38.47-72 | ||
RSE: Relative Standard Error; IIV: Inter-Individual Variability; IOV: Inter occasion variability; CV: Coefficient of variation; CI: Confidence interval. *Non-parametric Bootstrap results based on 756 successful resampling from a total of 1000.
Disclaimer/Publisher’s Note: The statements, opinions and data contained in all publications are solely those of the individual author(s) and contributor(s) and not of MDPI and/or the editor(s). MDPI and/or the editor(s) disclaim responsibility for any injury to people or property resulting from any ideas, methods, instructions or products referred to in the content. |
© 2025 by the authors. Licensee MDPI, Basel, Switzerland. This article is an open access article distributed under the terms and conditions of the Creative Commons Attribution (CC BY) license (http://creativecommons.org/licenses/by/4.0/).
Copyright: This open access article is published under a Creative Commons CC BY 4.0 license, which permit the free download, distribution, and reuse, provided that the author and preprint are cited in any reuse.


