Submitted:
26 July 2025
Posted:
30 July 2025
You are already at the latest version
Abstract
Background: Malnutrition is a major public health concern among older adults in low- and middle-income countries, contributing to increased morbidity, functional decline, and mortality. In Ethiopia, the population aged 60 years and older is projected to rise steadily, yet data on their nutritional status remain scarce. This study aimed to assess the nutritional status and associated factors among adults aged 65 years and older in Harar town, Eastern Ethiopia. Methods: A community-based cross-sectional study was conducted from April 30 to May 29, 2023, among 413 randomly selected adults aged ≥ 65 years in Harar town. Nutritional status was assessed using the validated Mini Nutritional Assessment–Short Form (MNA-SF). Data were entered into EpiData v3.1 and analyzed in SPSS v25. Bivariate and multivariable logistic regression identified factors associated with malnutrition. Crude and adjusted odds ratios (AOR) with 95% confidence intervals (CI) were reported, with statistical significance set at p < 0.05. Results: The prevalence of malnutrition was 15.2% (95% CI: 0.18–1.91), and 43.6% (95% CI: 0.38–0.48) were at risk of malnutrition. Factors significantly associated with malnutrition included older age groups from 75 to 84 years (AOR = 4.45; 95% CI: 1.25–15.77) and 85 to 95 years (AOR = 6.54; 95% CI: 1.36–31.31), low educational attainment (AOR = 6.15; 95% CI: 1.26–29.9), recent illness (AOR = 3.16; 95% CI: 1.07–9.26), presence of chronic illness (AOR = 6.48; 95% CI: 2.22–18.86), and poor dietary diversity (AOR = 6.25; 95% CI: 1.38–28.10). Household food insecurity, mild (AOR = 5.62; 95% CI: 1.35–23.30), moderate (AOR = 6.67; 95% CI: 1.69–26.38), and severe (AOR = 6.92; 95% CI: 1.05–45.22), was consistently associated with increased odds of malnutrition.Conclusion: Malnutrition and its risk are common among older adults in Harar town. Key factors include advanced age, chronic illness, poor dietary diversity, and household food insecurity. Public health interventions should focus on improving dietary intake, strengthening nutrition education for older adults and caregivers, and addressing household food insecurity.
Keywords:
older adults
; ≥ 65
; nutritional status
; dietary diversity
; food insecurity
; chronic illness
; Ethiopia
Introduction
The global population is experiencing a major demographic transition as people are living longer worldwide. Between 2015 and 2050, the percentage of individuals ≥ 65 years old is forecast to rise significantly from 12% to 22%. For the first time, there are now more seniors than children under 5 years old globally. This rapid aging trend is occurring most quickly in developing nations. Approximately 80% of the world's older population is estimated to reside in low- and middle-income countries by 2050. The number of adults ≥ 65 living in these nations is expected to triple from 524 million in 2010 to 1.5 billion in 2050, according to the World Health Organization’s projections1. Ethiopia’s population had a life expectancy of 63 years in 2018, according to the World Factbook from December 7, 2019, which reflects steady gains in population survival2. Metrics based on age structure, such as the potential support ratio, often rely on age thresholds like 65, 60, or 70 years to define the “old-age” bracket and assess societal support systems3.
Older individuals in Ethiopia face numerous socioeconomic challenges, including homelessness, financial exploitation, and neglect, largely stemming from the absence of state income assistance and a lack of targeted social protection. These hardships are closely linked to household food insecurity and inadequate dietary diversity, which contribute to high rates of malnutrition and chronic illness. Despite being home to more than 5 million senior citizens, Ethiopia does not have a national aging strategy or formally defined benefits for elderly populations4. As nutritional problems and noncommunicable diseases rise among the elderly globally, malnutrition has emerged as a significant public health problem among older adults, particularly in developing countries5,6. Changes in lifestyle and diet, in combination with underlying poverty, have led to a dual burden of disease where undernutrition and overnutrition coexist, resulting in increased mortality and economic loss among older populations in low-income societies like Ethiopia.
The nutritional health of the elderly is shaped by numerous social factors, chronic health conditions, and pharmaceutical use, which can interfere with nutrient absorption. Physiological changes brought on by aging, including declines in sensory perception, hormonal regulation, gastrointestinal function, renal capacity, and muscle mass, also alter nutritional requirements. Dietary allowances are designed to meet the needs of healthy older adults, but survey data show that many within this group are unable to fulfill their nutritional needs due to functional limitations and social barriers. Kaur et al. (2019) suggest that a segment of the senior population is especially susceptible to nutritional deficiencies, with compounding vulnerabilities7. Malnutrition affects approximately one in every six older individuals, and this figure is expected to increase as global aging accelerates. Cawood et al. (2012) and Leslie & Hankey (2015) report that malnutrition is associated with a 30% increase in hospital readmission rates among older adults, representing a major burden for both individuals and national healthcare systems8,9. Unfortunately, malnutrition in older populations often goes unrecognized due to inadequate routine screening and assessment.
In Ethiopia, nearly one-third of older adults experience some form of physical or sensory limitation, including difficulties with vision, mobility, and hearing that impair their ability to access and utilize food. While a minority of older adults receive pensions, the majority, especially in rural settings, remain dependent on support from relatives10. Malnutrition among older adults is defined as a state of poor nutritional status resulting from insufficient or imbalanced nutrient intake. It is associated with adverse health outcomes such as physical pain, anxiety, and depression. Factors such as feeding difficulties, reduced mobility, psychological stress, widowhood, illiteracy, caregiving responsibilities, poverty, and limited access to health and social services further elevate the risk of malnutrition in the elderly. Mezemir et al. (2020) argue that older adults, often overlooked, represent a vital societal resource who require protection and investment. Timely diagnosis and identification of malnutrition and its risk factors are essential to design effective public health interventions targeted at this vulnerable group11.
Ethiopia currently faces a silent public health crisis. Malnutrition among older adults is estimated to affect more than 20% nationwide, significantly diminishing quality of life and personal well-being. This vulnerability is not just a numerical burden; it is a profound threat to the foundations of health and dignity in later life. Yet despite its magnitude, this issue has received insufficient research attention. Ethiopia has one of the highest rates of older adult malnutrition in Africa, surpassing the continental average of 18%12. In the northwest region, studies estimate malnutrition prevalence rates between 9% and 22%13. The situation is more severe in eastern Ethiopia, where over half of older adults (51.7%) are classified at risk of malnutrition and another 15.7% are already malnourished14.
Despite its growing importance, research on older adult malnutrition in Ethiopia remains limited. Existing studies disproportionately focus on children and general adult populations, leaving geriatric nutritional needs poorly understood and largely neglected. This lack of targeted research has dire consequences. Chronic diseases, urban residency, depression, and food insecurity act as potent risk factors that compound malnutrition and undermine the health and independence of elderly individuals. Policymakers and healthcare workers, hampered by a lack of comprehensive data and assessment tools, are unable to address the issue effectively and equitably.
The consequences extend far beyond statistics. Malnutrition exacerbates existing health conditions, limits functional autonomy, and erodes the overall vitality of older adults. The absence of community-level data creates challenges for decision-makers, who struggle to allocate resources, establish support systems, and create evidence-based programs to mitigate these risks. This study aims to fill that knowledge gap by establishing a detailed baseline on the prevalence and determinants of malnutrition among older adults in Harar town, eastern Ethiopia. In doing so, it seeks not only to shed light on a neglected issue but also to catalyze the development of tailored interventions, screening protocols, and public health strategies that uphold the health, dignity, and agency of Ethiopia’s aging population.
By presenting robust, community-based evidence, this research affirms that the lives of older adults matter. It challenges the silence surrounding malnutrition and calls for urgent, coordinated action. Through better data, we can begin to craft a future where aging is supported with care, where nutritional health is a right and not a privilege, and where every individual, regardless of age, can thrive.
Methodology
Study Area and Period
A community-based cross-sectional study was conducted in Harar Town, Eastern Ethiopia, from April 30 to May 29, 2023. Harar is located approximately 526 kilometers east of Addis Ababa and had an estimated population of 263,657, consisting of 100,126 males and 98,854 females. 49.5% of the population is estimated to be rural inhabitants, while 50.5% are urban dwellers, which is around 137,000 (M:F = 124,000:68,000) urban residents15. The region comprises six urban and three rural districts, further subdivided into 19 urban and 17 rural kebeles, which are the smallest administrative units in Ethiopia.
Study Design
A quantitative cross-sectional design was employed to assess the nutritional status and associated factors among older adults aged 65 years and above.
Study Population and Eligibility
The source population for this study included all adults aged 65 years and above residing in Harar Town, Eastern Ethiopia. These individuals represent a growing segment of the population who are particularly vulnerable to nutritional challenges due to physiological aging, comorbidities, and socio-economic constraints. The study population specifically consisted of older adults aged 65 years and above who were residing in the selected kebeles during the time of data collection. Only individuals who were physically present, cognitively able, and willing to participate were included in the final sample. This defined population allowed for the assessment of nutritional status and associated factors within a community-based context, ensuring representativeness and relevance to the broader elderly population in urban Harar.
Sample Size Determination and Sampling Technique
The sample size for the first objective was calculated using a single population proportion formula, assuming a 95% confidence level, a 5% margin of error, a prevalence of 20.53% 16, and a design effect of 1.5. Including a 10% non-response rate, the final sample size was 413.
Considering a 10% non-response rate, the sample size becomes 413.
For the second specific objective, to assess factors associated with nutritional status, a separate sample size calculation was performed using Epi Info version 7.1.5. This was based on key assumptions, including a 95% confidence interval, 80% power, estimated proportions of exposure among cases and controls, and an odds ratio from previous studies. The estimated required sample size for this objective was 207 participants. However, since the required sample size for the first objective (413) was larger and sufficient to detect associations, it was adopted as the final sample size for the study.
A multistage sampling technique was applied. Initially, five kebeles (04, 05, 09, 14, and 17) were randomly selected from the 19 kebeles in Harar Town using Random Number Generator Software version 3.1. The total sample was then proportionally allocated across the selected kebeles based on the population of older adults in each area: 19.1% from kebele 04, 19.9% from kebele 05, 19.2% from kebele 09, 20% from kebele 14, and 21.8% from kebele 17. Within each kebele, participants were then selected using a simple random sampling approach, aiming to enhance the representativeness of the study population.
Data Collection Methods
Data collection in Harar Town was conducted through face-to-face interviews using a structured and pre-tested questionnaire. Anthropometric measurements (height and weight) were taken using calibrated scales. The questionnaire included the Mini Nutritional Assessment–Short Form (MNA-SF), a globally validated tool developed by the Nestlé Nutrition Institute17, with 90% sensitivity and 80% specificity. Its effectiveness, affordability, and speed make it ideal for identifying malnutrition and its risk among older adults, allowing for timely interventions18,19.
Dietary Diversity Score (DDS) was assessed using a 24-hour recall, with scores calculated based on the number of food groups consumed out of twelve food groups20. Household food security was measured using the Household Food Insecurity Access Scale (HFIAS), which captures experiences of food insufficiency and access limitations21. Together, MNA-SF, DDS, and HFIAS provided a comprehensive assessment of nutritional status and household food conditions in the study population.
Anthropometric Measurements
Weight and height were measured using calibrated digital scales and stadiometers to the nearest 0.1 kg and 0.1 cm, respectively. Participants wore light clothing and no shoes. Body Mass Index (BMI) was subsequently calculated22.
Data Collection Process
Four trained data collectors and two supervisors conducted data collection. Questionnaires were translated into Amharic and Afaan Oromo and then back-translated to English. Daily review of completed forms ensured data completeness and accuracy. Before the actual data collection, the questionnaire was pretested (10% of the total sample size) in one of the selected kebeles, which were not in the study. The purpose of pretesting is to ensure that respondents can understand the questions and to verify the wording, logical sequence, and skip patterns of the questions. Modification on the questionnaire was to be made accordingly after the pretest. Data was collected for one month with the respective data collectors and supervisors.
Study Variables
- Dependent Variable: Nutritional status (MNA-SF score: 0–7 = malnourished, 8–11 = at risk, 12–14 = normal) 17,23.
- Independent Variables: Socio-demographic characteristics, health conditions (e.g., chronic illness, recent illness, medication use), functional status, dietary diversity, feeding practices, and food insecurity.
Operational Definitions
- Dietary Diversity: Low (≤3 food groups), medium (4–5), or high (≥6) based on HDDS classification24.
- Feeding Practices: Good (≥3 meals/day), moderate (2 meals/day), or poor (≤1 meal/day)25–27.
- Food Insecurity: Categorized as food secure (0–1), mildly (2–8), moderately (9–16), or severely (17–27) food insecure per HFIAS21.
- Age Grouping: 65–74 = young-old, 75–84 = middle-old, ≥85 = very old28.
Data Quality Assurance
The questionnaire was pretested (10% of the sample) in a non-selected kebele. Data collectors were trained for one day. Supervisors and the principal investigator checked daily for accuracy and completeness. Measurement tools were recalibrated regularly.
Data Processing and Analysis
Data were entered in EpiData 3.1 and analyzed using SPSS v25. Nutritional status was categorized and dichotomized for regression analysis (malnourished/at risk vs. normal). Bivariate logistic regression identified candidate variables (p<0.25) for multivariable regression. Adjusted odds ratios (AOR) with 95% confidence intervals (CI) were calculated29. Model fitness was assessed using the Hosmer–Lemeshow test (p = 0.859), and multicollinearity was checked using VIF (<10)29.
Ethical Considerations
Ethical approval was obtained from the Haramaya University Institutional Health Ethics Review Committee (IHERC) on April 20, 2023 (Ref. #071/2023). Official letters were submitted to local health authorities and zonal health posts. Written informed consent was obtained from participants or caregivers. Privacy and confidentiality were maintained. Participants identified as severely malnourished were referred for clinical support.
Results
Socio-Demographic Characteristics
Of the 401 sampled older adults in Harar Town, 401 completed the interview, yielding a high response rate of 97.1%. The participants had a mean age of 74.22 years (±7.71), ranging from 65 to 92 years. The majority were female (59.1%), and just over half were married (50.6%). Nearly half (44.4%) identified as Muslim. Among caregivers or partners, 22.4% were retired, and 15.7% of participants had attained secondary education (grades 9–12). (Table 1)
Co-Morbidities and Health-Related Factors
Among the 401 respondents, 52.9% (n=212) reported being ill in the past three months. Categorically, 8.5% had gastrointestinal issues, 8.0% cardiovascular problems, 7.0% respiratory illnesses, 4.0% endocrine disorders such as diabetes mellitus (DM), 3.7% musculoskeletal problems, 3.5% urinary issues, 3.2% neurological conditions, 2.7% immune-related illnesses including arthritis and systemic infections, 2.2% hematologic problems like anemia, 2.0% eye-related conditions, 1.5% dental problems, 0.7% cancer, 0.4% surgical issues, and 0.2% dermatologic diseases.
Chronic medical conditions were reported by 43.6% of respondents, with hypertension (16.7%) and DM (12.2%) being the most prevalent, followed by respiratory conditions like asthma or COPD (5.5%), HIV/AIDS (2.5%), and other unspecified illnesses (7.0%). In the two weeks preceding the survey, 39.7% experienced symptoms such as nausea (15.0%), diarrhea (10.5%), constipation and headache (9.5%), and vomiting (5.0%).
Regarding healthcare utilization and medication, 28.7% had visited a health facility, while 38.2% were taking medications. Of these, 13.7% took one medication, 16.5% two, 5.5% took three, and 3.0% took four medications. As for mobility status, 81.8% could move independently, 11.7% required assistance, and 6.5% were unable to move.
Feeding Practice
The majority, 87.8% (352) of the respondents were able to feed themselves, while the rest, 12.2%
(49) needed help from others to eat. Almost one-fourth, 22.4% (90), of the respondents usually
ate alone, while 35.7% (143) sometimes ate alone, 28.9% (116) always ate with family
members, and 13.0% (52) of them sometimes ate with family members. Also, 70.6% (283) of
them had regular feeding habits like breakfast, lunch, snack, and dinner, while 29.4% (118)
responded that they eat when they have access to food. From the respondents, 14.7% (59) of them had difficulty eating, swallowing, and chewing due to an illness. (Figure 1)
Dietary Diversity Score
The mean number of dietary food groups consumed by the respondents in 24 hours was 5.02 ±1.52, with a minimum of three food groups and a maximum of nine. Among the 401 respondents, 20.9% (84) had only three food groups in their diet, 17.7% (71) had four, 25.4% (102) had five food groups, 17.0% (68) had six, 12.5% (50) had seven food groups, 5.7% (23) had eight food groups, and 0.7% (3) had nine food groups in their diet. In summary, 20.9% (84) of the respondents had low dietary diversity intake, 43.1% (173) had medium dietary diversity intake, and the rest, 35.9% (144) of the respondents, had high dietary diversity intake. Figure 2 shows the diversity of consumption of 12 food groups for adults ≥ 65 years of age.
In addition to calculating mean dietary diversity scores, the next table (Table 2) provides information on the foods that are eaten by those with the lowest dietary Analyzing dietary diversity scores and which foods are added by those with a higher score. Dietary patterns are analyzed in this example by looking at the food groups consumed by at least 50% of households under each category. Table 2 shows what dietary diversity in each tertile looks like in Harar; egg, organ, and flesh were consumed by only 1.25% in the low dietary diversity score.
Food Security with Household Food Insecurity Access Scale (HFIAS)
The results, shown in Table 3, indicate a moderate degree of food insecurity among these older adult households based on limited access to adequate, nutritious foods.
Specifically, over half of households (64.8%) reported worrying about having enough food sometimes or often. An even greater proportion (59.4%) were sometimes or often unable to eat their preferred foods. 61.3% of households reported sometimes or often eating a limited variety of foods. More extreme manifestations of hunger were rarer but still experienced by a subset of households. Occasionally, 17.7% reported going to sleep hungry, rarely or sometimes. While few households reported experiencing outright hunger often, the data shows many older adults face challenges accessing nutritious, high-quality diets regularly. This indicates a moderate degree of food insecurity among the surveyed.
About 61.3% of the respondents have had a limited variety of foods, and 62.6% of them do not want the food they eat to have the highest percentage of the total population with restrictions on certain food groups and disinterest. Among 401 households, 11.2% (45) experienced severe food insecurity, 28.7% (115) experienced moderate food insecurity, 27.7% (111) experienced mild food insecurity, and 32.4% (130) were found to be food secure.
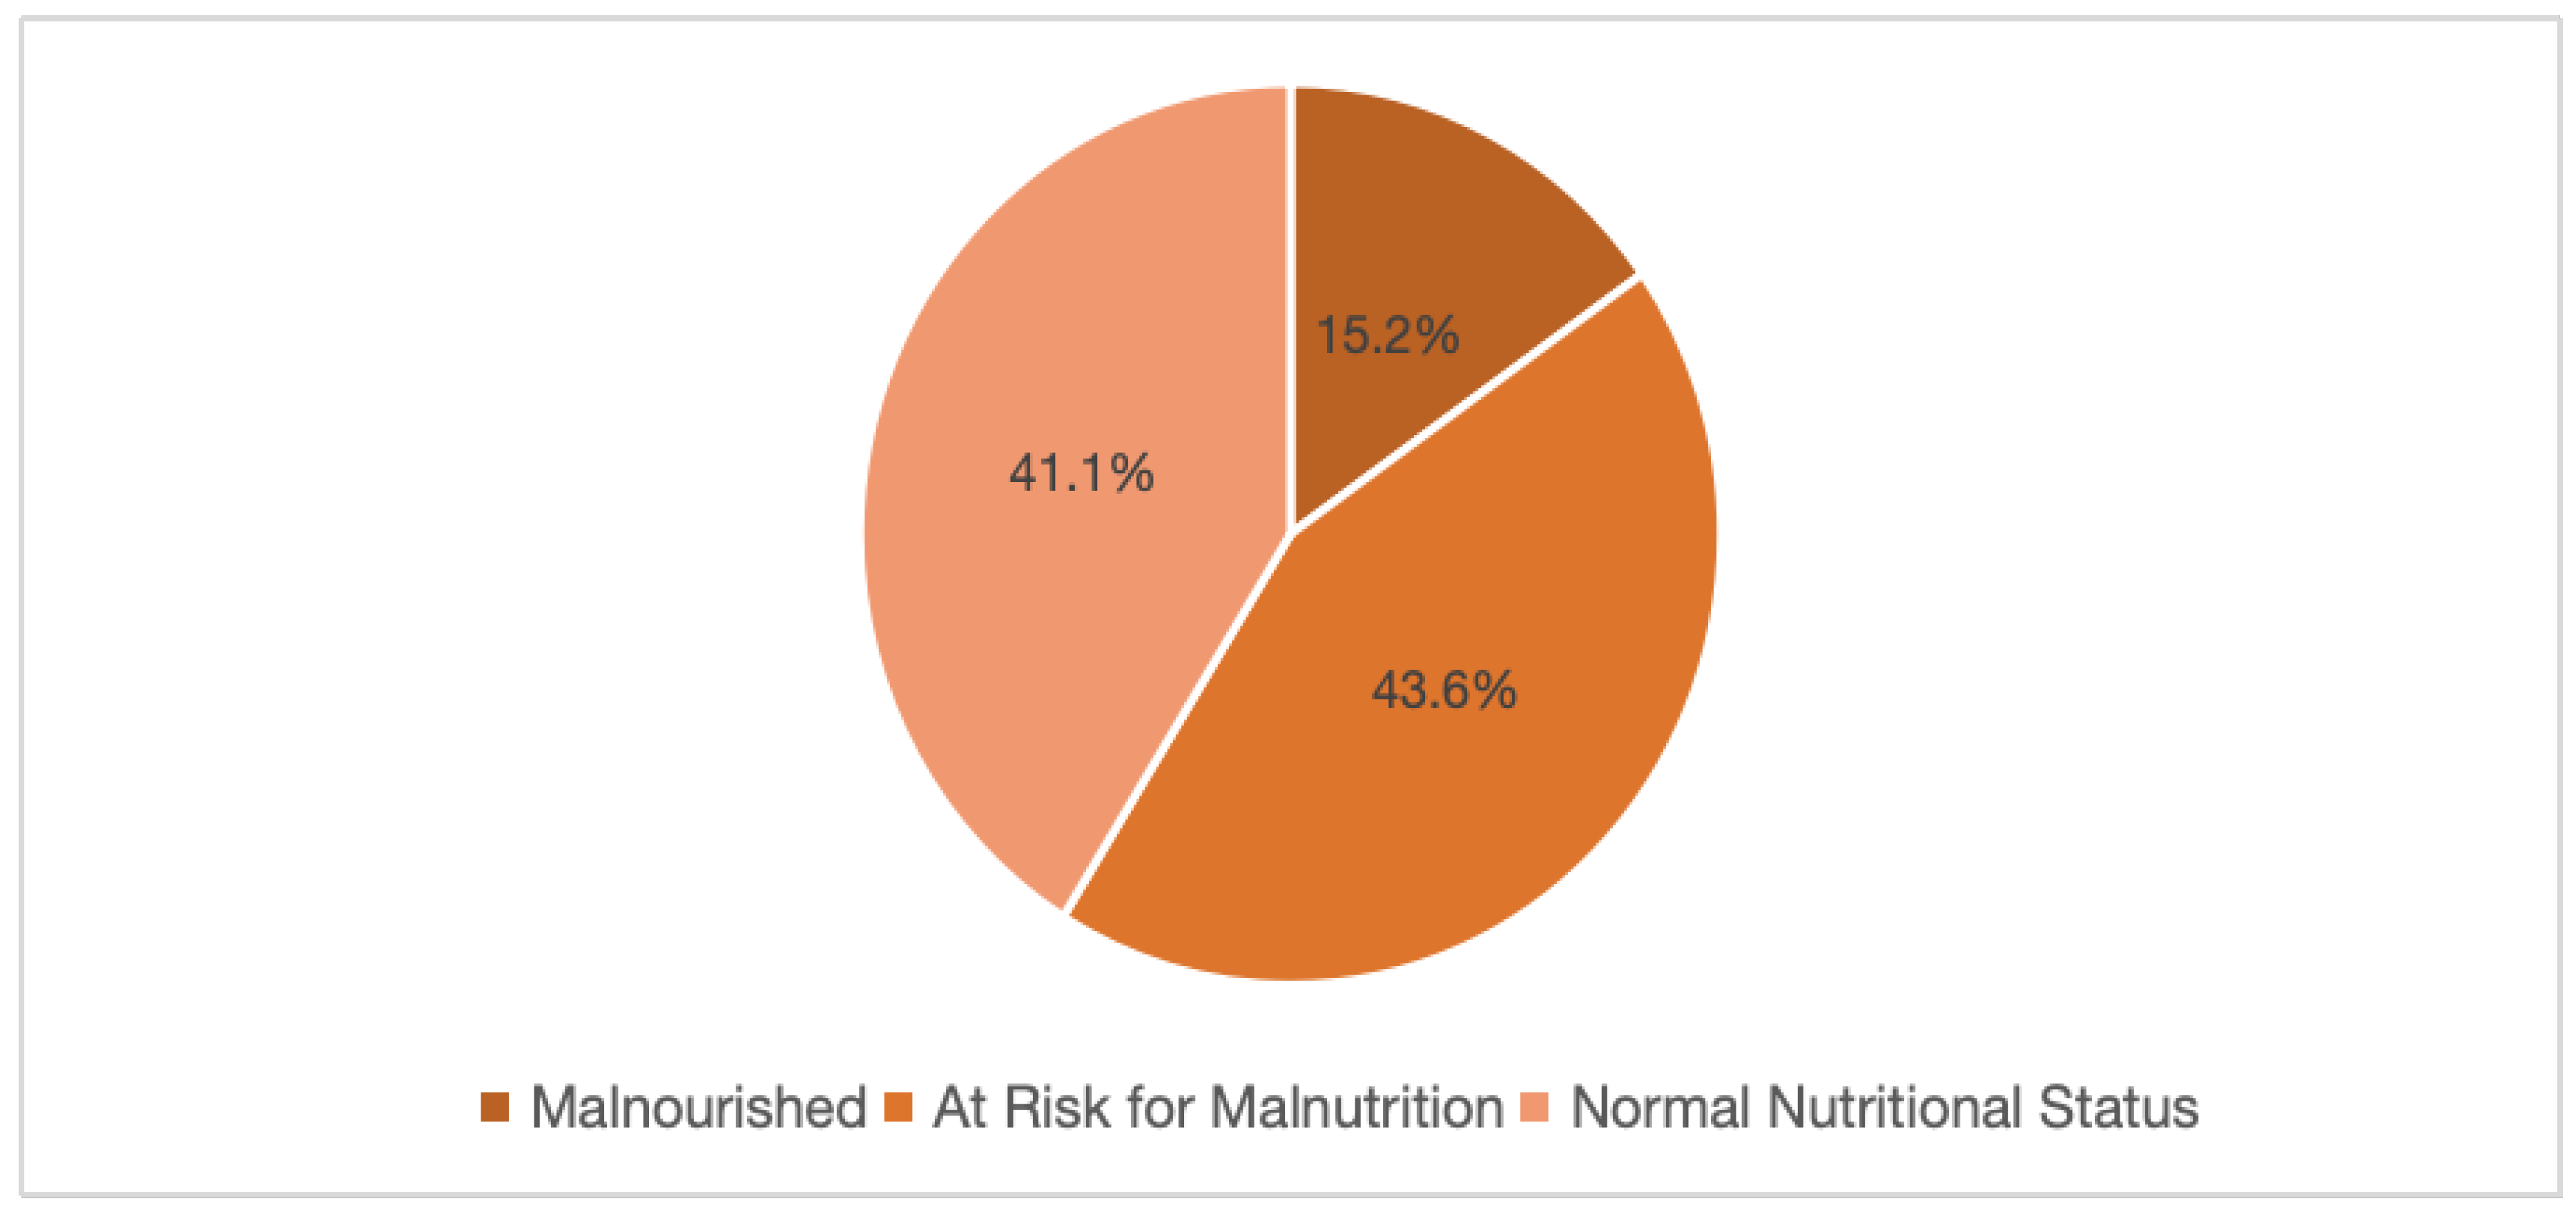
Nutritional Status of Older Adults Above 65 Years
The nutritional status of the older adults was assessed using the Mini Nutritional Assessment
(MNA) A tool that categorizes scores into malnourished, at-risk for malnutrition, or normal
nutritional status. As shown in Figure 3, 15.2% (95% CI: 0.18-0.19) of the adults were
malnourished, 43.6% (95% CI: 0.38-0.48) were at risk for malnutrition, and 41.1% had normal
nutritional status (95% CI: 0.36-0.46).
The descriptive statistics for Body Mass Index (BMI) among the sample of 401 adults over 65
years indicated concerning levels of undernutrition in this older population. The BMI scores
ranged from a minimum of 15 to a maximum of 29, with the mean BMI being 21.37 ± 2.364.
This shows that, on average, the older adults were somewhat underweight, with most individuals
within 2 units of the mean. Considering a BMI <19, underweight was found to be 14.2% (57);
BMI between 19 and 21, normal weight was 41.1% (165); BMI between 21 and 23, and
Overweight was 26.4% (106), and a BMI greater than 23 was obese, 18.2% (73).
Figure 1.
Feeding practice of adults above 65 years in Harar Town, Eastern Ethiopia, 2023 (n=401).
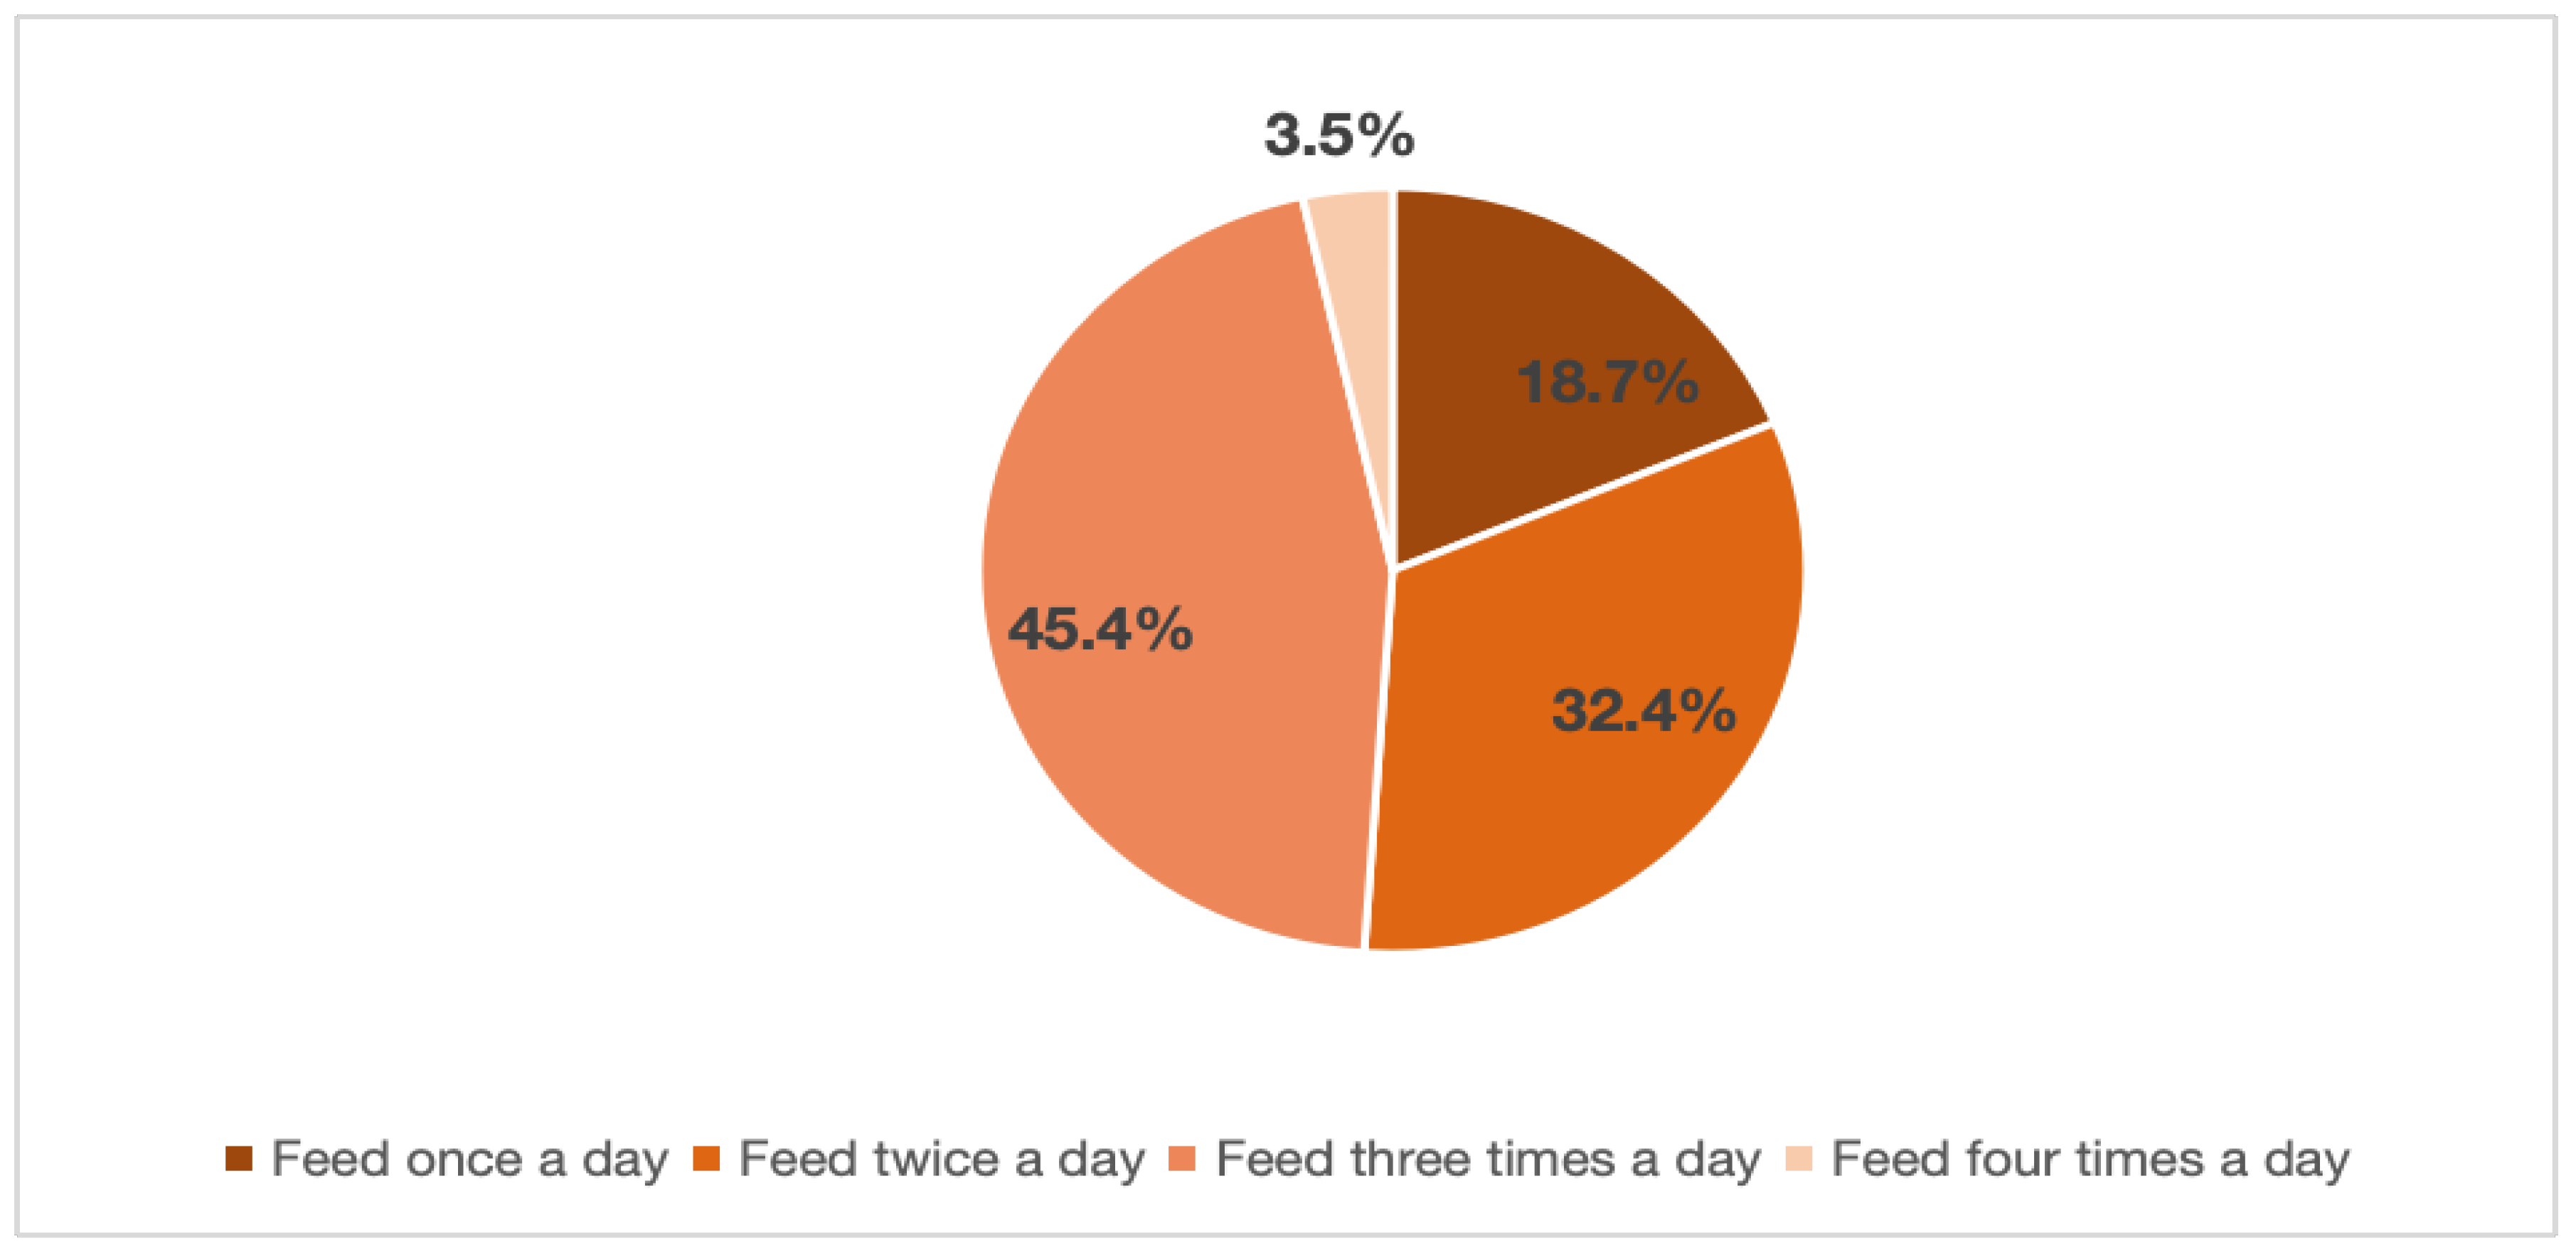
Figure 2.
Percentage of adults consuming the 12 different food groups in adults above 65 years in Harar Town, Eastern Ethiopia, 2023 (n=401).
Figure 2.
Percentage of adults consuming the 12 different food groups in adults above 65 years in Harar Town, Eastern Ethiopia, 2023 (n=401).
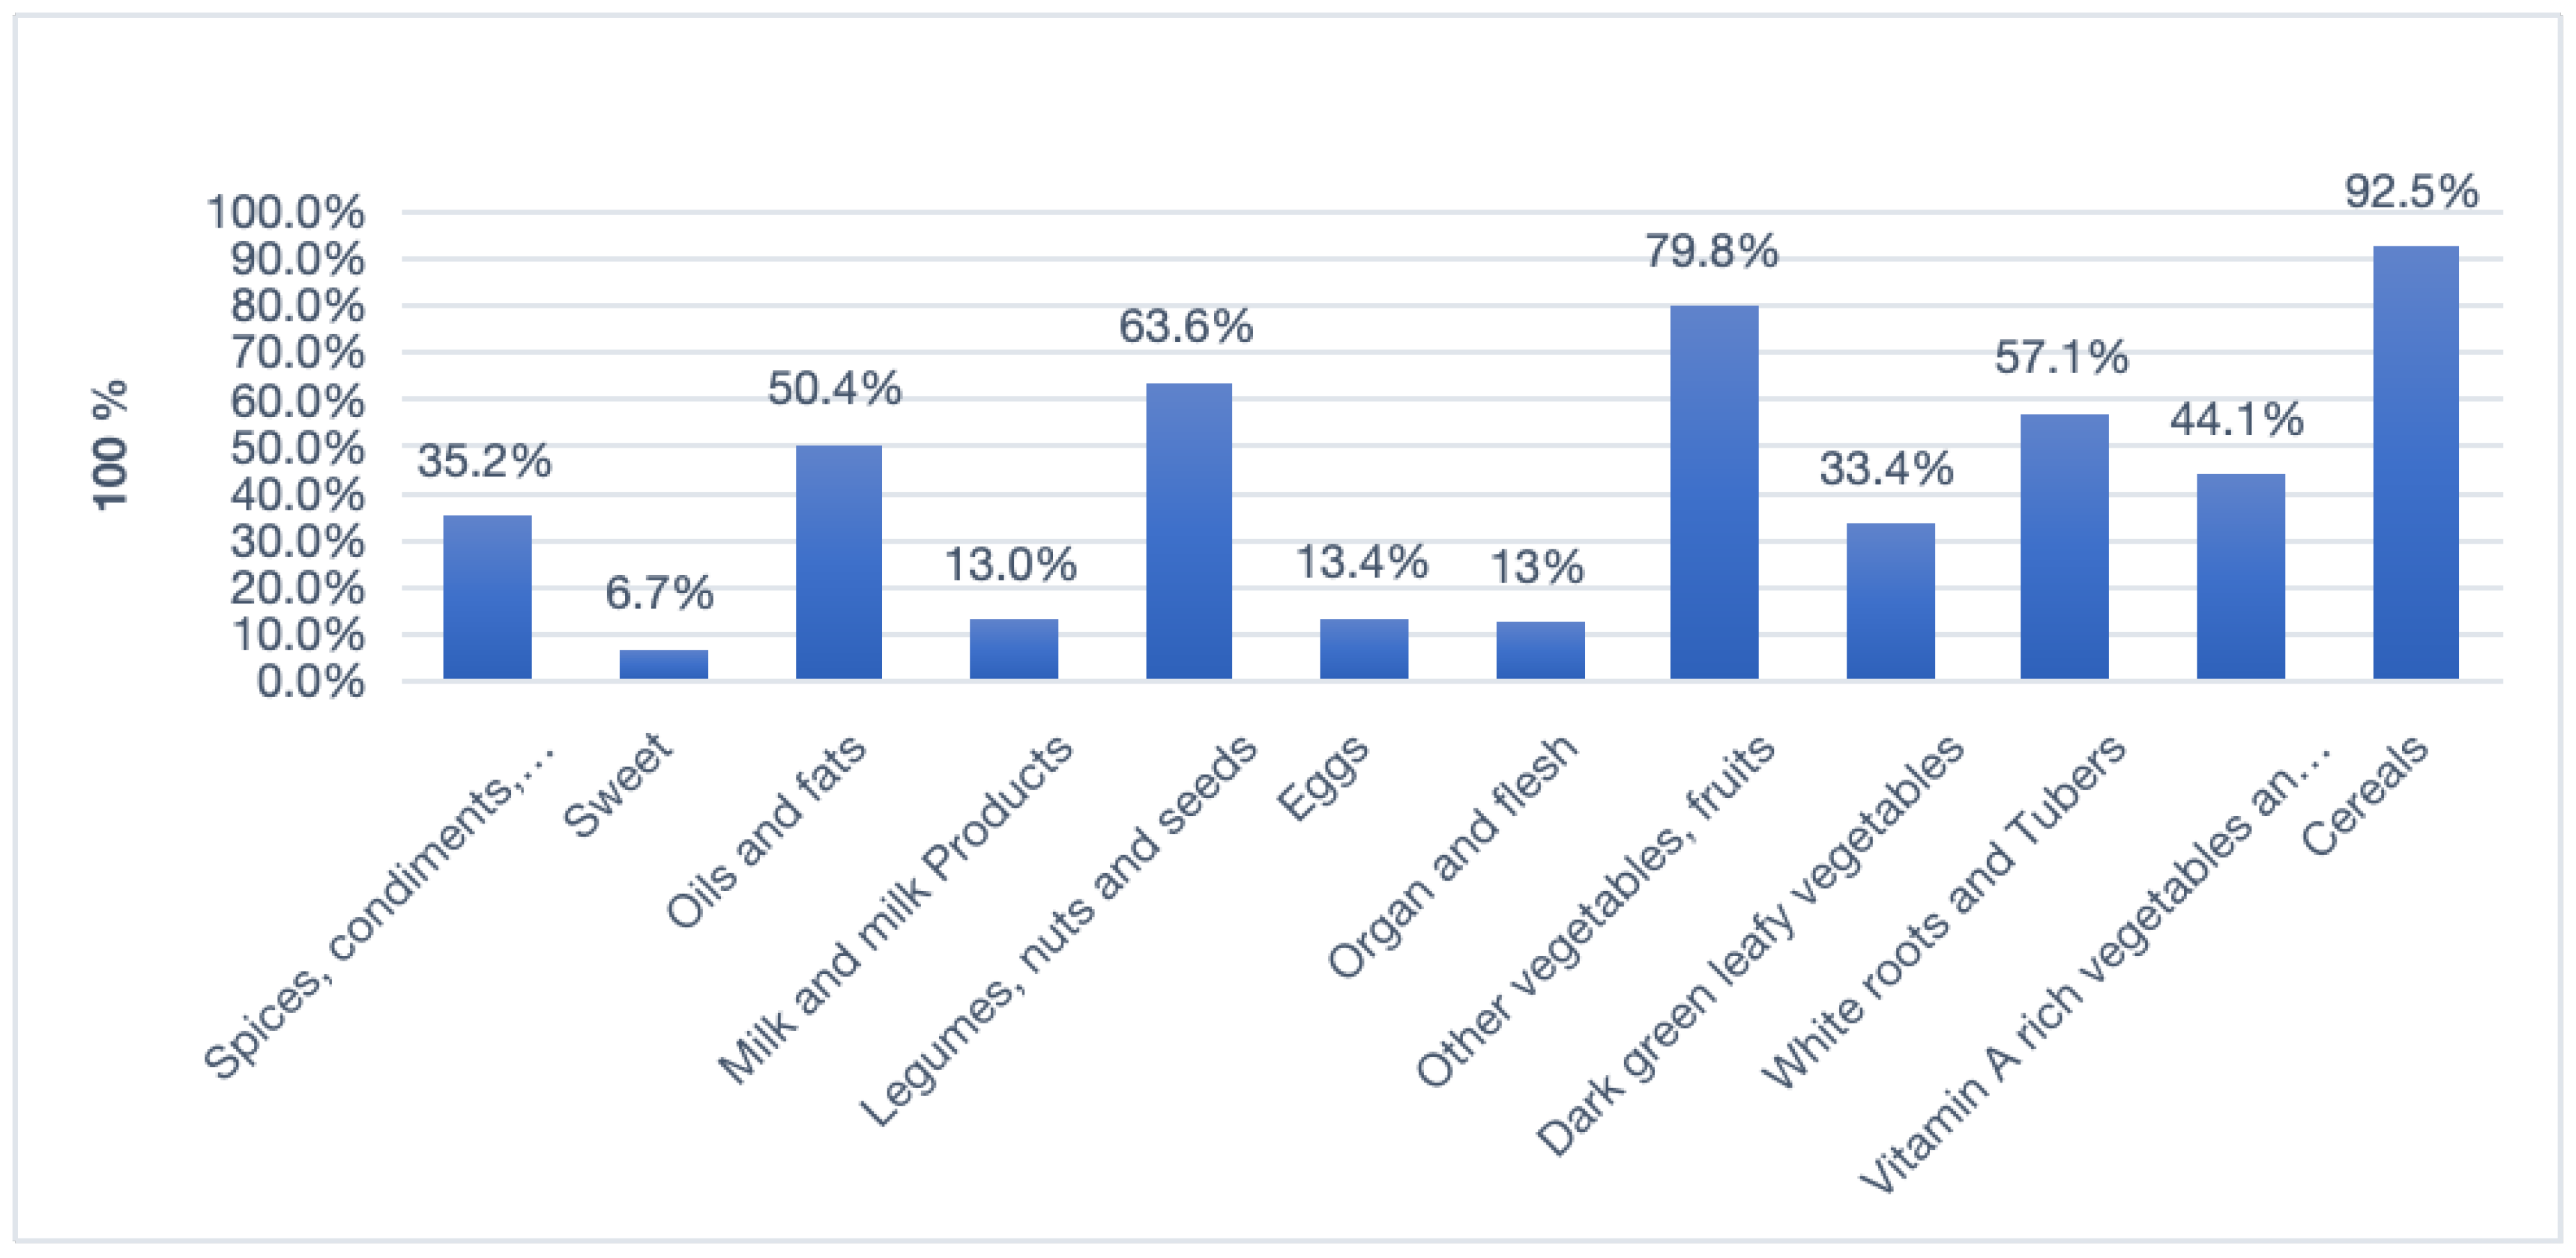
Figure 3.
Nutritional status/MNA score of 401 adults above the age of 65 in Harar town, Eastern Ethiopia.
Figure 3.
Nutritional status/MNA score of 401 adults above the age of 65 in Harar town, Eastern Ethiopia.
Factors Associated with Nutritional Status
In the analysis of bi-variable logistic regression, variables with a p-value of < 0.25 were age,
Marital status, educational status, occupational status, partner's occupation, living partner,
substance use, illness in the past 3 months, history of chronic illness, illness in the past 2 weeks,
visited to health facility in the past three months, are you currently taking medication, functional
mobility, difficulty in swallowing, ability of respondent to feed by himself, with whom are you
feeding, time of having a meal, feeding habit, dietary diversity, and HFIAS category. (Table 3)
Multivariate logistic regression of factors associated with malnutrition in Harar town (Table 4)
The multivariate logistic regression analysis identified several factors associated with malnutrition in adults over 65 years old in Harar town, Ethiopia. Those in the older age groups of 75-84 years (AOR=2.58, 95% CI: 1.26-5.31) were 2.58 times more likely to be malnourished than those aged 65-74; participants 85-95 years were 2.90 times more likely to be malnourished (AOR=2.90, 95% CI: 1.20-6.99). Adults over 65 who could only read and write were 4.17 (AOR=4.17, 95% CI: 1.43-12.14) times more likely to be malnourished than their counterparts. Having an illness in the past 3 months was proven to be statistically significant (p-value = 0.001) to having 2.77 odds of being malnourished compared to not being ill in the past 3 months (95% CI = 1.49-5.14).
Feeding practice also emerged as a significant predictor. Compared to those with
good feeding practices, individuals with poor and moderate feeding habits had 4.77 (95% CI
=1.82-12.46) and 2.83 (95% CI =1.44-5.56) times the odds of experiencing malnutrition,
respectively (p-values of both < 0.003). poor and moderate dietary diversity are also significantly
associated with malnutrition, with an odds of 4.00 and 2.82, respectively (AOR=4.28, 95%
CI: 1.65-9.65) (AOR=2.82, 95% CI: 1.47-5.42).
Households with all levels of food insecurity (mild, moderate, and severe) were more likely to experience malnutrition than food-secure households. The odds of experiencing malnutrition increased with the severity of food insecurity. The odds of being malnourished were 2.82 times higher (95% CI: 1.29-6.17) for households with mild food insecurity, 5.57 times higher for households with moderate food insecurity (95% CI: 2.45-12.65), and 6.33 times higher for households with severe food insecurity (95% CI: 2.07-19.33). Finally, being married (AOR=0.19, 95% CI: 0.07-0.52) and using substances (AOR=0.18, 95% CI: 0.09-0.34) were found to have lesser odds against malnutrition than the compared categories.
Discussion
The findings from this study, showing advanced age, being able to read and write or having an
informal education, illness, feeding practice, poor dietary diversity, and household food
insecurity as factors associated with malnutrition are consistent with prior research in Ethiopia.
This study found that 15.2% (95% CI: 0.18-1.91) of the adults were malnourished, and 43.6%
(95% CI: 0.38-0.48) were at risk of malnutrition. The reported malnutrition prevalence in similar
Ethiopian populations range from 11% to 27%13,14,30–33. A recent systematic review determined the pooled national malnutrition prevalence to be 20.5% in older Ethiopians16. Higher rates are often seen in Northern regions, for example, 27.6% in South Gonder and 27.9% in West Arsi 16,30. Again, a moderate prevalence is seen in the southwestern and southern parts of Ethiopia31,34. This study's lower Eastern region prevalence aligns with studies showing geographic variabilities. These regional distinctions may arise from long-term differences in cultures and dietary patterns between the north and the east. Environmental factors like higher altitudes and proneness to drought in the North could also contribute to the higher burden of malnutrition in the North.
This study found an increased odds of being malnourished amongst the very old and middle-aged
with malnourished being 2.58 and 2.90, respectively, were associated with significantly higher
odds of malnutrition, which was consistent with most studies done in most parts of Ethiopia. This is a typical result of metabolic changes associated with aging, and many studies have been done in Ethiopia that also seemed to associate it with mental wellness 11,35. Most studies found that an age >80, or the very old age group, has increased odds of malnutrition compared to the young old. A study done in Wolaita Sodo found the odds of being malnourished 1.6 times higher in adults older than 80 years of age31. In another study done in Northwest Amhara, the odds of being very old and malnourished were found to be 4.91 times11. A study done in Debre Markos also showed that amongst old adults, being very old and middle-old was significantly associated with malnutrition, with odds of 3.45 times in very old and 5.25 times in middle-old adults32. A meta-analysis in Ethiopia also showed that being young-old had far lower odds than those of being older than 85 years old16.
This study found that the odds of being malnourished are 4.17 times higher in adults having informal education or who can read and write. Also, several studies conducted in different regions of Ethiopia have found consistent evidence that having only an informal education or illiteracy is associated with higher rates of malnutrition. For example, studies by Muluneh et al. (2023)36, Yordanos et al.11, Kidest et al. (2019)31, and Hiwot et al. (2022)13, all found illiteracy or lack of formal education was linked to increased malnutrition risk. The 2022 study by Hiwot et al. further quantified this relationship, reporting that those able to just read and write but without formal education had over 6 times higher adjusted odds of malnutrition compared to literate individuals with education13. These consistent findings across multiple studies in Ethiopia provide strong evidence for an association between lack of formal education and malnutrition. The exact mechanisms require further research, but potential factors include reduced health knowledge and income potential among those without formal education. Overall, these studies demonstrate a link between informal education and malnutrition risk in Ethiopia.
This study found that recent illness was a significant predictor of malnutrition among older adults in Harar Town. Participants who reported being ill within the past three months were nearly three times more likely to be malnourished (AOR: 2.77; 95% CI: 1.49–5.14; p = 0.001). Illness in older adults often leads to reduced appetite, impaired nutrient absorption, and increased metabolic demands, all of which can contribute to a rapid decline in nutritional status. This finding is supported by studies such as Tesfaye et al. (2024), who reported that chronic illness and functional dependency significantly increased the likelihood of undernutrition among elderly populations in Ethiopia37. Similarly, Abdu et al. (2020) identified previous hospitalizations and chronic conditions as key drivers of nutritional deterioration14. These consistent findings highlight that illness not only compromises the immune system but also limits food intake and nutrient utilization, placing older adults at greater risk of malnutrition. Therefore, integrating routine nutritional screening into care for recently ill elderly patients is essential for early detection and intervention.
This study, coupled with existing research, sheds light on the vital role of proper feeding
practices in safeguarding older adults' nutritional well-being. Individuals in this study with poor
Habits, like eating only once daily, faced a staggering 4.7 times higher risk of malnutrition
compared to those with good habits (eating three or more times daily) and those with moderate
Eating habits had 2.83 times the odds of being malnourished.
This stark finding aligns with research across Ethiopia and beyond, highlighting the detrimental
impact of infrequent or inadequate meals on older adults' health. Hiwot Yisak (2022)
found a 13.5-fold increase in malnutrition risk for those with decreased food intake in South
Gondar, Ethiopia13, while Kidest Wondiye (2019) reported a similar association in Sodo
Zuriya31. A recent study further solidifies this link, demonstrating a dose-dependent relationship between meal skipping and malnutrition risk in the Fogera Zuriya district in Northwest Ethiopia38. Factors like poverty, food insecurity, physical limitations, social isolation, and even cognitive decline can all contribute to an increased risk of
malnutrition in older adults.
The findings from this study, which show that poor and moderate dietary diversity is associated with higher odds of malnutrition, are consistent with other research conducted in Ethiopia. This study found 4.00 and 2.82 times higher odds of malnutrition for poor and moderate dietary diversity, respectively, compared to good dietary diversity. The consistency of these findings across multiple regions of Ethiopia provides robust evidence that limited dietary diversity is an
important risk factor for malnutrition in the elderly. A study done in Metu found that lower dietary diversity was associated with 5.44 times higher odds of malnutrition compared to higher
diversity34. Another study in Gondar13 found those with lower dietary diversity had 3.7 times higher odds of malnutrition versus those with higher diversity. Also, another study done in the Fogera Zonal District, Northwest Ethiopia, found the odds of being malnourished to be 1.91 amongst those with low DDS compared to those who have higher DDS38.
This study's finding that household food insecurity significantly increases the risk of malnutrition among older adults in Ethiopia resonates strongly with research conducted in other countries. This study revealed that mildly, moderately, and severely food-insecure households faced odds
of malnutrition 2.82, 5.57, and 6.33 times higher, respectively, compared to food-secure households.
This stark correlation mirrors patterns observed in Greece, where they found a 2.63-fold increase in malnutrition risk among elderly individuals struggling with food insecurity39. Similarly, Yildiz et al. (2022) reported a higher risk of malnutrition in Turkish older adults experiencing moderate and severe food insecurity40. These consistent findings across various regions and cultures solidify the importance of food security in reducing malnutrition risk for older adults. When sufficient, nutritious food is unavailable, their vulnerability to nutritional deficiencies and related health problems increases considerably. Factors like limited income, social isolation, physical decline, and cognitive impairment can further worsen the situation, creating a complex interplay that contributes to both food insecurity and malnutrition among older adults.
The lesser odds of marriage and substance use were not seen in previous studies. Even
though living with others and having many members in the household has proven to show
lesser odds, living single and having no caretakers have proven to show an increased risk 11,38. More research is needed on the mechanisms for these associations in the Ethiopian context. Overall, this study provides further evidence on important drivers of malnutrition in Ethiopia's growing elderly population. Findings reinforce the need for integrated interventions targeting health, education, food security, and economic factors to address malnutrition in this vulnerable population.
Conclusions and Recommendation
The study revealed a high burden of malnutrition among older adults in Harar, with 15.2% classified as malnourished and 43.6% at risk. Key contributing factors included advanced age, recent illness, lack of formal education, low dietary diversity, and household food insecurity. These findings underscore the urgent need for integrated public health strategies to address elderly malnutrition. It is recommended that healthcare providers strengthen routine screening and nutrition counseling for older adults, while district health offices promote awareness and preventive care. The Ministry of Health and NGOs should develop community-based nutrition programs and guidelines targeting this vulnerable population. Policymakers are advised to establish social safety nets and support literacy and health education initiatives. Researchers are encouraged to conduct longitudinal studies to better understand causal links and to incorporate socioeconomic variables like income to enhance future analysis and policy development.
Strengths and Limitations of the Study
A key strength of this study lies in its use of a standardized and validated tool (the Mini Nutritional Assessment) to evaluate malnutrition among older adults, ensuring consistency and reliability in measurement. However, several limitations should be acknowledged. As a cross-sectional study, it cannot establish causality between risk factors and malnutrition. The reliance on self-reported data may have introduced recall bias, potentially underestimating the actual burden of malnutrition. Additionally, important socioeconomic variables such as household income were not assessed, limiting the analysis of economic influences. Finally, the MNA tool is not designed to detect overweight or obesity, which may overlook aspects of overnutrition in this population. Despite these limitations, the study provides valuable insights for future research and intervention design.
Author Contributions
All authors made substantial contributions to the study. The conception and design of the study were collaboratively developed by NGB and TW. Material preparation, including the development of data collection tools and the coordination of logistics, was carried out by NGB. Data collection and the initial data analysis were conducted solely by NGB. The first draft of the manuscript was jointly written by NGB and TW. NGB, TW, and FA provided critical revisions, contributing to the refinement of the manuscript’s content, structure, and academic rigor. All authors reviewed and approved the final version of the manuscript and agree to be accountable for all aspects of the work, ensuring the accuracy and integrity of the research.
Funding
This research was supported by Haramaya University as part of the requirements for the completion of a master’s degree in public health nutrition and was also funded. The study was conducted and submitted to the School of Postgraduate Studies in fulfillment of the degree requirements for the year 2024; the budget was approved on May 04, 2023.
Ethics Approval
Ethical approval for this study was obtained from the Institutional Health Research Ethics Review Committee (IHRERC) of Haramaya University, College of Health and Medical Sciences, Harar Campus. The proposal, titled "Nutritional Status and Associated Factors Among Older Adults Above 65 Years in Harar Town, Eastern Ethiopia," was reviewed and approved under Reference No. IHRERC/071/2023. The committee confirmed that all ethical requirements were met, and approval was granted on April 20, 2023. The investigator was authorized to begin data collection in accordance with governmental COVID-19 guidelines and instructed to submit progress reports every three months. (The Paper for Ethical Approval will be attached as a supplementary file.)
Consent to Participate
Informed consent was obtained from all individuals who participated in the study.
Data Availability
The datasets generated and analyzed during the current study are available from the corresponding author upon reasonable request.
Acknowledgments
This study was a master's research thesis submitted to Haramaya University College of Health and Medical Science. All authors contributed to the critical review and manuscript development.
Competing Interests
The authors have no relevant financial or non-financial interests to disclose.
Abbreviations
| BMI: Body Mass Index |
| CI: Confidence Interval |
| COPD: Chronic Obstructive Pulmonary Disease |
| DDS: Dietary Diversity score |
| DM: Diabetes Mellitus |
| HFIAS: Household Food Insecurity Access Scale |
| IHERC: Institutional Health Ethics Review Committee |
| MNA: Mini Nutritional Assessment |
| MNA-SF: Mini Nutritional Assessment Short-Form |
| NGOs: Non-governmental organizations |
| SPSS: Statistical Package for the Social Sciences |
References
- Ageing and health. https://www.who.int/news-room/fact-sheets/detail/ageing-and-health.
- World Bank Open Data. World Bank Open Data https://data.worldbank.org.
- Skirbekk, V. F., Staudinger, U. M. & Cohen, J. E. How to Measure Population Aging? The Answer Is Less than Obvious: A Review. Gerontology 65, 136–144 (2019). [CrossRef]
- Takele, A. M., Kotecho, M. G. & Adamek, M. E. ‘Hunger would kill us instead of COVID-19 ’: Elders’ response to the pandemic in Debre Markos Town, Ethiopia. Health Soc. Care Community 30, 2250–2258 (2022).
- Li, L. et al. Global patterns of change in the burden of malnutrition in older adults from 1990 to 2021 and the forecast for the next 25 years. Front. Nutr. 12, (2025).
- Salari, N. et al. Global prevalence of malnutrition in older adults: A comprehensive systematic review and meta-analysis. Public Health Pract. 9, 100583 (2025). [CrossRef]
- Kaur, D. et al. Nutritional Interventions for the Elderly and Considerations for the Development of Geriatric Foods. Curr. Aging Sci. 12, 15–27 (2019). [CrossRef]
- Cawood, A. L., Elia, M. & Stratton, R. J. Systematic review and meta-analysis of the effects of high protein oral nutritional supplements. Ageing Res. Rev. 11, 278–296 (2012). [CrossRef]
- Leslie, W. & Hankey, C. Aging, Nutritional Status and Health. Healthcare 3, 648–658 (2015).
- Telila, H. F. & Sima, E. A. Quantifying food insecurity in Ethiopia: Prevalence, drivers, and policy implications. Cogent Soc. Sci. 10, (2024).
- Mezemir, Y., Egata, G., Geset, D. & Lambebo, A. Nutritional Status and Associated Factors Among the Community-Dwelling Elderly Population in Debre Berhan Town, North Shewa Zone, Ethiopia. Nutr. Diet. Suppl. Volume 12, 289–299 (2020). [CrossRef]
- Seid, A. M. & Babbel, N. F. Prevalence of malnutrition among old age people in Africa. Front. Aging 3, (2022). [CrossRef]
- Yisak, H. et al. Determinants of undernutrition among older adults in South Gondar Zone, Ethiopia: a community-based study. BMJ Open 12, e056966 (2022). [CrossRef]
- Abdu, A. O., Yimamu, I. D. & Kahsay, A. A. Predictors of malnutrition among older adults aged above 65 years in eastern Ethiopia: neglected public health concern. BMC Geriatr. 20, (2020).
- Harar Regional Health Bureau | MINISTRY OF HEALTH - Ethiopia. https://www.moh.gov.et/am/node/222.
- Yisak, H. et al. Undernutrition and associated factors among older adults in Ethiopia: systematic review and meta-analysis. BMJ Open 13, e062845 (2023).
- Vellas, B. et al. Overview of the MNA – Its history and challenges. J. Nutr. Health Aging 10, 456–63; discussion 463 (2005).
- Lozoya, R. M., Martínez-Alzamora, N., Marín, G. C., Guirao-Goris, S. J. A. & Ferrer-Diego, R. M. Predictive ability of the Mini Nutritional Assessment Short Form (MNA-SF) in a free-living elderly population: a cross-sectional study. PeerJ 5, e3345 (2017). [CrossRef]
- Harris, D. & Haboubi, N. Malnutrition screening in the elderly population. J. R. Soc. Med. 98, 411–414 (2005).
- Hussein, F. M., Ahmed, A. Y. & Muhammed, O. S. Household food insecurity access scale and dietary diversity score as a proxy indicator of nutritional status among people living with HIV/AIDS, Bahir Dar, Ethiopia, 2017. PLOS ONE 13, e0199511 (2018).
- Coates, J., Swindale, A. & Bilinsky, P. Household Food Insecurity Access Scale (HFIAS) for Measurement of Food Access: Indicator Guide: Version 3: (576842013-001). American Psychological Association (APA) https://doi.org/10.1037/e576842013-001 (2007). [CrossRef]
- McDowell, M. A., Fryar, C. D., Ogden, C. L. & Flegal, K. M. Anthropometric Reference Data for Children and Adults: United States, 2003-2006: (623932009-001). American Psychological Association (APA) https://doi.org/10.1037/e623932009-001 (2008). [CrossRef]
- Liu, H. et al. Nutritional Status According to the Short-Form Mini Nutritional Assessment (MNA-SF) and Clinical Characteristics as Predictors of Length of Stay, Mortality, and Readmissions Among Older Inpatients in China: A National Study. Front. Nutr. 9, (2022).
- Household Dietary Diversity Score (HDDS) | INDDEX Project. https://inddex.nutrition.tufts.edu/data4diets/indicator/household-dietary-diversity-score-hdds.
- Motadi, S. A., Khorommbi, T., Maluleke, L., Mugware, A. & Mushaphi, L. Nutritional status and dietary pattern of the elderly in Thulamela Municipality of Vhembe District. Afr. J. Prim. Health Care Fam. Med. 14, (2022). [CrossRef]
- Ortega, R. M. et al. [Relationship between the number of daily meals and the energy and nutrient intake in the elderly. Effect on various cardiovascular risk factors]. Nutr. Hosp. 13, 186–192 (1998).
- Paoli, A., Tinsley, G., Bianco, A. & Moro, T. The Influence of Meal Frequency and Timing on Health in Humans: The Role of Fasting. Nutrients 11, 719 (2019). [CrossRef]
- Mesele, M. High Prevalence of Undernutrition among Elderly People in Northwest Ethiopia: A Cross Sectional Study. J. Nutr. Health Food Sci. 2, (2014).
- Bursac, Z., Gauss, C. H., Williams, D. K. & Hosmer, D. W. Purposeful selection of variables in logistic regression. Source Code Biol. Med. 3, 17 (2008).
- Gemeda, B. H. et al. Magnitude and Associated Factors of Undernutrition among elderly people in Shashemene District, West Arsi Zone, Oromia Region, South Ethiopia. Preprint at https://doi.org/10.21203/rs.3.rs-3147066/v1 (2023). [CrossRef]
- Wondiye, K., Asseffa, N. A., Gemebo, T. D. & Astawesegn, F. H. Predictors of undernutrition among the elderly in Sodo zuriya district Wolaita zone, Ethiopia. BMC Nutr. 5, (2019).
- Adhana, Z. K., Tessema, G. H. & Getie, G. A. PREVALENCE OF UNDER NUTRITION AND ASSOCIATED FACTORS AMONG PEOPLE OF OLD AGE IN DEBRE MARKOS TOWN, NORTHWEST ETHIOPIA, 2015. J. Aging Res. Lifestyle 1–7 (2019). [CrossRef]
- Hailemariam, H., Singh, P. & Fekadu, T. Evaluation of mini nutrition assessment (MNA) tool among community dwelling elderly in urban community of Hawassa city, Southern Ethiopia. BMC Nutr. 2, (2016). [CrossRef]
- Ferede, Y. M., Derso, T. & Sisay, M. Prevalence of malnutrition and associated factors among older adults from urban and rural residences of Metu district, Southwest Ethiopia. BMC Nutr. 8, (2022). [CrossRef]
- Abate, T., Mengistu, B., Atnafu, A. & Derso, T. Malnutrition and its determinants among older adults people in Addis Ababa, Ethiopia. BMC Geriatr. 20, (2020).
- Shuremu, M., Belachew, T. & Hassen, K. Nutritional status and its associated factors among elderly people in Ilu Aba Bor Zone, Southwest Ethiopia: a community-based cross-sectional study. BMJ Open 13, e067787 (2023). [CrossRef]
- Tesfaye, B. T., Yizengaw, M. A., Birhanu, T. E. & Bosho, D. D. Nutritional status of hospitalized elderly patients in Ethiopia: a cross-sectional study of an important yet neglected problem in clinical practice. Front. Nutr. 10, (2024). [CrossRef]
- Zewdu, E., Daniel, L., Derso, T. & Ferede, Y. M. Level of malnutrition and associated factors among community-dwelling rural older adults in Fogera Zuriya district, Northwest Ethiopia. Nutrition 113, 112085 (2023). [CrossRef]
- Grammatikopoulou, M. G. et al. Food insecurity increases the risk of malnutrition among community-dwelling older adults. Maturitas 119, 8–13 (2019).
- Tari Selcuk, K., Atan, R. M., Arslan, S. & Sahin, N. Relationship between food insecurity and geriatric syndromes in older adults: A multicenter study in Turkey. Exp. Gerontol. 172, 112054 (2023). [CrossRef]

Table 1.
Socio-demographic characteristics of Nutritional status and associated factors among older.
Table 1.
Socio-demographic characteristics of Nutritional status and associated factors among older.
| Characteristics | Categories | Frequency | Percentage (%) |
|---|---|---|---|
| Age | Young old (65 to 74 years of age) | 219 | 54.6% |
| Middle old (75 to 84 years of age) | 116 | 28.9 | |
| Old Old (>85 years of age) | 66 | 16.5 | |
| Educational status | Unable to read and write | 125 | 31.7 |
| Able to read and write | 73 | 18.2 | |
| Primary school (grades 1-8) | 58 | 14.5 | |
| Secondary school (grade 9-12) | 85 | 21.2 | |
| college and above | 60 | 15.0 | |
| Occupation of the respondent | Merchant | 65 | 16.2 |
| Government employee | 71 | 17.7 | |
| Daily laborer | 18 | 4.5 | |
| Housewife | 45 | 11.2 | |
| Farmer | 8 | 2.0 | |
| Retired | 184 | 45.9 | |
| Living condition | With partner | 213 | 53.1 |
| With Children’s | 106 | 26.4 | |
| Lives alone | 63 | 15.7 | |
| Other | 19 | 4.7 | |
| Source of household food | From market | 397 | 99.0 |
| From agriculture | 2 | 0.5 | |
| Household family size? | 0 to 5 people | 326 | 81.3 |
| 6 to 15 people | 71 | 17.7 | |
| Any use of the following substances | Khat | 88 | 21.9 |
| Cigarette | 20 | 5.0 | |
| Alcohol | 37 | 9.2 |
Table 2.
Dietary Diversity composition under each category.
| DDS Cat | |||||||
| Low dietary diversity score | Medium dietary diversity score | High dietary diversity score | |||||
| Count | Column N % | Count | Column N % | Count | Column N % | ||
| Eaten Cereals | No | 7 | 8.3% | 14 | 8.1% | 9 | 6.3% |
| Yes | 77 | 91.7% | 159 | 91.9% | 135 | 93.8% | |
| Vitamin A-rich vegetables and fruits | No | 73 | 86.9% | 94 | 54.3% | 57 | 39.6% |
| Yes | 11 | 13.1% | 79 | 45.7% | 87 | 60.4% | |
| White roots and Tubers | No | 38 | 45.2% | 77 | 44.5% | 57 | 39.6% |
| Yes | 46 | 54.8% | 96 | 55.5% | 87 | 60.4% | |
| Dark green leafy vegetables | No | 78 | 92.9% | 119 | 68.8% | 70 | 48.6% |
| Yes | 6 | 7.1% | 54 | 31.2% | 74 | 51.4% | |
| Other Vegetables and Fruit | No | 31 | 36.9% | 28 | 16.2% | 22 | 15.3% |
| Yes | 53 | 63.1% | 145 | 83.8% | 122 | 84.7% | |
| Organ and flesh | No | 83 | 98.8% | 156 | 90.2% | 112 | 77.8% |
| Yes | 1 | 1.2% | 17 | 9.8% | 32 | 22.2% | |
| Eaten Eggs | No | 83 | 98.8% | 157 | 90.8% | 107 | 74.3% |
| Yes | 1 | 1.2% | 16 | 9.2% | 37 | 25.7% | |
| legumes, nuts, and seeds? | No | 34 | 40.5% | 69 | 39.9% | 40 | 27.8% |
| Yes | 50 | 59.5% | 104 | 60.1% | 104 | 72.2% | |
| Milk and milk Products | No | 83 | 98.8% | 161 | 93.1% | 105 | 72.9% |
| Yes | 1 | 1.2% | 12 | 6.9% | 39 | 27.1% | |
| Oils and fats | No | 81 | 96.4% | 104 | 60.1% | 14 | 9.7% |
| Yes | 3 | 3.6% | 69 | 39.9% | 130 | 90.3% | |
| Eaten Sweet | No | 81 | 96.4% | 169 | 97.7% | 124 | 86.1% |
| Yes | 3 | 3.6% | 4 | 2.3% | 20 | 13.9% | |
| Spices, condiments, beverages | No | 84 | 100.0% | 134 | 77.5% | 42 | 29.2% |
| Yes | 0 | 0.0% | 39 | 22.5% | 102 | 70.8% | |
Table 3.
shows the Household Food Insecurity Access Scale (HFIAS) survey administered to 401 households with adults over 65 years old in Harar town.
Table 3.
shows the Household Food Insecurity Access Scale (HFIAS) survey administered to 401 households with adults over 65 years old in Harar town.
| HFIAS | No | Yes |
Rarely Once or twice in the past four weeks |
Sometimes Three to ten times in the past four weeks |
Often More than ten times in the past four weeks |
| 1. Worry about food | 35.2% 141 |
64.8% 260 |
|||
| 1a. how often | 28.7% 115 |
29.7% 119 |
6.7% 27 |
||
| 2. Not able to eat | 40.6% 163 |
59.4% 238 |
|||
| 2a. How often | 28.2% 113 |
19.0% 76 |
12.2% 49 |
||
| 3. Eat limited variety. | 38.7% 155 |
61.3% 246 |
|||
| 3a. How often | 21.7% 87 |
27.4% 110 |
12.5% 50 |
||
| 4. Have you eaten foods you really didn’t want? | 37.4% 150 |
62.6% 251 |
|||
| 4a. How often | 29.4% 118 |
26.2% 105 |
6.7% 27 |
||
| 5. Eaten smaller meal | 45.6% 183 |
54.4% 218 |
|||
| 5a. How often | 21.9% 88 |
18.7% 75 |
2.5% 10 |
||
| 6. Eaten Fewer meals | 50.9% 204 |
48.9% 196 |
|||
| 6a. How often | 26.4% 106 |
18.7% 75 |
2.5% 10 |
||
| 7. No food of any kind | 66.6% 267 |
33.4% 134 |
|||
| 7a. How often | 15.2% 61 |
14.0% 56 |
2.0% 8 |
||
| 8. Slept hungry | 82.3% 330 |
17.7% 71 |
|||
| 8a. How often | 9.2% 37 |
5.5% 22 |
2.2% 9 |
||
| 9. Whole day and night without food | 98.0% 394 |
2.0% 8 |
|||
| 9a. How often | 2.0% 8 |
0.0% 0 |
0% 0 |
Table 4.
multivariate logistic regression of factors associated with nutritional status in adults >65 years old in Harar.
Table 4.
multivariate logistic regression of factors associated with nutritional status in adults >65 years old in Harar.
| Variable and Categories |
Nutritional status | Crude odds ratio With CI |
Adjusted Odds Ratio |
P-value | |
|---|---|---|---|---|---|
| Malnourished or at risk | Normal nutritional status | ||||
| Age | |||||
| 65-74 | 96 (23.9%) | 123 (30.7%) | 1 | 1 | 1 |
| 75-84 | 64 (16.0%) | 52 (13.0%) | 1.57(1.00-2.48) | 2.58(1.26-5.31) | 0.010* |
| 85-95 | 43 (10.7%) | 23 (5.7) | 2.39 (1.35-4.24) | 2.90(1.20-6.99) | 0.017* |
| Marital status | |||||
| Single | 28 (7.0%) | 16 (4.0%) | 1 | 1 | 1 |
| Married | 68 (17.0%) | 135 (33.7%) | 0.28 (0.14-0.56) | 0.19(0.07-0.52) | 0.001* |
| Divorced | 25 (6.2%) | 27 (6.7%) | 0.52 (0.23-1.20) | 0.30(0.09-1.01) | 0.06 |
| Widowed | 82 (20.4%) | 20 (5.0%) | 2.34 (1.06-5.13) | 1.83(0.63-5.34) | 0.20 |
| Educational status | |||||
| Unable to read and write | 66 (16.5%) | 59 (14.7%) | 3.67 (1.57-6.02) | 1.51(0.57-4.02) | 0.40 |
| Able to read and write | 55 (13.7%) | 18 (4.5%) | 8.40 (3.8-18.4) | 4.17(1.43-12.1) | 0.01* |
| Primary education | 27 (6.7%) | 31 (7.7%) | 2.39 (1.1-5.2) | 1.06(0.35-3.12) | 0.91 |
| Secondary education | 39 (9.7%) | 46 (11.5%) | 2.33 (1.1-4.76) | 2.28(0.82-6.34) | 0.11 |
| College and above | 16 (4.0%) | 44 (11.0%) | 1 | 1 | 1 |
| Substance use | |||||
| Yes | 105 (26.3%) | 37 (9.3%) | 0.21 (0.13-0.33) | 0.18 (0.09-0.34) | <0.001* |
| No | 98 (24.5%) | 160 (40.0%) | 1 | 1 | 1 |
| illness in the past 3 month | |||||
| Yes | 127 (31.7%) | 62 (15.5%) | 3.66 (2.42-5.54) | 2.77 (1.49-5.14) | 0.001* |
| No | 76 (19.0%) | 136 (33.9%) | 1 | 1 | 1 |
| History of chronic illness | |||||
| Yes | 111 (27.7%) | 64 (16.0%) | 2.52 (1.68-3.79) | 0.59 (0.32-1.06) | 0.07 |
| No | 92 (22.9%) | 134 (33.4%) | 1 | 1 | 1 |
| Illness in the past 2 weeks | |||||
| Yes | 97 (24.2%) | 62 (15.5%) | 2.00 (1.33-3.01) | 0.56 (0.30-1.04) | 0.06 |
| No | 106 (26.4%) | 136 (33.9%) | 1 | 1 | 1 |
| Ability to feed by him/herself | |||||
| By oneself | 163 (40.6%) | 189 (47.1%) | 1 | 1 | 1 |
| Help from others | 40 (10.0%) | 9 (2.2%) | 4.54 (1.94-10.6) | 1.77 (0.63-4.99) | 0.27 |
| With whom are you feeding | |||||
| Always alone | 56 (14.0%) | 34 (8.5%) | 1 | 1 | 1 |
| Sometimes alone | 78 (19.5%) | 65 (16.2%) | 0.72 (0.42-1.24) | 2.25 (0.97-5.20) | 0.06 |
| Always with family | 42 (10.5%) | 74 (18.5%) | 0.34 (0.19-0.61) | 1.43 (0.55-3.72) | 0.45 |
| Time to have a meal | |||||
| Regular | 122 (30.4%) | 161 (40.1%) | 1 | 1 | 1 |
| Irregular | 81 (20.2%) | 35 (9.2%) | 2.88 (1.83-4.55) | 1.75 (0.85-3.61) | 0.12 |
| Feeding habit | |||||
| Poor feeding habits | 60 (15.0%) | 15 (3.7%) | 7.9 (4.19-15.03) | 4.77 (1.79-12.46) | 0.001* |
| Moderate feeding habit | 77 (19.2%) | 52 (13.0%) | 2.93 (1.85-4.65) | 2.83 (1.44-5.56) | 0.003* |
| Good feeding habit | 66 (16.5%) | 131 (32.7%) | 1 | 1 | 1 |
| Dietary diversity | |||||
| Low DDS | 58 (14.5%) | 26 (6.5%) | 5.24 (2.29-9.39) | 4.0 (1.82-12.46) | 0.002* |
| Medium DDS | 102 (25.4%) | 71 (17.7%) | 3.37 (2.11-5.38) | 2.83 (1.44-5.56) | 0.002* |
| High DDS | 43 (10.7%) | 101 (25.2%) | 1 | 1 | 1 |
| HFIAS | |||||
| Food secured | 32 (8.0%) | 98 (24.4%) | 1 | 1 | 1 |
| Mild food insecurity | 63 (15.7%) | 48 (12.0%) | 4.02 (2.32-6.95) | 2.82(1.29-6.17) | 0.009* |
| Moderate food insecurity | 73 (18.2%) | 42 (10.5%) | 5.32 (3.06-9.23) | 5.57(2.45-12.6) | <0.001* |
| Food insecure | 35 (8.7%) | 10 (2.7%) | 10.7 (4.77-24.1) | 6.33(2.07-19.3) | 0.001* |
Disclaimer/Publisher’s Note: The statements, opinions and data contained in all publications are solely those of the individual author(s) and contributor(s) and not of MDPI and/or the editor(s). MDPI and/or the editor(s) disclaim responsibility for any injury to people or property resulting from any ideas, methods, instructions or products referred to in the content. |
© 2025 by the authors. Licensee MDPI, Basel, Switzerland. This article is an open access article distributed under the terms and conditions of the Creative Commons Attribution (CC BY) license (http://creativecommons.org/licenses/by/4.0/).
Copyright: This open access article is published under a Creative Commons CC BY 4.0 license, which permit the free download, distribution, and reuse, provided that the author and preprint are cited in any reuse.


