Submitted:
27 July 2025
Posted:
28 July 2025
You are already at the latest version
Abstract
Transparency in business practices is essential for sustainability, ensuring that resources are used responsibly and that environmental and social impacts are properly measured and monitored, allowing the end consumer to make informed purchasing decisions without feeling cheated. The Digital Product Passport (DPP) promotes transparency by providing detailed information about a product’s origin, composition and life cycle activities, enabling more sustainable and responsible choices. The implementation of the DPP for textile and clothing items faces many challenges due to the huge number and diversity of companies involved in the value chain of these products combined with the large amount and variability of information that needs to be collected. Therefore, the integration and standardization of data from these companies is one of the biggest challenges. In this article we propose the use of Machine Learning (ML) algorithms for validating, in an homogeneous way, the quality of the data submitted by each company for the implementation of the DPP. We present four solutions that, using datasets organized in different ways and using different ML algorithms, enable selecting the solution that best suits each particular situation.
Keywords:
Circular Economy
; Data Quality Assessment
; Digital Product Passport
; Machine Learning
; Sustainability
; Textile and Clothing Value Chain
; Traceability
1. Introduction
The Textile & Clothing (T&C) industrial sector has come under considerable scrutiny over the years. This results from the poor working conditions observed in many factories, the child labor it has been accused of in the past, and the realization of its enormous environmental footprint. The textile industry has been accused of excessive water consumption for the production of raw materials associated with excessive exploitation of the soil, as well as the pollution of rivers by chemicals used in its manufacturing processes. Currently, the main problem is the exaggerated increase in textile waste, a consequence of excessive consumption encouraged by fast fashion, which stimulates huge consumption and the rapid disposal of clothes [1]. Furthermore, the T&C sector is one of the major contributors to the increase in greenhouse gases (GHG) in the atmosphere [1]. The textile industry needs to be adapted and "reinvented" to reduce its environmental and social impact, becoming more sustainable. Furthermore, it is necessary to increase transparency at all stages of the life cycle of these products by implementing the Digital Product Passport (DPP).
According to the European Union (EU), the "DPP is the combination of an identifier, the granularity of which can vary throughout the life-cycle (from a batch to a single product), and data characterizing the product, processes and stakeholders, collected and used by all stakeholders involved in the circularity process" [2]. To implement the DPP in the T&C sector, it is necessary to collect information about all stages and about all participants in the value chain and integrate this information. There are several categories of stakeholders in the T&C’s DPP, namely supply chain companies, brands, authorities, certification and assessment companies, retailers, marketing companies, consumers and circularity operators [2].
The EU has already created rules that companies wishing to trade in Europe must follow. The DPP must contain information about composition, product description (size, weight, etc.), information about the supply chain, transportation, social and environmental impact, circularity, information on the brand, usage and maintenance of garments (customer feedback), tracking and tracing after sales, etc. [2,3]. In other words, to implement the DPP it is necessary to collect a wide variety of information involving a huge number of companies and even individual consumers. The collection of this information may, thus, be subject to errors. Therefore, it is necessary to create a way to uniformly evaluate this data before it is stored and integrated into the DPP.
The strong investments made in the last decades in the area of Artificial intelligence (AI), and more particularly in its sub-field of Machine Learning (ML), have led to great and surprising advances with a very positive impact on many areas of society. ML and its ability to learn and make decisions based on data from previous experience has been adopted in a large part of the business areas that touch our daily lives, including image recognition, Natural Language Processing, fraud analysis, and many others. The detection of non-standard values, or anomalous values, is one of the areas in which ML has good results [4,5,6].
In this article we will emphasize information about the value chain and the collection of information that, in addition to enabling a product’s traceability, enables to calculate the environmental and social impact of the product. Therefore, it is necessary to receive information from and about all companies involved in the manufacturing of a given garment including transportation between the various companies. There are many companies involved and, potentially, with very different levels of digital maturity, which is why it is necessary to standardize the data collected and the validation process that it must be subjected to.
The validation solutions proposed in this article, that use ML algorithms, validate the data collected by the various business partners involved in the T&C value chain for the implementation of the DPP. More precisely, we started by collecting data on sustainability indicators from several companies involved in different production activities. Next, we worked with this data to prepare different datasets so that different types of ML algorithms (Supervised Learning and Unsupervised Learning) can be trained. In the end, we compare the approaches and analyze which one best suits each situation.
The remainder of this paper is structured as follows. The next section presents some concepts related to AI and ML, including some ML algorithms. Section 4 discusses some related work previously developed in the area, including previous work developed by the same authors. Section 5 presents the dataset used to train the algorithms used in Section 6. In Section 6 the proposed solutions are presented, starting with the presentation of the objective of each solution and its design. For each solution, a discussion of the results obtained is also presented. Section 7 explains how the validation solutions are made available to external applications through an integration Application Programming Interface (API). In Section 8 a discussion about the results found is made, and it also presents some conclusions and draws some lines for future work.
2. Methodology
For this research, the Design Science Research (DSR) research method was used, as it adapts to the needs of practical and useful research in the scientific areas of Information Systems/Information Technology (IS/IT) [7]. The DSR method drives research forward through a series of cycles in which an artifact is produced and evaluated. The evaluation of the produced artifact can identify strengths and weaknesses for improvement, as well as generate new ideas that can be implemented in the next cycle [7,8]. The DSR Method involves six main steps, namely:
- Problem Identification and Motivation - As discussed in Section 1, the volume and complexity of data collected for the implementation of the DPP demand the development of new strategies for effective data validation. To address this, it is essential to establish a standardized and flexible mechanism for evaluating data consistently across all companies involved in the T&C value chain.
- Definition of Objectives - The objective is to develop an artifact that leverages ML techniques to validate incoming data for the implementation of the DPP, while ensuring seamless integration into the broader DPP platform.
- Artifact Design and Development - The created artifacts include a set of machine learning models for anomaly detection in data to be integrated in the DPP, and an API that provides a set of services based on those models designed to be easily accessible and usable by all participants in the value chain for validating the data collected for DPP implementation. The created ML models are presented in Section 6.
- Demonstration - The demonstration involves creating and preparing appropriate datasets for each proposed approach, with which the selected ML algorithms are trained and tested. For this, 80% of the data has been used for training and 20% for testing purposes. The results are evaluated, as detailed in Section 6.
- Evaluation - The created set of models is evaluated iteratively through quantitative analysis of the results, as presented in Section 6. Ultimately, the validation services of the API are being tested with the first data items being integrated into the General DPP platform.
The created artifacts (ML models and API) are useful and innovative and can easily be used by companies involved in the T&C value chain for data validation.
3. Machine Learning Models for Data Validation
Artificial intelligence is a field of science that focuses on creating machines that, either rule-based or data-driven, can act by doing things that normally require human intelligence. AI already has a long history. Since the creation of the Turing Machine by Alan Turing in 1936, which demonstrated that any computational problem could be solved by a machine with well-defined rules, AI has undergone great advances. In recent years, and especially in its sub-field of ML, developments have been extraordinary. Nowadays, AI, and particularly ML, is present in all areas of society, from finance [11], Medical diagnostics [12], Image detection and Facial recognition [13], Cyber Security [14], fraud detection [15], Natural Language Processing (ChatGPT, Siri, etc.) [16], Machine translation (google translate, etc.), Industrial Automation [17], Autonomous vehicles [18], etc.
Machine Learning ML is a branch of AI that enables machines to make decisions based on prior experiences. It achieves this by utilizing algorithms and models that facilitate learning from data stored in datasets, and subsequently making intelligent decisions autonomously. ML algorithms employ statistical techniques to identify patterns and anomalies within often large datasets, allowing machines to learn from the data. The dataset size can be so extensive that it becomes challenging for humans to process all the information, which often enables ML to offer superior solutions to problems compared to humans [19].
Since models learn from data, the data used is very important, and needs to be properly prepared. There are many algorithms that can be used. Based on how they learn from data, algorithms can be categorized into four main types: Supervised Learning, Unsupervised Learning, Reinforcement Learning and Deep Learning [20,21,22].
- Supervised Learning - This category includes algorithms that learn from labeled data. It comprises Classification algorithms, which categorize data into predefined classes, and may be binary (e.g., yes/no, correct/incorrect) or multiclass; and Regression algorithms, which predict continuous values, such as the amount of energy consumed. The most common classification algorithms are Naive Bayes (NB) Classifier, Support Vector Machines (SVM) Classifier, Decision Tree (DT) Classifier, Logistic Regression, K-Nearest Neighbors (KNN) Classifier, Random Forest (RF) Classifier, and Multilayer Perceptron Classifier. The most common Regression algorithms are SVM Regression, DT Regression, Polynomial Regression, Linear Regression, KNN Regression, and RF Regression.
- Unsupervised Learning - These algorithms learn from unlabeled data and are useful for discovering hidden patterns or structures. Common tasks include clustering, frequent pattern mining, and dimensionality reduction. This group includes algorithms such as K-Means, which groups data into K clusters; Hierarchical Clustering, that creates a hierarchical structure of clusters; DBSCAN, which identifies dense regions of data items and is well-suited for unstructured data; and, Isolation Forest, a method that explicitly isolates anomalies and is one of the most popular anomaly detection methods[23,24].
- Reinforcement Learning - These algorithms learn optimal behaviors through interactions with an environment, using rewards and penalties as feedback. They are commonly applied in areas such as robotics and game playing. Popular algorithms in this category are Q-Learning, a table-based algorithm for finding the best action, Deep Q-Networks (DQN), Proximal Policy Optimization (PPO).
- Deep Learning - These models use artificial neural networks with multiple layers to learn complex representations of data. So, for these algorithms to have good results, very large datasets are required. In this group there are algorithms like Artificial Neural Networks (ANN), Convolutional Neural Networks (CNN), Recurrent Neural Networks (RNN) and Pre-trained Language Models (PLM) such as Bidirectional Encoder Representations from Transformers (BERT) and Generative Pre-trained Transformer (GPT).
Between the supervised and unsupervised learning categories, a semi-supervised learning category can be considered, which uses a small amount of labeled data together with a large amount of unlabeled data to train ML models. The goal is to improve learning accuracy when labeled data is scarce [25].
The best algorithm to be used in any specific case largely depends on the objectives and on the training dataset.
ML models can be evaluated in several aspects. For classification models, typical evaluation metrics include [26]:
- Accuracy - measures the proportion of correct predictions made by a model relative to the total.
- Precision - measures how many of the items classified as positive are actually positive.
- Recall: measures how many of the positive items were correctly identified
- F1-score – an evaluation metric that combines precision and recall (2*(precision * recall/(precision + recall))).
For regression models, typical evaluation metrics include:
- Mean Absolute Error (MAE): average absolute difference between predicted and actual values.
- Mean Squared Error (MSE): average of squared differences.
- Root Mean Squared Error (RMSE): square root of MSE.
- Score - also known as Coefficient of Determination. It measures the proportion of variance in the target explained by the model.
4. Related Work on Data Validation Approaches in the T&C Value Chain
This section addresses the complexity of the T&C value chain, and other work done in the area of data validation.
4.1. T&C Value Chain
As research and innovation advance, the variety of raw materials continues to grow. In addition to traditional natural fibers such as wool, linen, silk, and cotton, there are now synthetic materials derived from petroleum, including polyester, acrylic, nylon, plastic, elastane, and Lycra. Emerging alternatives also include plant-based materials like jute, bamboo, hemp, and banana leaves. More recently, with the growing emphasis on the circular economy, we can find raw materials such as recycled cotton, recycled polyester, recycled polyester resin. Some materials are more commonly used in applications, such as Coconut, Wood, Metal, Seashell, Leather, Vegetable Ivory [27]. Within each type of raw material further sub-classifications may exist, such as Organic Silk, Organic Cotton, Organic Hemp, Merino Wool.
The treatment and processing of these diverse raw materials typically involve different specialized companies. As a result, the number of companies involved in the T&C value chain is increasing, becoming more diversified and spread throughout the world. Considering, for example, the production of a shirt, with a composition of 50% silk + 50% cotton, with buttons, this will involve a sequence of several value-chain activities: silk production, cotton production, transportation, silk spinning, cotton spinning, dyeing, weaving, and garment manufacturing (including cutting, sewing and assembly). In addition, the buttons must also be produced, transported, and applied.
4.2. Solutions for Data Quality Assessment in the Scope of the DPP
DPP for T&C products is currently being widely discussed as a way to increase product transparency and traceability, This is why there are already a few authors proposing solutions for validating data collected for implementing the DPP. Some of the proposed solutions are presented next.
The DPP is part of the European Green Deal and the European Circular Economy Action Plan. The study presented in [28] analyses the possibilities and limitations in implementing the DPP and in its use for other fields of application.
With the aim of improving long-term sustainability, the authors in [29] propose a model to extend the useful lifespan of a product and closing the product life cycle loop, contributing to the circular economy. The cyclical model includes reverse logistics of components and raw materials. The model also includes some information on how to manage data at the end of each life cycle.
In [30] the authors conduct a study on the potential benefits of implementing DPP in the manufacturing industry and in particular in the electronics industry. The authors conclude that the implementation of DPP and the collection of information along the value chain and manufacturing processes contribute to increased transparency in the manufacturing industry and contribute to increased sustainability. Furthermore, the information collected can be very beneficial for resource management and subsequent decision making [30].
4.3. Solutions for Data Quality Assessment Using ML
With the constant increase in the variety and volume of the data to be analyzed, traditional strategies for detecting data anomalies and outliers are no longer efficient. This makes necessary to resort to new strategies such as the use of ML algorithms for anomaly detection and to assess data quality.
In [31] the authors study existing approaches for network anomaly detection. The authors conclude that existing approaches are not effective mainly due to the large volumes of data involved, which are being collected in real time, through connected devices. To improve efficacy, the authors study the use of ML algorithms for anomaly detection within a large volume of data collected in real time.
In [6] the authors perform a systematic literature review on ML models used in anomaly detection and their applications. The study analyzes ML models from four perspectives, namely, the types of ML techniques used, the applications of anomaly detection, the performance metrics for ML models, and the type of anomaly detection (supervised, semi-supervised, and unsupervised). The authors conclude that unsupervised anomaly detection has been adopted by more researchers than other classification anomaly detection systems. Semi-supervised is practically not used. The authors also conclude that a large part of the research projects use a combination of several (more than one) ML techniques to obtain better results and that SVM is the most frequently used algorithm, either alone or combined with others [6].
Some approaches are more specific and study the use of ML in detecting anomalies in specific areas, such as data collected by IoT devices [4,32], water quality assessment [33], and other areas.
Nowadays, a lot of information is collected through the use of IoT devices. These devices continuously collect a huge volume of data which can make detecting anomalous data challenging. In [32] the authors review the literature on the main problems and challenges in IoT data and on the ML techniques used to solve such problems. SVM, KNN, Naive Bayes and Decision Tree were the Supervised classification algorithms mentioned most often [32]. The unsupervised machine-learning algorithms most frequently used are K-means clustering and Gaussian mixture model (GMM).
Uddin et al. [34] also use ML algorithms to assess water quality. The authors use ML algorithms to identify the best classifier to predict water quality classes. The ML algorithms used are SVM, Naïve Bayes (NB), random forest (RF), KNN, and gradient boosting (XGBoost) [34].
Zhu et al. carried out a review on the use of ML in water quality assessment [33]. The increasing volume and diversity of data collected on water quality has made traditional data analysis more difficult and time-consuming, which has driven the use of ML for water quality analysis. ML algorithms are used in monitoring, simulation, evaluation and optimization of various water treatment and management systems and in different aquatic environments (sewage, drinking water, marine, etc.). The authors evaluated the performance of 45 ML algorithms, including SVM, RF, ANN,DT, Principal Component Analysis (PCA), XGBoost, etc. [33]. The authors conclude that conditions in real systems can be extremely complex, which makes the widespread application of machine learning approaches very difficult. The authors suggest improving the algorithms and models so that they are more universal according to the needs of each system [33].
Eduardo Nunes, in 2022, presented a literature review on the use of ML techniques in anomaly detection for the specific case of “Smart Shirt”, that is, shirts that have the ability to monitor and collect signals emitted by our body. These “Smart Shirts” are typically used for medical purposes. The author, among other things, studies the ML techniques that are being used for anomaly detection and concludes that the SVM algorithm is the most widely used, followed by K-Nearest Neighbors (KNN) and Naive Bayes (NB) [4].
4.4. Previous Work by the Same Authors
In a previous work [9] by the same authors, within the scope of the same project, a non AI-based solution has been proposed for validating the data collected by each of the business partners involved in the T&C value chain, before integrating the data in a traceability platform for the DPP.
In the proposed solution, four formulas were introduced to validate the values of sustainability indicators [9]. These formulas assess whether a given value falls within a defined range, bounded by a minimum (min) and a maximum (max) values, and how closely it aligns with a central or average value. This central value represents the central tendency of the indicator value distribution. Central tendency is typically measured using the arithmetic mean, median, and mode (or modal). The arithmetic mean is the average of the values, the median is the middle value when the data is ordered, and the mode is the most frequently occurring value in the set. Values nearer to the central tendency are considered to have a higher degree of validity, while those further away are assigned lower validity. The rate at which this validity decreases with distance from the mean can vary between different metrics. Additionally, if a value exceeds the defined boundaries (min or max), it may either be considered invalid or still acceptable, depending on the specific metric. The solution enables the customization and refinement of these validation parameters for each metric [9]. The proposal also suggested as future work the use of Machine Learning algorithms, for allowing a more dynamic and accurate data validation [9].
5. T&C Value Chain Dataset Preparation
Preparing a dataset is one of the most critical stages in a machine learning (ML) project. The goal of data preparation is to format and structure the data in a way that aligns with the requirements of the machine learning algorithms to be used [35]. As outlined in [35], dataset preparation typically follows a series of steps, beginning with data collection and followed by data cleaning, transformation, and reduction:
- Data Collection - This is the initial phase of any machine learning pipeline. It involves identifying, selecting and acquiring the appropriate data needed for the specific algorithm and intended outcomes.
- Data Cleaning - This step involves identifying and correcting errors, such as missing values, noisy data, and anomalies, to ensure the dataset is accurate and reliable.
- Data Transformation - This process involves converting raw data into a suitable format for modeling. Common tasks include normalization (scaling numerical data to a specific range) and discretization (converting continuous variables into discrete buckets or categories). These transformations are essential for improving algorithm performance and interpretability.
- Data Reduction - This process is used in situations where datasets are too large or complex. In these cases, reducing data may be of aid to deal with issues like overfitting, computational inefficiency, and difficulty in interpreting models with numerous features, and is crucial to enhance the efficiency and effectiveness of machine learning analysis.
These steps, mentioned in [35], have been followed to create and prepare the datasets used in the study presented here. Depending on the ML approach followed, the dataset is prepared in different ways, however the steps presented below are common to all datasets.
Data collection
- The data used for this study has been provided by Portugal’s Textile and Clothing Technological Center (CITEVE) and consists of real data collected from various companies representing different types of production activities involved in the textile and clothing sector, such as spinning, weaving, dyeing, manufacturing, among others.
The data was provided through multiple Excel files, each composed of tables for a product batch/lot resulting from a production activity, where the batch identification and size were listed, along with environmental impact metrics and their respective values.
To use this information in the ML training phase, it was necessary to consolidate all the data in a structured format. To do so, a single table has been created where each row containing information about the batch size, the production activity, the responsible firm or organization, the materials used to produce it (e.g. cotton, linen, polyester) and the percentages of each, and the corresponding metrics information, namely the metrics name, unit of measurement and value.
The information provided was simple to understand and, therefore, there was no need to group attributes to reduce their volume. Furthermore, each of the various parameters was labeled, aiding in their comprehension. Although the data supplied was of good quality and featured real information from different types of companies, the total number of records is small. Due to its complexity and reliability, it was not possible to use data augmentation methods to address the issue of small number of records. At the end of this stage, the dataset consisted of 223 rows.
Each row contained information about the size of the product batch, the production activity that created it, the materials used on its creation, and their percentages and the name of an attribute, the unit of measurement, and their value.
In total, we received information about 28 sustainability indicators that can be used to measure the environmental impact of the batch produced by the identified production activities, that is, in the transformation of the input material/product (or products) into the output product.
For a given batch, data was collected on environmental sustainability indicators related to the resources consumed and outputs produced during a specific production activity, aimed at transforming and manufacturing a product of a defined weight. The following environmental impact metrics were analyzed regarding consumption: consumption of water, non-renewable electricity, renewable electricity, self-con-sumption of renewable energy, biomass, coal, total electricity, natural gas, propane gas, fuel oil, water, gasoline, diesel, purchased steam, chemical products, etc. The following environmental impact metrics were analyzed regarding production: quantity of SVHC (Substance of Very High Concern) in products, quantity of non-hazardous chemicals, quantity of recovered chemicals, quantity of non-hazardous waste, quantity of solid waste, quantity of textile waste, quantity of recovered waste, quantity of recovered textiles, quantity of recycled water, volume of liquid effluent, among others. Some environmental impact metrics make more sense for some production activities and less, or no sense at all, for others.
After collecting the data, an initial data processing was carried out. These treatments were necessary for all the approaches that will be presented in Section 6). However, some of the approaches presented there also required additional treatment.
Data Cleaning
- In the case of the received data, there were no missing values or noisy data, so it was not necessary to implement replacement techniques. There was also no need for outlier treatment, since all data represented real data obtained from industrial activities.
Data Transformation
- The original data received has undergone some transformations, namely the categorical data were encoded using label encoding, and all values were converted to numerical format to ensure greater compatibility with ML models. Proper normalization was also applied to the numerical data to ensure consistency between the different value scales to avoid loss of information.
Data Reduction
- In the case presented here, the amount of data obtained was not too large, so this step was not performed.
After this first data processing, the data set consisted of 223 lines. Each row contained information on the product identification and size of the product batch produced, the production activity in which the batch was produced, the materials used in its creation and corresponding percentages, the name of the metric to be evaluated, its measurement unit and its value.
Given that we are evaluating a large number of production activities and a large number of environmental impact indicators, it is natural that the most appropriate value validation solution varies from one indicator to another. It may depend of the production activity and the indicator being evaluated.
6. Proposed ML-Based Solutions for Data Validation in the Context of the T&C DPP
In this section we present four ML-based approaches and compare their results to determine which one best suits each situation. The primary goal is to identify the most effective method for validating the quality of data received for the creation or enrichment of information within the DPP. Using the same set of real-world data collected from companies in the T&C sector (as detailed in Section 5), each approach involves distinct data preparation strategies and uses different ML algorithms for data validation and anomaly detection. An anomaly is defined as an observation that significantly deviates from the expected behavior or pattern within a dataset. Also referred to as an outlier or deviation, an anomaly represents an unusual or rare value among a collection of observed data points. Anomalies can generally be classified into three main categories [6,31]:
- Point Anomaly: A single value or data point that is anomalous compared to the rest of the data.
- Contextual Anomaly: A data point that is considered anomalous only within a specific context (e.g., time, location).
- Collective Anomaly: A group of related data points that together form an anomalous pattern, even if individual points may not appear abnormal on their own.
The four proposed approaches are presented next:
- Approach 1 - The first approach uses unsupervised anomaly detection models combined with predefined threshold values to individually assess the reliability of each environmental impact metric.
- Approach 2 - The second approach uses supervised learning models to both predict values for individual metrics (regression) and to classify wether a received value is correct or not (classification).
- Approach 3 - The third approach focus on analyzing the relationships among the different environmental impact metrics. All metric values are considered together within a single record (i.e., one record includes all metrics), and the goal is to determine whether the values within a given record are consistent with each other. Supervised learning algorithms are used to perform this consistency check.
- Approach 4 - In the fourth approach the goal is to predict the value of a specific metric based on the remaining metrics in the record. The objective is to assess whether the value received for a particular metric in a new record is plausible, given the values of the other metrics. Supervised models are used for this purpose.
As the dataset is relatively small, neural network–based algorithms were not considered due to their typically high data requirements.
For each approach, the dataset was split into 80% for training the models and 20% for testing their performance.
6.1. Approach 1 - Anomaly Detection Based on Individual Metrics
This approach focuses on validating the data of a certain batch according to an attribute (metric) using ML anomaly detection algorithms. Each record includes the batch size, production activity, and the name and value of the attribute to be validated. Given the objective of assessing and ensuring the quality of the data, anomaly detection provides an effective way to identify inconsistencies and deviations that may indicate errors or irregularities.
6.1.1. Data Preparation
This approach uses the dataset presented previously in Section 5. The dataset consisted of 223 rows, each with 11 columns.
Only the organization’s column was removed from the initial dataset. Of these 11 columns, one contains the size of the lot, one specifies the production activity, two indicate the types of materials used in the lot, and two record the corresponding material percentages. Another column contains the name of the metric, followed by its unit of measurement and its recorded value. The last two columns contain information about the data’s validity, one includes a validity score (ranging from 0 to 100), and the other assigns a validity category (Valid, Suspect, or Invalid). For ML purposes, the dataset was preprocessed to handle missing and noisy data, and all non-numeric values were converted to numeric representation.
After analyzing the created dataset, a key issue was identified concerning the validity category of the data: there were no data records categorized as "Suspect". This posed a challenge for training the models to recognize suspect data, which is important for real-world applications where such cases may occur. To solve this issue, additional data was generated based on the existing records, and using the API previously developed and presented in [9]. The API uses formulas to evaluate the validity of the data. By using existing data and modifying the values of the attributes sufficiently enough for the API’s formulas to classify them as “Suspect”, it was possible to create new data entries. To preserve the integrity and trustworthiness of the dataset, only 19 new rows were created using this method. At the end, the dataset had 242 records.
6.1.2. ML Algorithms
The models chosen for this approach were selected due to their effectiveness in detecting anomalies in both large and small datasets. This was useful for the dataset used in this approach and for handling potential future data. They were also chosen because of their scalability, popularity, unique approach to identifying anomalies, and common usage in areas such as environmental science and industrial systems [5,36]. The approach presented in this subsection uses the algorithms Isolation Forest (IF), Local Outlier Factor (LOF), One-Class SVM (OSCVM), Gaussian Mixture Model (GMM) and Robust Covariance (RC), the latter employing Elliptic Envelope (EE) for robust covariance estimation.
The IF (Isolation Forest) is an anomaly detection algorithm that identifies outliers by isolating data points that differ significantly from the rest. It operates by randomly selecting features and recursively splitting the data. Anomalies are easily isolated because they are fewer in number and more distinct from the bulk of the data [23].
The LOF operates by contrasting the local density of a point with the local density of k of its surrounding neighbors. If this point has significantly lower density than its surrounding neighbors, it is considered an outlier [37].
The OSCVM works by creating a boundary that encloses the majority of the data points while maximizing the margin around them. Any data point that falls outside this boundary is considered an anomaly [38].
GMM models the data as a combination of multiple Gaussian distributions, assigning each data point a likelihood of belonging to each component distribution. Outliers are detected by identifying points with a low probability of belonging to any of the distributions [39].
The RC method using Elliptic Envelope assumes that the data follows a Gaussian distribution, forming an elliptical shape. Data points that fall outside this elliptical boundary are classified as outliers [40].
Unsupervised models, such as the models mentioned above, do not rely on traditional classification metrics. Instead, their results are often interpreted through visualizations such as plots. However, in this approach, anomaly detection was treated as a classification task. Each data point was classified as "Valid", "Invalid", and "Suspect" based on its anomaly score, as predicted by the models, and according to the thresholds defined for classification. These thresholds were determined based on the proportion of data points in each validity category, as seen in Figure 1. This technique was feasible because the dataset had each row labeled according to their validity (Valid, Suspect, or Invalid).
This unsupervised approach incorporates supervised evaluation, using labeled validity categories to assess model performance using traditional performance metrics. In this case, the Accuracy, Precision, Recall and F1-Score of each model were measured and confusion matrices were generated to assess their performance.
6.1.3. Results
Figure 2 presents a visual representation of the output of the five anomaly detection models. In the plots, each point represents a batch, with the x-axis indicating the row index and the y-axis representing the quantity of products in each batch. The points are color-coded according to their validity category. By analyzing Figure 2, a noticeable pattern emerges. Indeed, suspect and invalid data points seem to be more frequently associated with lower product quantities, while there is significant variation in the detection results across the different models, indicating inconsistencies in how anomalies are identified. This diversity underscores the need for additional evaluation methods to determine which models are most suitable for the specific characteristics and requirements of this use case.
As previously mentioned, we evaluated the performance of each anomaly detection model using traditional classification metrics. Table 1 summarizes the performance of each model. According to the results, the best performing model was LOF with an Accuracy of 52,48%, followed by OSCVM with 46,69%, IF with 45,04%, GMM with 44,63%, and RC using EE with 41,74%.
These findings suggest that, among the models tested, LOF was relatively more effective at identifying anomalous data. However, even its performance was modest, indicating limitations across all models. This could be due to the limited size and nature of the dataset, as anomaly detection models generally require large volumes of data to perform well. Additionally, more advanced data processing techniques may be needed beyond basic data normalization. Another important factor to consider is the lack of parameter tuning, as the standard default values were used for all models. These observations indicate that there is still significant room for improvement in both the data preparation and modeling stages in order to enhance the models performance.
To enhance model performance and better understand the impact of dimensionality reduction, PCA was applied during the data transformation stage. PCA is a dimensionality reduction technique, which transforms the original features into a new set of uncorrelated linear combinations, known as principal components, which capture the maximum variance present in the data while preserving the most significant patterns and structures. This reduces the amount of redundant or less informative features, improving the performance of unsupervised algorithms and their ability to detect anomalies [41].
Before applying PCA, it is essential to determine the optimal number of components to reduce the dimensionality while retaining most of the dataset’s variance. Figure 3 illustrates the cumulative explained variance as a function of the number of principal components. The red dashed line indicates the 95% variance threshold, while the green line marks the minimum number of components required to capture at least 95% of the total variance. This ensures that dimensionality is effectively reduced without significant loss of information. In this case, six principal components were selected.
Table 2 presents the updated performance results of the anomaly detection models after applying PCA. As shown, LOF continues to be the best model in terms of Accuracy (50,00%). However, both OSCVM and IF demonstrate comparable accuracy (49.59%) and outperform LOF in other key metrics, including F1-score, precision, and recall. On the other hand, GMM and RC with EE continue to yield the weakest results among the five models, with GMM showing the lowest overall performance.
Compared to the results in Table 1, there was an overall improvement in the performance of the models with the use of PCA, with the exception of LOF which had a worse performance, indicating that this model works better with high-dimensional data, while the others do not.
This approach still requires further refinement, such as parameter tuning, to maximize model performance. However, this can be time-consuming, especially when working with larger or continuously updated datasets. Another problem is the use of fixed validity thresholds, which may need to be adapted for different contexts to avoid misclassification.
The results of this approach, even though not very performing, show that the application of unsupervised anomaly detection algorithms can be a viable approach to detect potential anomalies in textile data. Despite the lack of high accuracy, these models were capable of detecting deviations without the need for labeled data, which can be helpful in scenarios where labeled datasets are difficult to obtain. In the end, the LOF, OSCVM and IF models were chosen to be used in a validation API (refer to Section 7), as they were the best performing models.
6.2. Approach 2 - Supervised Classification and Regression Models for Anomaly Detection Based on Individual Metrics
This approach employs both regression and classification supervised learning models to predict the degree and category of validity for the value received for a specific environmental metric related to the production of a textile product batch. In other words, it evaluates the reliability of a given metric within the context of transforming one or more raw materials into a final product. For example, the model may be used to predict the validity (both in degree and category) of the reported amount of electricity consumed in producing a 900 kg batch of fabric, where cotton and silk yarn are used as raw materials.
6.2.1. Data Preparation
The dataset used for this approach is the same as the one described in subSection 6.1, with the structure and content previously detailed in Section 5 and additional preparation steps explained in Section 6.1. As mentioned previously, the dataset contains 242 rows and 11 columns.
6.2.2. ML Algorithms
In this approach, the algorithms RF, DT, SVM, NB and KNN are used to classify data based on their validity category. To predict the degree of data reliability (i.e., a continuous score), the models used include DT, RF, and eXtreme Gradient Boosting (XGBoost). These algorithms were selected due to their effectiveness on small datasets, as well as their popularity and scalability in practical applications. XGBoost is a widely used ML algorithm known for its high efficiency, speed, accuracy, and scalability in real-world scenarios [42]. It is an ensemble learning method based on gradient boosting, which builds a series of decision trees, where each new tree tries to correct the errors made by the previous ones.
To measure the performance of these models, standard performance metrics, such as Accuracy, F1-Score, Recall and Precision, were used to measure the effectiveness of the classification algorithms. For the regression models, we selected the R2 Score as the sole performance metric, as it provides a clear indication of how well the predicted values approximate the actual degree of validity.
6.2.3. Results
Table 3 presents the results of the classification models using the mentioned dataset. As can be seen in the table, the best performing model was RF with 83,67% of Accuracy, followed by DT and SVM with both 77,55%, then KNN with 75,51% and finally NB with 34,69%. These results show that the models were able to correctly classify most of the data, however, they also show that there is still room for improvement since they are still far from being excellent.
One important thing to note for NB, is that its Accuracy is lower than its Precision, which means that the model has an overall poor predictive performance, but when it does predict the most dominant class ("Valid"), it is often correct. This might be because of class imbalance, since there are more valid data values than the other types, which can be solved by training the model with more diverse data.
Table 4 presents the results of the regression models when assessing the degree of validity of the textile data. As can be seen in the Table 4, RF is the best performing model with a R2 score of 77,18%, followed by XGBoost with 76,89% and DT with 62,39%. These results are good, however, much like the classification models, there is still room for improvement, such as the usage of more data in the training of these models.
When comparing the performance of the classification and regression models, it is possible to see that RF is the most suitable model for our data for both tasks, as it was the best model overall. DT, on the other hand, is more suitable for categorizing the validity of the data rather than predicting their degree of validity. This may be due to the structure of the dataset, which may contain discrete or categorical patterns that are easier to separate into classes than to model as a continuous output.
The results obtained in this approach demonstrate its potential as a viable method for assessing the quality and reliability of textile data, as the models were able to accurately predict the validity of most of the provided information However, there are still improvements that need to be made, such as parameter tuning or the use of larger training datasets. Based on the results, the models selected for implementation in the proposed ML API were RF, DT, and SVM for classification tasks, and RF, XGBoost, and DT for regression tasks.
6.3. Approach 3 - Supervised Models for Anomaly Detection of Records with Collective Related Attributes
The goal of this approach is to develop ML models capable of assessing the reliability of sustainability indicator values for a given batch, while also verifying the proportionality of these values in relation to other indicators. To achieve this, the dataset described in Section 5 is reused, but it must be reorganized to enable meaningful comparisons between sustainability indicators (metrics).
The restructured dataset is designed to help the models learn relationships between the various metrics within each different production activity. For instance, when evaluating total water consumption during a production activity for producing a given product batch, the model also considers whether this value aligns with the volume of liquid effluents generated during the same process. By incorporating such relationships, the models can more effectively assess data reliability, leading to a more robust and accurate validation of textile sustainability data.
6.3.1. Data Preparation
The data was structured so that each row aggregates all sustainability indicators related to the production activity for producing a single batch. Each row now contains detailed information about a production activity for a given batch, including the batch size, production activity, types of raw materials used along with their respective percentages, and the values of 28 environmental impact metrics (sustainability indicators). Additionally, there are also columns indicating the data validity category (Invalid, Suspect, or Valid), and the degree of validity of the information. Depending on the type of production activity, some metrics may have zero value. This happens when the metric is not measured for that production activity. With the aggregation of several records from the initial dataset within one record for the same production activity and batch reference, the total number of records is now down to 18 rows, and the number of columns has risen to 37.
After the preparation of the dataset, the correlation matrix has been generated to show how attribute values vary in relation to each other. The correlation matrix for the created dataset is shown in the Figure 4 and it represents the degree of relationship between the environmental impact metrics on the dataset. Possible values for each row and column of the correlation matrix range from -1 to +1. The value "-1" means that there is a negative correlation, that is, the value of one attribute increases while the other decreases. On the opposite side, the value "+1", means that there is a positive correlation, that is, the attribute values grow together. The value 0 means that there is no relationship between the attributes. The correlation matrix also shown color tones that vary between blue, representing strong negative correlation, and red, representing strong positive correlation.
As can be seen in the correlation matrix, some metrics exhibit strong relationships with others (with correlation values close to 1). For example, the metrics "Non-Hazardous Waste Quantity", "Solid Waste Quantity", "Textile Waste Quantity", "Recovered Waste Quantity", and "Recovered Textile Quantity" all show a strong positive correlation with "Total Electric Energy Consumption". Also, "Purchased Steam Consumption" demonstrates a strong positive correlation with both "Chemical Consumption" and "Non-Hazardous Chemical Quantity" produced.
6.3.2. ML Algorithms
Having each record labeled as Invalid, Suspect, or Valid, the dataset is prepared for use with supervised learning algorithms. This approach explores the application of commonly used algorithms for anomaly detection, namely: RF, DT, KNN, SVM, and NB [4]. The study is divided into classification and regression models, each analyzed separately to evaluate their effectiveness in detecting anomalies in the data.
6.3.3. Results
As before, classification models have been evaluated according to standard performance metrics for classification models, namely Accuracy, Precision, Recall, and F1-score. Table 5 presents the results, with regard to Accuracy, F1-score and Precision, of each model based on the created dataset.
Regression is a supervised learning technique, used to make predictions, that models a relationship between independent and dependent variables [43]. As previously, Score has been used for assessing the performance Regression models. The results of the regression ML models trained and evaluated in this approach are represented in the Table 6. The table presents the models sorted in descending order based on their scores. As shown, the DT model achieved the highest performance among all evaluated models.
In summary, this approach evaluates two groups of models with a dataset with multiple related features in each data record: regression and classification. The results indicate that the used classification models outperform the regression models. Due to the relatively small dataset, regression models struggle to predict continuous values with high accuracy. In contrast, classification models, working with discrete categories (Invalid, Suspect, and Valid), tend to generalize better with limited data, making them more robust and effective in this context.
6.4. Approach 4: Supervised Models for Anomaly Detection of Individual Metrics Based on Collective Related Attributes
This approach explores two distinct supervised learning strategies aimed at predicting the values of environmental metrics. The primary goal is to estimate the value of a specific metric, associated with a given production activity and a produced batch, by leveraging information from the remaining metrics and batch-specific attributes, such as raw material composition, batch size, water consumption, and liquid effluent volume. For example, validating the total water consumption for a batch may involve using features like the batch size, types of materials used, production activity, and other related metrics, such as the volume of liquid effluents. This method captures the interdependencies between various indicators and production characteristics to accurately validate the target metric.
6.4.1. Approach 4.1: Dedicated Model per Metric
The first strategy involves developing 28 distinct Machine Learning (ML) regression models, one for each of the 28 metrics being validated.
The dataset utilized was identical to the one created in Section 6.3, inheriting the same data preparation pipeline. The key distinction lies in the model training setup: for each of the 28 metrics that can be validated, a dedicated model has been trained. In each case, the target metric was removed from the input feature set and designated as the output variable, while the remaining 27 metrics plus the batch characteristics served as input features.
This design allows each model to specialize in predicting its assigned metric, potentially leading to higher accuracy as each model is tuned to the specific nuances of its target variable within the context of the other batch data.
ML Model Evaluation
Following data preparation, appropriate regression models were selected. Given the relatively small dataset size, neural network architectures were not considered.
The same set of regression algorithms evaluated in Section 6.3 were employed here. In total, 168 models were trained (one for each of the 28 metrics, potentially across 6 different algorithms ). Model performance was evaluated using the Coefficient of Determination ( score). After evaluating all models, the top five performers based on score were identified, as shown in Table 7.
The highest performance was observed with a Decision Tree model for predicting/validating ’Total electricity consumption’ ( = 99%), indicating excellent predictive capability for this metric. Random Forest and XGBoost models also showed strong performance for metrics such as ’Amount of solid waste’, ’Consumption of chemical products’, and ’Quantity of waste recovered’. These results suggest that tree-based methods are particularly effective for this specialized modeling task.
6.4.2. Approach 4.2: Single Unified Model
This second strategy aimed to develop a single ML model capable of predicting any of the 28 metrics, rather than training metric-specific models.
The same dataset and preprocessing steps from Section 6.3 were used, as before. The key transformation in this approach involved restructuring the dataset: each original record (representing a single production activity and batch) was expanded into 28 new records, one for each metric considered as a potential prediction target. A new categorical feature, `target_name`, was introduced to each expanded record to indicate which metric serves as the target variable for that instance. The value of the specified target metric became the output variable of that row, while the remaining 27 metrics, along with batch-specific attributes (e.g., production activity, batch size, material types and their percentages), and the `target_name` itself formed the input features.
This transformation resulted in a dataset with 392 rows (based on 14 original batches, 14 × 28 = 392) and 35 columns. Among these, 28 columns represented metric values (with one serving as the output and the remaining 27 as inputs depending on the `target_name`). The rest included features for production activity, batch size, material types and proportions, and the `target_name` identifier. In total, each row contained 34 input features and one target variable, the value of the designated target metric.
ML Model Evaluation
Model selection and evaluation followed the same methodology as Section 6.4.1. Table 8 presents the performance of the best models identified for this unified approach.
As shown in Table 8, tree-based ensemble models (Random Forest and XGBoost) again demonstrated very strong performance, achieving high overall scores of 98% and 96%, respectively. In contrast, the K-Nearest Neighbors (KNN) algorithm performed poorly ( = 46%). This discrepancy is likely due to the challenge faced by distance-based methods like KNN in generalizing effectively across the heterogeneous nature of the target variable, which encompasses 28 different metrics with potentially diverse scales and distributions, all handled within a single model structure. The added `target_name` feature aids tree-based models in partitioning the data appropriately, a task potentially harder for KNN in this context.
6.4.3. Comparison Between the Two Approaches
This section compares the two strategies presented in Section 6.4.1 (28 models, denoted 28/28) and Section 6.4.2 (single unified model, denoted 1/28). The comparison considers predictive performance, maintenance effort, and scalability, as summarized in Table 9.
The approach in Section 6.4.1 (28/28) offers the potential for superior accuracy on a per-metric basis due to model specialization. However, this comes at the cost of significantly higher complexity in terms of development, deployment, and ongoing maintenance (managing 28 individual models).
The approach in Section 6.4.2 (1/28) presents a much simpler and more scalable architecture. While its overall performance (e.g., 98% for RF) is excellent, the accuracy for any single specific metric might be lower than that achievable with a dedicated model from Approach 4.1. The single model must generalize across all metrics, which might compromise performance for metrics with unique patterns or weaker correlations with the input features.
Considering the operational context, where scalability and ease of maintenance are often crucial, the approach in Section 6.4.2 was deemed more appropriate. The high overall achieved suggests strong predictive power across the board, and the operational benefits of managing a single model outweigh the potential for slightly lower accuracy on some individual metrics compared to the more complex 28-model system. Therefore, the unified model strategy (Section 6.4.2) was selected for further development and deployment in the validation API.
6.5. Analysis and Discussion
This subsection analyzes the approaches presented in the previous sections. Table 10 presents a comparative summary of the four proposed Machine Learning approaches for assessing the quality of textile data. The table highlights each approach’s model type, dataset structure and characteristics, key advantages and limitations, and the most appropriate scenarios for their application.
Approach 1 (anomaly detection based on individual metrics) is an unsupervised approach that excels when labeled data is scarce. It can detect anomalies using patterns in unlabeled data and is easy to scale and implement. However, it suffers from lower accuracy in well-labeled contexts, and performance heavily depends on proper threshold selection and data distribution. This approach is best suited for early-stage deployments or cases with limited annotation.
Approach 2 (supervised classification and regression models for anomaly detection based on individual metrics) applies classification and regression models independently to each metric. It provides high accuracy when sufficient labeled data is available and is easier to interpret on a metric-by-metric basis. However, it fails to account for inter-metric relationships and may not scale well with many diverse metrics.
In approach 3 (supervised models for anomaly detection of records with collective related attributes), instead of assessing individual metrics, the models assess the consistency of an entire record by considering all metrics together. This allows for detecting systemic errors and exploiting correlations between metrics. While powerful for spotting broad inconsistencies, it is less interpretable and may struggle with isolated metric-level anomalies, especially in small datasets with many features.
Approach 4 (supervised models for anomaly detection of individual metrics based on collective related attributes) predicts each individual metric using the rest of the metrics and batch characteristics as context. It combines the benefits of both localized and contextual validation, allowing for fine-tuning per metric while leveraging interdependencies. Despite its higher implementation and computational complexity, it offers strong generalization and accuracy potential across metrics.
7. Integration API
For the DPP to serve as a trustworthy source of detailed information about a product’s origin, composition, and life cycle activities, promoting transparency and supporting more sustainable and responsible decision-making, the data used to build the DPP must be validated prior to its integration into the DPP platform. This validation is particularly critical in the complex landscape of the T&C industry, where numerous organizations generate and manage data through different software systems, before providing some of that data as indicators to be collected and incorporated into the DPP. To this purpose, an API has been developed to facilitate the validation of such indicators or metrics. The API provides endpoints that leverage a range of machine learning algorithms, selected based on the research and evaluation presented in presented in Section 6.1, Section 6.2, Section 6.3, and Section 6.4, to accomplish the data validation process.
Within the context of the DPP, where both data integrity and interoperability are essential, this API-driven solution becomes indispensable. Data must be collected from various points across the T&C value chain, including Enterprise Resource Planning (ERP) systems, Internet of Things (IoT) devices, and other data collection platforms used by participating companies. The developed API enables seamless submission of product and sustainability data to the validation service, ensuring that only verified and reliable information is integrated into the DPP.
The API data validation services evaluate the submitted data for accuracy, consistency, and compliance with predefined standards, returning a validation status, ensuring that only high-quality, trustworthy data is integrated into the Digital Product Passport.
Along with the data validation services, the API includes services for managing the different types of data entities, such as Production activities, Raw materials, Environmental indicators, which have been addressed in [9,10]). This standardized interface enables consistent data validation practices across the textile and clothing (TC) value chain, thereby improving the reliability and usefulness of the DPP.
To implement and manage the proposed solutions, a software framework was developed using Spring Boot in Java. The system is designed as a RESTful Web API, ensuring seamless integration and scalability. Additionally, authentication and authorization mechanisms are managed via Keycloak, ensuring secure access control.
To enhance operational monitoring and diagnostics, Grafana Loki and Grafana Tempo are employed for centralized log management and distributed tracing visualization. Prometheus is used for real-time metric collection and analysis, while Grafana serves as a comprehensive visualization and dashboard tool.
The validation services provided by the API include, besides the services already addressed in [9], endpoints for using the ML-based validation services. These are presented in Table 11. For the development of the ML models, Scikit-learn, a popular library for ML in Python, was used to implement the algorithms.
As can be seen in the table, there are three endpoint services for anomaly detection using the IF, OSCVM and LOF models selected in Section 6.1 to be used in the validation API.
From the Approach 2 (Section 6.2, the models selected for implementation in API were RF, DT, and SVM for classification tasks, and DT, RF, and XGBoost for regression tasks.
Due to the small dataset used in Approach 3 (Section 6.3), the services available on the API apply classification models based on DT, RF and SVM, and regression models based on DT, RF and XGBoost.
From the Approach 4, presented in Section 6.4, the unified model strategy (Section 6.4.2) was the one selected for the API. The services available use RF, KNN and XGBoost.
7.1. API Integration Case Validation
The validation API for textile environmental indicators is currently being used by INFOS (https://infos.pt/en/projetos-de-inovacao/) in the implementation of the textile sector Digital Product Passport. The current phase has as major contributions the selection of more real data records for building larger datasets, with wider spectrum of production activities and types of textile industries, which will enable to better train new models with the same algorithms. Another major contribution is the building of knowledge about which validation approach is better for each environmental indicator registered in the DPP.
8. Discussion and Conclusion
The implementation of the DPP is expected to bring many benefits in terms of sustainability and circular economy by providing transparency and traceability in the value chain, increasing social and environmental responsibility in the T&C industrial sector.
For companies to get a return on their investment and be able to compete fairly with each other, this implementation must be required at a global level. However, beyond the initial investment required, the rollout of the DPP presents several challenges. At the top are the difficulties of collecting and integrating data across companies with widely varying levels of digital maturity, as well as the complexity of obtaining certain sustainability indicators.
The T&C value chain generates a vast volume of data due to the large number of production activities and the wide range of organizations involved in data collection. This data is sourced from diverse IoT devices and various software platforms (e.g., ERPs, MRPs), leading to significant variability in format and quality. To address this challenge, this article proposes an API that offers a comprehensive suite of data validation services. The API serves as a unifying layer to validate and standardize data before it is stored in the platform that supports the DPP.
Given the dynamic nature of the T&C value chain and the high volume and velocity of incoming data, traditional data validation methods may fall short in meeting performance requirements. Therefore, this work explores a set of machine learning–based approaches to enable more efficient and scalable data validation procedures within the DPP implementation. By leveraging pre-trained ML models, the system can significantly enhance validation performance, especially in scenarios involving high data throughput and rapid data ingestion.
The API services are prepared to validate data received from new companies and can be easily adapted to receive data from new raw materials, new production activities, and new types of indicators to be measured and validated.
The results presented in this study are constrained by the limited size of the training dataset. It is anticipated that with a larger volume of data, more insightful and robust conclusions could be drawn.
As future work, we plan to replicate this study using an expanded dataset to validate the findings reported here. With access to more data, we also aim to explore the use of deep learning models, such as ANN and RNN, which typically require larger datasets to perform effectively. Additionally, we intend to fine-tune the hyperparameters of the existing models, as optimal configurations may shift with a broader and more diverse dataset.
Author Contributions
This research article is the result of research and findings by the authors, being the individual contributions as follow: Conceptualization, E.F.C. and A.M.R.d.C.; methodology, E.F.C. and A.M.R.d.C.; software, P.S., S.S. and R.R.; validation, P.S., S.S., R.R. and M.A.; investigation, E.F.C., A.M.R.d.C., P.S., S.S. and R.R.; resources, J.O. and E.F.C.; data curation, E.F.C., A.M.R.d.C., P.S., S.S. and R.R.; formal analysis, E.F.C., A.M.R.d.C., P.S., S.S. and R.R.; writing—original draft preparation, E.F.C., A.M.R.d.C., P.S., S.S., R.R., M.A. and J.O.; writing—review and editing, E.F.C. and A.M.R.d.C.. supervision, E.F.C.; project administration, E.F.C.; All authors have read and agreed to the published version of the manuscript.
Funding
This research has been developed in the context of, and was funded by, Project "BE@T: Bioeconomia Sustentável fileira Têxtil e Vestuário-Medida 2", funded by "Plano de Recuperação e Resiliência" (PRR), through measure TC-C12-i01 of the Portuguese Environmental Fund ("Fundo Ambiental").
Conflicts of Interest
The authors declare no conflicts of interest.
Abbreviations
The following abbreviations are used in this manuscript:
| AI | Artificial intelligence |
| ANN | Artificial Neural Networks |
| API | Application Programming Interface |
| BERT | Bidirectional Encoder Representations from Transformers |
| CNN | Convolutional Neural Networks |
| DPP | Digital Product Passport |
| DSR | Design Science Research |
| DT | Decision Tree |
| EE | Elliptic Envelope |
| ERP | Enterprise Resource Planning |
| EU | European Union |
| GMM | Gaussian Mixture Model |
| GPT | Generative Pre-trained Transformer |
| IF | Isolation Forest |
| IoT | Internet of Things |
| KNN | K-Nearest Neighbors |
| LOF | Local Outlier Factor |
| ML | Machine Learning |
| NB | Naive Bayes |
| OCSVM | One-Class SVM |
| PCA | Principal Component Analysis |
| PLM | Pre-trained Language Models |
| PM | Performance Metrics |
| RF | Random Forest |
| RNN | Recurrent Neural Networks |
| SVM | Support Vector Machines |
| T&C | Textile & Clothing |
| XGBoost | eXtreme Gradient Boosting |
References
- Alves, L.; Cruz, E.F.; da Cruz, A.M.R. Tracing Sustainability Indicators in the Textile and Clothing Value Chain using Blockchain Technology. In Proceedings of the 2022 17th Iberian Conference on Information Systems and Technologies (CISTI); 2022; pp. 1–7. [Google Scholar] [CrossRef]
- Union, E. Digital product passport for the textile sector. EPRS | European Parliamentary Research Service, 2024. [Google Scholar] [CrossRef]
- Rosado da Cruz, A.M.; Ferreira Cruz, E. Digital Product Passports in promoting Circular Economy: A Conceptual Data Model. In Proceedings of the Proceedings of the 11th IFAC Conference on Manufacturing Modelling, Management and Control (IFAC MIM), 2025.
- Nunes, E.C. Machine Learning based Anomaly Detection for Smart Shirt: A Systematic Review, 2022, [arXiv:cs.LG/2203.03300].
- Kraljevski, I.; Ju, Y.C.; Ivanov, D.; Tschöpe, C.; Wolff, M. How to Do Machine Learning with Small Data? A 14 Review from an Industrial Perspective. 2023; arXiv:cs.LG/2311.07126]. [Google Scholar]
- Nassif, A.B.; Talib, M.A.; Nasir, Q.; Dakalbab, F.M. Machine Learning for Anomaly Detection: A Systematic Review. IEEE Access 2021, 9, 78658–78700. [Google Scholar] [CrossRef]
- Cruz, E.F.; Cruz, A.M.R.d. Design Science Research for IS/IT Projects: Focus on Digital Transformation. In Proceedings of the 2020 15th Iberian Conference on Information Systems and Technologies (CISTI); 2020; pp. 1–6. [Google Scholar] [CrossRef]
- Hevner, A.R.; March, S.T.; Park, J.; Ram, S. Design Science in Information Systems Research. MIS Quarterly 2004, 28, 75–105. [Google Scholar] [CrossRef]
- Rosado da Cruz, A.M.; Silva, P.; Serra, S.; Rodrigues, R.; Pinto, P.; Ferreira Cruz, E. Data Quality Assessment for the Textile and Clothing Value-Chain Digital Product Passport. In Proceedings of the Proceedings of the 26th International Conference on Enterprise Information Systems - Volume 2: ICEIS. INSTICC, SciTePress, 32 2024, pp. 288–295. [CrossRef]
- Ferreira Cruz, E.; Rodrigues, R.; Serra, S.; Silva, P.; Rosado da Cruz, A.M. Using Machine Learning for Data Quality Assessment for the Textile and Clothing Digital Product Passport. In Proceedings of the Proceedings of the 11th IFAC Conference on Manufacturing Modelling, 2025., Management and Control (IFAC MIM).
- Sahu, S.K.; Mokhade, A.; Bokde, N.D. An Overview of Machine Learning, Deep Learning, and Reinforcement Learning-Based Techniques in Quantitative Finance: Recent Progress and Challenges. Applied Sciences 2023, 13. [Google Scholar] [CrossRef]
- Lohani, B.P.; Thirunavukkarasan, M. A Review: Application of Machine Learning Algorithm in Medical Diagnosis. In Proceedings of the 2021 International Conference on Technological Advancements and Innovations (ICTAI); 2021; pp. 378–381. [Google Scholar] [CrossRef]
- Sharma, S.; Bhatt, M.; Sharma, P. Face Recognition System Using Machine Learning Algorithm. In Proceedings of the 2020 5th International Conference on Communication and Electronics Systems (ICCES); 2020; pp. 1162–1168. [Google Scholar] [CrossRef]
- Ozkan-Okay, M.; Akin, E.; Aslan, O.; Kosunalp, S.; Iliev, T.; Stoyanov, I.; Beloev, I. A Comprehensive Survey: Evaluating the Efficiency of Artificial Intelligence and Machine Learning Techniques on Cyber Security Solutions. IEEE Access 2024, 12, 12229–12256. [Google Scholar] [CrossRef]
- Alarfaj, F.K.; Malik, I.; Khan, H.U.; Almusallam, N.; Ramzan, M.; Ahmed, M. Credit Card Fraud Detection Using State-of-the-Art Machine Learning and Deep Learning Algorithms. IEEE Access 2022, 10, 39700–39715. [Google Scholar] [CrossRef]
- Min, B.; Ross, H.; Sulem, E.; Veyseh, A.P.B.; Nguyen, T.H.; Sainz, O.; Agirre, E.; Heintz, I.; Roth, D. Recent Advances in Natural Language Processing via Large Pre-trained Language Models: A Survey. ACM Comput. Surv. 2023, 56. [Google Scholar] [CrossRef]
- Maschler, B.; Weyrich, M. Deep Transfer Learning for Industrial Automation: A Review and Discussion of New Techniques for Data-Driven Machine Learning. IEEE Industrial Electronics Magazine 2021, 15, 65–75. [Google Scholar] [CrossRef]
- Parekh, D.; Poddar, N.; Rajpurkar, A.; Chahal, M.; Kumar, N.; Joshi, G.P.; Cho, W. A Review on Autonomous Vehicles: Progress, Methods and Challenges. Electronics 2022, 11. [Google Scholar] [CrossRef]
- Jiang, Y.; Li, X.; Luo, H.; Yin, S.; Kaynak, O. Quo vadis artificial intelligence? Discover Artificial Intelligence 2022, 2. [Google Scholar] [CrossRef]
- Badillo, S.; Banfai, B.; Birzele, F.; Davydov, I.I.; Hutchinson, L.; Kam-Thong, T.; Siebourg-Polster, J.; Steiert, B.; Zhang, J.D. An Introduction to Machine Learning. Clinical Pharmacology & Therapeutics 2020, 107, 871–885. [Google Scholar] [CrossRef]
- Pouyanfar, S.; Sadiq, S.; Yan, Y.; Tian, H.; Tao, Y.; Reyes, M.P.; Shyu, M.L.; Chen, S.C.; Iyengar, S.S. A Survey on Deep Learning: Algorithms, Techniques, and Applications. ACM Comput. Surv. 2018, 51. [Google Scholar] [CrossRef]
- Rosado da Cruz, A.; Cruz, E.F. Machine Learning Techniques for Requirements Engineering: A Comprehensive Literature Review. Software 2025, 4. [Google Scholar] [CrossRef]
- Xu, H.; Pang, G.; Wang, Y.; Wang, Y. Deep Isolation Forest for Anomaly Detection. IEEE Transactions on Knowledge and Data Engineering 2023, 35, 12591–12604. [Google Scholar] [CrossRef]
- Liu, F.T.; Ting, K.M.; Zhou, Z.H. Isolation forest. In Proceedings of the 2008 eighth ieee international conference on data mining. IEEE; 2008; pp. 413–422. [Google Scholar]
- van Engelen, J.E.; Hoos, H.H. A survey on semi-supervised learning. Machine Learning 2020, 109, 1573–0565. [Google Scholar] [CrossRef]
- Chala, A.T.; Ray, R. Assessing the Performance of Machine Learning Algorithms for Soil Classification Using Cone Penetration Test Data. Applied Sciences 2023, 13. [Google Scholar] [CrossRef]
- Alves, L.; Sá, M.; Cruz, E.F.; Alves, T.; Alves, M.; Oliveira, J.; Santos, M.; Rosado da Cruz, A.M. A Traceability Platform for Monitoring Environmental and Social Sustainability in the Textile and Clothing Value Chain: Towards a Digital Passport for Textiles and Clothing. Sustainability 2024, 16. [Google Scholar] [CrossRef]
- Durand, A.; Goetz, T.; Hettesheimer, T.; Tholen, L.; Hirzel, S.; Adisorn, T. Enhancing evaluations of future energy-related product policies with the Digital Product Passport. In Proceedings of the Proceedings of Energy Evaluation Europe 2022 Conference. Paris-Saclay University, 2022, pp. 28–30.
- Lindström, J.; Kyösti, P.; Psarommatis, F.; Andersson, K.; Starck Enman, K. Extending Product Lifecycles—An Initial Model with New and Emerging Existential Design Aspects Required for Long and Extendable Lifecycles. Applied Sciences 2024, 14. [Google Scholar] [CrossRef]
- Psarommatis, F.; May, G. Digital Product Passport: A Pathway to Circularity and Sustainability in Modern Manufacturing. Sustainability 2024, 16. [Google Scholar] [CrossRef]
- Ariyaluran Habeeb, R.A.; Nasaruddin, F.; Gani, A.; Targio Hashem, I.A.; Ahmed, E.; Imran, M. Real-time big data processing for anomaly detection: A Survey. International Journal of Information Management 2019, 45, 289–307. [Google Scholar] [CrossRef]
- Al-amri, R.; Murugesan, R.K.; Man, M.; Abdulateef, A.F.; Al-Sharafi, M.A.; Alkahtani, A.A. A Review of Machine Learning and Deep Learning Techniques for Anomaly Detection in IoT Data. Applied Sciences 2021, 11. [Google Scholar] [CrossRef]
- Zhu, M.; Wang, J.; Yang, X.; Zhang, Y.; Zhang, L.; Ren, H.; Wu, B.; Ye, L. A review of the application of machine learning in water quality evaluation. Eco-Environment & Health 2022, 1, 107–116. [Google Scholar] [CrossRef]
- Uddin, M.G.; Nash, S.; Rahman, A.; Olbert, A.I. Performance analysis of the water quality index model for predicting water state using machine learning techniques. Process Safety and Environmental Protection 2023, 169, 808–828. [Google Scholar] [CrossRef]
- Ndung’u, R.N. Data Preparation for Machine Learning Modelling. International Journal of Computer Applications Technology and Research 2022, 11, 231–235. [Google Scholar] [CrossRef]
- Agyemang, E.F. Anomaly detection using unsupervised machine learning algorithms: A simulation study. Scientific African 2024, 26, e02386. [Google Scholar] [CrossRef]
- Johannesen, N.J.; Kolhe, M.L.; Goodwin, M. Vertical approach anomaly detection using local outlier factor. In Power Systems Cybersecurity: Methods, Concepts, and Best Practices; Springer, 2023; pp. 297–310.
- Barbado, A.; Corcho, Ó.; Benjamins, R. Rule extraction in unsupervised anomaly detection for model explainability: Application to OneClass SVM. Expert Systems with Applications 2022, 189, 116100. [Google Scholar] [CrossRef]
- Setiadi, D.R.I.M.; Muslikh, A.R.; Iriananda, S.W.; Warto, W.; Gondohanindijo, J.; Ojugo, A.A. Outlier Detection Using Gaussian Mixture Model Clustering to Optimize XGBoost for Credit Approval Prediction. Journal of Computing Theories and Applications 2024, 2, 244–255. [Google Scholar] [CrossRef]
- Airlangga, G. ANALYSIS OF MACHINE LEARNING ALGORITHMS FOR SEISMIC ANOMALY DETECTION IN INDONESIA: UNVEILING PATTERNS IN THE PACIFIC RING OF FIRE. Jurnal Lebesgue : Jurnal Ilmiah Pendidikan Matematika, Matematika dan Statistika 2024, 5, 37–48. [Google Scholar] [CrossRef]
- Greenacre, M.; Groenen, P.J.; Hastie, T.; d’Enza, A.I.; Markos, A.; Tuzhilina, E. Principal component analysis. Nature Reviews Methods Primers 2022, 2, 100. [Google Scholar] [CrossRef]
- Chen, T.; Guestrin, C. XGBoost: A Scalable Tree Boosting System. In Proceedings of the Proceedings of the 22nd ACM SIGKDD International Conference on Knowledge Discovery and Data Mining, New York, NY, USA, 2016. [CrossRef]
- Tatachar, A.V. Comparative assessment of regression models based on model evaluation metrics. International Research Journal of Engineering and Technology (IRJET) 2021, 8, 2395–0056. [Google Scholar]
Figure 1.
Distribution of data point classifications based on data validity category.
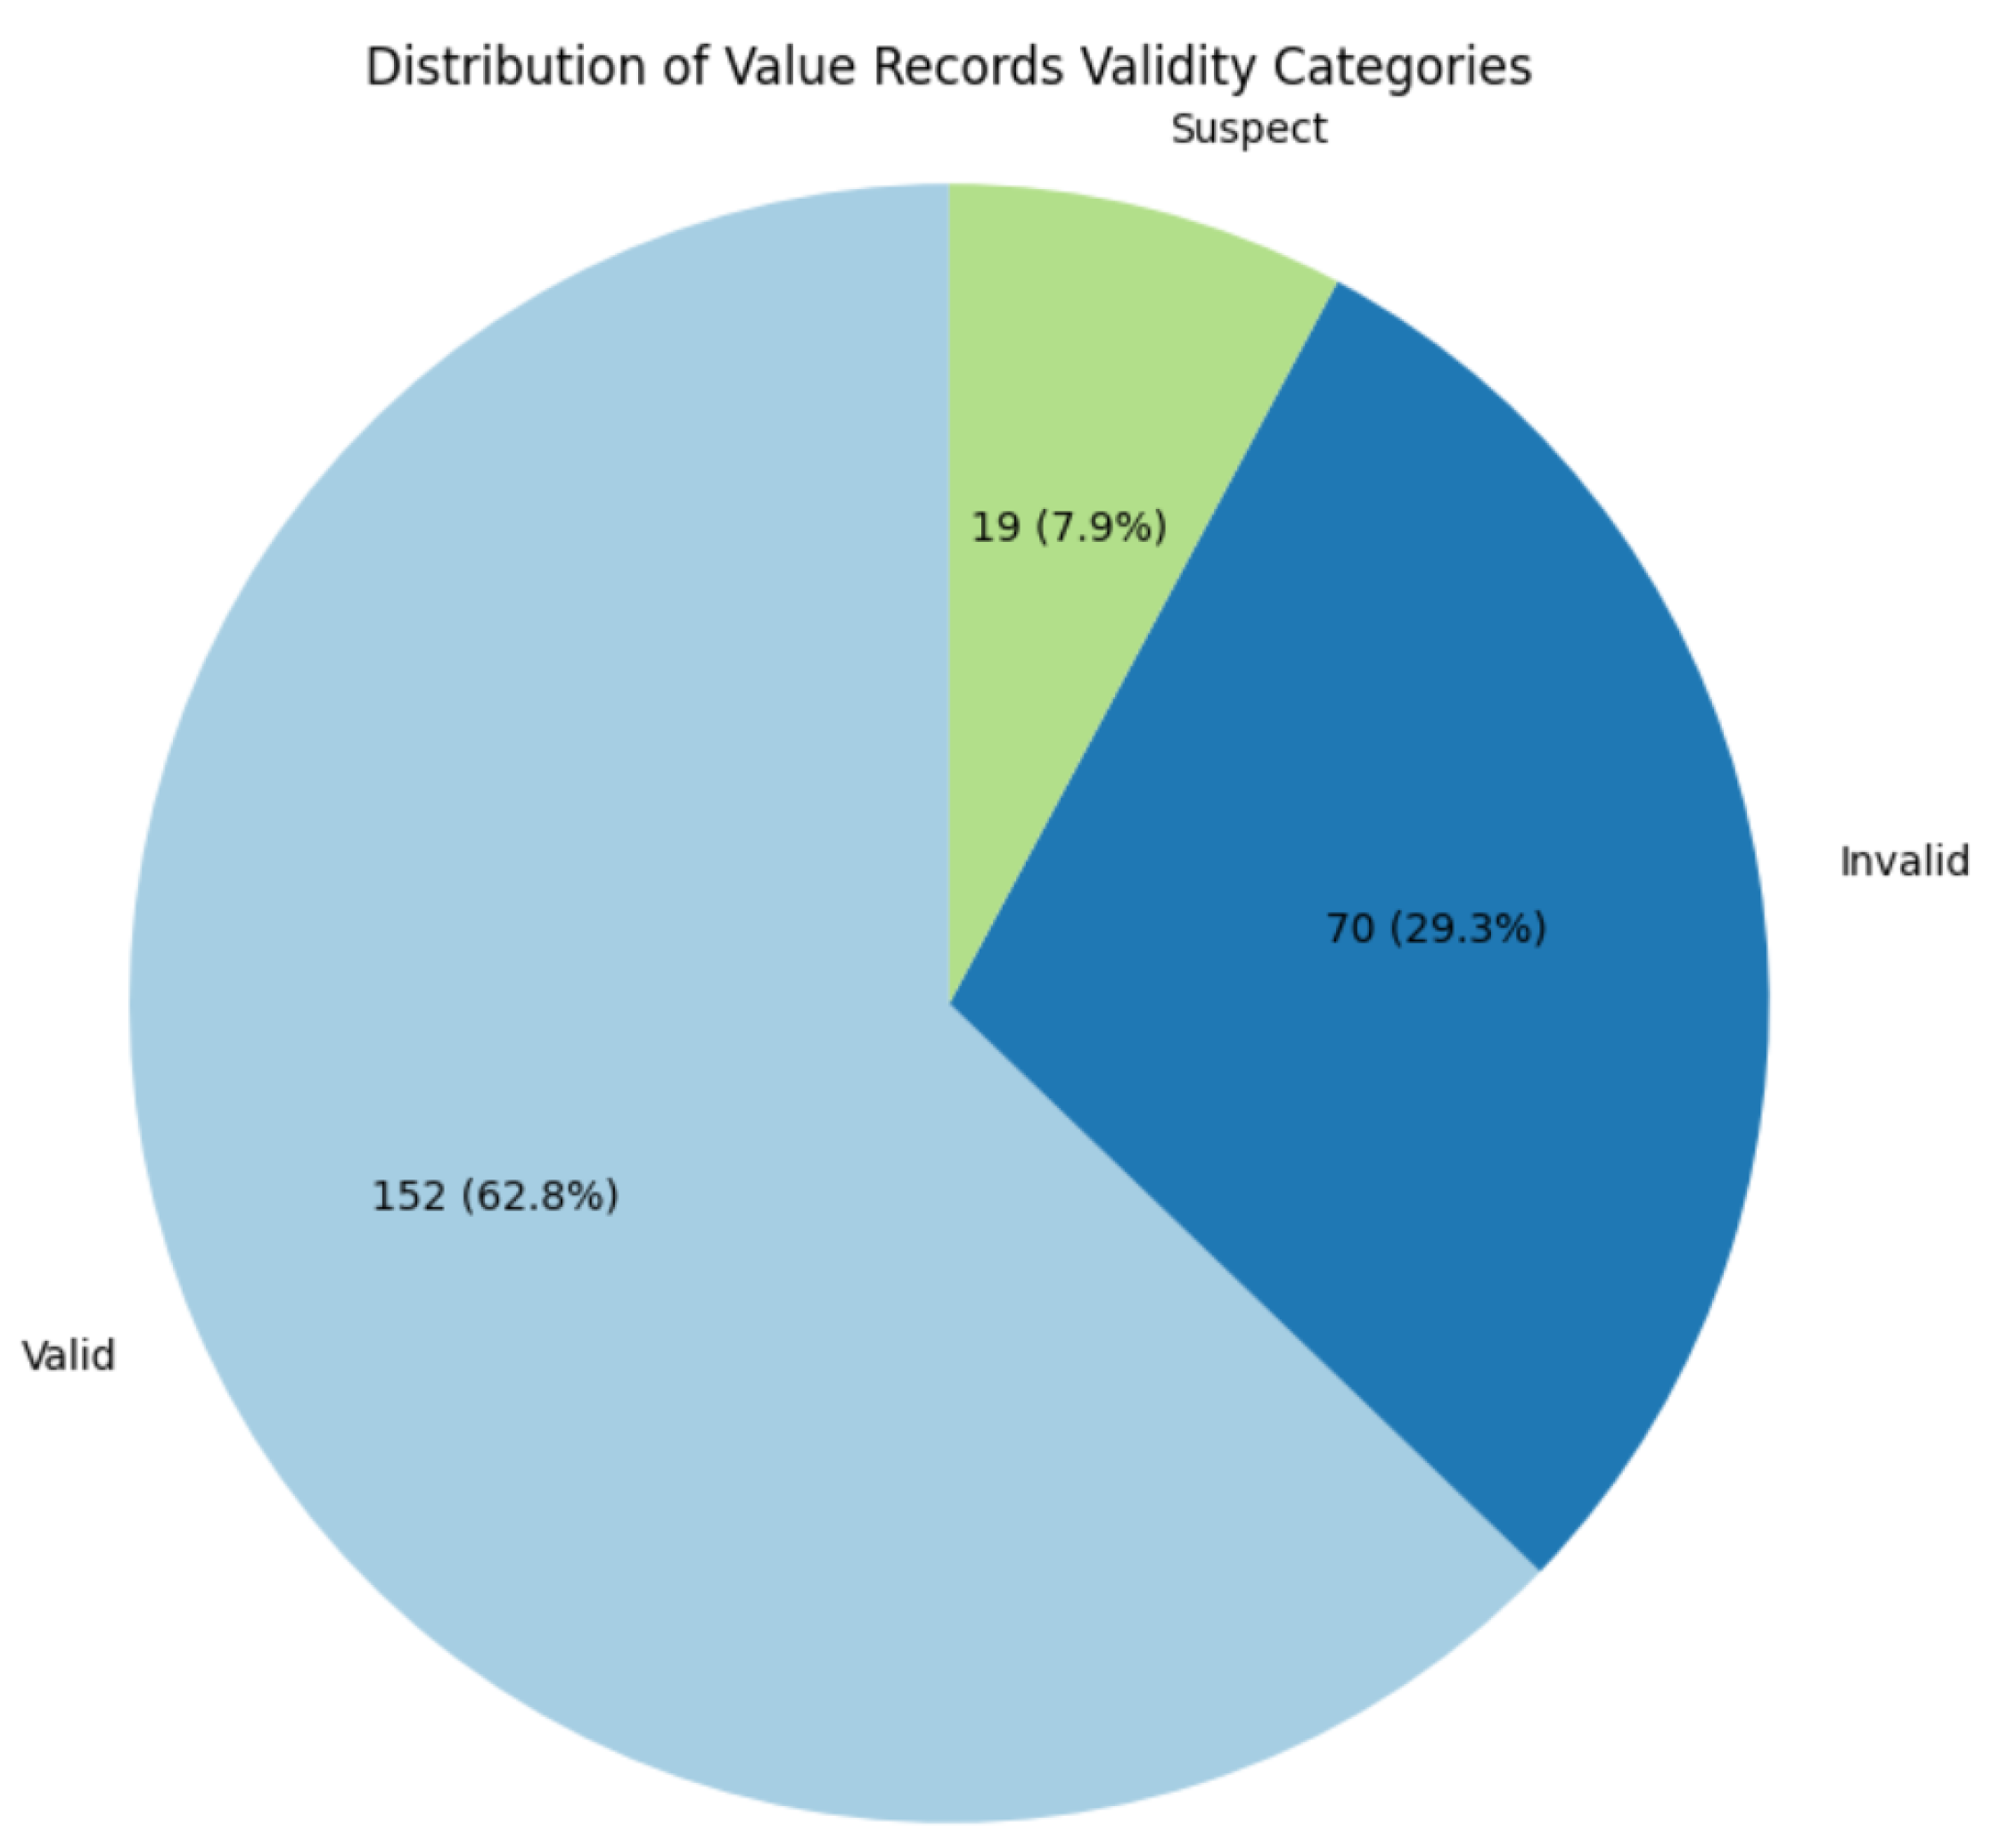
Figure 2.
Comparative visualization of data validity categorization using multiple unsupervised anomaly detection models.
Figure 2.
Comparative visualization of data validity categorization using multiple unsupervised anomaly detection models.
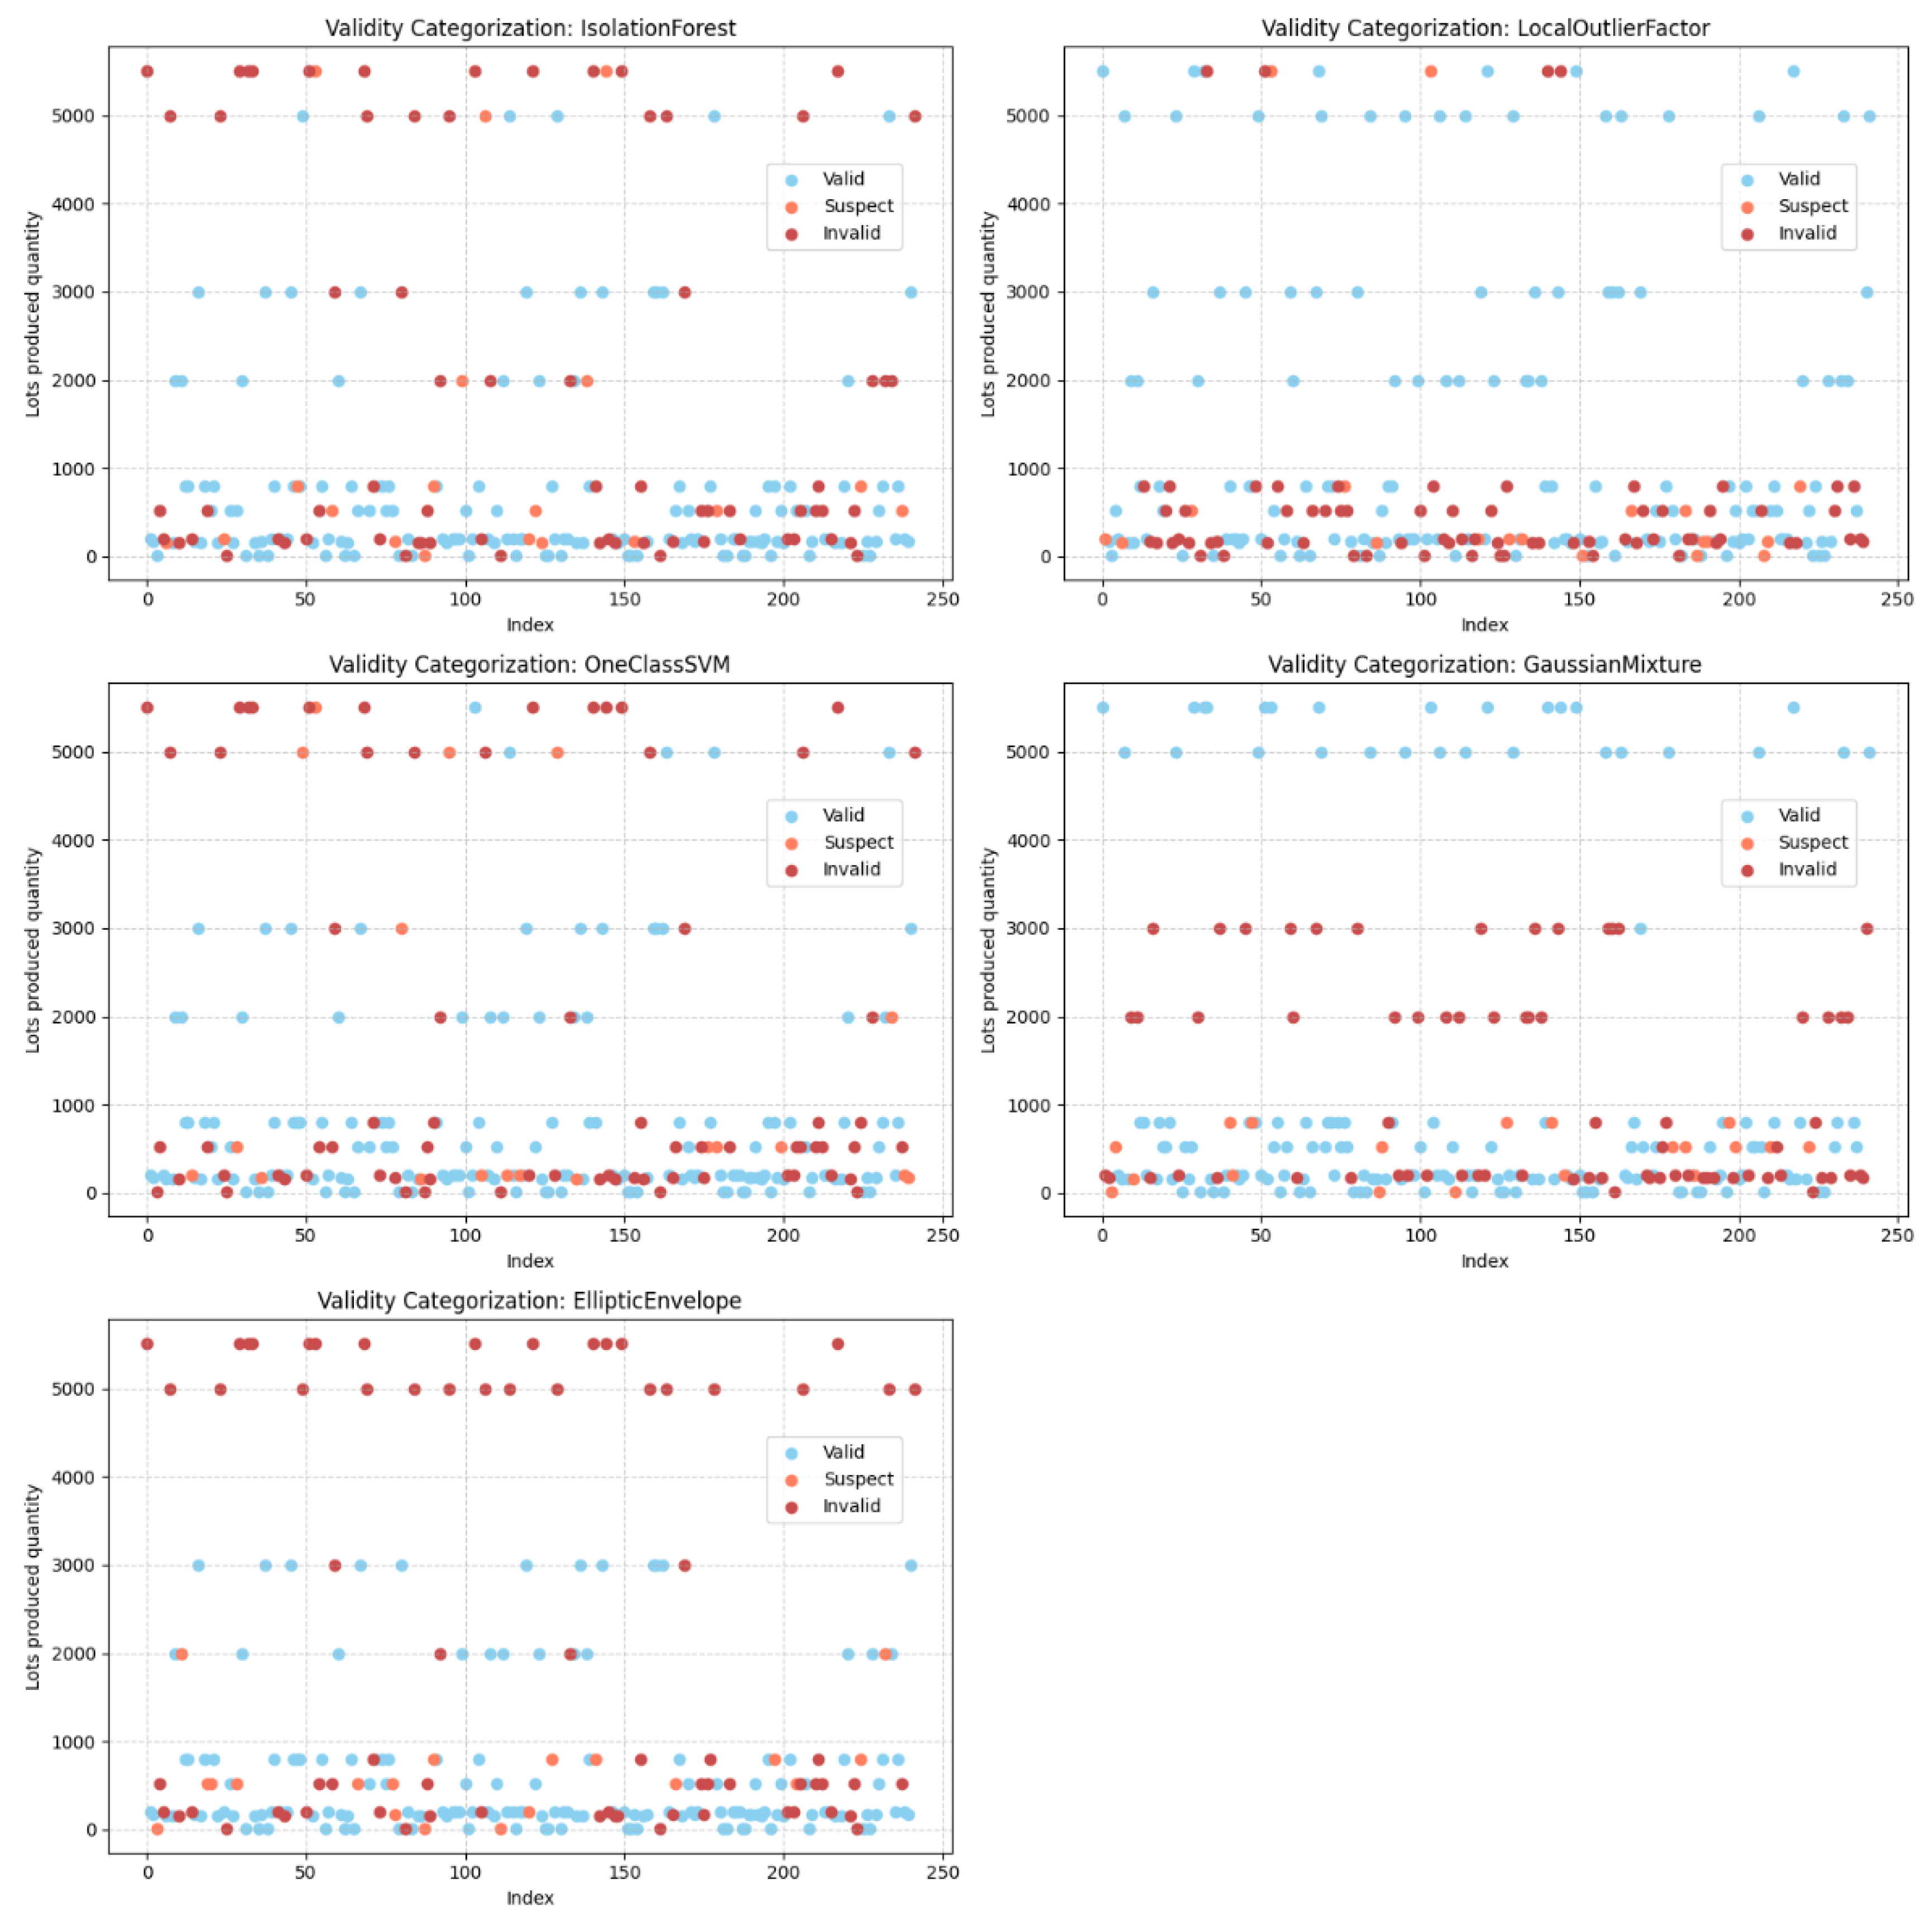
Figure 3.
Cumulative explained variance as a function of the number of principal components.
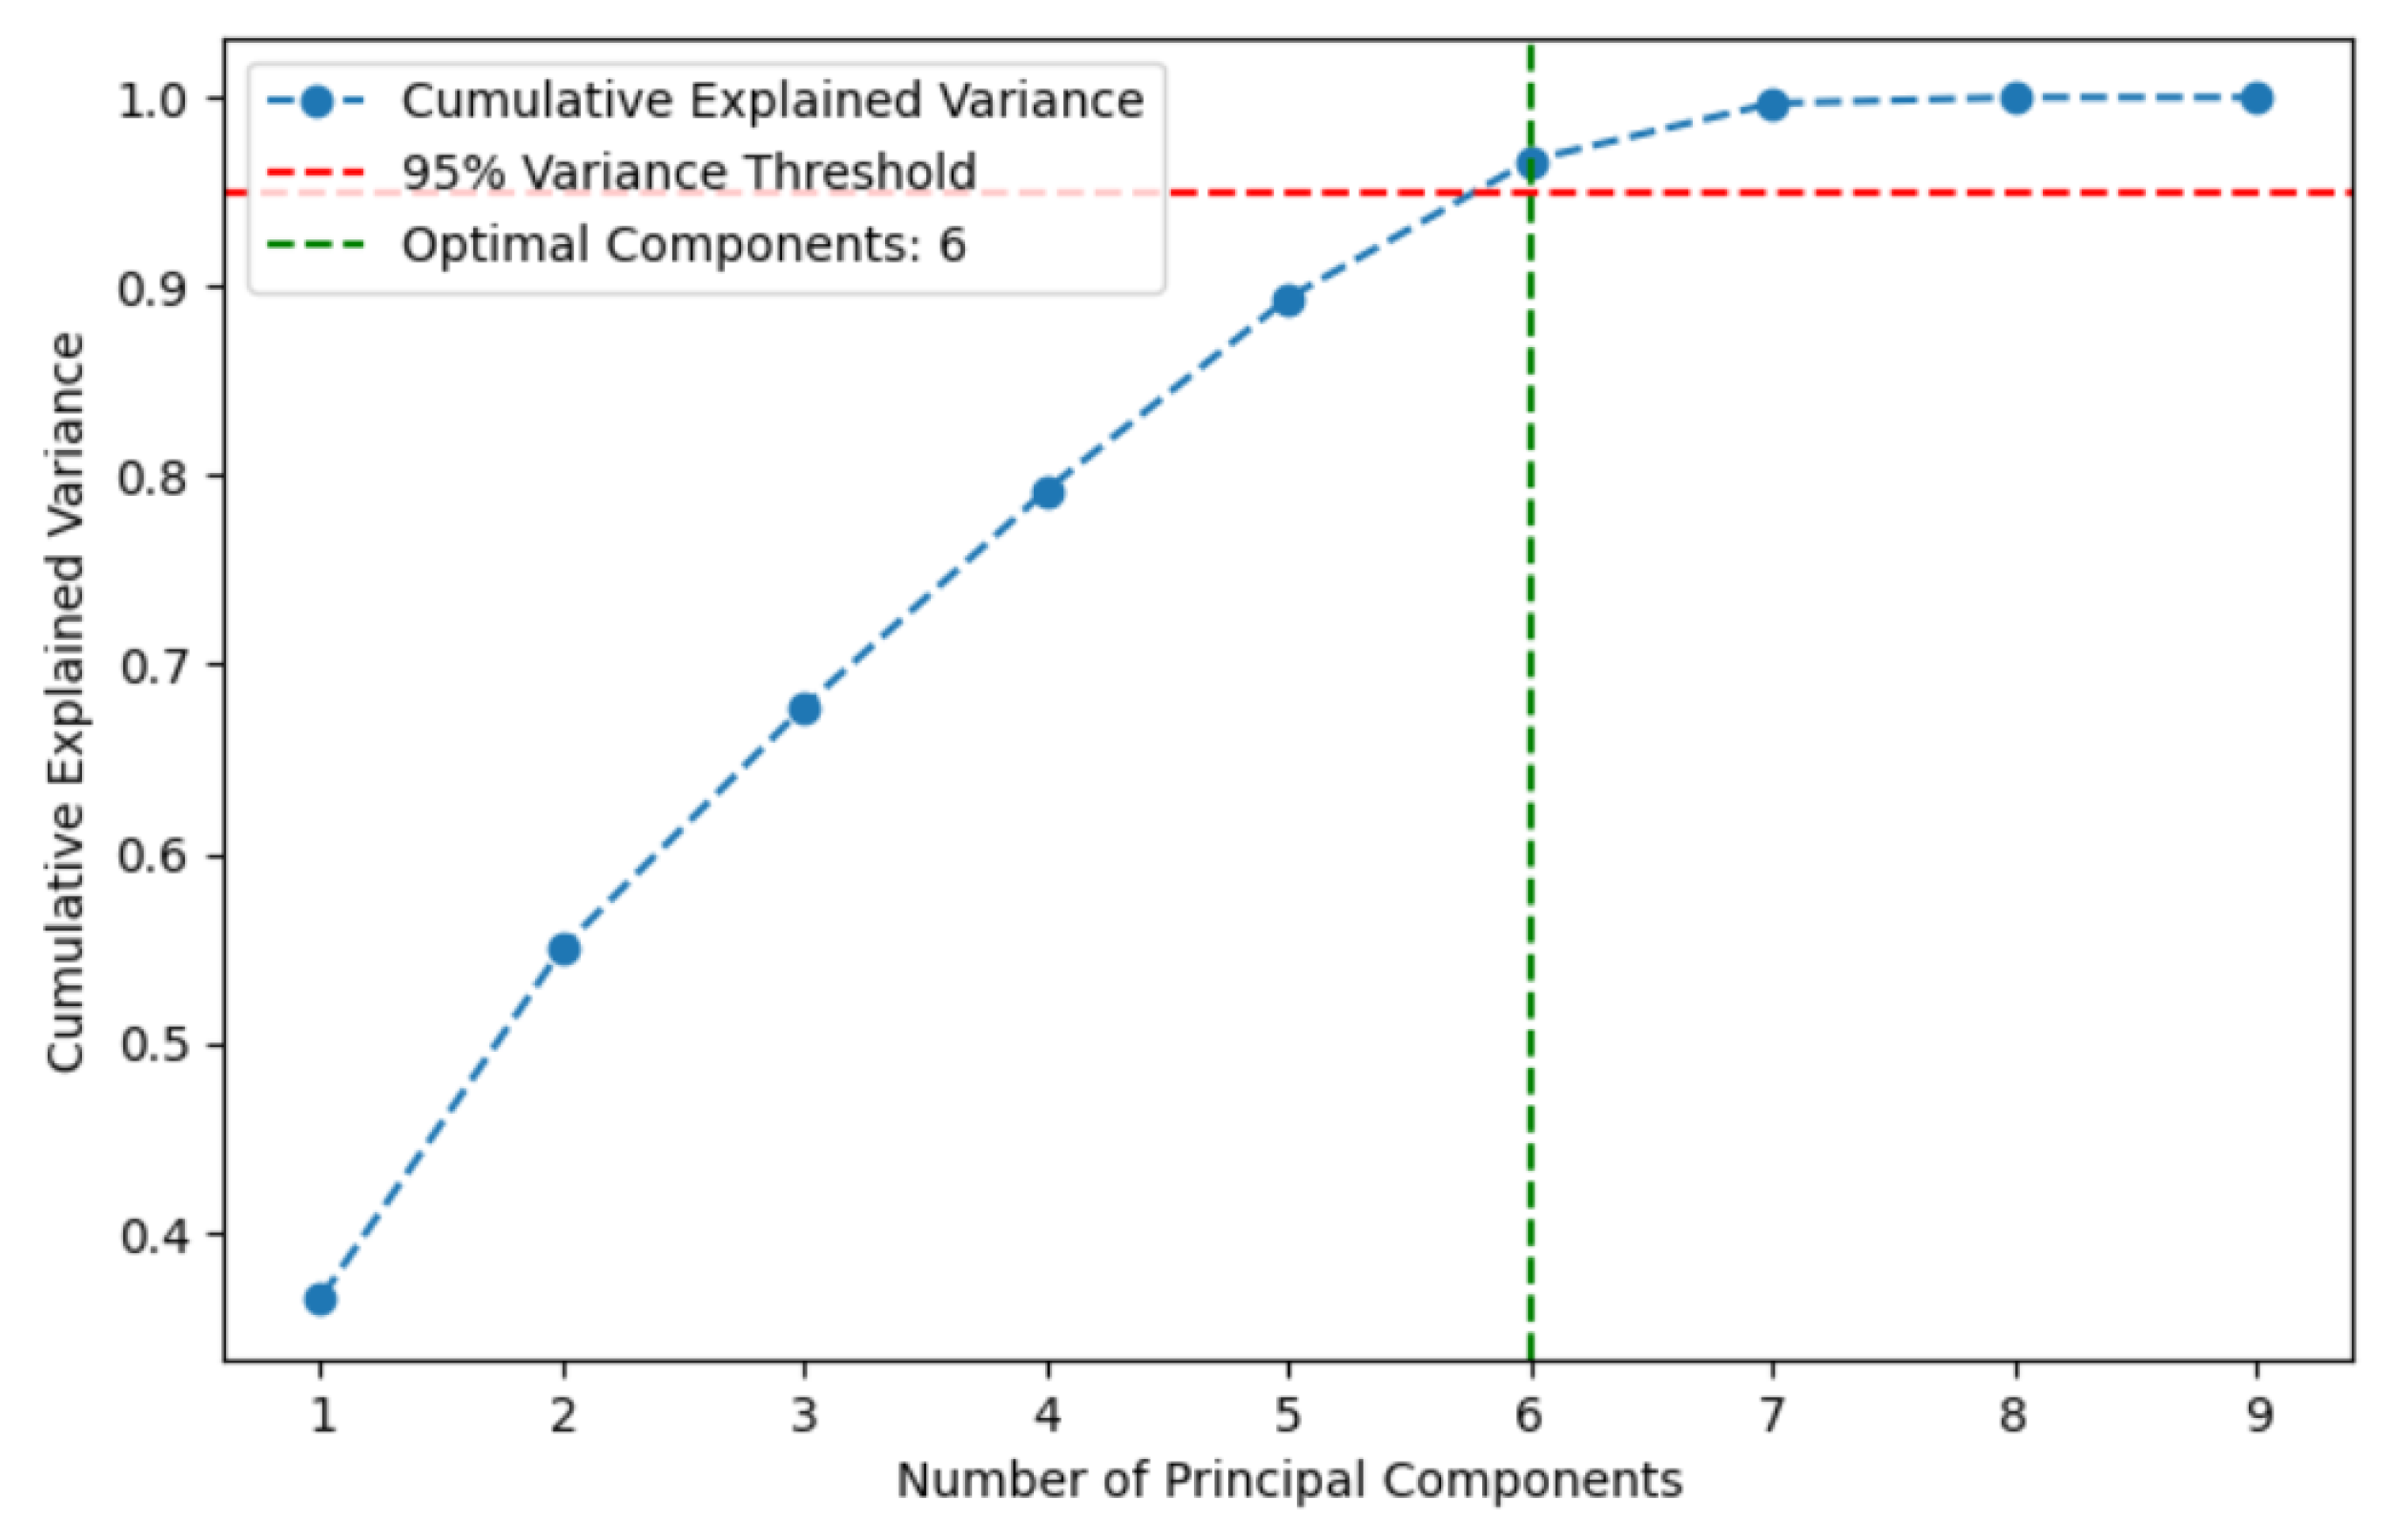
Figure 4.
Correlation Matrix - Relation between the environmental impact metrics.
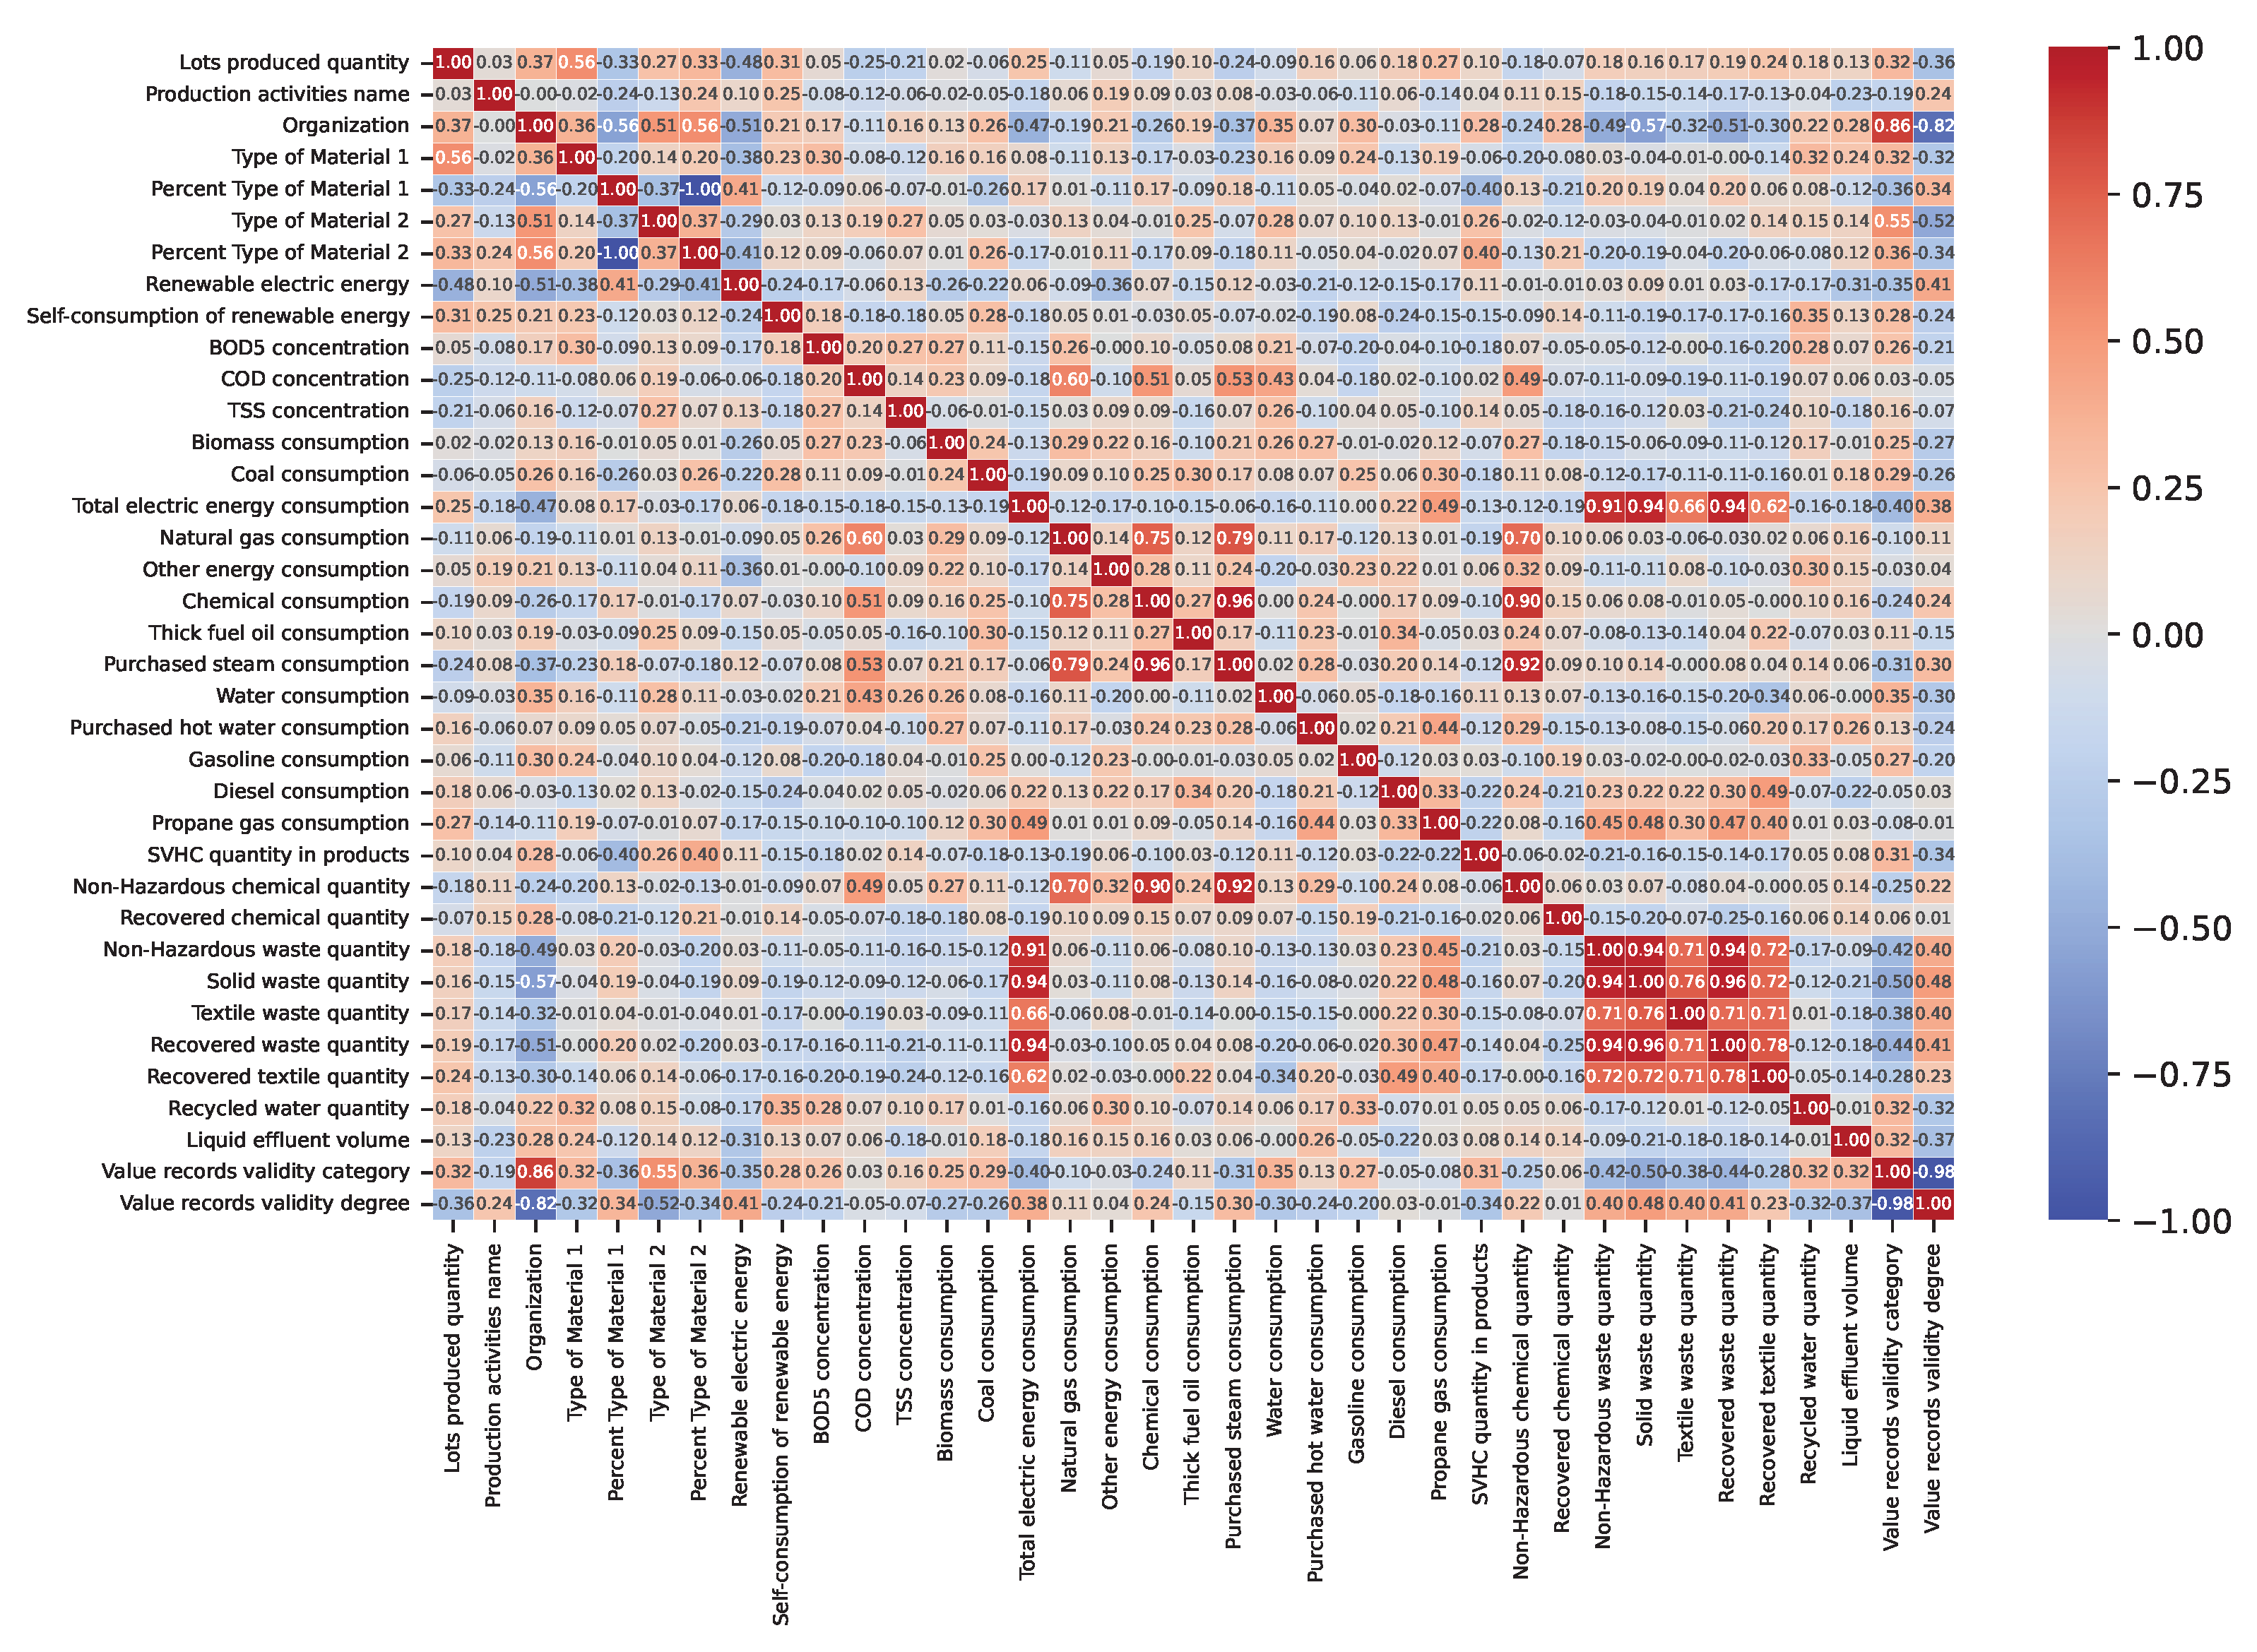

Table 1.
Performance of Anomaly Detection ML Models.
| ID | ML Models | PM | Results |
|---|---|---|---|
| 1 | IsolationForest | Accuracy F1-score Precision Recall |
45.04% 29.69% 29.69% 29.69% |
| 2 | LocalOutlierFactor | Accuracy F1-score Precision Recall |
52.48% 34.61% 34.61% 34.61% |
| 3 | OneClassSVM | Accuracy F1-score Precision Recall |
46.69% 30.82% 30.82% 30.82% |
| 4 | GaussianMixture | Accuracy F1-score Precision Recall |
44.63% 29.22% 29.22% 29.22% |
| 5 | RC with EllipticEnvelope | Accuracy F1-score Precision Recall |
41.74% 25.90% 25.90% 25.90% |
Table 2.
Performance of Anomaly Detection ML Models with PCA.
| ID | ML Models | PM | Results |
|---|---|---|---|
| 1 | IsolationForest | Accuracy F1-score Precision Recall |
49.59% 34.39% 34.39% 34.39% |
| 2 | LocalOutlierFactor | Accuracy F1-score Precision Recall |
50.00% 32.54% 32.54% 32.54% |
| 3 | OneClassSVM | Accuracy F1-score Precision Recall |
49.59% 36.43% 36.43% 36.43% |
| 4 | GaussianMixture | Accuracy F1-score Precision Recall |
45.87% 27.84% 27.84% 27.84% |
| 5 | RC with EllipticEnvelope | Accuracy F1-score Precision Recall |
46.69% 32.85% 32.85% 32.85% |
Table 3.
Performance of ML classification Models.
| ID | ML Models | PM | Results |
|---|---|---|---|
| 1 | RF | Accuracy Precision Recall F1-score |
83.67% 76.80% 83,67% 80.02% |
| 2 | DT | Accuracy Precision Recall F1-score |
77.55% 76.83% 77.55% 77.00% |
| 3 | SVM | Accuracy Precision Recall F1-score |
77.55% 69.96% 77.55% 73.52% |
| 4 | KNN | Accuracy Precision Recall F1-score |
75.51% 67.23% 75.51% 70.95% |
| 5 | NB | Accuracy Precision Recall F1-score |
34.69% 78.78% 34.69% 31.98% |
Table 4.
Performance of ML regression Models.
| ID | ML Models | PM | Results |
|---|---|---|---|
| 1 | RF | Score | 77,18% |
| 2 | XGBoost | Score | 76,89% |
| 3 | DT | Score | 62,39% |
Table 5.
Performance of ML classification Models.
| ID | ML Models | PM | Results |
|---|---|---|---|
| 1 | RF | Accuracy F1-score Precision |
96% 98% 97% |
| 2 | DT | Accuracy F1-score Precision |
95% 98% 96% |
| 3 | KNN | Accuracy F1-score Precision |
70% 71% 76% |
| 4 | SVM | Accuracy F1-score Precision |
63% 66% 79% |
| 5 | NB | Accuracy F1-score Recall |
67% 65% 67% |
Table 6.
Performance of ML regression Models.
| ID | ML Models | PM | Results |
|---|---|---|---|
| 1 | DT | Score | 85% |
| 2 | RF | Score | 56% |
| 3 | XgBoost | Score | 52% |
Table 7.
Performance of the top 5 ML regression models from Section 6.4.1 (Dedicated Model per Metric).
Table 7.
Performance of the top 5 ML regression models from Section 6.4.1 (Dedicated Model per Metric).
| ID | ML Algorithm | Target Metric | Perf. Metric | Result |
|---|---|---|---|---|
| 1 | Decision Tree (DT) | Total electricity consumption | Score | 99% |
| 2 | Random Forest (RF) | Amount of solid waste | Score | 93% |
| 3 | XGBoost | Consumption of chemical products |
Score | 91% |
| 4 | XGBoost | Quantity of waste recovered | Score | 91% |
| 5 | Random Forest (RF) | Purchased steam consumption | Score | 86% |
Table 8.
Performance of the top 3 ML regression models from Section 6.4.2 (Single Unified Model).
Table 8.
Performance of the top 3 ML regression models from Section 6.4.2 (Single Unified Model).
| ID | ML Algorithm | Perf. Metric | Result |
|---|---|---|---|
| 1 | Random Forest (RF) | Score | 98% |
| 2 | XGBoost | Score | 96% |
| 3 | K-Nearest Neighbors (KNN) | Score | 46% |
Table 9.
Comparison between the dedicated models (28/28) and single unified model (1/28) approaches.
Table 9.
Comparison between the dedicated models (28/28) and single unified model (1/28) approaches.
| Criteria | Section 6.4.1 (28/28) | Section 6.4.2 (1/28) |
|---|---|---|
| Overall score | High for best models (metric-specific) | High overall (e.g., 98%), but potentially variable per metric |
| Metric-Specific | Potentially higher per metric | Can be lower for specific metrics vs. dedicated models |
| MAE | Generally Lower (higher accuracy per metric) | Potentially Higher for some metrics (lower accuracy) |
| Maintenance | Complex (manage 28 models) | Simpler (manage 1 model) |
| Scalability | More difficult (adding metrics requires new models) | Easier (handles new targets via `target_name` if structure similar) |
| Recommendation | When highest precision per metric is critical | When scalability, maintainability, and good overall performance are key |
Table 10.
Comparison of the four proposed ML-based approaches for textile data validation.
| Approach | Model Type | Dataset Type | Strengths | Limitations | Best Use Case |
|---|---|---|---|---|---|
| 1. Anomaly Prediction of Individual Metrics | Unsupervised | Single metric |
|
|
Applicable when labeled data is scarce and metrics need to be validated individually |
| 2. Supervised (Classification and Regression) Prediction of Individual Metrics | Supervised | Single metric |
|
|
Applicable when each metric can be treated independently and labeled data is sufficient |
| 3. Supervised Prediction based on collective attributes | Supervised | All metrics together |
|
|
Applicable when validating global consistency of records across all metrics |
| 4. Supervised Prediction of Individual Metrics based on collective attributes | Supervised | All metrics together |
|
|
Applicable when validating specific metric values based on the context provided by other metrics |
Table 11.
ML API endpoints available.
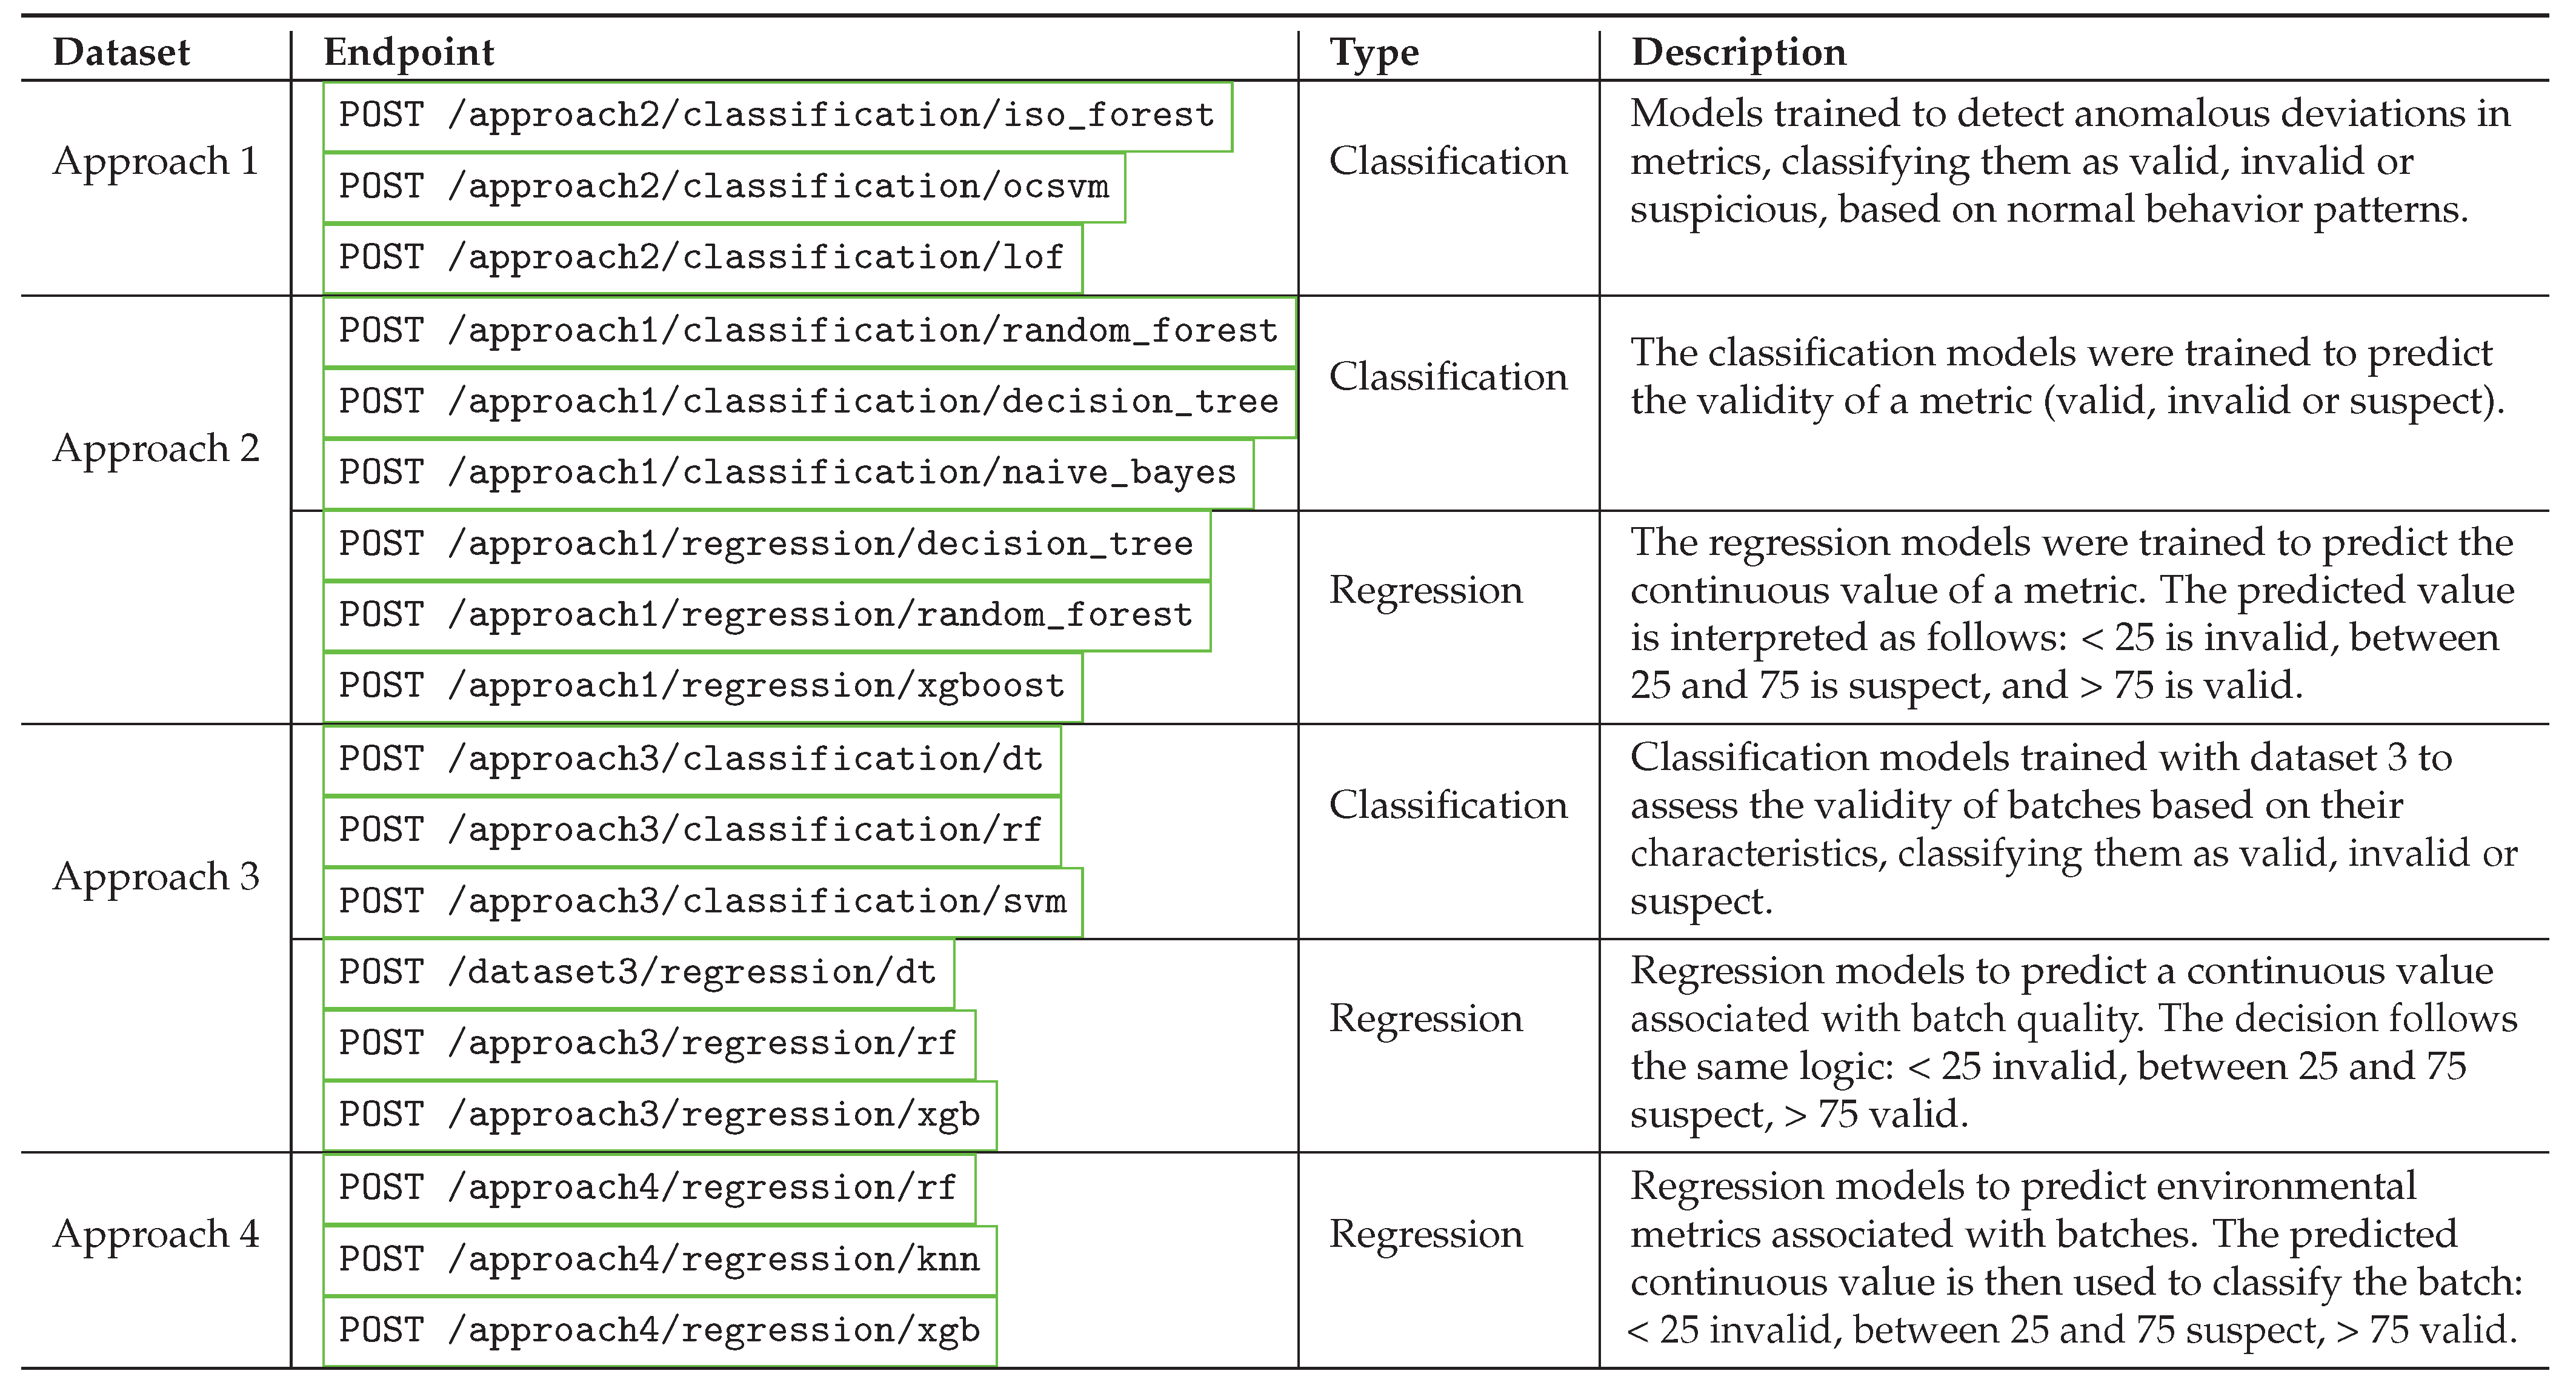 |
Disclaimer/Publisher’s Note: The statements, opinions and data contained in all publications are solely those of the individual author(s) and contributor(s) and not of MDPI and/or the editor(s). MDPI and/or the editor(s) disclaim responsibility for any injury to people or property resulting from any ideas, methods, instructions or products referred to in the content. |
© 2025 by the authors. Licensee MDPI, Basel, Switzerland. This article is an open access article distributed under the terms and conditions of the Creative Commons Attribution (CC BY) license (http://creativecommons.org/licenses/by/4.0/).
Copyright: This open access article is published under a Creative Commons CC BY 4.0 license, which permit the free download, distribution, and reuse, provided that the author and preprint are cited in any reuse.


