1. Introduction
Multiple sclerosis (MS) is a chronic autoimmune disease of the central nervous system characterized by inflammatory demyelinating and axonal injury, leading to secondary neurodegeneration [
1]. Its estimated prevalence ranges from 5 to 300 cases per 100,000 individuals, affecting approximately 2.8 million people globally. MS typically begins between 20 and 40 years of age, is more frequent in women (female-to-male ratio 3:1), and remains the leading cause of non-traumatic neurological disability in young adults in Europe and the United States [
2]. The pathological hallmark includes focal white matter (WM) lesions with inflammation and demyelination. These lesions evolve into variable chronic states, including remyelination, unresolved inflammation, or persistent demyelination with axonal loss [
1].
Relapsing–remitting MS (RRMS) is the most frequent initial phenotype (approximately 85%), characterized by clinical relapses with variable recovery, interspersed with periods of remission and disability progression independent of relapses [
3]. Around 20% of RRMS patients later develop secondary progression, and approximately 15% present with progressive disease from onset. Progressive forms are associated with worse outcomes, greater disability, and fewer therapeutic options [
1,
3].
Disability accumulation in MS is primarily driven by inflammatory activity and neurodegenerative progression [
4]. Consequently, several clinical, radiological, and biochemical tools have been developed for disease monitoring [
5]. Clinically, the Expanded Disability Status Scale (EDSS) remains widely used. Brain magnetic resonance imaging (MRI) enables detection of demyelinating lesions and is essential for diagnosis and follow-up [
1,
5]. In recent years, neurofilament light chain (NfL) has emerged as a promising fluid biomarker associated with inflammatory activity and progression risk [
6]. However, both MRI-based advanced imaging markers and NfL present limitations, such as complex post-processing images requirements or biological variability influenced by comorbidities and individual factors [
6,
7,
8]. Therefore, complementary biomarkers are needed to enhance the accuracy of risk stratification and personalized treatment decisions.
Amyloid positron emission tomography (PET) imaging has been proposed as a noninvasive technique for assessing myelin integrity in MS patients [
9]. Amyloid tracers display selective affinity for aggregated β-sheet structures, such as the myelin basic protein, which is abundant in WM. When myelin is damaged, the loss of β-sheet conformation leads to reduced tracer binding [
10]. Initial studies using amyloid PET in MS demonstrated lower uptake in damaged white matter (DWM) compared to normal-appearing white matter (NAWM) in both MS patients and healthy controls [
11]. Subsequent investigations also detected reduced tracer uptake in MRI-defined NAWM, particularly in patients with active RRMS and progressive phenotypes, when compared to stable RRMS cases [
9,
12,
13]. Moreover, lower baseline amyloid uptake in NAWM has been associated with a higher risk of cognitive decline and greater disability burden [
14,
15].
However, most existing studies are limited by cross-sectional designs, heterogeneous patient cohorts, not including newly diagnoses patients, and not analysing the early PET phase [
9,
12,
13,
14,
16]. Here, we present the first study to include both early and standard phases of amyloid PET in patients with newly diagnosed MS. The primary objective is to evaluate its potential role as a biomarker of disease activity and progression risk.
2. Materials and Methods
Study Design and Population
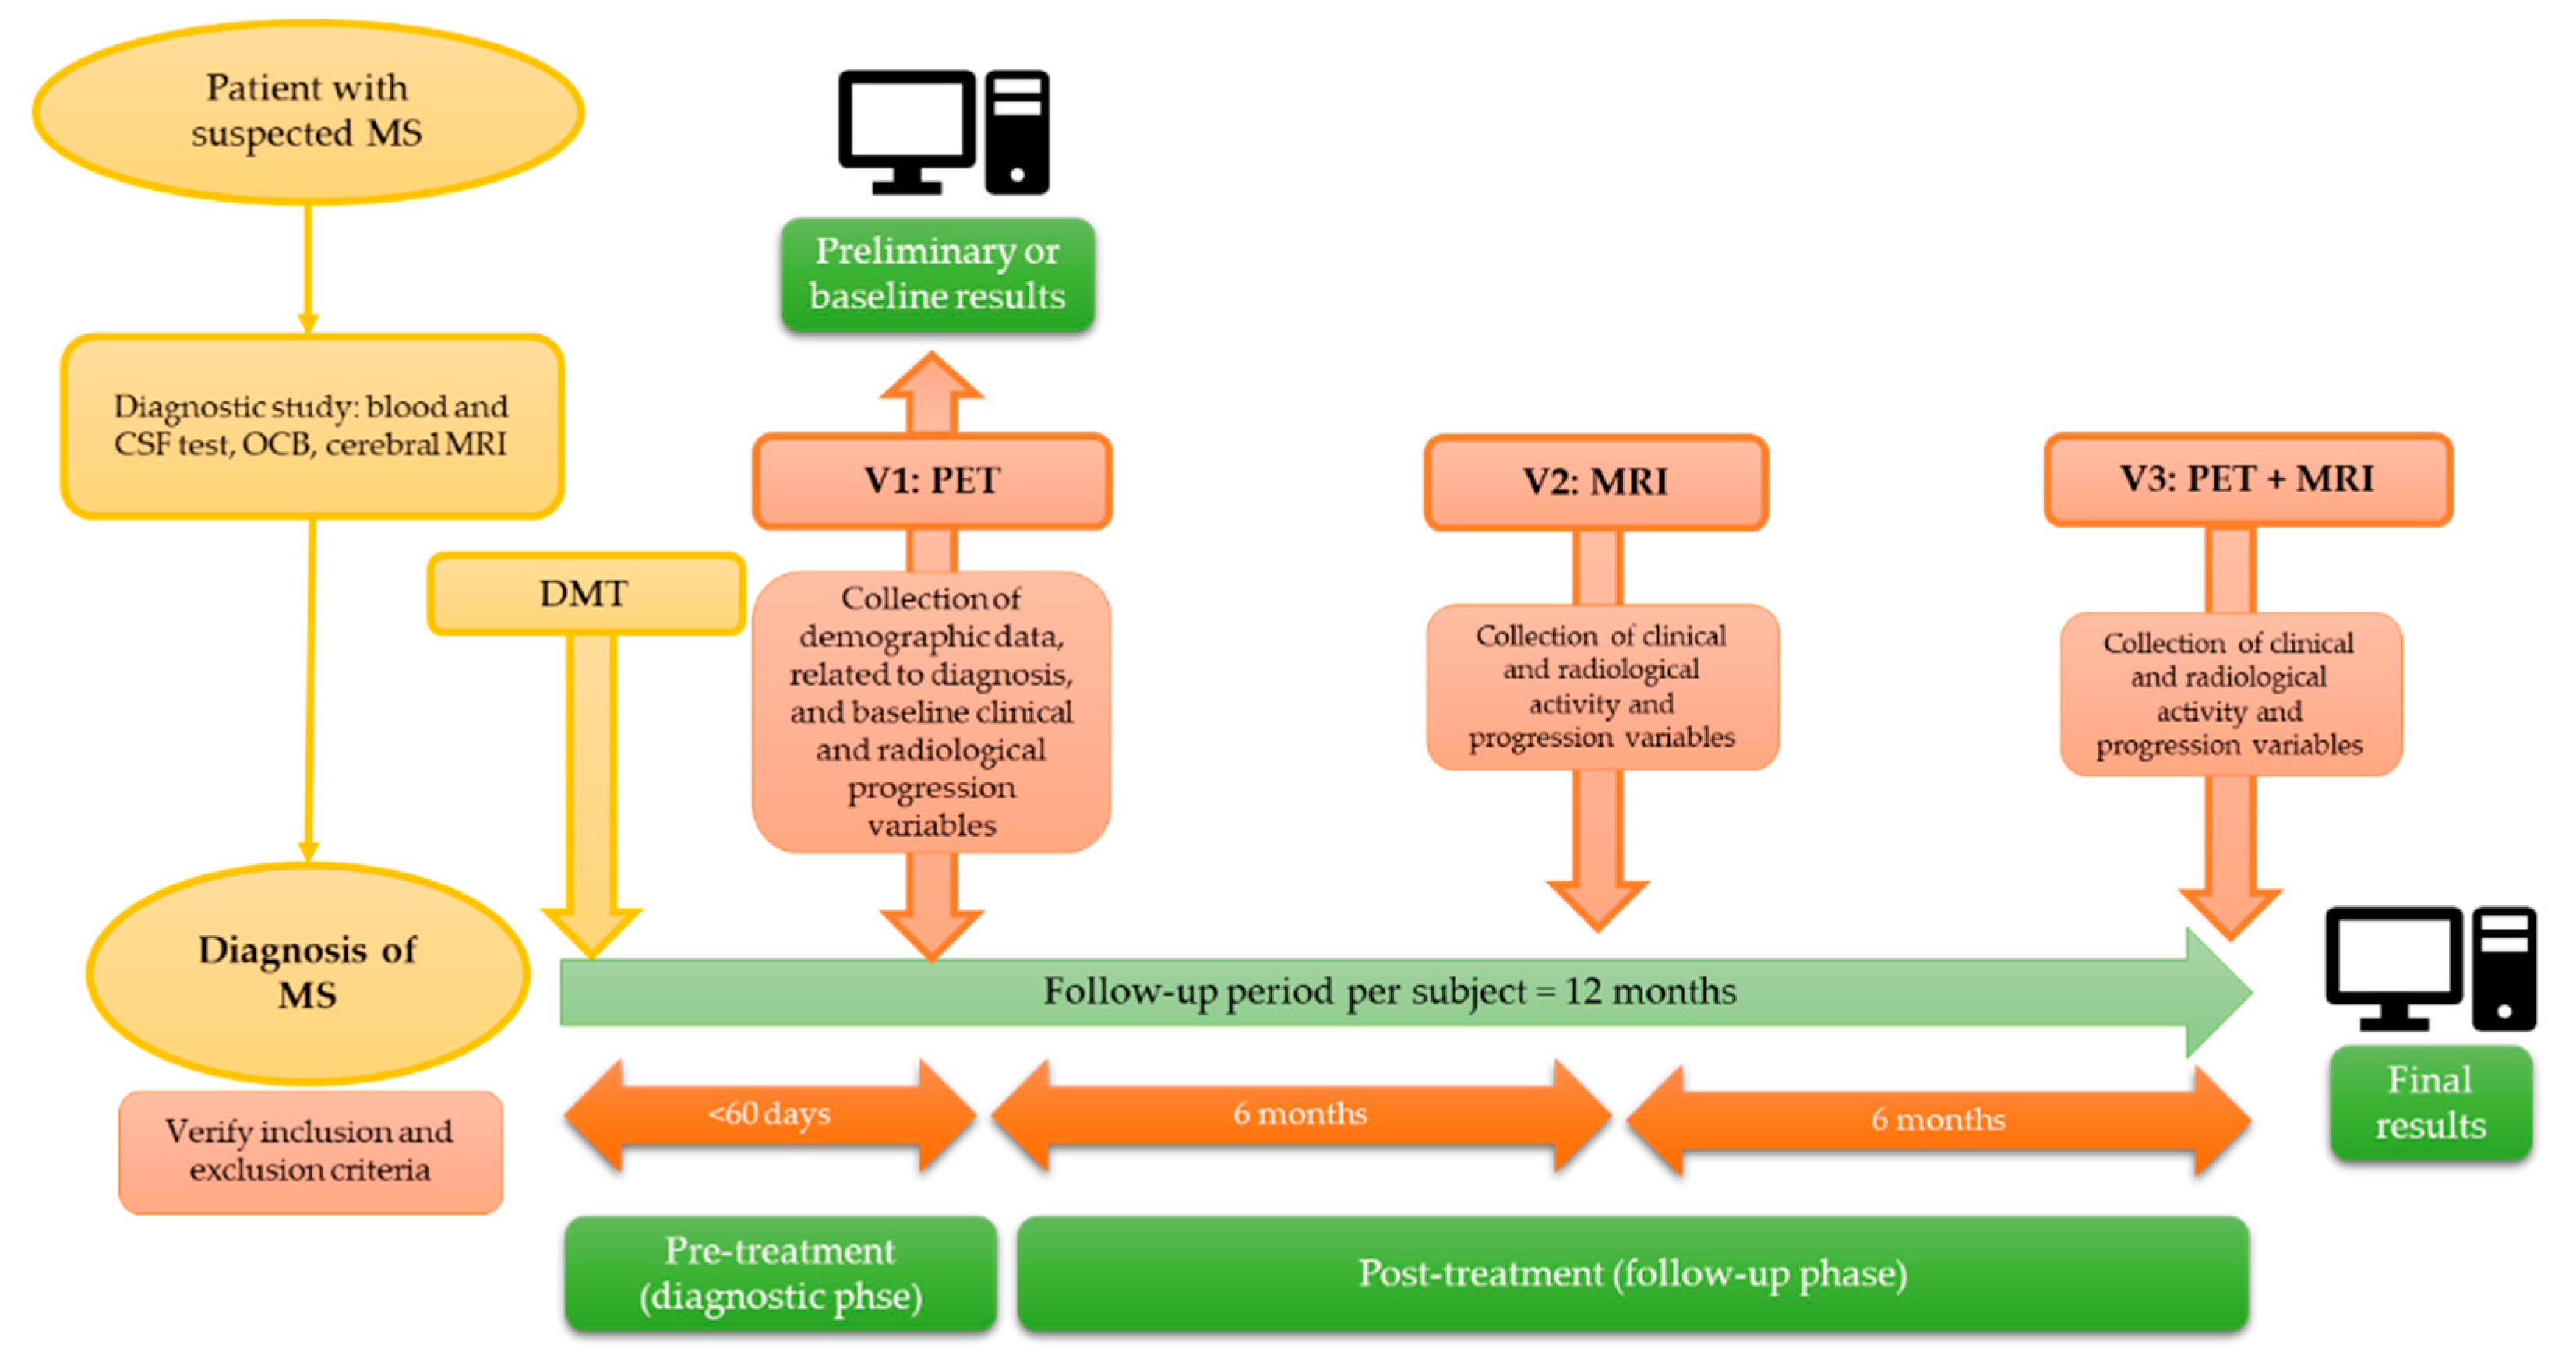
We conducted a multicenter and prospective study in subjects with a recent diagnosis of RRMS, divided into two phases: a pre-treatment or diagnostic phase, in which the correlation between PET findings and baseline variables was analyzed; and a post-treatment or follow-up phase, involving a new follow-up PET scan at 12 months, in which the correlation between baseline and follow-up PET findings and clinical/radiological markers of disease activity and progression was assessed. This article presents preliminary findings from the pre-treatment phase (
Figure 1).
A comprehensive and consecutive recruitment of patients was carried out after being diagnosed with RRMS (according to the 2017 revised McDonalds criteria), from January 2023 to March 2024, in two public hospitals in southern Spain (Hospital Universitario Clínico San Cecilio and Hospital Universitario Virgen de las Nieves in Granada) [
17]. The inclusion and exclusion criteria for MS patients were listed in Supplementary table S1.
Clinical and Cognitive Assessments
Demographic, clinical, radiological, and neuropsychological variables were collected from each subject during the pre-treatment (diagnostic) phase and subsequently during the post-treatment phase. The study variables are summarized in Supplementary table S2.
Each subject underwent a clinical examination, including the assessment of physical disability through the Expanded Disability Status Scale (EDSS), the Timed 25-Foot Walk (T25FW) and the Nine-Hole Peg Test (9HPT) to assess walking speed and upper extremity dexterity, respectively [
5,
18]. Cognitive and neurobehavioral evaluation was assessed including evaluation of information processing speed, verbal memory and learning and visual memory through the Symbol Digit Modalities Test (SDMT), California verbal learning test (CVLT) and the brief visuospatial memory test (BVMT), respectively [
19]. Additional tests included in the neuropsychological battery are summarized in Supplementary table S2. Each patient also completed Modified Fatigue Impact Scale (MFIS-5), the Beck Depression Inventory (BDI-II) to assess depressive symptoms and EuroQoL (EQ-5D) for the health-related quality of life [
20].
Clinical assessments and scale administration were conducted by neurologists from the Demyelinating Diseases Units of the participating hospitals, who were blinded to data collection and analysis. Neuropsychological evaluation and the BICAMS battery were administered by a neuropsychologist.
Brain Magnetic Resonance Imaging
All patients underwent two MRI examinations: one at baseline and one during follow-up. Both diagnostic and follow-up MRI studies were performed on a Philips Ingenia CX 3T system, with a total acquisition time of approximately 20 minutes. Sequence-specific MRI parameters are detailed in Supplementary table S3. All the three-dimensional sequences were acquired with an isotropic voxel size. The images obtained were evaluated by a neuroradiologist with 3 years of experience, considering target lesions those with enhancement or with high signal in T2/FLAIR and a diameter above 3 mm, with a maximum of 5 lesions of each type per patient.
Positron Emission Tomography with 18F-florbetaben
Amyloid PET images were acquired in a Siemens Biograph Vision 600 Positron Emission Tomography/ Computed Tomography (PET/CT) digital scanner. The tracer used, 18F-florbetaben (FBB) (Neuraceq; Piramal Pharma), was administered intravenously at a mean dose of 300 MBq. Amyloid PET was acquired with a dual-point protocol including two acquisitions: early FBB PET (eFBB; 0–5’, 0-10’ p.i.), and standard acquisition FBB PET (sFBB; 90’ p.i.). Specific details about the imaging protocol are given in Supplementary table S4.
Neuroimaging Preprocessing and Analysis
Image processing was performed using a structured workflow, which included lesion segmentation, spatial registration of the data and calculation of Standardized Uptake Value (SUV) values in different brain regions.
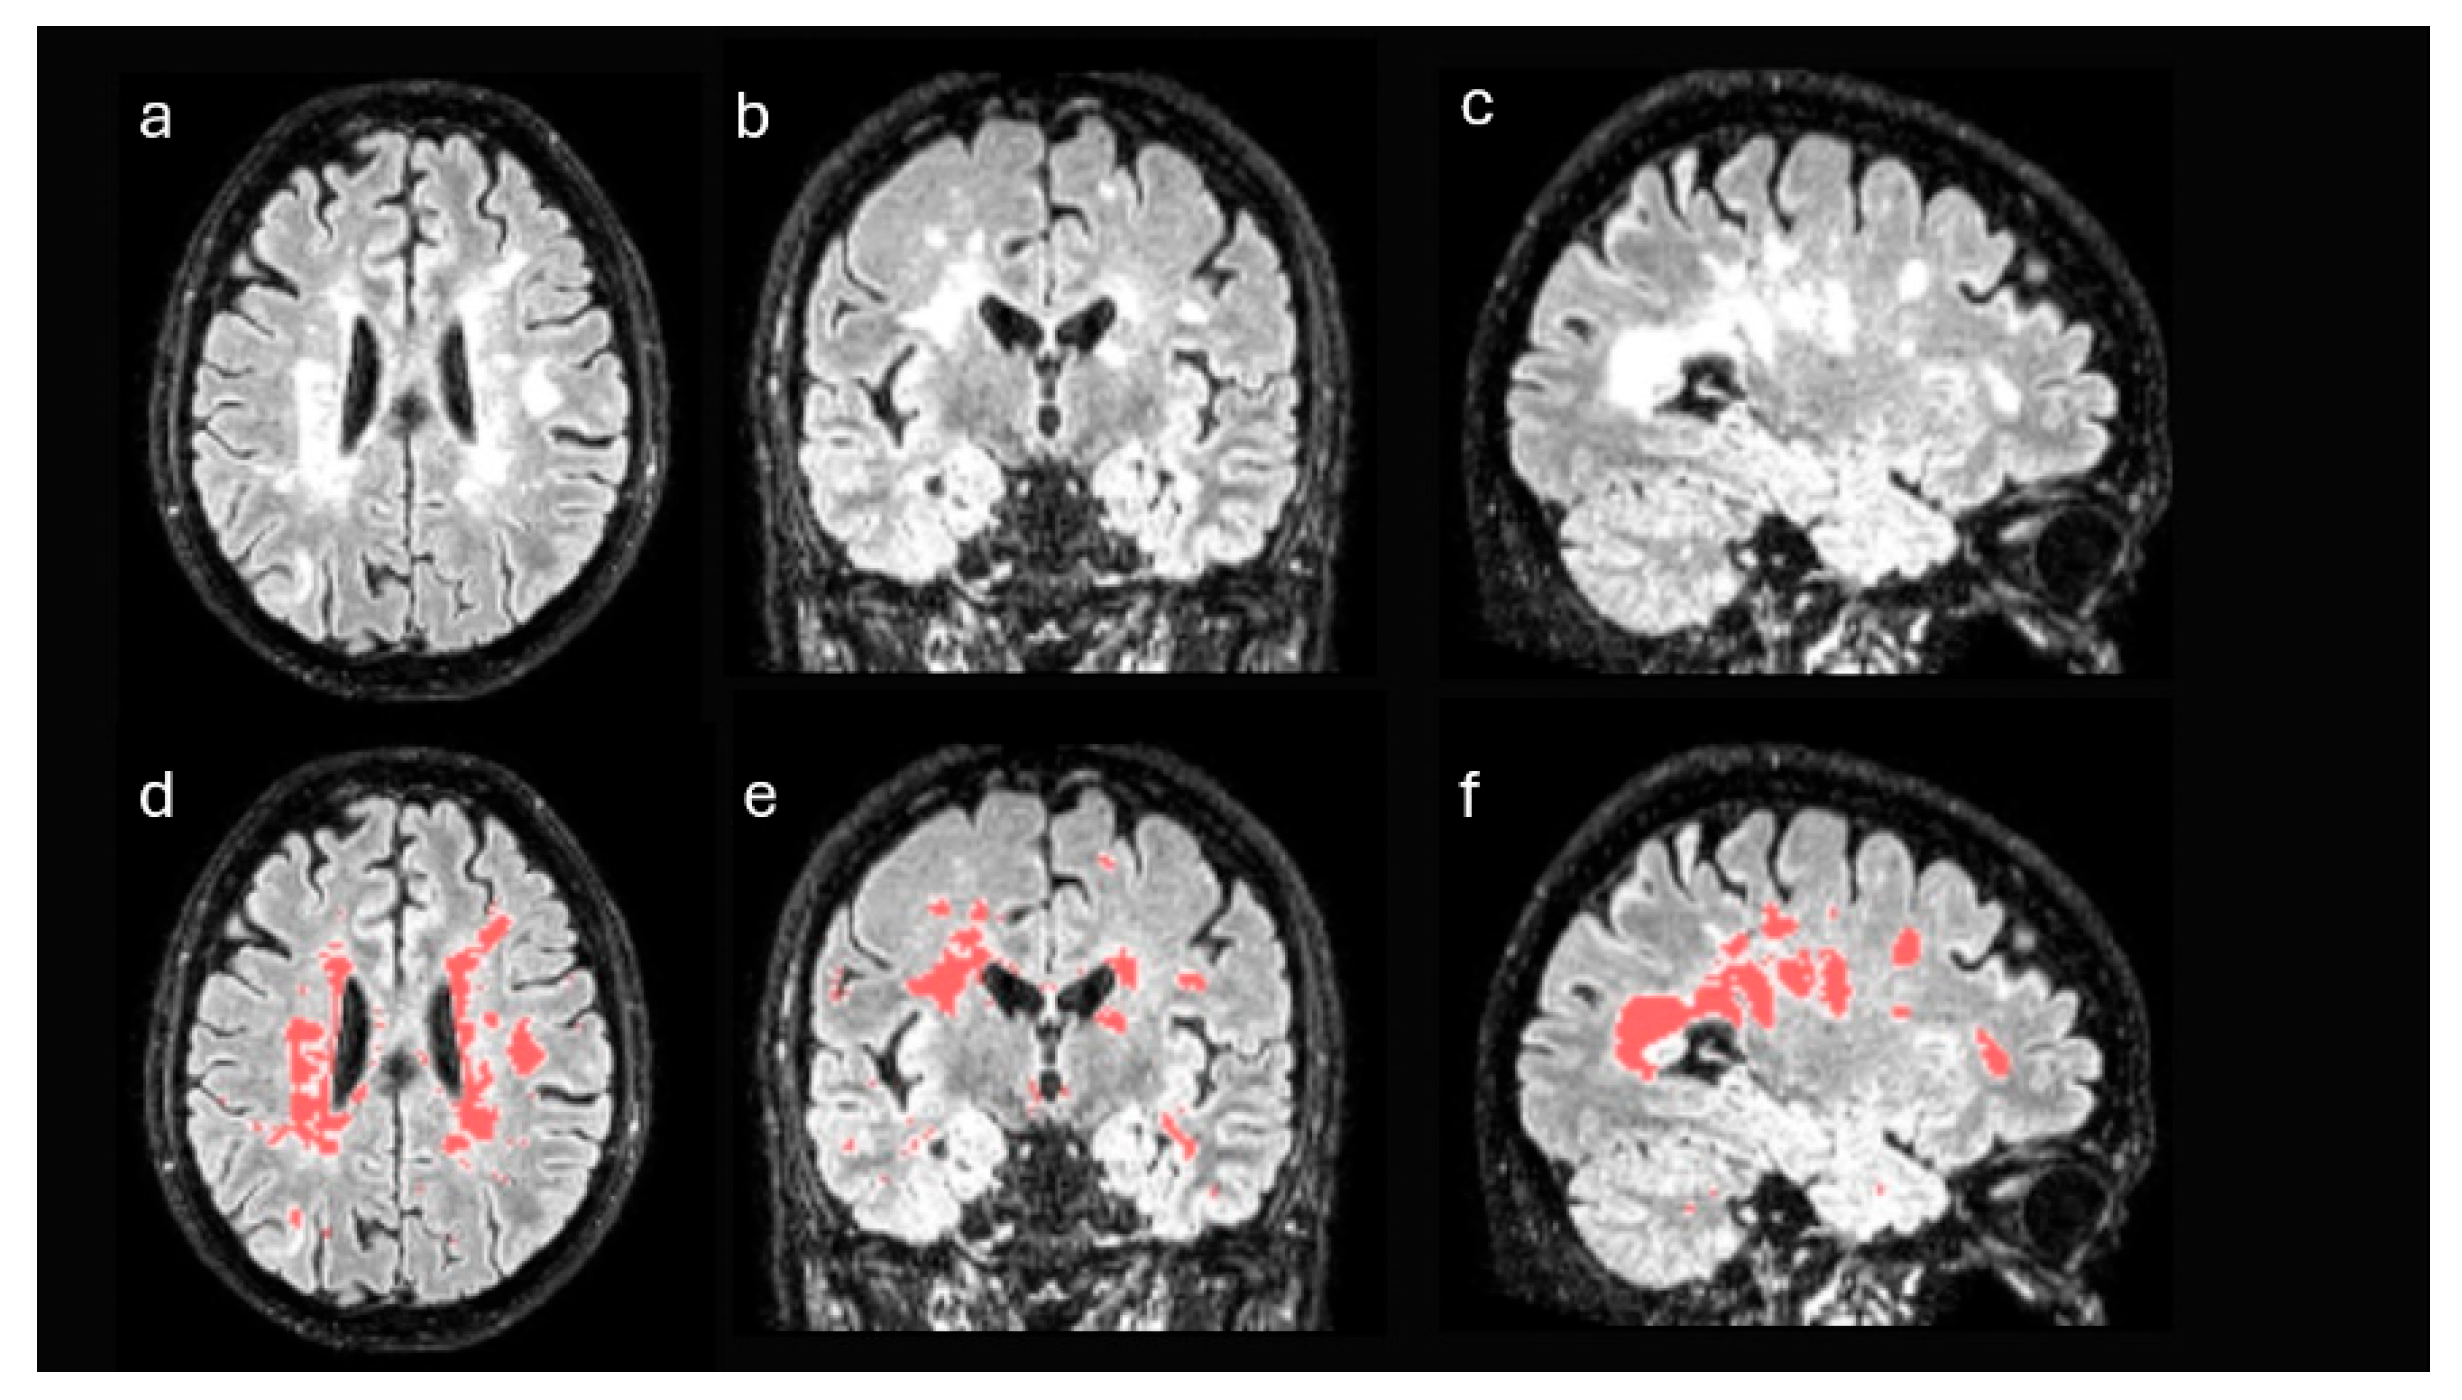
First, structural MRI FLAIR images of each patient were processed in order to identify disease-specific lesions. These images were registered to the standard Montreal Neurological Institute (MNI) space and segmented using the unified segmentation algorithm implemented in Statistical Parametric Mapping (SPM), version 12 [
21]. After the process, the gray matter and white matter of each patient were selected in MNI space, discarding the remaining tissues. From these data and using a semi-supervised thresholding procedure, a mask with the lesions of each patient was generated (
Figure 2). Using these masks, the lesion volume of each patient was obtained, both globally in the whole brain and in isolation in the WM. Likewise, the masks were used to estimate the volume of the non-damaged white matter of each patient, that is, the white matter excluding the areas affected by the disease.
On the other hand, Amyloid PET images were spatially registered to MNI space to ensure anatomical correspondence with the processed MRI images. The registration was performed using rigid alignment transformations and nonlinear alignment transformations, optimized to preserve the anatomical relationship between modalities [
22].
Once the spatial registration was completed, we proceeded to the quantitative analysis of the PET images by calculating SUV in different regions of interest (ROIs). ROIs were defined based on the masks obtained in the previous steps and comprised the following: DWM, NAWM, non-damaged gray matter (GM), total GM, and cerebellum. The gray matter and WM masks were derived from two complementary sources: the segmentation of FLAIR MRI images and the segmentation of structural T1 MRI images from the same patients, allowing to compare the robustness of both approaches.
The following SUVs were calculated for both the DWM and the NAWM:
SUVmax (Maximum Standardized Uptake Value): The highest SUV value within a defined region of interest (ROI). It reflects the point of greatest radiotracer uptake and is commonly used as an indicator of peak metabolic activity.
SUVmean (Mean Standardized Uptake Value): The mean SUV within the ROI, representing the average value of all voxel SUV measurements. It provides a robust measure that is less influenced by outliers compared to SUVmax.
SUVmin (Minimum Standardized Uptake Value): The lowest SUV value within the ROI. While less frequently used on its own, it can be helpful in assessing areas of low tracer uptake or evaluating lesion heterogeneity.
SUVR (SUV relative to the cerebellum): ratio using cerebellum as the reference region.
% of change SUV: Percentage of change between DWM and NAWM calculated, according to previous studies, as follows: DWM uptake minus NAWM uptake, divided by NAWM uptake and multiplied by 100 [
9].
The delineation of the cerebellum was performed from the Automated Anatomical Labeling (AAL) anatomical atlas, registered to the same MNI space [
23]. All masks were adjusted to the resolution and dimensions of the PET images before the calculation of SUVs, to avoid interpolation errors or incorrect overlapping between modalities.
Standard Protocol Approvals, Registrations, and Patient Consents
This study was performed in accordance with Good Clinical Practice and the Helsinki Declaration and was approved by the Biomedical Research Ethics Committee of the Province of Granada, under the code AMPET-MS22 (107-N-22). Informed consent was obtained from all study participants after reviewing the inclusion and exclusion criteria.
Statistical Analysis
Descriptive data are shown as means ± standard deviations or as frequencies and percentages. To compare the SUV parameters in different regions within the same patient, a paired Student’s T-test was used after confirming normal distribution with the Kolmogorov-Smirnov test; for non-normally distributed variables, the Wilcoxon signed-rank test was applied. A repeated measures ANOVA was performed to evaluate the evolution of SUV parameters from the early phases (5 and 10 minutes) to the standard phase. The assumption of sphericity was tested using Mauchly’s test and found to be violated; therefore, the Greenhouse-Geisser correction was applied. Correlations between neuroimaging measures and clinical and neuropsychological tests were calculated using Spearman’s coefficient. SPSS 29.0 (IBM SPSS, Armonk, NY, USA) and R version 4.2.0 (R Foundation for Statistical Computing, Vienna, Austria) were used for data analyses. Statistical significance was set at p< 0.05.
3. Results
3.1. Baseline Clinical and Neuroimaging Characteristics
Between January 2023 and February 2024, 20 patients were included (75% female), with a mean age at diagnosis of 35.05 ± 10.72 years. The mean number of relapses and EDSS score at diagnosis were 1.95 ± 1.15 and 1.90 ± 1.09 (median 2), respectively (
Table 1). Additional baseline demographic, clinical and neuropsychological variables are summarized in Supplementary table S5.
In the neuroimaging analysis, patients showed a mean (± standard deviation) MRI volume (cm
3) of 13.94 ±14.98 in DWM, 540.98 ± 38.59 in NAWM, and 968.63 (±72.70) in GM. Regarding DWM lesion load, 2 patients had a low lesion burden (≤9 lesions on T2/FLAIR), 8 had a high non-confluent lesion burden (>9 lesions on T2/FLAIR), and 10 presented with a high confluent lesion burden (>9 lesions on T2/FLAIR with extensive, confluent and/or uncountable lesions). Coregistration of MRI and FBB PET yielded a total of 54 variables derived from the analysis of SUV parameters in DWM and NAWM across both phases of the FBB PET. These are summarized in
Supplementary Table S6.
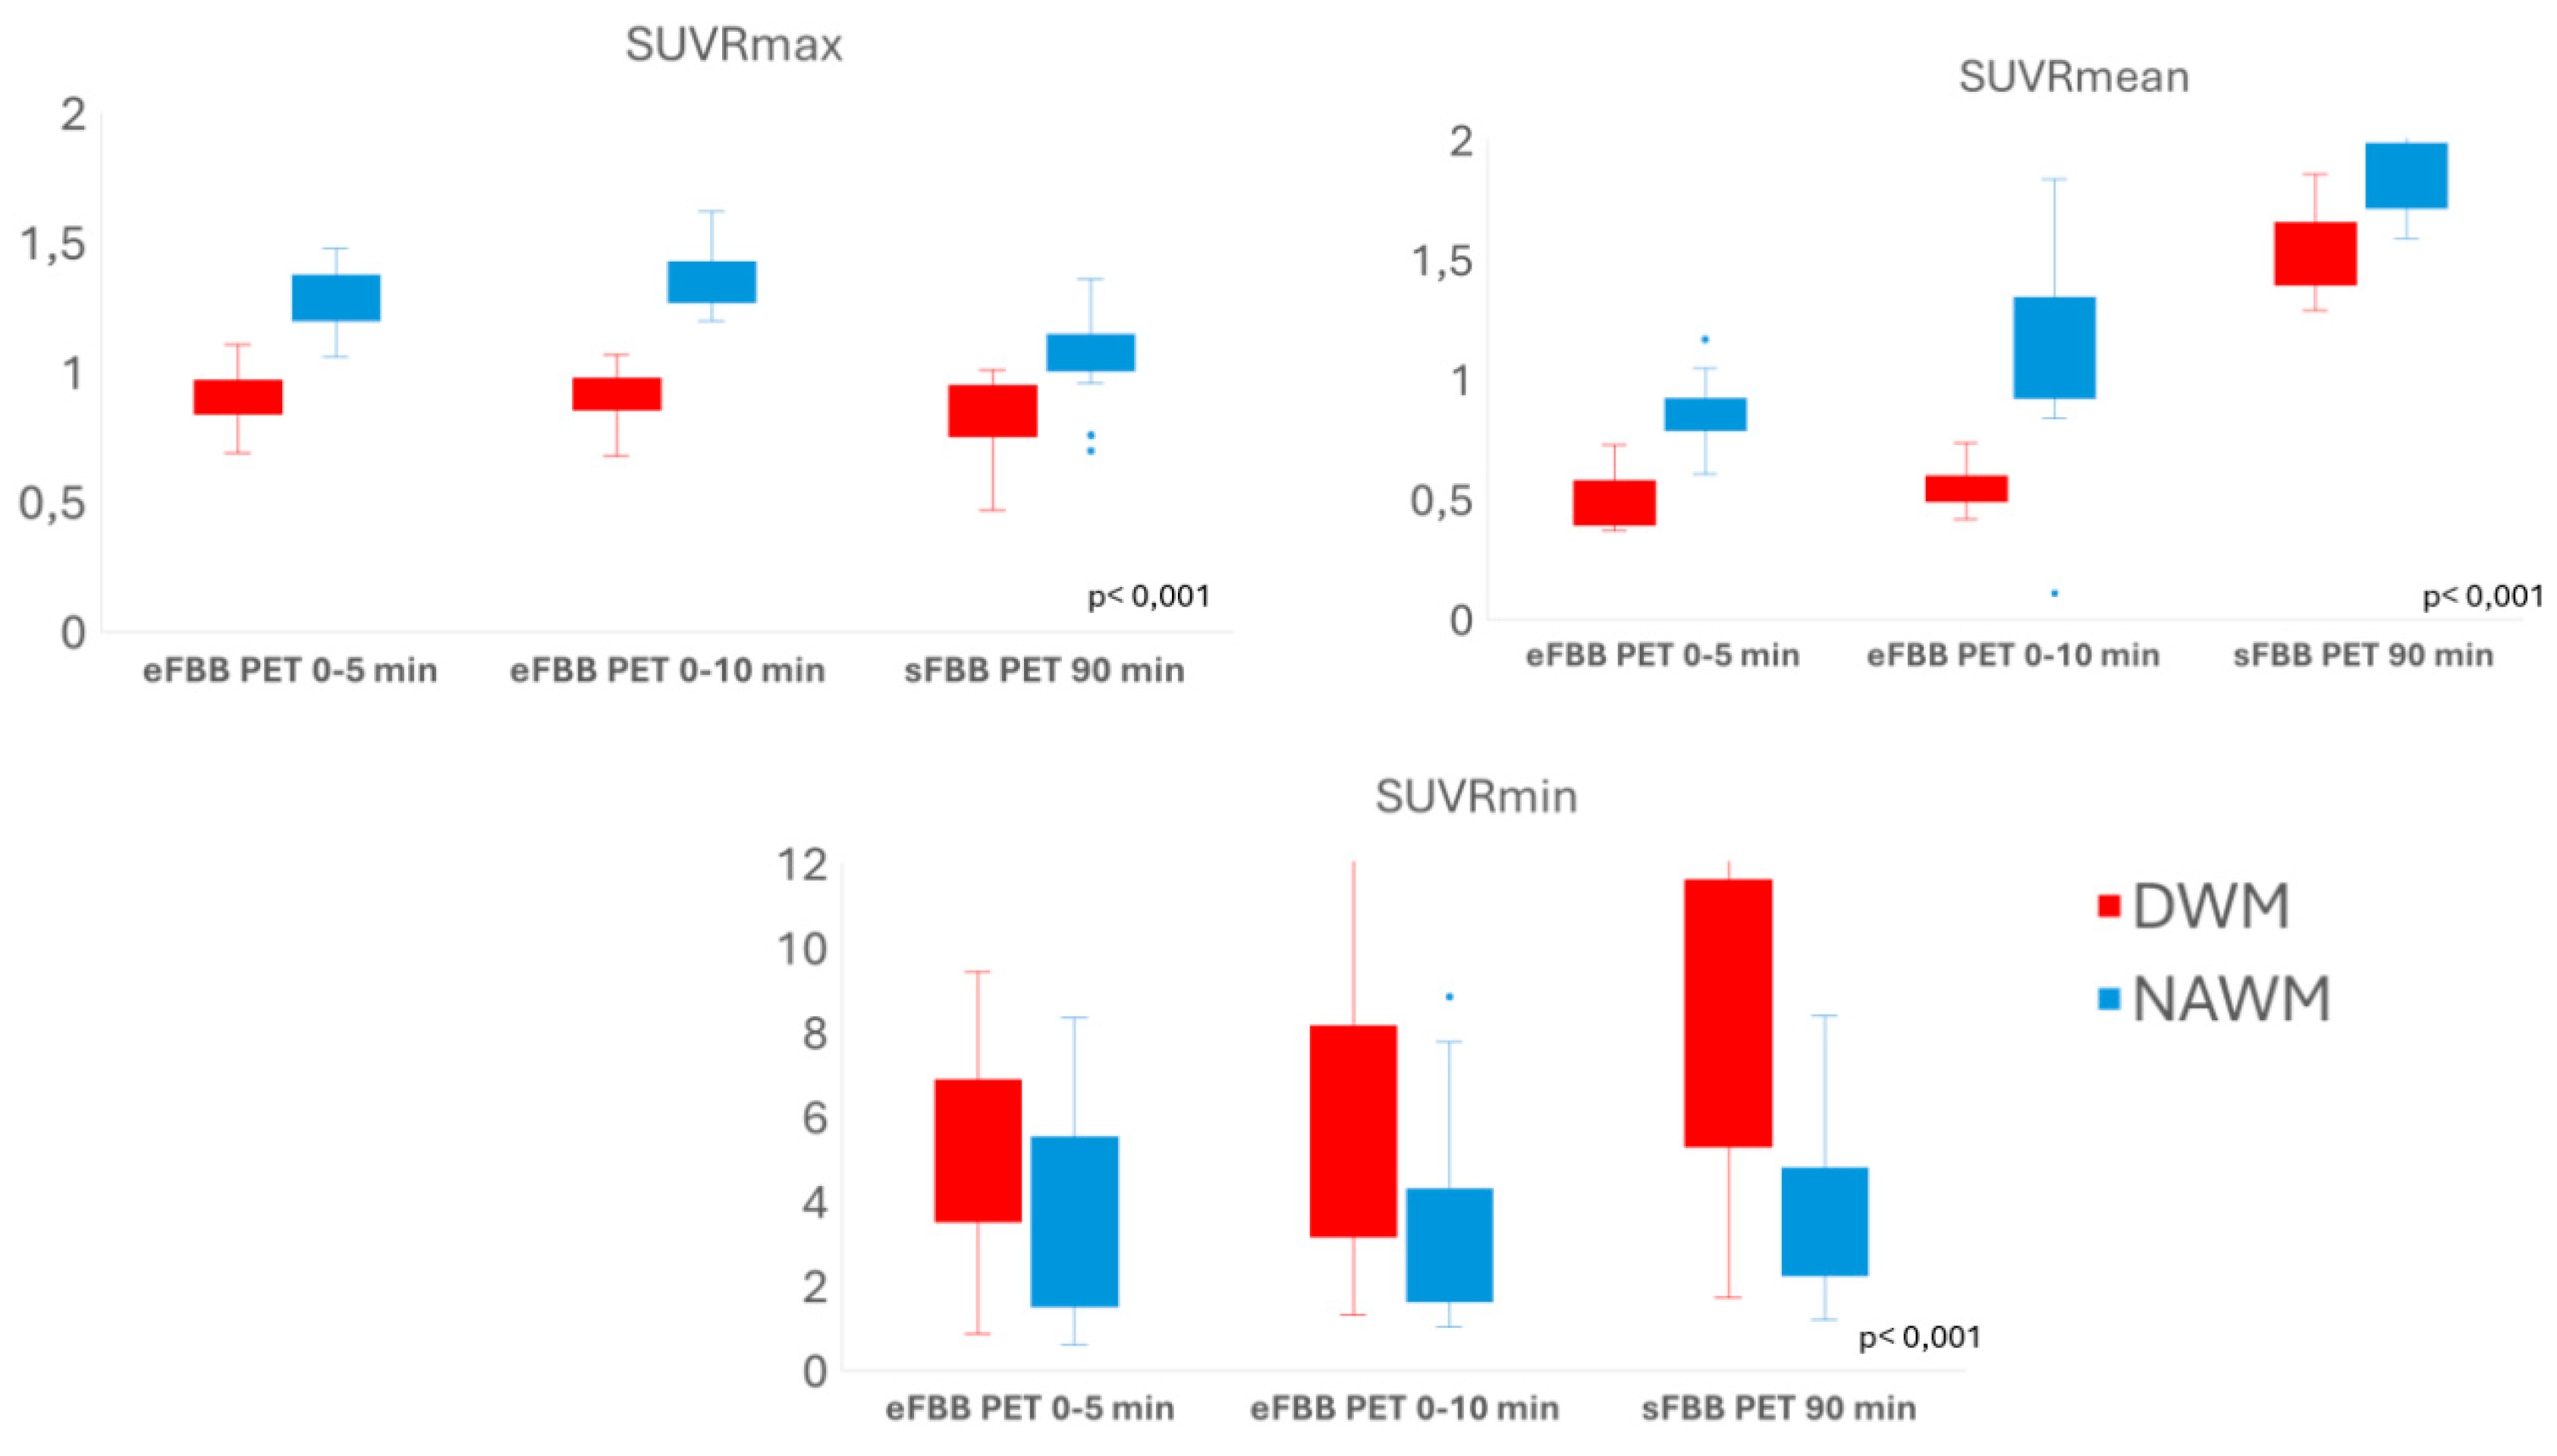
3.2. Comparison of Tracer Uptake Intensity in DWM Versus Nawm
The mean SUVmax and SUVmean values in DWM were significantly lower than those in NAWM in both eFBB and sFBB of FBB PET acquisition. However, the mean SUVmin values in DWM were significantly higher than those in NAWM. Similarly, DWM showed significantly lower SUVRmax and SUVRmean (cerebellum-referenced SUVmax and SUVmean, respectively) compared to NAWM, while SUVRmin values were higher in DWM than in NAWM (
Figure 3; Supplementary table S7.
3.3. Comparison of SUVR Values in DWM and NAWM Between Early and Late FBB PET Phases
Repeated-measures analysis revealed that mean SUVR values in both DWM and NAWM, as well as the % of change between DWM and NAWM (% of change SUV), changed significantly from eFBB to sFBB acquisition. The SUVRmax values increased during eFBB and then decreased in the sFBB, while SUVRmean and SUVRmin showed a continuous upward trend from eFBB to sFBB, predominantly in DAWM (
Table S8;
Figure S1, Supplementary Material).
3.4. Correlations Between FBB PET Quantitative Parameters and Clinical/Neuropsychological Scales
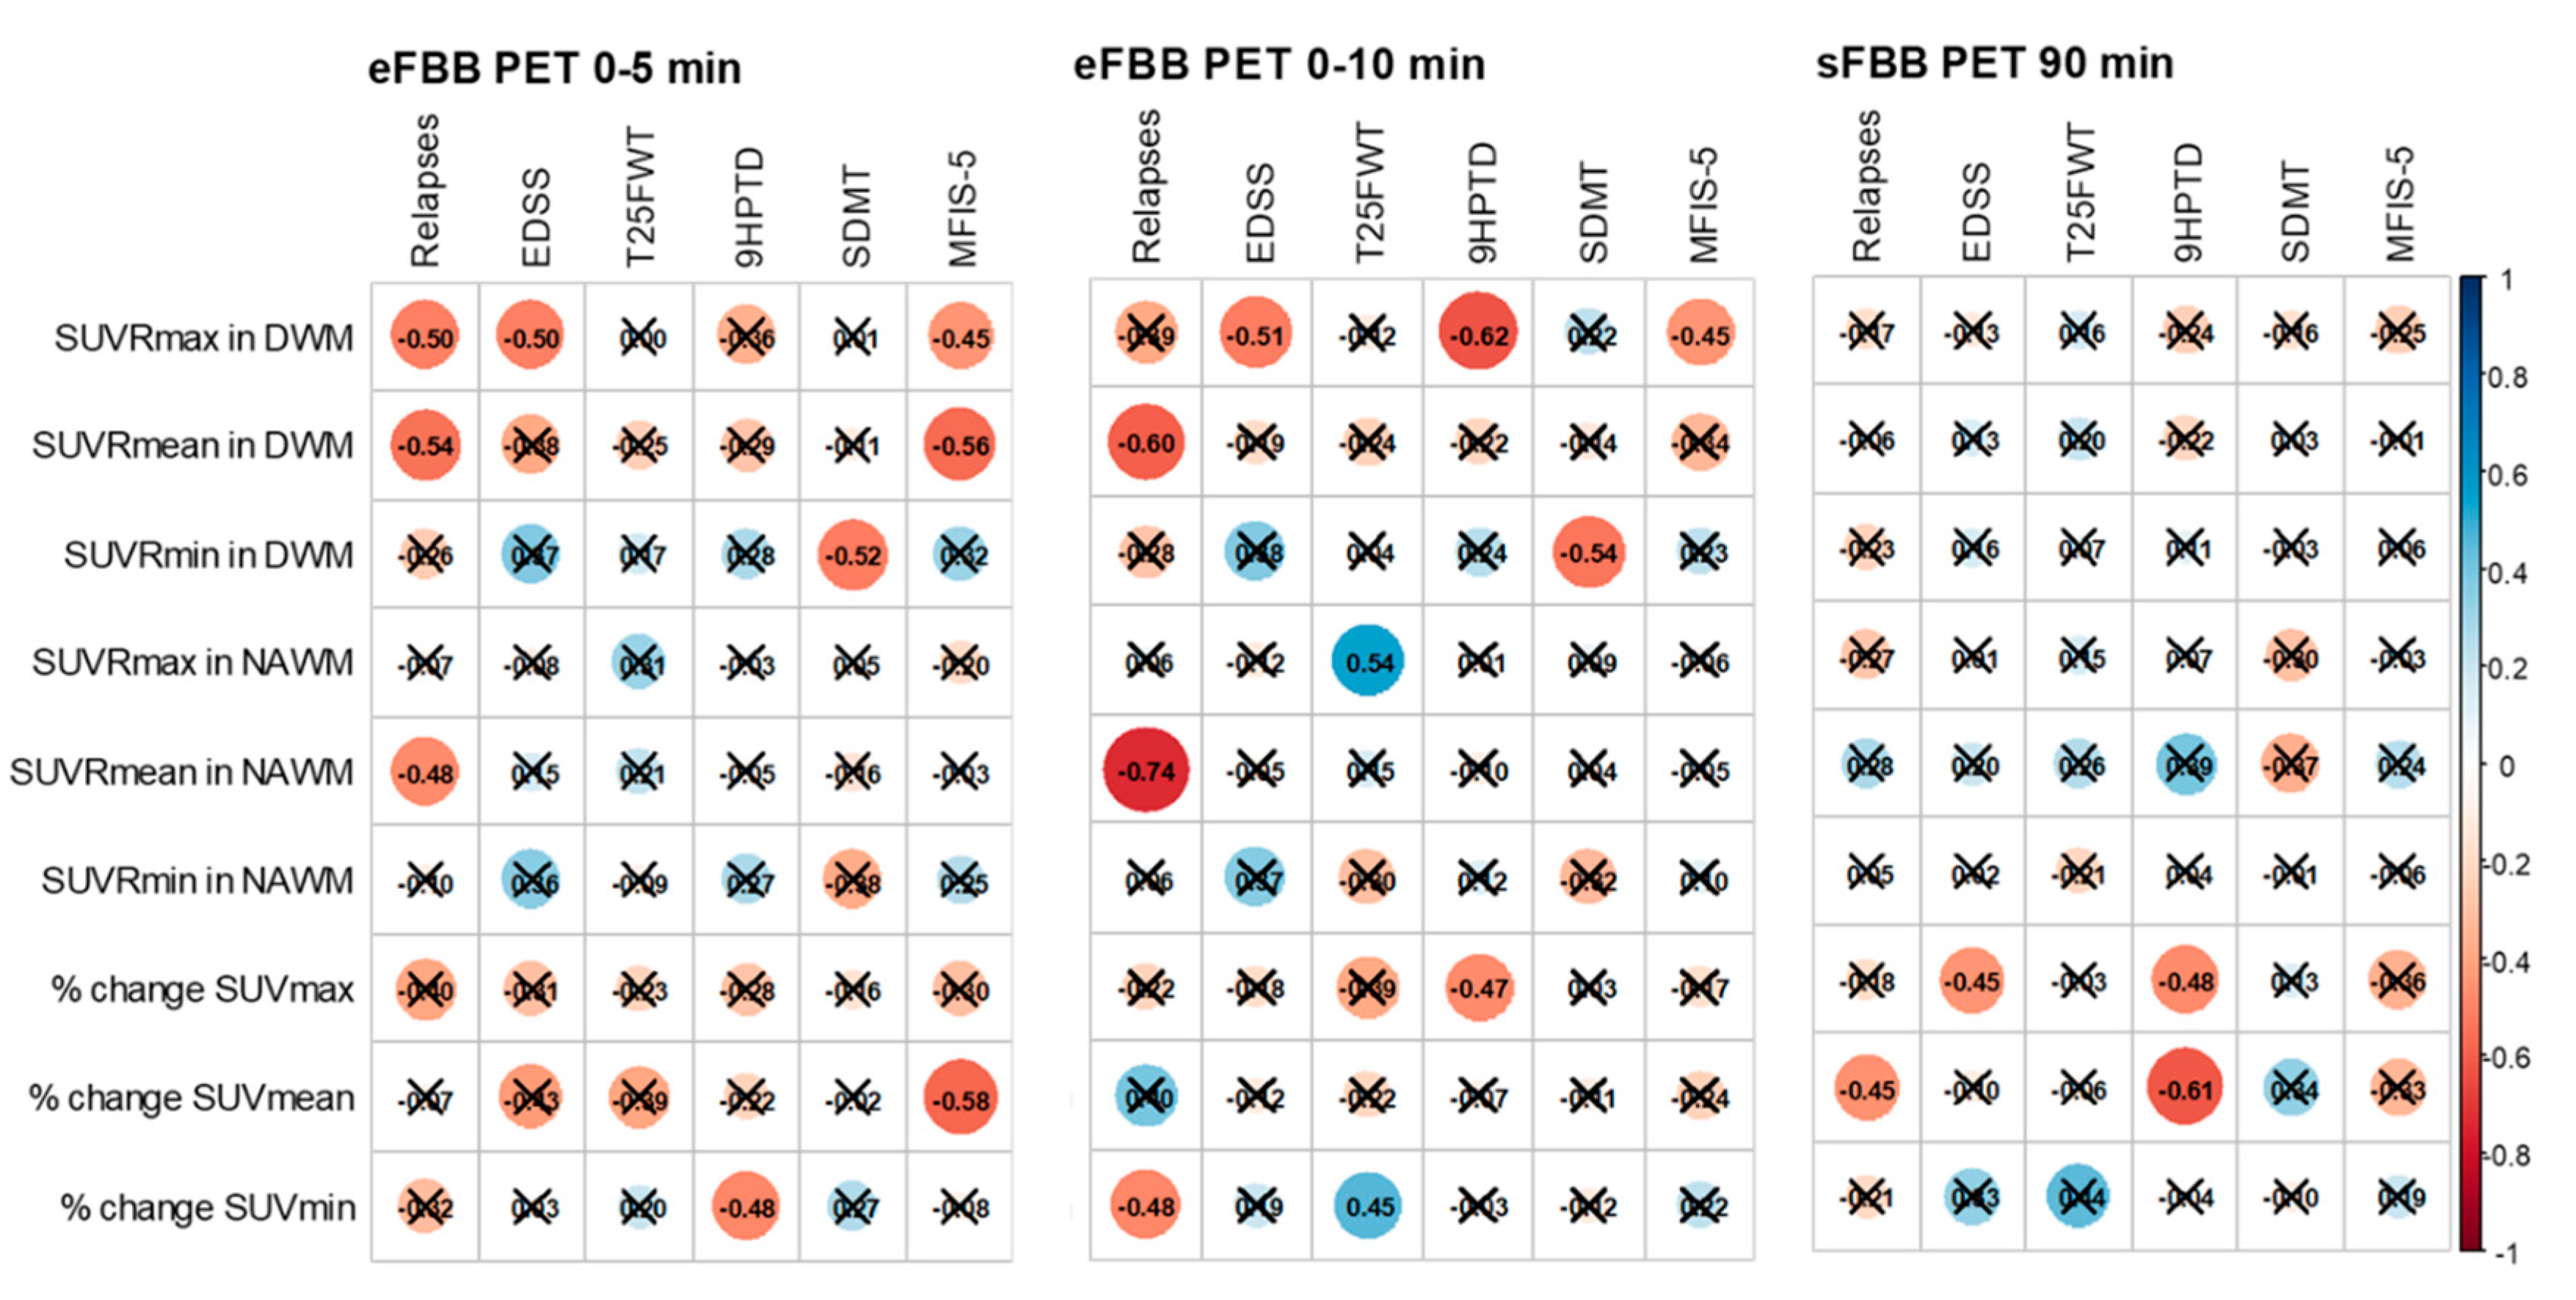
Correlations with clinical variables related to disease activity, progression, and neuropsychological function are summarized in
Figure 4 and Supplementary table S9. The number of relapses within one year showed a significant negative correlation with SUVRmean values in both DWM and NAWM in the eFBB (r = –0.541 and r = –0.596, respectively; p < 0.05), and with the % of change SUVmean in the sFBB phase (r = –0.454, p < 0.05).
EDSS scores were significantly and negatively correlated with SUVRmax in DWM in the eFBB phases (r = –0.501 and r = –0.513, p < 0.05) and with the % of change SUVmax in DWM in the sFBB phase (r = –0.446, p = 0.049) (
Supplementary Figure S2). Manual dexterity, as measured by the 9HPTD, was significantly and inversely correlated with the % of change SUVmax in both eFBB and sFBB (r = –0.472 and r = –0.477, p < 0.05, respectively). Gait speed, assessed using the T25FW, was positively correlated with the % of change SUVmin in both eFBB and sFBB (r = 0.453 and r = 0.440, p < 0.05, respectively).
Regarding neuropsychological evaluation, a significant negative correlation was found between information processing speed (SDMT) and SUVRmin in DWM in eFBB phases (r = –0.516 and r = –0.539, p < 0.05, respectively). Verbal memory and learning, measured by the CVLT, also showed significant negative correlations with SUVRmin in both DWM and NAWM in eFBB (r = –0.564 and r = –0.649, respectively; p < 0.05). Symptoms of depression (BDI-II), were significantly and positively correlated with SUVRmin in DWM in eFBB (r = 0.570 and r = 0.444, p < 0.05, respectively).
Fatigue, as assessed using the MFIS-5, showed a significant negative correlation with SUVRmax in DWM in the eFBB phases (r = –0.450, p < 0.05 at both 5 and 10 minutes). Finally, quality of life (EQ-5D) was negatively correlated with SUVRmin in DWM in eFBB phases (r = –0.468 and r = –0.490, p < 0.05).
4. Discussion
Amyloid PET has been proposed to monitor myelination changes in patients with MS, showing reduced SUVR in DWM compared to NAWM on MRI in MS patients [
11]. Greater NAWM demyelination has been observed in more active patients or progressive forms, and lower baseline SUVR in NAWM has been associated with increased risk of disability progression (EDSS) and cognitive impairment (SDMT) [
9,
12,
13,
14,
15].
We present preliminary findings from our study, based on co-registration of FBB PET and MRI, and their association with clinical variables at diagnosis. Our work is the first to include a homogeneous cohort of newly diagnosed RRMS patients [
9,
12,
13,
14,
15,
16]. This is particularly relevant, as acute inflammatory activity is highest during the early stages of MS, allowing us to analyze baseline PET findings and identify patients at greater risk of long-term disease activity and progression [
24]. Finally, this is the first work to physiologically interpret the eFBB and the SUV parameters, exploring their potential utility in detecting neurodegeneration- and inflammation-related changes [
25].
Myelination and Neurodegeneration
At diagnosis, RRMS patients showed lower SUVRmax and SUVRmean values in DWM compared to NAWM. These findings can be explained by several factors: the affinity of amyloid tracers for β-sheet structured protein such as myelin basic protein; the greater degree of demyelination observed in DWM in pathological studies; and similar results from previous amyloid PET studies in MS, which demonstrated lower tracer uptake in DWM areas compared to NAWM in both MS patients and healthy controls [
9,
10,
11,
26]. Altogether, these results reinforce the potential use of FBB PET to detect dynamic in vivo changes in myelination.
On the other hand, our study found that SUVRmin was higher in DWM compared to NAWM. This finding has not been previously described, as most studies have focused on SUVRmax and the % of change SUV between DWM and NAWM, with lower values associated with greater demyelination [
9,
14,
15]. Several studies suggest a potential role for amyloid in the pathogenesis of MS, based on the detection of amyloid precursor protein within axons of demyelinating and remyelinating plaques, and the presence of soluble amyloid-β1-42 oligomers (Aβ) in the brain and cerebrospinal fluid (CSF) of MS patients [
25,
27]. A study including 60 MS patients with a 3–5-year follow-up found that lower CSF Aβ levels were associated with a higher risk of disease progression as measured by EDSS [
28]. Similarly, in a cohort of 103 RRMS patients, CSF Aβ levels were associated with increased proinflammatory cytokines and decreased anti-inflammatory molecules [
29]. Therefore, SUVRmin may be interpreted as the basal or minimal detectable SUV value, reflecting amyloid accumulation secondary to axonal damage and/or inflammation. This hypothesis is consistent with our findings, as a greater degree of neurodegeneration would be expected in DWM compared to NAWM. Therefore, SUVRmin may be valuable for identifying states of neurodegeneration, with or without concurrent inflammation.
Early Phase of Amyloid PET
This is the first study to include the eFBB in patients with MS. Based on our findings, we propose an interpretation grounded in the temporal evolution of SUVR values from the eFBB to the sFBB (
Table S8;
Figure S1, Supplementary Material). SUVRmax tends to decrease from eFBB to sFBB, which would be the expected evolution considering the tracer’s pharmacokinetics, with lower SUVR in sFBB likely reflecting greater demyelination [
9,
15].
In contrast, both SUVRmean and SUVRmin exhibit an increasing trend from eFBB to sFBB. These findings are more challenging to interpret, as no previous studies have assessed both eFBB and sFBB of amyloid PET in MS patients. Initially our hypothesis was that eFBB uptake could be related to the inflammation activity (increased perfusion and oedema), but our results are in consonance with the emerging evidence suggesting that eFBB may reflect cerebral hypometabolism associated with neurodegeneration and synaptic dysfunction, in a manner similar to [¹⁸F]FDG PET [
30,
31]. In a study including 103 patients with cognitive impairment due to Alzheimer’s disease and 33 healthy controls, eFBB showed a strong correlation with [¹⁸F]FDG PET for the detection of regional hypometabolism in dementia patients [
32]. Therefore, the lower SUVRmean and SUVRmin in the eFBB in our study suggest that eFBB could be a useful approach for detecting cerebral hypometabolism associated with neurodegeneration in MS patients.
5. Conclusions
MS remains the leading cause of non-traumatic neurological disability in young adults, and there is a growing need for complementary biomarkers to improve risk stratification and guide personalized therapeutic strategies. This pilot study is the first to evaluate dual-phase FBB PET in newly diagnosed MS patients, including early-phase analysis and distinct SUV parameters.
Preliminary findings suggest that quantitative analysis of dual phase FBB PET can detect differential uptake between DWM and NAWM in newly diagnosed MS patients, likely reflecting demyelination and neurodegeneration. The correlation with clinical markers of disease activity, progression, cognitive dysfunction, and fatigue supports the potential role of FBB PET as a biomarker in MS. Further research is needed to confirm its prognostic value and clinical applicability for stratifying patients at higher risk of activity and progression, with relevant prognostic and therapeutic implications.
Supplementary Materials
The following supporting information can be downloaded at the website of this paper posted on Preprints.org.
Author Contributions
Conceptualization, J.M.B.-L., E.M.T.-I., M.G.-R.; Methodology, J.M.B.-L., M.G.-R.; formal analysis: E.M.T.-I., F.S-R; investigation, A.P.-D., F.S-R., M.C.P.G., B.M.R.; A.R.V., V.G.M., J.P.M.-B., R.P.M, F.J.B.H, A.M.-C.; resources, E.M.T.-I, F.S-R, M.C.P.G., B.M.R.; writing—original draft preparation, J.M.B.L., E.M.T.I.; writing—review and editing, E.M.T.I., M.G.R; funding acquisition, all authors. All authors have read and agreed to the published version of the manuscript.
Funding
José María Barrios-López has been a doctoral student in the Doctoral Program in Clinical Medicine and Public Health at the University of Granada (Granada, Spain) since 2022. This work received funding from the “NEURO-RECA Grants for Scientific Research in Neurology 2021” (grant number NEURORECA-0007-2022), awarded by the Ministry of Health and Families of the Regional Government of Andalusia (Junta de Andalucía, Spain). It was awarded “Best Research Project” in the 2024 Research Awards of the Official Medical College of Granada (Granada, Spain).
Institutional Review Board Statement
This study was conducted in accordance with the Declaration of Helsinki and approved by the Institutional Review Board (or Ethics Committee) of the Biomedical Research Ethics Committee of the Province of Granada (Spain), under the code AMPET-MS22 (107-N-22).
Informed Consent Statement
Informed consent was obtained from all subjects involved in this study.
Data Availability Statement
All collected data were anonymized and stored in institutional databases and repositories to ensure the confidentiality and privacy of study participants, in accordance with the current legislation on personal data protection, specifically the General Data Protection Regulation (EU) 2016/679 (GDPR). Due to ethical and legal considerations regarding patient confidentiality and compliance with the General Data Protection Regulation (EU) 2016/679, the anonymized datasets generated and/or analyzed during the current study are not publicly available. For any clarification, the datasets are available from the corresponding author on rea-sonable request.
Conflicts of Interest
F.J.B.H. received compensation for consulting services and speaking honoraria from Almirall, Biogen, Bristol Myers Squibb, Genzyme, Johnson & Johnson, Merck, Novartis, Roche, Sanofi, Teva. The remaining authors declare no conflicts of interest. The funders had no role in the design of the study; in the collection, analyses, or interpretation of data; in the writing of the manuscript; or in the decision to publish the results.
Abbreviations
The following abbreviations are used in this manuscript:
| Aβ |
amyloid-β1-42 oligomers |
NAWM |
Normal-appearing white matter |
| BDI-II |
Beck Depression Inventory-II |
PET |
Positron emission tomography |
| CSF |
Cerebrospinal fluid |
RRMS |
Relapsing–remitting multiple sclerosis |
| CVLT |
California verbal learning test |
sFBB |
Standard acquisition 18F-florbetaben |
| DWM |
Damaged white matter |
SMDT |
Symbol Digit Modalities Test |
| EDSS |
Expanded Disability Status Scale |
SUV |
Standardized Uptake Value |
| eFBB |
Early acquisition 18F-florbetaben |
SUVmax |
Maximum Standardized Uptake Value |
| EQ-5D |
EuroQoL-5D |
SUVmean |
Mean Standardized Uptake Value |
| FBB |
18F-florbetaben |
SUVmin |
Minimum Standardized Uptake Value |
| GM |
Grey matter |
SUVR |
Standardized Uptake Value relative to the cerebellum |
| MFIS-5 |
Modified Fatigue Impact Scale 5-item version |
T25FW |
The Timed 25-Foot Walk |
| MRI |
Magnetic resonance imaging |
9HPT |
The Nine-Hole Peg Test |
| MS |
Multiple sclerosis |
% of change SUV |
Percentage of change between SUV of DWM and NAWM |
References
- McGinley MP, Goldschmidt CH, Rae-Grant AD. Diagnosis and Treatment of Multiple Sclerosis: A Review. JAMA Neurol. 2021;325(8):765–79.
- Kavaliunas A, Danylaitė Karrenbauer V, Binzer S, Hillert J. Systematic Review of the Socioeconomic Consequences in Patients With Multiple Sclerosis With Different Levels of Disability and Cognitive Function. Front Neurol. 2022;12:737211. [CrossRef]
- Tur C, Carbonell-Mirabent P, Cobo-Calvo Á, Otero-Romero S, Arrambide G, Midaglia L, et al. Association of Early Progression Independent of Relapse Activity With Long-term Disability After a First Demyelinating Event in Multiple Sclerosis. JAMA Neurol. 2023;80(2):151–60. [CrossRef]
- Absinta Martina, Lassmann Hans, Trap Bruce. Mechanisms underlying progression in Multiple Sclerosis. Curr Opin Neurol. 2020;30(3):277–85.
- Inojosa H, Schriefer D, Ziemssen T. Clinical outcome measures in multiple sclerosis: A review. Autoimmun Rev. 2020;19(5):102512. [CrossRef]
- Benkert P, Meier S, Schaedelin S, Manouchehrinia A, Yaldizli Ö, Maceski A, et al. Serum neurofilament light chain for individual prognostication of disease activity in people with multiple sclerosis: a retrospective modelling and validation study. Lancet Neurol. 2022;21(3):246–57. [CrossRef]
- Rocca MA, Valsasina P, Meani A, Gobbi C, Zecca C, Barkhof F, et al. Spinal cord lesions and brain grey matter atrophy independently predict clinical worsening in definite multiple sclerosis: a 5-year, multicentre study. J Neurol Neurosurg Psychiatry. 2023;94(1):10–8. [CrossRef]
- Calvi A, Clarke MA, Prados F, Chard D, Ciccarelli O, Alberich M, et al. Relationship between paramagnetic rim lesions and slowly expanding lesions in multiple sclerosis. Mult Scler. 2023;29(3):352–62. [CrossRef]
- Matías-Guiu JA, Cabrera-Martín MN, Matías-Guiu J, Oreja-Guevara C, Riola-Parada C, Moreno-Ramos T, et al. Amyloid PET imaging in multiple sclerosis: An 18F-florbetaben study. BMC Neurol. 2015;15:243. [CrossRef]
- Bajaj A, LaPlante NE, Cotero VE, Fish KM, Bjerke RM, Siclovan T, et al. Identification of the Protein Target of Myelin-Binding Ligands by Immunohistochemistry and Biochemical Analyses. J Histochem Cytochem. 2013;61(1):19–30. [CrossRef]
- Stankoff B, Freeman L, Aigrot MS, Chardain A, Dollé F, Williams A, et al. Imaging central nervous system myelin by positron emission tomography in multiple sclerosis using [methyl-11C]-2-(4-methylaminophenyl)- 6-hydroxybenzothiazole. Ann Neurol. 2011;69(4):673–80.
- Bodini B, Veronese M, García-Lorenzo D, Battaglini M, Poirion E, Chardain A, et al. Dynamic Imaging of Individual Remyelination Profiles in Multiple Sclerosis. Ann Neurol. 2016;79(5):726–38. [CrossRef]
- Pietroboni AM, Carandini T, Colombi A, Mercurio M, Ghezzi L, Giulietti G, et al. Amyloid PET as a marker of normal-appearing white matter early damage in multiple sclerosis: correlation with CSF β-amyloid levels and brain volumes. Eur J Nucl Med Mol Imaging. 2019;46(2):280–7. [CrossRef]
- Zhang M, Ni Y, Zhou Q, He L, Meng H, Gao Y, et al. 18F-florbetapir PET/MRI for quantitatively monitoring myelin loss and recovery in patients with multiple sclerosis: A longitudinal study. EClinicalMedicine. 2021;37:100982. [CrossRef]
- Pytel V, Matias-Guiu JA, Matías-Guiu J, Cortés-Martínez A, Montero P, Moreno-Ramos T, et al. Amyloid PET findings in multiple sclerosis are associated with cognitive decline at 18 months. Mult Scler Relat Disord. 2020;39:101926. [CrossRef]
- Grecchi E, Veronese M, Bodini B, García-Lorenzo D, Battaglini M, Stankoff B, et al. Multimodal partial volume correction: Application to [11 C]PIB PET/MRI myelin imaging in multiple sclerosis. J Cereb Blood Flow Metab. 2017 Dec 1;37(12):3803–17. [CrossRef]
- Thompson AJ, Banwell BL, Barkhof F, Carroll WM, Coetzee T, Comi G, et al. Diagnosis of multiple sclerosis: 2017 revisions of the McDonald criteria. Lancet Neurol. 2018;17(2):162–73. [CrossRef]
- Kurtzke JF. Rating neurologic impairment in multiple sclerosis: an expanded disability status scale (EDSS). Neurology. 1983;33(11):1444–52.
- Langdon DW, Amato MP, Boringa J, Brochet B, Foley F, Fredrikson S, et al. Recommendations for a brief international cognitive assessment for multiple sclerosis (BICAMS). Mult Scler. 2012;18(6):891–8. [CrossRef]
- Rosenberg JH, Shafor R. Fatigue in multiple sclerosis: A rational approach to evaluation and treatment. Curr Neurol Neurosci Rep. 2005;5(2):140–6. [CrossRef]
- Ashburner J, Friston KJ. Unified segmentation. Neuroimage. 2005;26(3):839–51.
- Ashburner J, Friston KJ. Chapter 05 - Non-linear Registration. En Statistical Parametric Mapping, K. Friston, J. Ashburner, S. Kiebel, T. Nichols, y W. Penny, Eds. London. Academic Press. 2007;63–80.
- Tzourio-Mazoyer N, Landeau B, Papathanassiou D, Crivello F, Etard O, Delcroix N, et al. Automated anatomical labeling of activations in SPM using a macroscopic anatomical parcellation of the MNI MRI single-subject brain. Neuroimage. 2002;15(1):273–89. [CrossRef]
- Reich DS, Lucchinetti CF, Calabresi PA. Multiple Sclerosis. N Engl J Med. 2018 Jan 11;378(2):169–80.
- Matías-Guiu JA, Oreja-Guevara C, Cabrera-Martín MN, Moreno-Ramos T, Carreras JL, Matías-Guiu J. Amyloid Proteins and Their Role in Multiple Sclerosis. Considerations in the Use of Amyloid-PET Imaging. Front Neurol. 2016;7:53. [CrossRef]
- Auvity S, Tonietto M, Caillé F, Bodini B, Bottlaender M, Tournier N, et al. Repurposing radiotracers for myelin imaging: a study comparing 18F-florbetaben, 18F-florbetapir, 18F-flutemetamol,11C-MeDAS, and 11C-PiB. Eur J Nucl Med Mol Imaging. 2020;47(2):490–501. [CrossRef]
- Chandra A. Role of Amyloid from a Multiple Sclerosis Perspective: A Literature Review. Neuroimmunomodulation. 2015;22(6):343–6. [CrossRef]
- Pietroboni AM, Caprioli M, Carandini T, Scarioni M, Ghezzi L, Arighi A, et al. CSF β-amyloid predicts prognosis in patients with multiple sclerosis. Mult Scler. 2019;25(9):1223–31. [CrossRef]
- Bassi MS, Garofalo S, Marfia GA, Gilio L, Simonelli I, Finardi A, et al. Amyloid-β Homeostasis Bridges Inflammation, Synaptic Plasticity Deficits and Cognitive Dysfunction in Multiple Sclerosis. Front Mol Neurosci. 2017 Nov 21;10:390. [CrossRef]
- Segovia F, Gómez-Río M, Sánchez-Vañó R, Górriz JM, Ramírez J, Triviño-Ibáñez E, et al. Usefulness of dual-point amyloid PET scans in appropriate use criteria: A multicenter study. J Alzheimers Dis. 2018;65(3):765–79. [CrossRef]
- Daerr S, Brendel M, Zach C, Mille E, Schilling D, Zacherl MJ, et al. Evaluation of early-phase [18F]-florbetaben PET acquisition in clinical routine cases. Neuroimage Clin. 2016;14:77–86. [CrossRef]
- Lojo-Ramírez JA, Fernández-Rodríguez P, Guerra-Gómez M, Marín-Cabañas AM, Franco-Macías E, Jiménez-Hoyuela-García JM, et al. Evaluation of early-phase 18F-Florbetaben PET as a surrogate biomarker of neurodegeneration: In-depth comparison with 18F-FDG PET at group and single patient level. J Alzheimers Dis. 2025;106(1):304–16. [CrossRef]
|
Disclaimer/Publisher’s Note: The statements, opinions and data contained in all publications are solely those of the individual author(s) and contributor(s) and not of MDPI and/or the editor(s). MDPI and/or the editor(s) disclaim responsibility for any injury to people or property resulting from any ideas, methods, instructions or products referred to in the content. |
© 2025 by the authors. Licensee MDPI, Basel, Switzerland. This article is an open access article distributed under the terms and conditions of the Creative Commons Attribution (CC BY) license (http://creativecommons.org/licenses/by/4.0/).