Submitted:
18 July 2025
Posted:
22 July 2025
You are already at the latest version
Abstract
The importance of elites in society's development cannot be overstated, and it is crucial to find ways to improve the quality of services they receive. To achieve superior service, the Elites Foundation must have a clear understanding of its members' diverse needs. This study aims to identify and prioritize service quality attributes, evaluate service quality, and provide better solutions to improve services in the National Elites Foundation. After conducting initial studies, a questionnaire was designed to collect members' opinions on their expectations of the Foundation's performance and potential improvement techniques. The gap between members' expectations and perception of service was then studied using several statistical tests. To select and prioritize improvement techniques, a hybrid grey relationship analysis (GRA) based approach that included Kano and QFD techniques was used. This approach categorized and prioritized members' needs, ultimately identifying essential improvement techniques according to higher priority needs. The results showed that the average member's perception of service quality is lower than desired levels, with all needs having higher expectations than perception.
Keywords:
SERVQUAL
; Kano model
; gap analysis model
; quality function deployment
; grey relational analysis
1. Introduction
Supporting the elites and creating opportunities for them to grow is one of the most important tasks of the decision-making bodies and government departments and particularly the National Elite foundation. Society can reach maturity and self-sufficiency by providing the elites with a sense of satisfaction with their careers and living environments through laying the groundwork for the development and prosperity of elites and providing the necessary conditions and facilities for them. Investing in this segment of society can bring significant progress in the intellectual, cultural, productive and economic fields and given the importance and significant role of elites in the development of society, the need to improve the quality of services provided to this society and to establish a comprehensive service quality management system becomes clear. However, the process of achieving this mean has always been challenged and debated by researchers among public service organizations.
In order to make improvements in the Elites Foundation service system, firstly, its current state of quality needs to get thoroughly assessed. There have been a number of techniques and tools used to assess service quality in organizations. In the present research, we have designed a model by integrating SERVQUAL, Kano model, Quality Function Deployment with Grey Relational Analysis.
SERVQUAL is one of the most used tools to measure service quality. SERVQUAL draws a linear relationship between service quality and customer satisfaction [4,5] and Service providers use the gap analysis to develop strategies and reduce the gaps between quality performance and the expectations for different quality aspects [3,6]. Although SERVQUAL considers the direct relationship between customer satisfaction and service quality an investment, this appears to be a weakness for this method as this relationship can be asymmetric or non-linear at times [7,8,9] and a performance enhancement in a particular quality aspect may not inevitably increase customer satisfaction.
The second tool used in our study is the Kano model. The Kano model is based on the fact that attributes with a similar level of performance may have dissimilar effects on customer satisfaction. For some attributes, a little performance enhancement significantly enhances customer satisfaction; while for other attributes, a great performance improvement enhances the customer satisfaction by only a little extent [10].
After quality evaluation and categorizing the service quality needs; QFD is used to integrate customer requirements into product design and development [11]. In order to capture and employ the voice of the customer (VoC), Quality Function Deployment (QFD) selects those service characteristics that are crucial to meet customer requirements [12].
With these three tools meaning, SERVQUAL, Kano and QFD joined together, we can overcome each of their limitations and add in some joined benefits in order to enhance the service quality [12]. Kano model resolves the misconception of linear relationship between service quality attributes and customer satisfaction [13] while QFD complements SERVQUAL and Kano by employing the voice of the customer (VoC) and integrate customer requirements into process service requirements [12].
Several studies have applied the integration of SERVQUAL, Kano, and QFD for their research. For instance, [14] integrated SERVQUAL and Kano Model into QFD to evaluate and improve Hospital Information System quality in a private hospital. [15] suggested a fuzzy QFD approach using SERVQUAL and Kano models under budget constraint for hotel services. [16] used the same tools to create competitive advantage via quality management in hotel services. While [17] used it in an educational institution. [18] used an application of integrating SERVQUAL and Kano’s model into QFD for logistics services in cargo companies.
However, since these tools heavily rely on the perceptions and judgments of the participants such as customers and service professionals during the service design, they can be biased and come with degrees of imprecision and uncertainties and therefore negatively impact the service design quality. Thus, by integrating GRA to these tools, it’s been attempted to overcome these issues [19,20,21].
Through logical combination of QFD and GRA, the importance of the customer requirement can be evaluated and adjusted, therefore providing an effective forecasting perspective to the future customer. The dynamics of the gray theory in this field have been confirmed by a number of researches [22]; [23] proposed an integrated fuzzy QFD and grey decision-making approach for supply chain collaborative quality design of large complex products. [24] integrated Refined Kano Model, QFD, and Grey Relational Analysis to Improve Service Quality of Nursing Homes. [22] provides a platform to ease decision process through the integration of quality function deployment (QFD) and grey relational analysis (GRA) in demonstrating main supply chain drivers under fuzzy environment.
In this research, an attempt is made to define and implement the service design procedure as well as the development of quality performance based on an approach on integrating some of the most effective decision-making techniques, including Kano, SERVQUAL, QFD and GRA to overcome the gaps found in existing literature. We also prove the validations and contributions of the proposed model by providing empirical evidence. Specific contributions include assessing the expectations and perception of service quality needs, categorizing them, designing a customized questionnaire to identify important Service improvement techniques and the improvement techniques for service quality were prioritized using a GRA-QFD model.
2. Literature Review
2.1. Service Quality
Several conceptual models have been developed by different researchers for measuring service quality. It is envisaged that conceptual models in service quality enable management to identify quality problems and thus help in planning for the launch of a quality improvement program, thereby improving the efficiency, profitability, and overall performance. [25] proposed that service quality is a function of the differences between expectation and performance along the quality dimensions. As it is shown in Figure 1, They developed a service quality model based on gap analysis [26]. This model was based on a survey of various industries, using 10 quality factors and 97 quality measurement items. Eventually the service quality assessment for 22 projects streamlined into five service quality facets since some of the key quality factors overlapped [13]. As it is shown in Figure 1, there are five gaps that can result in unsuccessful service delivery: (i) Gap between customer expectations and management perception, (ii) Gap between management perception and service quality specifications, (iii) Gap between service quality specifications and service delivery, (iv) Gap between service delivery and external communication, and (v) Gap between perceived service and delivered service [2].
According to this model, SERVQUAL scale was proposed by [24] for measuring Gap 5. SERVQUAL evaluates service quality by calculating the difference (gap) between customer expectations and perception (service quality= P – E). 'P' denotes customer perception of service or performance, and 'E' denotes expectations before a service encounter delivers the actual service if the answer is negative, then dissatisfaction occurs, otherwise, the service quality is achieved. This equation is usually called gap analysis, but as it was emphasized, this approach only measures gap 5 [27].
Being the most commonly used measure for service quality, the SERVQUAL scale [28] has been used in numerous studies from variety of fields, for example, [29] used SERVQUAL and AHP-TOPSIS for public service quality evaluation in Philippine government agencies. [30] analyzed the relationships between service quality and customer satisfaction across South African accommodation establishments with different grading categories. [13] studied how service quality affected public attitudes and the image of a sustainable city by using the SERVQUAL scale. [5] assessed Service Quality in Public Sector Banks in Nashik City with reference to SERVQUAL Model. [31] studied airline passengers’ perceptions of service quality with the SERVQUAL scale.
It can be perceived that lots of research on service quality measurement take place in different environments such as airports, banks, public sectors and hospitals, etc. as [31] claimed, a one-size-fits-all measurement tool in different environments and contexts is not a practical approach, therefore he suggests separate measurement frameworks for each particular scenario. Other flaws regarding using the SERVQUAL scale addressed by the literature display how SERVQUAL is too superficial to accurately sum up individuals’ complex cognitive procedure [32,33] and that the direct relationship between customer satisfaction and service quality in this approach appears to be a weakness as this relationship can be asymmetric or non-linear at times [7,8,9] So going forward with this study, by integrating the Kano model, the most valuable requirements for customer satisfaction for the National Elites Foundation can be identified, thus helping us to overcome this misconception of linear relationship between customer satisfaction and service quality attributes [13].
2.2. Kano’s Model
Kano model was developed by Dr. Noriaki Kano and his colleagues in 1984 in order to categorize the attributes of a product or service based on how well they are able to satisfy customers’ needs. As it is shown in Figure 2, the Kano model classifies the attributes of products and services in three categories: (i) the must-be or basic attributes. These attributes fulfil the basic functions of a product. If they are not present or their performance is insufficient, customers will be extremely dissatisfied, but if they are present or have sufficient performance, they do not bring satisfaction. Customers see them as prerequisites, (ii) the one-dimensional or performance attributes. In these attributes, satisfaction is proportional to the performance level; the higher the performance, the higher will be the customer’s satisfaction and vice-versa. Usually, customers explicitly demand performance attributes, and (iii) the attractive or excitement attributes [1]; if these attributes are present or have sufficient performance, they will bring superior satisfaction, but if they are not present or their performance is insufficient, customers will not become dissatisfied. These attributes are neither demanded nor expected by customers. By combining the two responses, both functional and dysfunctional, for every service quality attribute, the service attributes were classified into six categories: must-be (M), one-dimensional (O), attractive (A), indifferent (I), questionable (Q) or reversal (R) [27].
Kano model has been utilized in numerous studies to evaluate service quality and to help develop new service improvement techniques or product designs. [34] have employed Kano model for establishing models for products with different features in order to obtain new product designs. [35] used it for product development based on customer needs. [36] used kano model along sides SERVQUAL to measure the service quality of vocational higher education. [37] designed a model to evaluate passengers’ satisfaction with service quality in airlines. This model used clustering and Kano model to identify passengers with similar expectations and measured their satisfaction level. A similar approach was taken to evaluate the influence of after-sales service quality factors on customer satisfaction [38]. Another quality evaluation study was conducted regarding transportation services at mega events [13].
2.3. QFD Method
Quality function deployment (QFD) is a planning process for the purpose of translating customer needs into appropriate organizational requirements [39]. QFD has been defined as a system for translating customer requirements into appropriate technical requirements at every stage of a product’s life cycle [40]. House of quality (HOQ), the first matrix format of QFD as shown in Figure 3, is a product-planning matrix used to depict customer requirements, technical measures, target value, and competitive analysis [41].
QFD has been integrated into Kano and SERVQUAL in numerous fields and studies. For example it has been used in educational ground to measure Customer satisfaction [17] or to Measure Total Quality Management [42]. This integration has also been used to evaluate logistics services in order to improve service quality in airlines [18,43]. It has also proven to be a success model in improving hospital Information System quality [14]. [3] used this model to evaluate the image of Singapore from the Indonesian tourists’ perspective.
In this article, our attention is focused on the planning of HoQ. This research plans to discuss members' service need attributes and understand the satisfaction degrees of service need attributes from their point of view in order to understand the real feeling of members after accepting the service. Finally, by conducting the QFD, we can transform the service needs of members into service management requirements to enhance service quality.
2.4. Grey Relational Analysis
Grey theory was presented by Deng in 1989 [44]. It is mainly aimed at uncertainty or incomplete information of systematic models, and fully utilizing the white information to solve problems within the grey system. Grey theory can handle uncertainties in small data samples with imprecise information. Grey relational analysis (GRA) is an impact evaluation model that measures the degree of similarity or difference between two sequences based on the grade of relation [45]. The aim of GRA is to examine factors that affect systems. It is based on finding relationships in both independent and interrelating data series. The GRC (grey relational coefficient) can be used to evaluate the relationships between reference series and the series themselves. The steps of GRA are as follows:
Step 1. Finding the benchmark and referential series
In the grey relational space, there are referential series with k entities: x0(k), k=1,2,…,n, where x0(k) are the benchmark series.
Step 2. Listing the series of comparison xi(k)
There are m data series available for comparison, with k entities: xi(k) , i=1,2,…, m; k=1,2,…, n, where xi(k) are the series for comparison.
Step 3. Normalization
Before calculation of grey relational coefficients, series data are handled with three types of pre-processing, including normalization; maximum value, minimum value, and objective value. In this study, a larger member concentration represents a more important service quality; therefore, the pre-processing of normalization by the maximum value is used when calculating the grey relational grades.
where is xi(k), the maximum value of entity k, and xi(k) is the minimum value of entity k.
Step 4. Calculating the difference series Δ0i(k)
To calculate the absolute value of the difference between x0 and xi at the k-th entity, that is:
Step 5. Calculating the grey relational coefficients Γ0i
The GRC between the comparative series Xi and the referential series X0 at the k-th entity is defined as
where and
The distinguishing coefficient, ζ∈[0,1], to control the resolution between Δmax and Δmin, typically taken as 0.5. The smallest value among all annual data is used to implement the lower-bound effectiveness measurement to give a clearer picture.
Step 6. Ranking the grey relational coefficients Γ0i
To sum up, the grey relational coefficients Γ0i(k) are multiplied by the standardizing weight wi(k) of the member's needs. The value of Γ0i can be sorted
To overcome the inevitable uncertainty and imprecision of information in systematic models and avoid their negative impact on the service design quality [39,45], GRA have been inserted in service quality design models by a number of researchers. [24] Integrated Refined Kano Model, Quality Function Deployment and Grey Relational Analysis to Improve Service Quality of Nursing Homes. [46,47] used this integration to evaluate the quality of automatic distribution centers and channel services of cell phones. [39] Applied GRA and QFD to identify service improvement techniques for an academic library. Some studies have used a fuzzy framework with integration of QFD and grey relational Analysis; [23] used this framework for supply chain collaborative quality design of large complex products and [22] proposed a multi attribute decision support model in a supply chain in order to solve complex decision problems.
3. Methodology
The objective of this research is practical, the variable control method is explanatory, and its implementation method is survey. The research process is an analytical survey. This research has constructed a GRA QFD model to identify top service quality improvement techniques. As shown in Figure 4, the steps to reach this objective can be summarized as follows: First to identify the elite's needs and improvement techniques for service quality, a study on literature was conducted and views of staff and managers were collected through interviews and then member's needs were categorized using a standard questionnaire based on Kano model. In the second step the level of satisfaction with the quality of service was evaluated based on gap analysis. Step 3, includes calculating the priorities of members' needs. In step 4, In order to develop service improvement techniques, interviews with members, staff, and the director of the Foundation were conducted and questionnaires were carried out and due to the large number of proposed techniques, a number of them were selected by using SAW method. In step 5, the central relationship matrix is constructed by combining the GRA relationship strength between improvement techniques and members' needs. This matrix, evaluates the strength of the relationship between the service improvement and the member's needs. In the sixth and last step, Using QFD and GRA, the desired characteristics of the elite community are determined and the improvement techniques for service quality are prioritized.
3.1. Data Gathering
The data used in this research were collected through a questionnaire survey. The questionnaire is composed of two parts; the first part is respondent's background, such as gender, age, education and occupation, and the other part is member's needs. The questionnaire contains 8 sections (depicted in Table 1) chosen to represent member's needs. At the beginning of each section, services that are currently offered to the elite by the foundation and actions to improve the level of the offered services (the suggested improvements techniques), are listed, then, the questions are represented. In order to help determine the needs type, Kano model is used to prioritize the importance of current services and proposed improvement techniques and to rate the respondents' expectation and foundation performance. A five-point Likert scale was employed to present the level of importance (satisfaction) in these questions. The survey was carried out with stratified random sampling. The total sample size was 100, and 30 were returned. Among them, there were no invalid responses. The overall response rate was 30%. Cronbach’s α values were used to verify the questionnaires’ consistency, In this study, Cronbach's α values for each dimension are above 76%, This shows that each dimension achieves a satisfactory level of reliability (Nunnally, 1978). The content of this questionnaire was established through literature review and interviews with professional staff of the foundation. In addition, a pre-test was carried out; therefore, the content validity of this questionnaire is also supported.
3.2. Data Analysis
Service Quality Measurement
In this section, the expectations and perception of 8 service quality dimensions (needs) are presented in the table below. As can be seen in the Table 2, the quality of services provided to the members in all components is less than the average score (3). Need 8 (Cultural and Welfare Services) has the highest performance score and the lowest score was given to need 2 (Providing research & scientific services). In all cases, the current state of service delivery is lower than expected.
Based on the scores, we can see the members have the most expectation of need 8, and the greatest gap between expectations and perception is allocated to need 2.
Classifying Needs into Kano's Categories
Members are asked to properly group their needs into Kano's categories. After collecting customer responses to the questions related to Kano model in the questionnaire, the results are shown in Table 3. The most common method was used to analyse the results.
According to Table 3, this study finds that there are three essential customer attributes classified as "must-be quality element" and five are classified as "attractive".
Evaluating the Level of Satisfaction Based on Gap Analysis
As mentioned before, after analysing the collected data by measuring the gap between the elite’s perception and expectations, calculating the priorities of members' needs is performed which is shown in the following paragraph.
Let Xiq and Yiq , i=1,2,…,n; q=1,2,…,s; denote the importance and satisfaction level of each distributor's needs attribute Ai, respectively, that are assigned by distributor Dq. Next, the original priority rating wi of each Ai can be calculated by the following formula:
where
And
And, the normalized priority rating vi is defined as:
4. Results
4.1. Development and Selection of Service Improvement Techniques
The improvement techniques for service quality are developed based on the organizational resources or characteristics, which can be utilized to improve service quality. These improvement techniques can be grouped by consultation of experts or executive managers’ brainstorming. Due to the large number of proposed techniques, 16 of them were selected. Selection of service improvement techniques is performed using SAW method.
Simple Additive Weighting (SAW) is a simple and most commonly used multi-attribute decision technique. It is based on the weighted average. An evaluation score is calculated for each alternative by multiplying the scaled value given to the alternative of that attribute with the weights of relative importance directly assigned by decision-maker followed by summing of the products for all criteria. SAW is calculated by the following formula:
where Ai is each alternative, rij is the score of the ith alternative with respect to the jth criteria, and wj is the weighted criteria [47].
Based on Eq. (9), selected service quality improvement techniques are shown in Table 5.
4.2. Constructing the Central Relationship Matrix
In this step, we evaluate the strength of the relationship between the service improvement techniques and the members’ needs by constructing the central relationship matrix.
By combining members’ service needs or the voice of customer (VOC) and service improvement techniques or service exclusivity (SE), we can construct the central relationship matrix to link both. Based on the central relationship matrix, each of the service improvement techniques is individually correlated to each member's need by considering the contribution degree of each service improvement technique versus each member's need. Here, the relationship degree will be used to evaluate the strength of the relationship between the service improvement techniques and the member's needs. Table 6 shows the central relationship matrix and the cell in which it shows the average relationship degree.
Next to determining the relationship strength, first, we find the maximum referential value 9 to be the benchmark in the referential series. The next step is to list the series of comparison xi(k) and calculate the grey relational grades by pre-processing of normalization by the maximum value. The result is shown in Table 7. The difference series Δ0i(k), and grey relational coefficients Γ0i are listed in Table 8 and Table 9, respectively
4.3. Prioritizing the Improvement Techniques for Service Quality
And lastly, to prioritize the improvement techniques for service quality, We sum up the grey relational coefficients Γ0i(k) multiplied by the standardizing weight wi(k) of the member's needs. The value of Γ0i can be sorted.
The result is shown in Table 10. The results show the most important service quality attributes.
5. Conclusions
This paper developed a GRA-QFD model to select the best service quality improvement techniques based on members’ needs. This model showcased the gap between the importance and satisfaction of the provided service quality and then prioritized the members’ needs by classifying the service quality attributes as either "must-be quality element" or "attractive". Obviously, the improvement techniques corresponding "must-be" attributes should be prioritized and improvement techniques related to "attractive" attributes are in next priority. The top five important service quality attributes are as bellow:
T4. Receiving grant to publish papers in domestic and foreign journals
T16. Student loans
T5. Receiving grant to publish articles in conference proceedings or journals
T7. Financial assistance for book publishing
T8. Financial assistance for Master’s or Ph.D thesis
Based on these results, this research presents these suggested improvement techniques for foundation managers in order to increase members’ satisfaction level:
1. Data shows that only 3% of the members have access to grants. Considering that in the final ranking of improvement techniques, techniques related to the support of scientific activities by receiving grants and financial support are in 1st, 3d, 4th, 5th, and 6th ranks, paying special attention to them by increasing the amount of scholarships, grants, scientific travel allowances, sabbatical and post-doctoral fellowships, etc. will have a substantial impact on increasing members’ satisfaction.
2. Increasing notification to members of news, actions, approvals and regulations associated with the elite.
3. only 24% of the members said that they have memberships to social networks with ability to interact with other elites and in response to the question of what form of social networking suits their purposes, 28% chose specialized convention, 25% chose virtual social networks, and 16% chose regular public meetings (open sessions, scientific & cultural tours, etc.), thus, by creating a network for elites’ to interact or using existing social networks, the Foundation can cover techniques 1,9 and 10.
Funding
This article was funded by the Iran’s National foundation for the elite.
Conflicts of Interest
Authors declare that there is no conflict of interest.
References
- Kano, N. Attractive quality and must-be quality. Hinshitsu (Quality, The Journal of Japanese Society for Quality Control) 1984, 14, 39–48. [Google Scholar]
- Parasuraman, A.; Zeithaml, V.A.; Berry, L.L. SERVQUAL: a multi-item scale for measuring consumer perceptions for service quality. Journal of Retailing 1988, 64, 12–40. [Google Scholar]
- Tan, K.C.; Pawitra, T.A. Integrating SERVQUAL and Kano’s model into QFD for service excellence development. Managing Service Quality: An International Journal 2001, 11, 418–430. [Google Scholar] [CrossRef]
- Parasuraman, A.; Zeithaml, V.A.; Berry, L.L. Reassessment of expectations as a comparison standard in measuring service quality: implications for further research. Journal of Marketing 1994, 58, 111–124. [Google Scholar] [CrossRef]
- Gaikwad, D.Y.; Gwalani, D.H. Assessment of Service Quality in Public Sector Banks in Nashik City with reference to SERVQUAL Model. AJANTA” An International Multidisciplinary Quarterly Research Journal Peer Reviewed Referred and UGC Listed Journal ISSN, 2019: p. 2277-5730.
- Shekarchizadeh, A.; Rasli, A.; Hon-Tat, H. SERVQUAL in Malaysian universities: perspectives of international students. Business Process Management Journal 2011. [Google Scholar] [CrossRef]
- Pawitra, T.A.; Tan, K.C. Tourist satisfaction in Singapore–a perspective from Indonesian tourists. Managing Service Quality: An International Journal 2003, 13, 399–411. [Google Scholar] [CrossRef]
- Sahney, S. Delighting customers of management education in India: a student perspective, part II. The TQM Journal 2011. [Google Scholar] [CrossRef]
- Basfirinci, C.; Mitra, A. A cross cultural investigation of airlines service quality through integration of Servqual and the Kano model. Journal of Air Transport Management 2015, 42, 239–248. [Google Scholar] [CrossRef]
- Kinker, P.; et al. Prioritizing NBA quality parameters for service quality enhancement of polytechnic education institutes–A fuzzy Kano-QFD approach. Materials Today: Proceedings 2021, 47, 5788–5793. [Google Scholar] [CrossRef]
- Pourhasomi, M.; Khamseh, A.; Ghorbanzad, Y. A hybrid of Kano and QFD for ranking customers’ preferences: A case study of bank Melli Iran. Management Science Letters 2013, 3, 845–860. [Google Scholar] [CrossRef]
- Lizarelli, F.L.; et al. Integration of SERVQUAL, Analytical Kano, and QFD using fuzzy approaches to support improvement decisions in an entrepreneurial education service. Applied Soft Computing 2021, 112, 107786. [Google Scholar] [CrossRef]
- Chen, M.-C.; Hsu, C.-L.; Huang, C.-H. Applying the Kano model to investigate the quality of transportation services at mega events. Journal of Retailing and Consumer Services 2021, 60, 102442. [Google Scholar] [CrossRef]
- Wibawa, J.; Widjaja, H.A.; Hidayanto, A.N. Integrating IS success model, SERVQUAL and Kano model into QFD to improve hospital information system quality. in 2016 International Conference on Information Management and Technology (ICIMTech). 2016. IEEE.
- Beheshtinia, M.A.; Farzaneh Azad, M. A fuzzy QFD approach using SERVQUAL and Kano models under budget constraint for hotel services. Total Quality Management & Business Excellence 2019, 30, 808–830. [Google Scholar]
- Vaziri, J.; Beheshtinia, M.A. A holistic fuzzy approach to create competitive advantage via quality management in services industry (case study: life-insurance services). Management decision 2016, 54, 2035–2062. [Google Scholar] [CrossRef]
- Apornak, A. Customer satisfaction measurement using SERVQUAL model, integration Kano and QFD approach in an educational institution. International Journal of Productivity and Quality Management 2017, 21, 129–141. [Google Scholar] [CrossRef]
- Baki, B.; et al. An application of integrating SERVQUAL and Kano's model into QFD for logistics services: a case study from Turkey. Asia Pacific Journal of Marketing and Logistics 2009. [Google Scholar] [CrossRef]
- Cho, I.J.; Kim, Y.J.; Kwak, C. Application of SERVQUAL and fuzzy quality function deployment to service improvement in service centres of electronics companies. Total Quality Management & Business Excellence 2016, 27, 368–381. [Google Scholar]
- Mardani, A.; et al. Application of decision making and fuzzy sets theory to evaluate the healthcare and medical problems: a review of three decades of research with recent developments. Expert Systems with Applications 2019, 137, 202–231. [Google Scholar] [CrossRef]
- Osiro, L.; Lima-Junior, F.R.; Carpinetti, L.C.R. A fuzzy logic approach to supplier evaluation for development. International Journal of Production Economics 2014, 153, 95–112. [Google Scholar] [CrossRef]
- Yazdani, M.; et al. A fuzzy multi attribute decision framework with integration of QFD and grey relational analysis. Expert Systems with Applications 2019, 115, 474–485. [Google Scholar] [CrossRef]
- Wang, H.; et al. An integrated fuzzy QFD and grey decision-making approach for supply chain collaborative quality design of large complex products. Computers & Industrial Engineering 2020, 140, 106212. [Google Scholar] [CrossRef]
- Yeh, T.M.; Chen, S.H. Integrating refined Kano model, quality function deployment, and grey relational analysis to improve service quality of nursing homes. Human Factors and Ergonomics in Manufacturing & Service Industries 2014, 24, 172–191. [Google Scholar]
- Parasuraman, A.; Zeithaml, V.A.; Berry, L.L. A conceptual model of service quality and its implications for future research. Journal of marketing 1985, 49, 41–50. [Google Scholar] [CrossRef]
- Seth, N.; Deshmukh, S.; Vrat, P. Service quality models: a review. International journal of quality & reliability management 2005. [Google Scholar]
- Rahmana, A.; et al. Integration of SERVQUAL and Kano model into QFD to improve quality of simulation-based training on project management. International Journal of Basic and Applied Science 2014, 2, 59–72. [Google Scholar]
- Ladhari, R. Service quality, emotional satisfaction, and behavioural intentions: A study in the hotel industry. Managing Service Quality: An International Journal, 2009. [Google Scholar]
- Ocampo, L.; et al. Public service quality evaluation with SERVQUAL and AHP-TOPSIS: A case of Philippine government agencies. Socio-Economic Planning Sciences 2019, 68, 100604. [Google Scholar] [CrossRef]
- Nunkoo, R.; et al. Service quality and customer satisfaction: The moderating effects of hotel star rating. International Journal of Hospitality Management 2020, 91, 102414. [Google Scholar] [CrossRef]
- Shah, F.T.; et al. The impact of airline service quality on passengers’ behavioral intentions using passenger satisfaction as a mediator. Journal of Air Transport Management 2020, 85, 101815. [Google Scholar] [CrossRef]
- Calvo-Porral, C.; Lévy-Mangin, J.-P.; Novo-Corti, I. Perceived quality in higher education: an empirical study. Marketing Intelligence & Planning, 2013. [Google Scholar]
- Van Dyke, T.P.; Kappelman, L.A.; Prybutok, V.R. Measuring information systems service quality: concerns on the use of the SERVQUAL questionnaire. MIS quarterly 1997, 195–208. [Google Scholar] [CrossRef]
- Liao, Y.; Yang, C.; Li, W. Extension innovation design of product family based on kano requirement model. Procedia Computer Science 2015, 55, 268–277. [Google Scholar] [CrossRef]
- Sharif Ullah, A.; Tamaki, J.I. Analysis of Kano-model-based customer needs for product development. Systems Engineering 2011, 14, 154–172. [Google Scholar] [CrossRef]
- Rinanto, A.; et al. Service quality measurement of higher vocational education based on SERVQUAL and KANO: A case study in Politeknik ATMI Surakarta. in AIP Conference Proceedings. 2019. AIP Publishing LLC.
- Tahanisaz, S. Evaluation of passenger satisfaction with service quality: A consecutive method applied to the airline industry. Journal of Air Transport Management 2020, 83, 101764. [Google Scholar] [CrossRef]
- Shokouhyar, S.; Shokoohyar, S.; Safari, S. Research on the influence of after-sales service quality factors on customer satisfaction. Journal of Retailing and Consumer Services 2020, 56, 102139. [Google Scholar] [CrossRef]
- Chen, Y.-T.; Chou, T.-Y. Applying GRA and QFD to improve library service quality. The Journal of Academic Librarianship 2011, 37, 237–245. [Google Scholar] [CrossRef]
- Mukherjee, A.; Nath, P. An empirical assessment of comparative approaches to service quality measurement. Journal of Services Marketing 2005.
- Eureka, W.E.; Ryan, N.E. The customer-driven company: managerial perspective on quality function deployment. 1994: Irwin Professional Publishing, US.
- Hamzah, Z.; Purwati, A.A.; Hamzah, M.L. A servqual and quality function deployment (QFD) approach in measuring total quality management at private universities in Pekanbaru, Riau, Indonesia. Journal of Economic Info 2019, 6, 1–4. [Google Scholar] [CrossRef]
- Hartono, M.; Santoso, A.; Prayogo, D.N. How Kansei Engineering, Kano and QFD can improve logistics services. International Journal of Technology 2017, 8, 1070–1081. [Google Scholar] [CrossRef]
- Julong, D. Introduction to grey system theory. The Journal of grey system 1989, 1, 1–24. [Google Scholar]
- Chan, J.W.; Tong, T.K. Multi-criteria material selections and end-of-life product strategy: Grey relational analysis approach. Materials & Design 2007, 28, 1539–1546. [Google Scholar]
- Lin, L.; Koo, T. A study automated distribution center’s quality characteristics using grey relation analysis and quality function deployment. Commerce & Management Quality 2005, 6, 515–529. [Google Scholar]
- Afshari, A.; Mojahed, M.; Yusuff, R.M. Simple additive weighting approach to personnel selection problem. International journal of innovation, management and technology 2010, 1, 511. [Google Scholar]
Figure 1.
Gap model of service quality [2].
Figure 1.
Gap model of service quality [2].
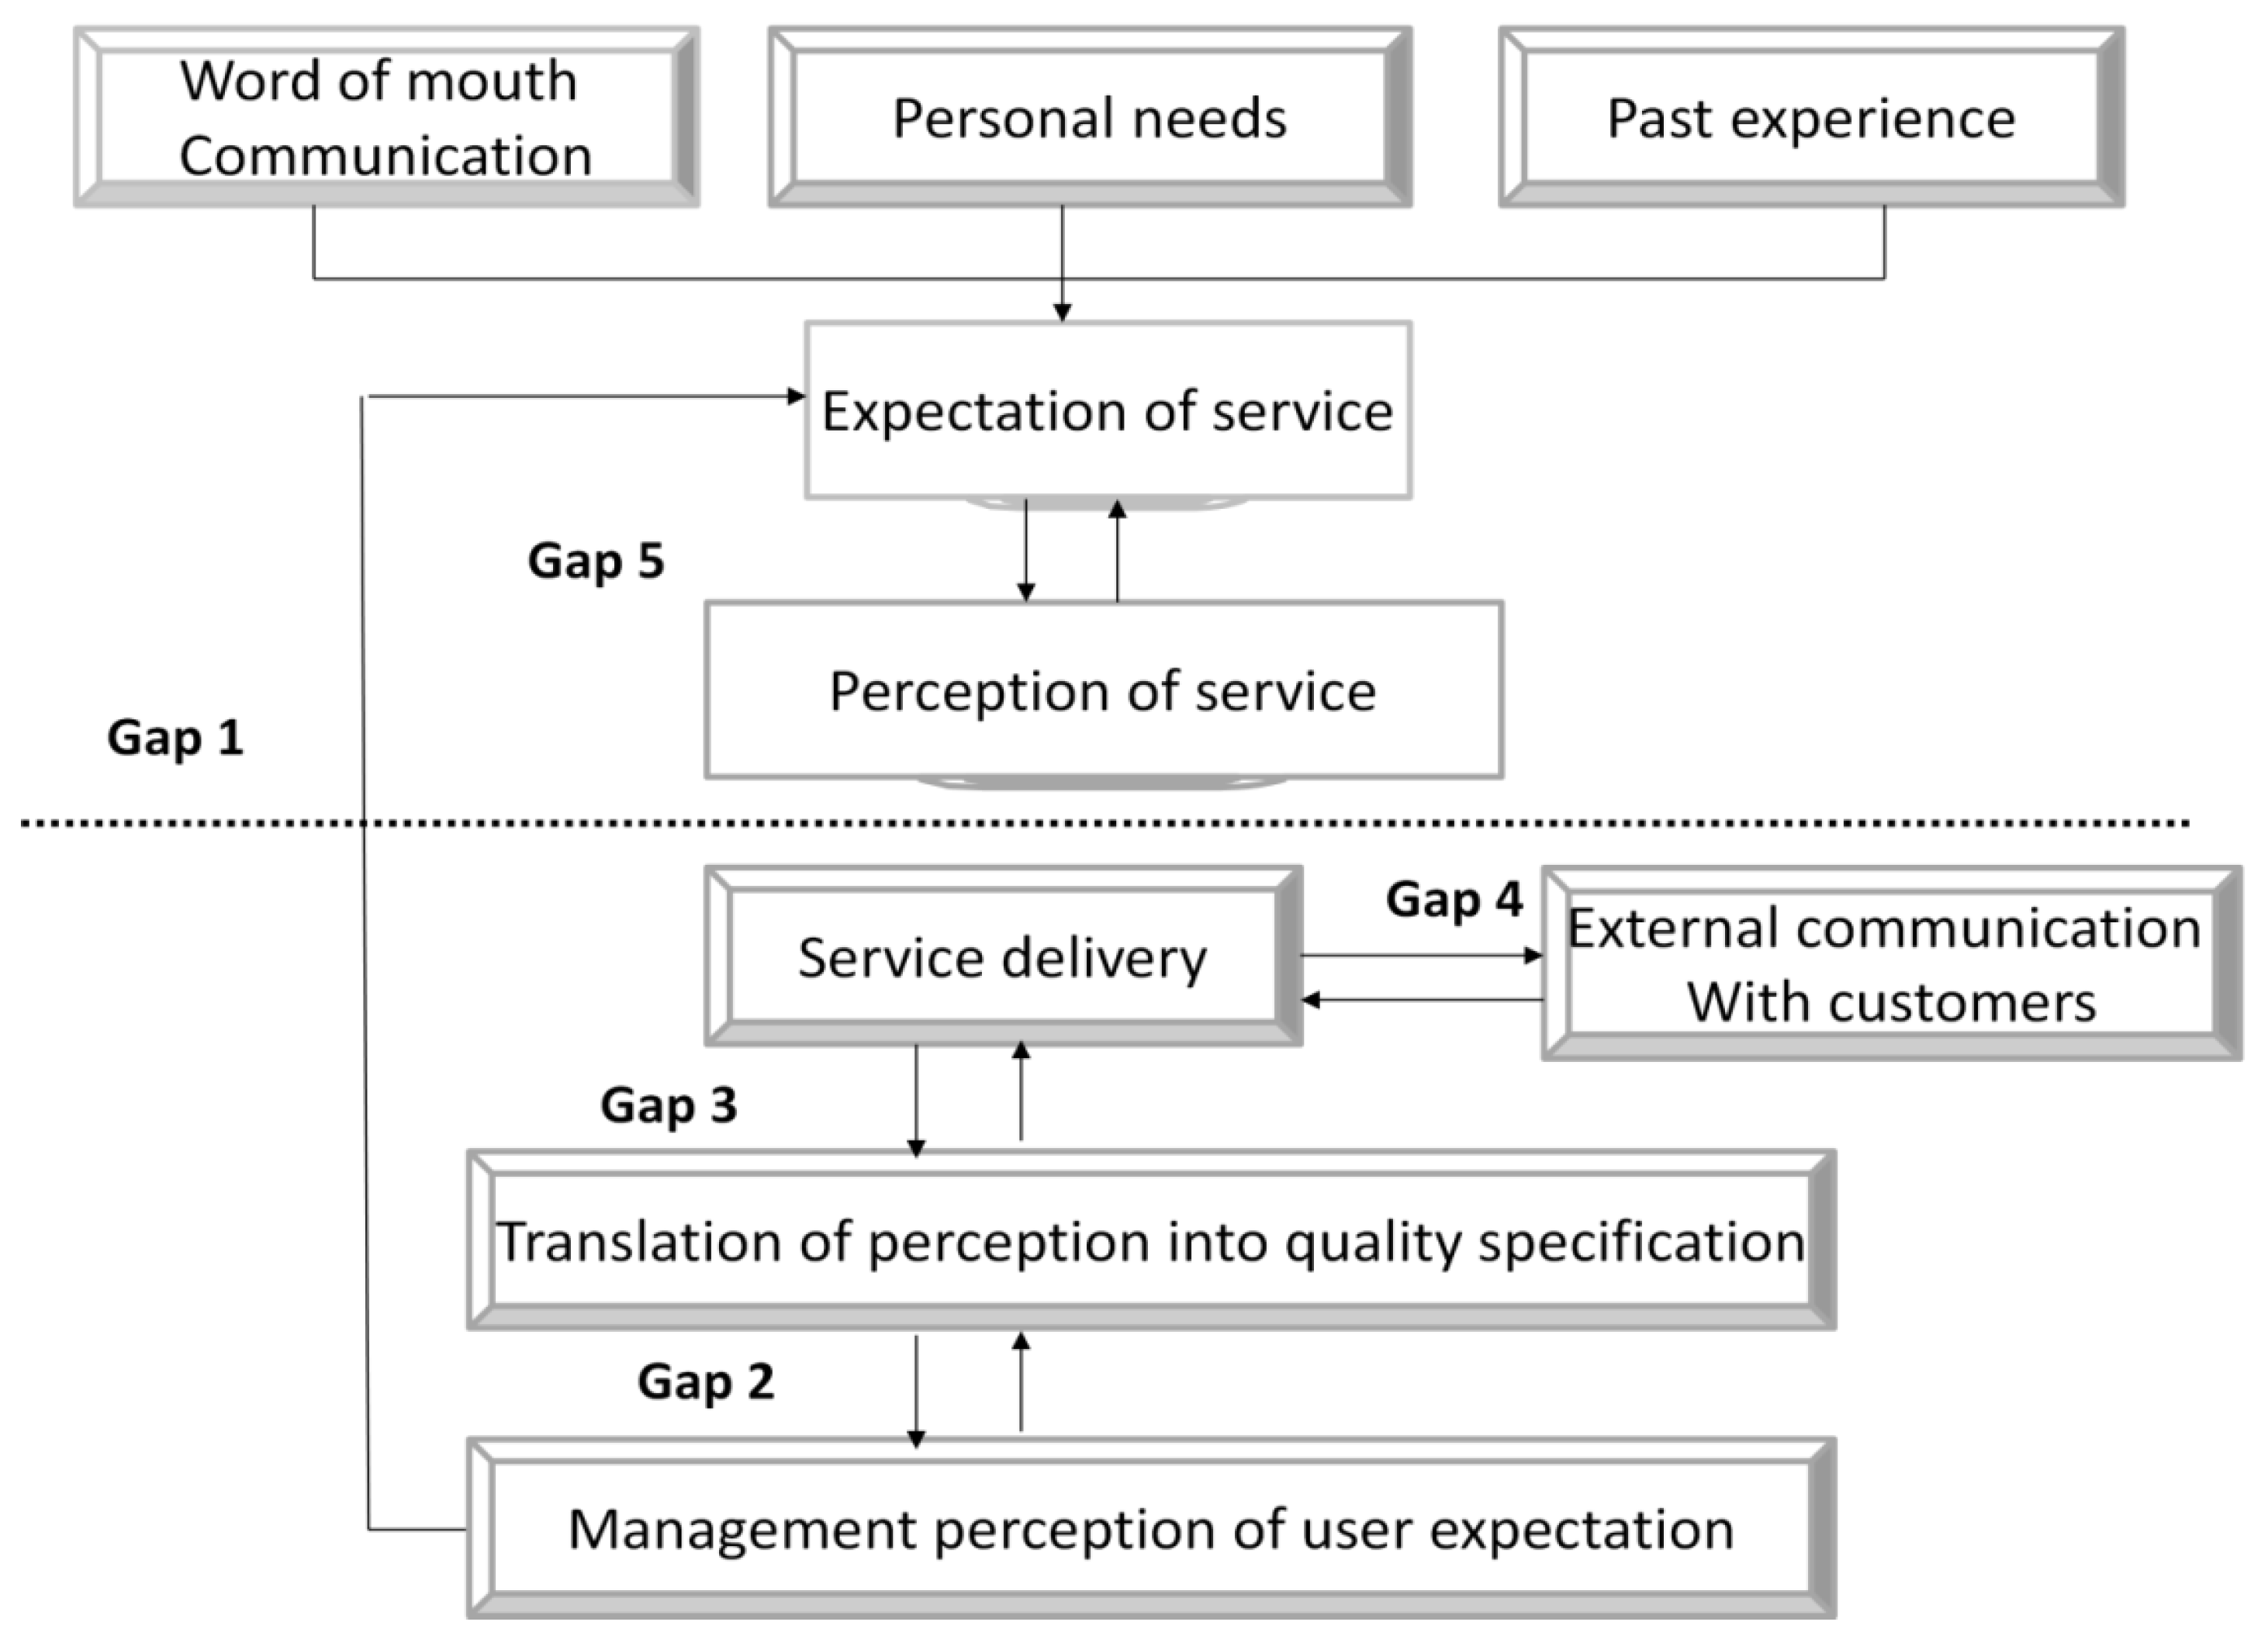
Figure 2.
Kano's model [1].
Figure 2.
Kano's model [1].
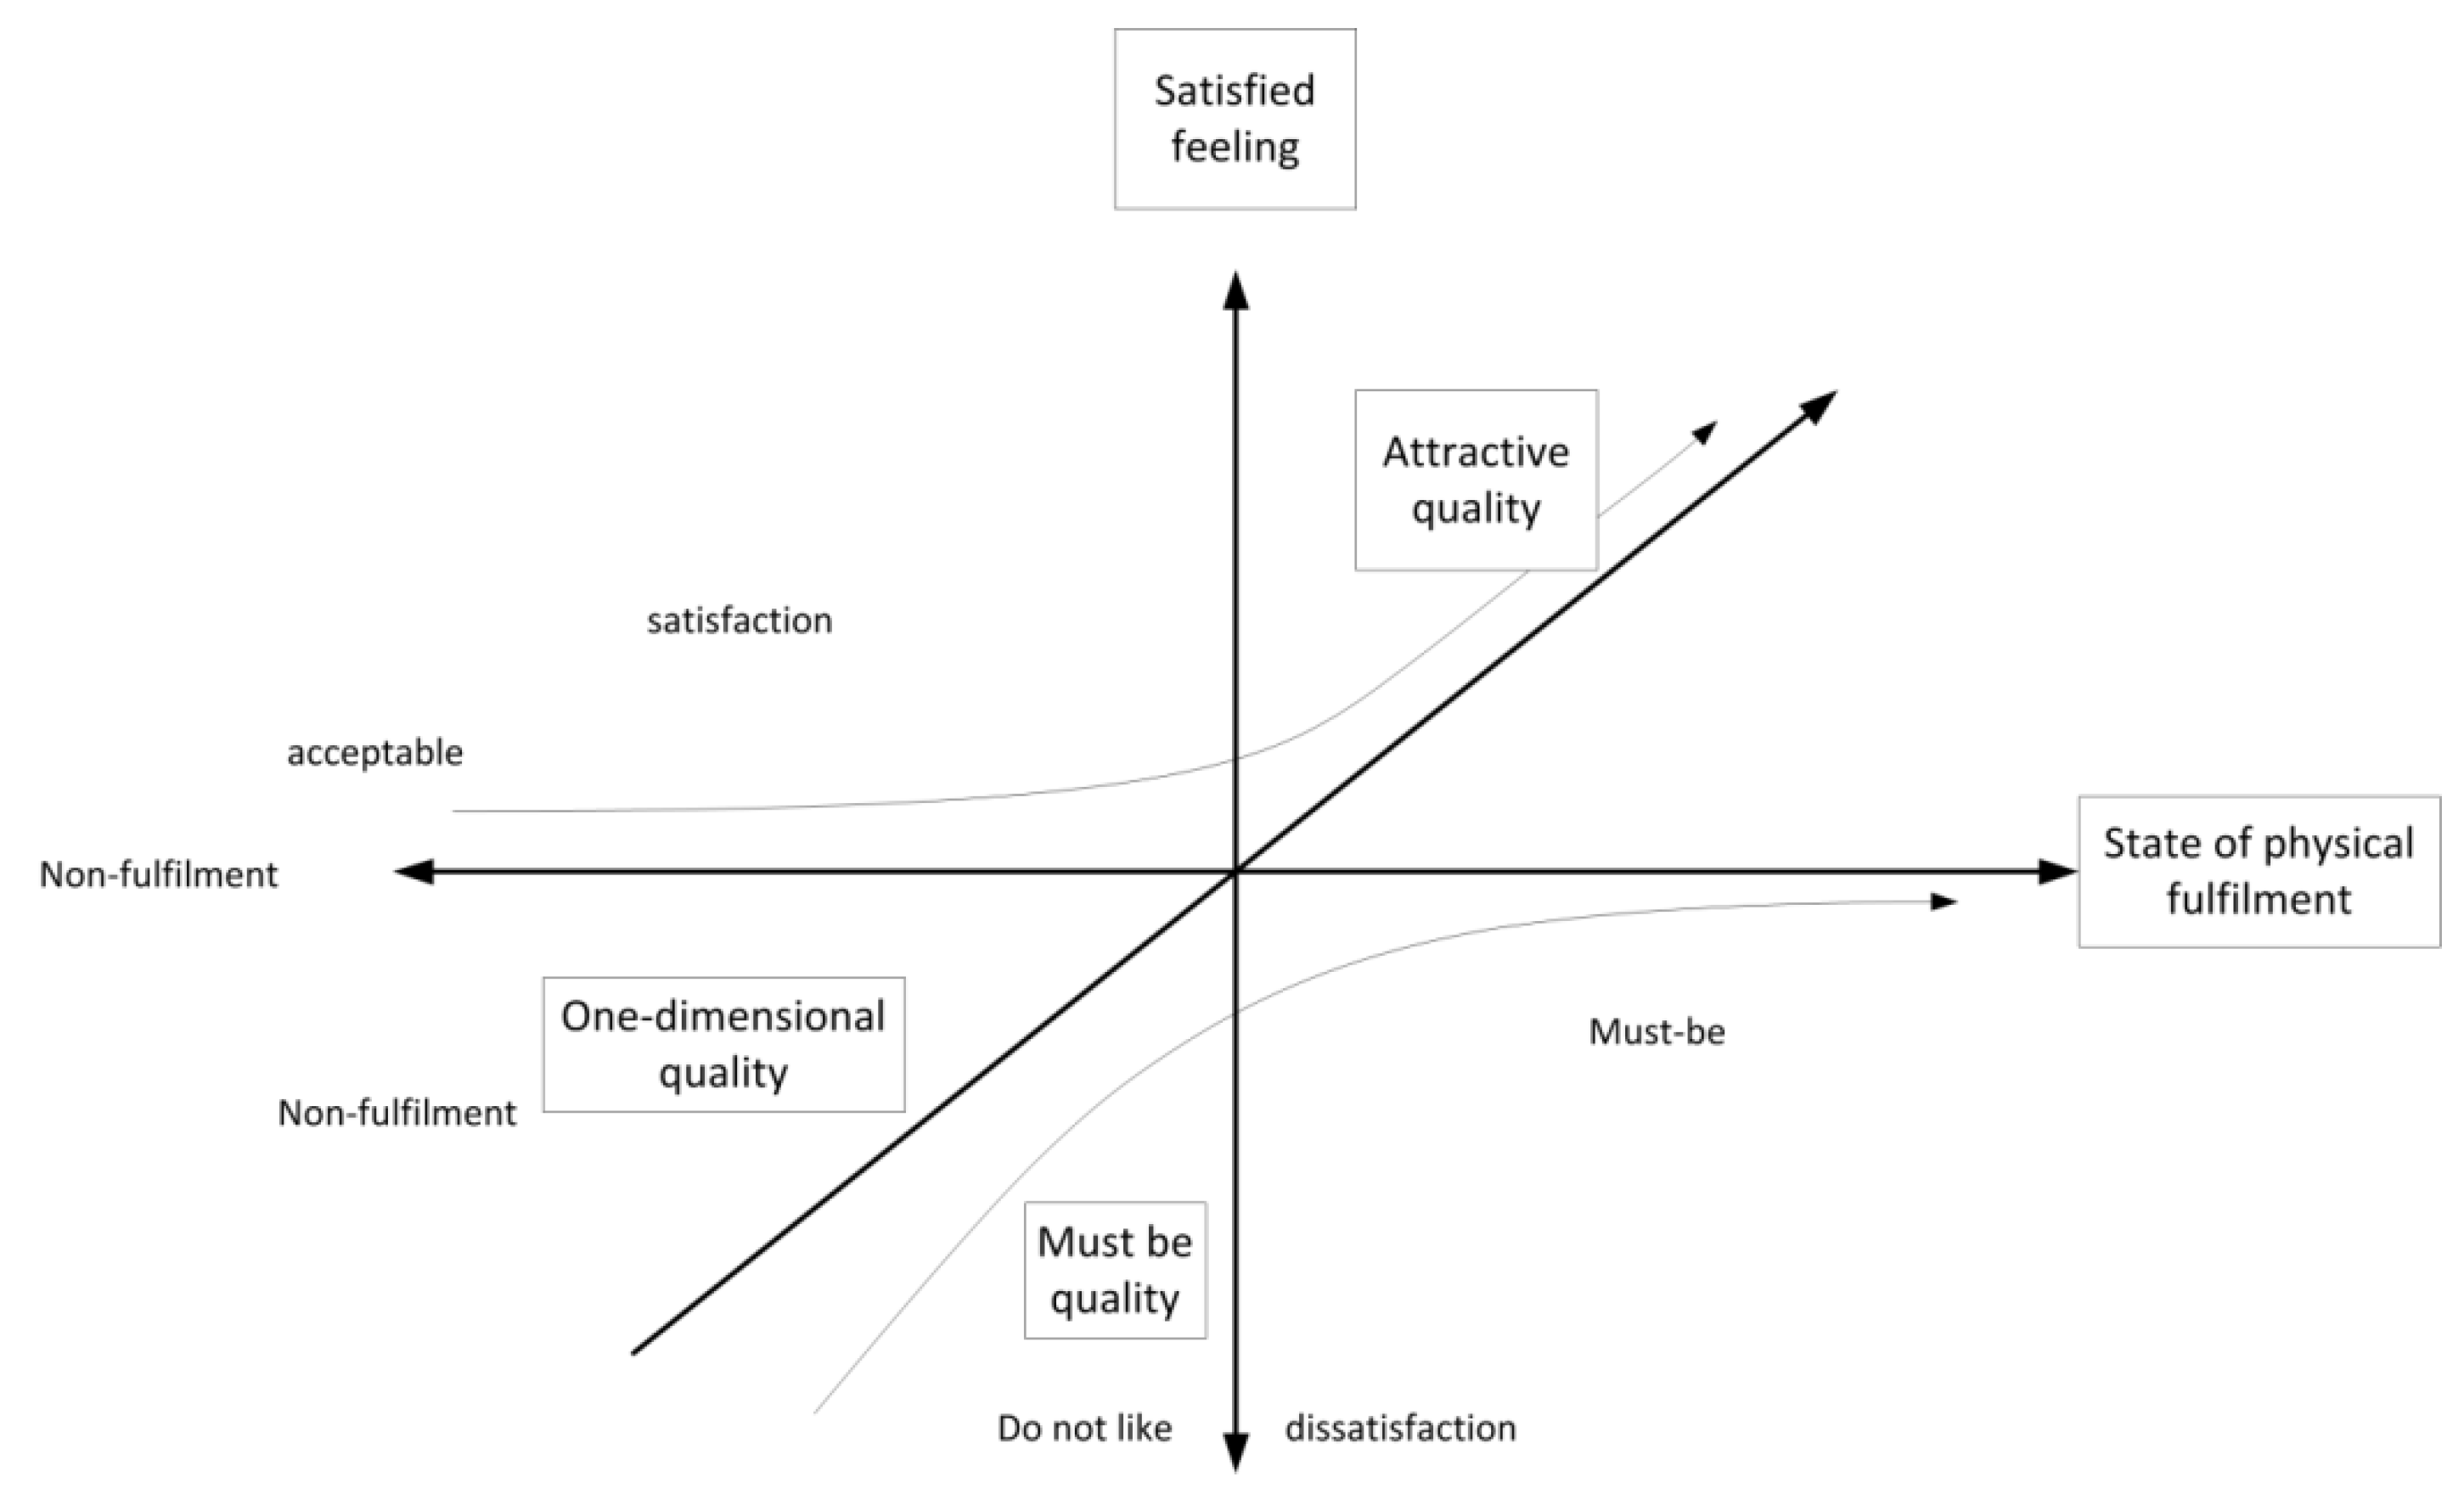
Figure 3.
The house of quality [3].
Figure 3.
The house of quality [3].
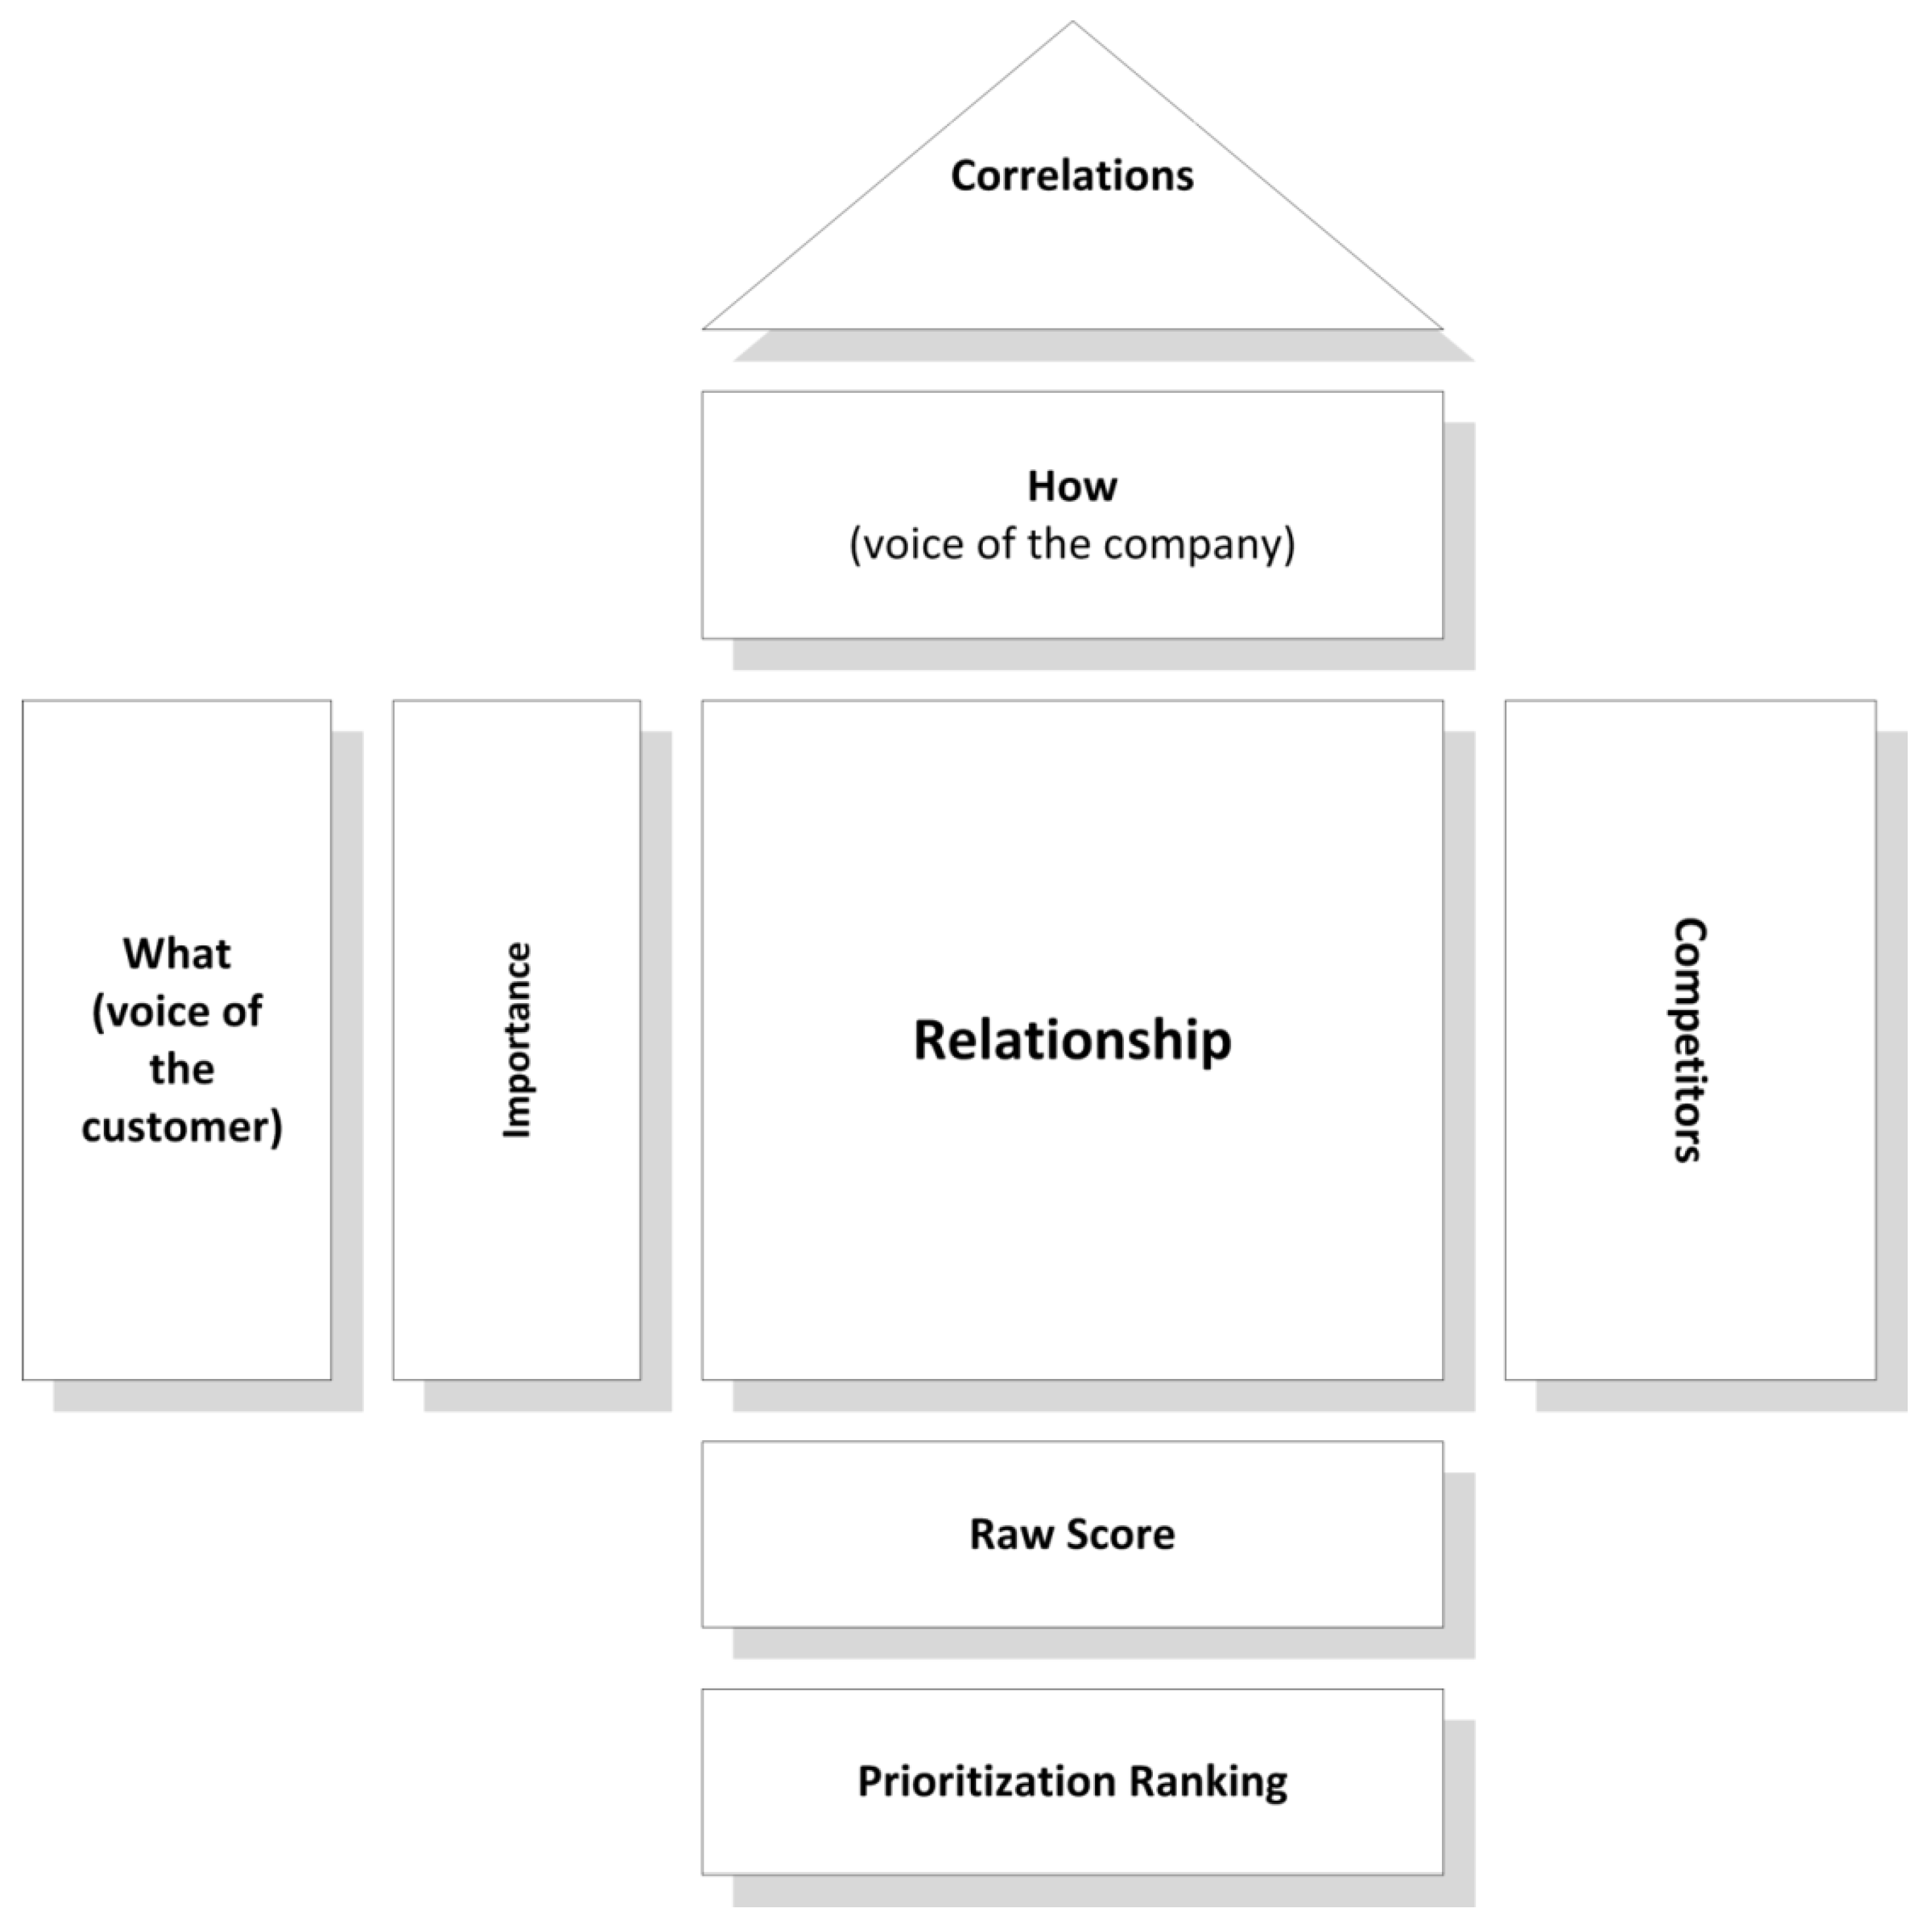
Figure 4.
The research structure flowchart.
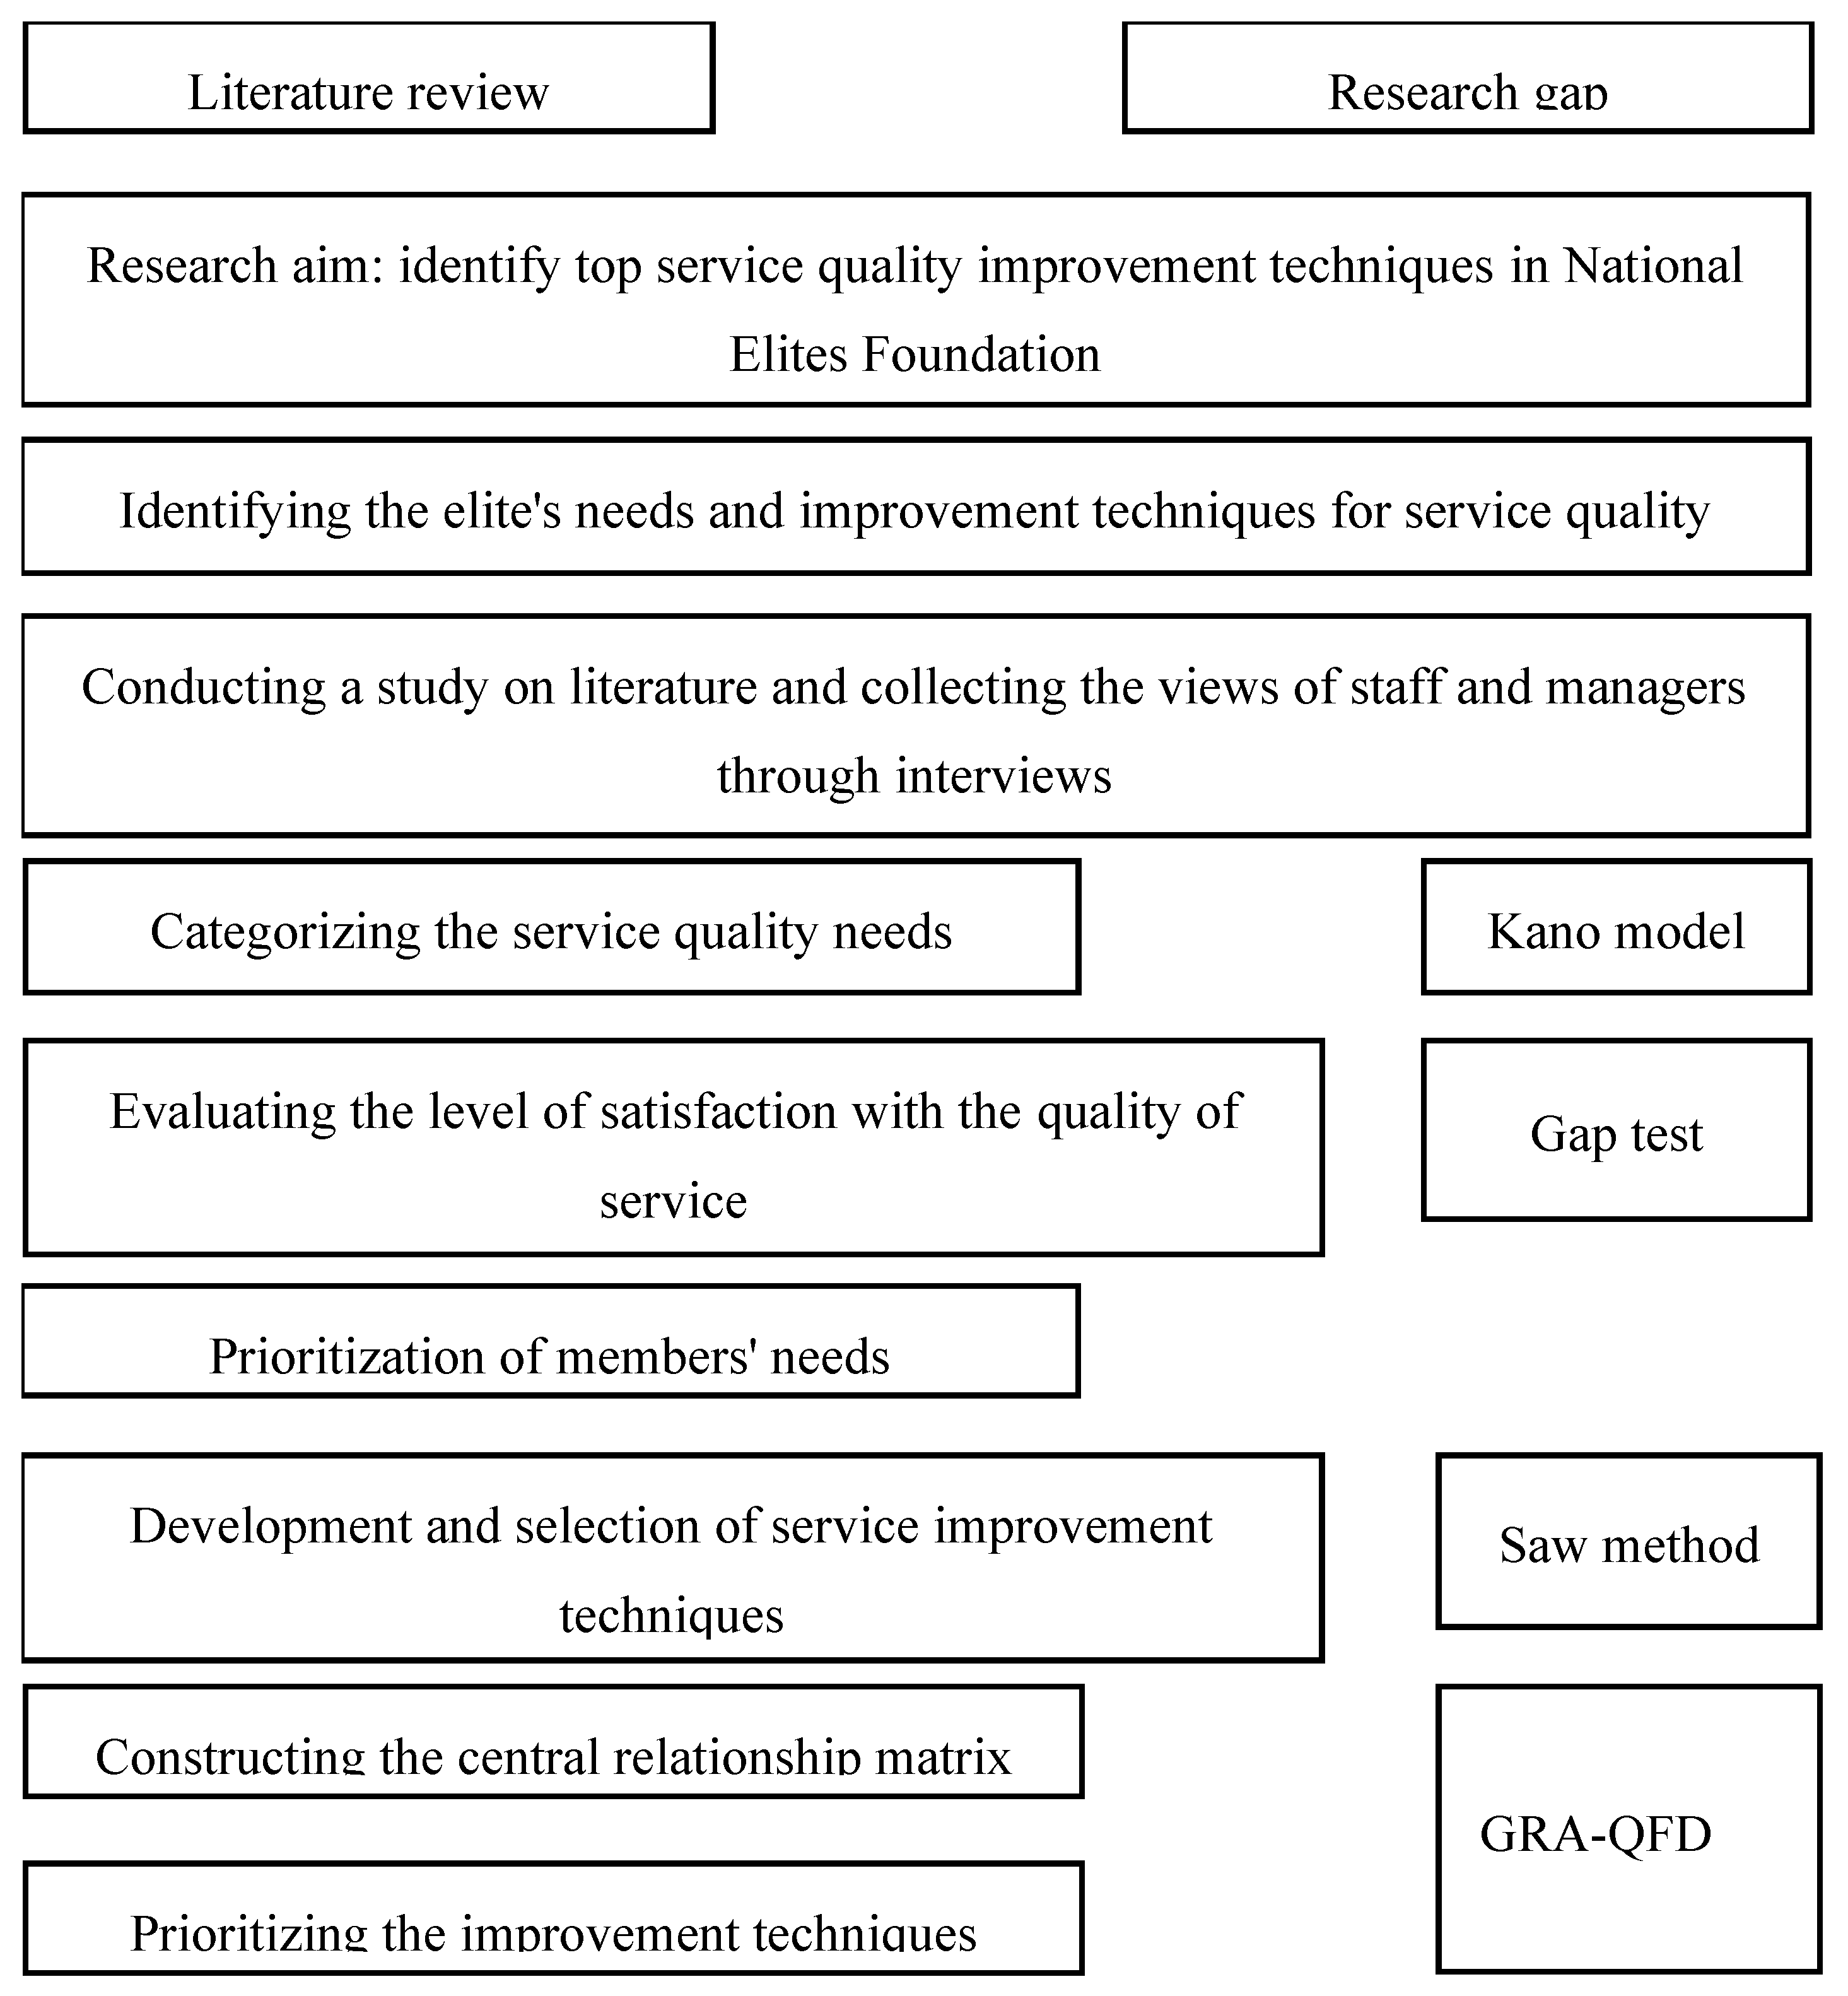

Table 1.
Member’s needs (service quality dimensions).
| ID | member's needs |
| N1 | Need to recognition, presentation and offer competencies of the community to society, economic, social and other activists, economic, social in the country |
| N2 | Providing research & scientific services |
| N3 | Supporting scientific and research activities |
| N4 | Networking |
| N5 | Empowerment |
| N6 | Elite interaction with the seekers in the community |
| N7 | Providing information |
| N8 | Cultural and Welfare Services |
Table 2.
Service quality measurement results.
| A | M | O | R | Q | I | Total | Grade | |
| N1 | 16 | 12 | 1 | 29 | A | |||
| N2 | 16 | 10 | 2 | 28 | A | |||
| N3 | 11 | 16 | 2 | 29 | M | |||
| N4 | 13 | 11 | 1 | 3 | 28 | A | ||
| N5 | 13 | 11 | 1 | 4 | 29 | A | ||
| N6 | 14 | 12 | 1 | 1 | 28 | A | ||
| N7 | 10 | 15 | 3 | 28 | M | |||
| N8 | 5 | 19 | 5 | 29 | M |
Table 3.
Kano’s model results.
| Need | Performance (perceptions) | Rank | Importance (Expectations) |
Rank | Gap | Priority |
| N1 | 2.38 | 3 | 4.03 | 2 | -1.66 | 4 |
| N2 | 2.03 | 2 | 4.1 | 8 | -2.77 | 1 |
| N3 | 2.34 | 4 | 3.97 | 3 | -1.62 | 5 |
| N4 | 2.1 | 6 | 3.86 | 6 | -1.76 | 2 |
| N5 | 2.14 | 5 | 3.9 | 5 | -1.76 | 2 |
| N6 | 2.07 | 7 | 3.79 | 7 | .1.72 | 3 |
| N7 | 2.21 | 4 | 3.97 | 4 | -1.76 | 2 |
| N8 | 2.59 | 1 | 4.24 | 1 | -1.66 | 4 |
Table 4.
The Standard Weight of member’s Needs.
| Needs | Std. weight |
Rank |
|---|---|---|
| N1 N2 N3 N4 N5 N6 N7 N8 |
0.14 0.05 0.21 0.17 0.14 0.11 0.06 0.12 |
3 7 1 2 3 5 6 4 |
Table 5.
Improvement Techniques for Service Quality.
| Needs | Improvement Techniques |
|---|---|
| N1 | T1.development of a Virtual network to communicate with other members & society |
| N1 | T2. observation of research with the aim of linking members and resources |
| N2 | T3. Access to resources by providing access to scientific databases |
| N3 | T4. Receiving Grant to publish paper in domestic and foreign journals |
| N3 | T5. Receiving Grant to publish article in conference proceedings or journal |
| N3 | T6. Financial assistance for the purchase of scientific resources |
| N3 | T7. Financial assistance for book publishing |
| N3 | T8. Financial assistance for Master or Ph.D.’s thesis. |
| N4 | T9. Membership and participation in social networks with the aim of producing science |
| N4 | T10.Membership and participation in business networks |
| N5 | T11.Defining Knowledge-based businesses (the development of ideas, entrepreneurship) |
| N5 | T12. Defining scientific-technical activities (in the form of workshops, training courses, etc.) |
| N6 | T13. connecting with research institutions |
| N6 | T14. Facilitating communication between the elite and relevant authorities to address the academic needs of government |
| N7 | T15. News and reports associated with the Foundation programs in the future |
| N8 | T16. Student loans |
Table 6.
Central Relationship Matrix.
| T16 | 0 | 0 | 0 | 0 | 0 | 0 | 0 | 6.2 |
| T15 | 0 | 0 | 0 | 0 | 0 | 0 | 4.9 | 0 |
| T14 | 0 | 0 | 0 | 0 | 0 | 5.3 | 0 | 0 |
| T13 | 0 | 0 | 0 | 0 | 0 | 5.2 | 0 | 0 |
| T12 | 0 | 0 | 0 | 0 | 6.6 | 0 | 0 | 0 |
| T11 | 0 | 0 | 0 | 0 | 5.9 | 0 | 0 | 0 |
| T10 | 0 | 0 | 0 | 5.7 | 0 | 0 | 0 | 0 |
| T9 | 0 | 0 | 0 | 5.4 | 0 | 0 | 0 | 0 |
| T8 | 0 | 0 | 5.2 | 0 | 0 | 0 | 0 | 0 |
| T7 | 0 | 0 | 5.3 | 0 | 0 | 0 | 0 | 0 |
| T6 | 0 | 0 | 5.1 | 0 | 0 | 0 | 0 | 0 |
| T5 | 0 | 0 | 5.9 | 0 | 0 | 0 | 0 | 0 |
| T4 | 0 | 0 | 7.4 | 0 | 0 | 0 | 0 | 0 |
| T3 | 0 | 4.9 | 0 | 0 | 0 | 0 | 0 | 0 |
| T2 | 5.4 | 0 | 0 | 0 | 0 | 0 | 0 | 0 |
| T1 | 6.7 | 0 | 0 | 0 | 0 | 0 | 0 | 0 |
| N1 | N2 | N3 | N4 | N5 | N6 | N7 | N8 |
Table 7.
The Result of Grey Relational Grades x*i(k).
| T1 | T2 | T3 | T4 | T5 | T6 | T7 | T8 | T9 | T10 | T11 | T12 | T13 | T14 | T15 | T16 | |
|---|---|---|---|---|---|---|---|---|---|---|---|---|---|---|---|---|
| N1 | 1 | 0.8 | 0 | 0 | 0 | 0 | 0 | 0 | 0 | 0 | 0 | 0 | 0 | 0 | 0 | 0 |
| N2 | 0 | 0 | 1 | 0 | 0 | 0 | 0 | 0 | 0 | 0 | 0 | 0 | 0 | 0 | 0 | 0 |
| N3 | 0 | 0 | 0 | 1 | 0.8 | 0.69 | 0.72 | 0.7 | 0 | 0 | 0 | 0 | 0 | 0 | 0 | 0 |
| N4 | 0 | 0 | 0 | 0 | 0 | 0 | 0 | 0 | 0.94 | 1 | 0 | 0 | 0 | 0 | 0 | 0 |
| N5 | 0 | 0 | 0 | 0 | 0 | 0 | 0 | 0 | 0 | 0 | 0.89 | 1 | 0 | 0 | 0 | 0 |
| N6 | 0 | 0 | 0 | 0 | 0 | 0 | 0 | 0 | 0 | 0 | 0 | 0 | 0.98 | 1 | 0 | 0 |
| N7 | 0 | 0 | 0 | 0 | 0 | 0 | 0 | 0 | 0 | 0 | 0 | 0 | 0 | 0 | 1 | 0 |
| N8 | 0 | 0 | 0 | 0 | 0 | 0 | 0 | 0 | 0 | 0 | 0 | 0 | 0 | 0 | 0 | 1 |
Table 8.
The Result of Difference Series Δ0i(k).
| T1 | T2 | T3 | T4 | T5 | T6 | T7 | T8 | T9 | T10 | T11 | T12 | T13 | T14 | T15 | T16 | |
| N1 | 0 | 0.19 | 1 | 1 | 1 | 1 | 1 | 1 | 1 | 1 | 1 | 1 | 1 | 1 | 1 | 1 |
| N2 | 1 | 1 | 0 | 1 | 1 | 1 | 1 | 1 | 1 | 1 | 1 | 1 | 1 | 1 | 1 | 1 |
| N3 | 1 | 1 | 1 | 0 | 0.2 | 0.31 | 0.28 | 0.29 | 1 | 1 | 1 | 1 | 1 | 1 | 1 | 1 |
| N4 | 1 | 1 | 1 | 1 | 1 | 0 | 0 | 0 | 0.05 | 1 | 1 | 1 | 1 | 1 | 1 | 1 |
| N5 | 1 | 1 | 1 | 1 | 1 | 1 | 1 | 1 | 1 | 1 | 0.1 | 0 | 1 | 1 | 1 | 1 |
| N6 | 1 | 1 | 1 | 1 | 1 | 1 | 1 | 1 | 1 | 1 | 1 | 1 | 0.01 | 0 | 1 | 1 |
| N7 | 1 | 1 | 1 | 1 | 1 | 1 | 1 | 1 | 1 | 1 | 1 | 1 | 1 | 1 | 0 | 1 |
| N8 | 1 | 1 | 1 | 1 | 1 | 1 | 1 | 1 | 1 | 1 | 1 | 1 | 1 | 1 | 1 | 0 |
Table 9.
The Result of Grey Relational Coefficients Γ0i.
| T16 | 0.3 | 0.3 | 0.3 | 0.3 | 0.3 | 0.3 | 0.3 | 1 |
| T15 | 0.3 | 0.3 | 0.3 | 0.3 | 0.3 | 0.3 | 1 | 0.3 |
| T14 | 0.3 | 0.3 | 0.3 | 0.3 | 0.3 | 1 | 0.3 | 0.3 |
| T13 | 0.3 | 0.3 | 0.3 | 0.3 | 0.3 | 0.96 | 0.3 | 0.3 |
| T12 | 0.3 | 0.3 | 0.3 | 0.3 | 1 | 0.3 | 0.3 | 0.3 |
| T11 | 0.3 | 0.3 | 0.3 | 0.3 | 0.82 | 0.3 | 0.3 | 0.3 |
| T10 | 0.3 | 0.3 | 0.3 | 1 | 0.3 | 0.3 | 0.3 | 0.3 |
| T9 | 0.3 | 0.3 | 0.3 | 0.9 | 0.3 | 0.3 | 0.3 | 0.3 |
| T8 | 0.3 | 0.3 | 0.62 | 0.3 | 0.3 | 0.3 | 0.3 | 0.3 |
| T7 | 0.3 | 0.3 | 0.64 | 0.3 | 0.3 | 0.3 | 0.3 | 0.3 |
| T6 | 0.3 | 0.3 | 0.62 | 0.3 | 0.3 | 0.3 | 0.3 | 0.3 |
| T5 | 0.3 | 0.3 | 0.71 | 0.3 | 0.3 | 0.3 | 0.3 | 0.3 |
| T4 | 0.3 | 0.3 | 1 | 0.3 | 0.3 | 0.3 | 0.3 | 0.3 |
| T3 | 0.3 | 1 | 0.3 | 0.3 | 0.3 | 0.3 | 0.3 | 0.3 |
| T2 | 0.72 | 0.3 | 0.3 | 0.3 | 0.3 | 0.3 | 0.3 | 0.3 |
| T1 | 1 | 0.3 | 0.3 | 0.3 | 0.3 | 0.3 | 0.3 | 0.3 |
| N1 | N2 | N3 | N4 | N5 | N6 | N7 | N8 |
Table 10.
Rank of Grey Relational Coefficients.
| Techniques | T1 | T2 | T3 | T4 | T5 | T6 | T7 | T8 |
| Γ0 | 0.425 | 0.386 | 0.368 | 0.472 | 0.412 | 0.392 | 0.396 | 0.394 |
| rank | 4 | 14 | 16 | 1 | 7 | 13 | 11 | 12 |
| Techniques | T9 | T10 | T11 | T12 | T13 | T14 | T15 | T16 |
| Γ0 | 0.431 | 0.447 | 0.4 | 0.425 | 0.404 | 0.408 | 0.369 | 0.413 |
| rank | 3 | 2 | 10 | 5 | 9 | 8 | 15 | 6 |
Disclaimer/Publisher’s Note: The statements, opinions and data contained in all publications are solely those of the individual author(s) and contributor(s) and not of MDPI and/or the editor(s). MDPI and/or the editor(s) disclaim responsibility for any injury to people or property resulting from any ideas, methods, instructions or products referred to in the content. |
© 2025 by the authors. Licensee MDPI, Basel, Switzerland. This article is an open access article distributed under the terms and conditions of the Creative Commons Attribution (CC BY) license (http://creativecommons.org/licenses/by/4.0/).
Copyright: This open access article is published under a Creative Commons CC BY 4.0 license, which permit the free download, distribution, and reuse, provided that the author and preprint are cited in any reuse.


