Submitted:
18 July 2025
Posted:
18 July 2025
You are already at the latest version
Abstract
This study introduces Δr–NBT, a generalized resolution enhancement framework that upgrades all 16 bands of the Himawari-8 Advanced Himawari Imager (AHI) to 0.005° spatial resolution using physically based interpolation and thermodynamic normalization. During daytime, the method exploits the high-resolution red visible band (Band 03) to compute spatial deltas (Δr) for each visible and infrared band. These deltas are interpolated and applied to the red band at high spatial resolution to generate enhanced outputs. At night, when visible data are unavailable, enhancement is achieved through normalized brightness temperature (NBT), defined as a scaled representation of thermal infrared brightness temperature in degrees Celsius. The framework is fully deterministic and requires no cloud masking, machine learning, or parameter tuning, making it suitable for near, real, time operational use. Δr–NBT is evaluated using a major bushfire event in New South Wales, Australia (10 December 2019), and further validated during a severe urban haze episode in Hanoi, Vietnam (1 November 2024). Enhanced imagery reveals fine, scale cloud and aerosol structures that are not resolved in native, resolution products. Quantitative comparisons with conventional bicubic interpolations yield strong agreement (correlation coefficient r > 0.98, root mean square error < 0.013), confirming radiometric accuracy. Composite products, including true, color, shortwave infrared (SWIR), dust, and brightness temperature difference (BTD) indices, demonstrate improved interpretability across diverse atmospheric conditions. Δr–NBT provides a physically consistent, lightweight approach for generating high, definition geostationary satellite imagery and offers a new standard for AHI, based environmental monitoring.
Keywords:
Himawari-8
; Δr–NBT
; red band sharpening
; resolution enhancement
; geostationary satellite
; normalized brightness temperature
; multispectral imagery
; dust RGB
; aerosol monitoring
; thermal infrared
1. Introduction
High-resolution environmental monitoring inevitably trades off between spatial coverage and spatial fidelity. Ground based sensor networks typically include approximately 100 sparsely spaced air quality stations, which are often interpolated into a 10 × 10 km mesh. While this offers broad regional insight, fine, scale variability is smoothed out, obscuring the very gradients that matter for local analysis.
Figure 1 illustrates this constraint using an RGB composite from a 2° × 2° subset of Himawari-8 imagery (~400 × 400 pixels at red band resolution). The image is progressively down sampled: first to ~5 km (approximating standard aerosol optical depth products), then to a 10 × 10 grid (typical of surface observations), and finally to ~50 km (akin to CAMS reanalysis). While large-scale features remain, fine structure is fundamentally lost. No image enhancement, whether edge sharpening, interpolation, or deep learning, can restore what was never observed. This degradation is physical, not merely algorithmic.
Restoring sub-kilometer detail from coarse products requires the injection of external, spatially correlated information. While statistical upscaling may suffice for climatological means, it fails to capture fast, evolving, sub-hourly features like wildfire smoke plumes, boundary, layer transitions, or mesoscale circulations.
Geostationary satellites like Himawari-8 provide a powerful combination of rapid full, disk observation (10, minute cadence) and moderate spatial resolution (0.5–2 km) [1]. The Advanced Himawari Imager (AHI) onboard Himawari-8 captures 16 spectral bands, from the 0.64 µm red visible band at 500 m resolution to thermal infrared (IR) channels at 2 km [2]. This wide spectral range enables continuous monitoring of smoke plumes, dust transport, cloud, top cooling, and surface thermal anomalies, across both day and night. During sunlight hours, Band 3 (0.64 µm) resolves narrow filaments and gradients that become undetectable in the coarser IR imagery. This spatial imbalance means that aerosol features and convective precursors under 1–2 km in scale are easily blurred in native IR products [3].
Scaling remains a persistent challenge in the interpretation and processing of remote sensing data. Ge et al. (2019) [4] underscore the conceptual and methodological complexity inherent in translating spatial information across observational and intrinsic scales, offering formal categorization of upscaling, downscaling, and side scaling approaches. Their analysis provides a theoretical foundation for transferring spectral structure between coarse and fine resolutions without distorting physical relationships. Building on this, Markham et al. (2023) [5] present a comprehensive review of scaling methods tailored to spatial pattern analysis in landscape ecology, highlighting the influence of resolution adjustments on landscape metrics, patch richness, and heterogeneity. They emphasize the need for ecologically aware scaling procedures that preserve structural integrity during transformation. Together, these works frame the present study, which aims to implement a radiometrically restrained enhancement method that operates across multiple composite types, while maintaining coherence and transferability between regions with differing atmospheric properties and spatial texture.
Fusing high-resolution visible detail into thermal bands has shown promise. Wickramasinghe et al. [6] combined the 0.5 km red and 1 km near, IR bands with the 2 km 3.9 µm fire channel to delineate wildfire fronts at sub-kilometer scale. However, such fusion is bound to daylight hours, Band 3 is solar, dependent.
To address this, Yamazaki [7] proposed Additive Template Sharpening (ATS), a lightweight method that uses red, band deltas to enhance Bands 1–6. ATS retained radiometric integrity and outperformed variance, scaling in cloudy scenes but is still restricted to solar, reflective bands. Meanwhile, machine learning approaches like AeroCGAN [8] achieve impressive super, resolution of Himawari-8 aerosol optical depth fields but rely on large training datasets and lack physical interpretability.
To address these limitations, we present Δr–NBT, a physically grounded resolution enhancement framework that reconstructs sub-kilometer structure across all Himawari-8 AHI bands. During daylight, the method combines high-resolution spatial deltas (Δr) from the visible red band with thermally scaled brightness temperature fields (NBT) to enrich coarser bands. At night, when the red band is unavailable, the technique operates solely on NBT, ensuring continuity across the full diurnal cycle. Unlike prior approaches, Δr–NBT requires no machine learning, scene-specific tuning, or cloud masking. It preserves radiometric integrity while enhancing visual interpretability, making it well suited for operational environmental monitoring. We demonstrate its capabilities using two contrasting case studies: an intense bushfire over southeastern Australia and a severe urban haze event in Hanoi, validating performance under varied atmospheric and illumination regimes.
2. Materials and Methods
2.1. Data and Study Cases
We applied our resolution enhancement method to Himawari-8 AHI Level, 1 radiance data, obtained in standard NetCDF format. The primary demonstration focuses on 10 December 2019, covering a 2° × 2° region around 35°S, 150°E in southeastern Australia. This date falls within the peak of the 2019–2020 Australian bushfire season and features widespread smoke plumes and convective cloud development. One hour (00:00 UTC, ~10 AM local) was selected to illustrate composite image outputs, while full day processing from 00:00 to 23:50 UTC was used to generate statistical comparisons.
2.2. Preprocessing and Normalization
All 16 AHI spectral channels were reprojected from their native geostationary projection to a standard WGS 84 (EPSG:4326) latitude–longitude grid at their target resolutions. Reprojection and resampling were performed using the open, source GDAL library, ensuring consistent geo, alignment across all bands.
The Band 3 (0.64 µm), the high-resolution red band, was selected as the sharpening template. For each timestamp, Band 3 was prepared at three spatial resolutions, 0.005° (~0.5 km), 0.01° (~1 km), and 0.02° (~2 km), to match the native resolutions of other AHI bands.
Visible and near, IR bands (Bands 1, 2, 4 at 1 km; Bands 5–6 at 2 km) were treated as scaled radiances (normalized range: 0–1) as provided in the Himawari-8 Level, 1 data. All thermal infrared bands (Bands 7–16 at 2 km) were converted from brightness temperature (Kelvin) to a Normalized Brightness Temperature (NBT) form using the following transformation:
2.3. Δr–NBT Resolution Enhancement Algorithm
Figure 2 illustrates the Δr–NBT sharpening workflow. For each non, red target band m (whether visible or infrared, with IR bands represented as NBT), we first compute a difference field (δ) between that band and the red band (Band 3) after both are down sampled to a common coarse resolution. Formally, we define:
where T is the Band 3 (red) image and m is the target band image at coarse and fine resolution. The difference field, δ, captures structural variation in the target band not explained by the red band at coarse scale. This δ is then interpolated to 0.005° resolution using bicubic resampling. The final enhanced output is obtained by adding this high-resolution δ to the high-resolution red band image, effectively reconstructing spatial gradients while preserving the original coarse, scale intensity distribution.
This process is applied independently to each band (1–16), with Band 3 itself simply copied to the output. The result is a consistent enhancement across all spectral channels, driven by high spatial structure inherent in the visible red band.
This approach is conceptually similar to pan- sharpen used in high-resolution sensors like Landsat or WorldView [9], although here the “panchromatic” analog is a narrow visible channel (Band 3), and the “multispectral” suite includes thermal IR bands. Unlike traditional pan, sharpening, no spectral ratioing, weighting or regression is applied. Prior work by Yamazaki [7] supports this approach, showing that simple difference injection with optional variance normalization outperformed more complex sharpening strategies for Himawari-8.
In our implementation, we omit standard deviation normalization (used in Yamazaki’s ATS method, which scales the red band (T) by its the standard deviation [7]. Instead, we rely on inherent data scaling, NBT for thermal IR and reflectance for visible (VIS) and near-infrared (NIR), and the assumption that local spatial contrasts in the red band correlate with those in the target bands. This assumption generally holds well for clouds, thick aerosol, and convective features, which appear in both visible and IR bands (though often with reversed signals, for example, clouds appear bright in visible bands but cold in infrared). For thin aerosol or warm land surfaces where the correlation weakens, δ captures those disparities at native resolution, ensuring that the reconstructed high-resolution result faithfully preserves the radiometric structure of the target band.
2.4. Implementation and Processing
To efficiently implement the Δr–NBT procedure, we employed a combination of Climate Data Operators (CDO) for performing band arithmetic and GDAL for reprojection and resampling tasks. The process was fully automated using a Bash script, designed to loop overtime steps and spectral bands with multithreading for computational efficiency.
For each hourly scene, all 16 Himawari-8 AHI bands were first reprojected to a common latitude–longitude grid Band 3 (0.64 µm red channel) was prepared at three spatial resolutions: 0.005°, 0.01°, and 0.02°, corresponding to approximately 0.5 km, 1 km, and 2 km at the study latitude. These versions served as the reference for aligning all other bands and supporting resolution enhancement.
The algorithm then iterated over the non-red bands (Bands 1–2 and 4–16). For each band, we ensured that imagery for each band was available at both its native resolution and the 0.5 km target grid. The native resolution version was compared to the corresponding resolution of the red band to compute the δ field using pixel-wise subtraction via CDO. This δ was then resampled to a 0.5 km resolution using bicubic interpolation and added to the high-resolution Band 3 image to generate enhanced results.
Two outputs were produced per band at each time step: a baseline interpolated image created by bicubic resampling, and the sharpened Δr–NBT enhanced image. These paired outputs allowed us to directly quantify improvement while maintaining a consistent reference for comparison. All intermediate files, including reprojected inputs and interpolated deltas, were stored in NetCDF format during processing and automatically removed afterward to manage disk usage.
Thanks to scripting and parallel processing, the full 24-hour enhancement cycle over the 400×400-pixel domain, across all bands, completing in just a few minutes on a standard desktop workstation. This computational efficiency highlights the operational suitability of the Δr–NBT method for low, latency satellite analysis.
2.5. Composite Imagery and Parallel Generation
To assess the spatial and structural impact of the Δr–NBT enhancement, a suite of five RGB composite products [1,2,10,11,12] was generated for each hourly scene using both bicubic-interpolated and Δr–NBT enhanced outputs. These visual composites provide intuitive comparison metrics that highlight textural fidelity, radiometric consistency, and spatial feature continuity across key spectral domains.
Each composite was constructed by stacking three bands into a virtual raster (VRT) using gdalbuildvrt, followed by a gdal_translate to a GeoTIFF output. This process was parallelized for efficiency, with all composites built and exported concurrently across both enhancement variants. The workflow avoids serial bottlenecks, yielding significant speed-up in composite delivery and allowing high-throughput processing across daily image archives.
2.5.1. True Color RGB
Constructed using Band 3 (0.64 µm), Band 2 (0.51 µm), and Band 1 (0.47 µm), this composite emulates natural daylight reflectance, providing a familiar Earth-view perspective. Though Himawari-8 lacks a centered green band, B02 performs as a functional substitute. Vegetation appears greenish, water dark, and clouds bright white. The enhancement effect should improve edge clarity (e.g. coastlines, river traces), while maintaining radiometric consistency.
2.5.2. SWIR Composite
Designed to highlight burn scars [13], cloud phase discrimination, and vegetation mapping, the SWIR composite uses Band 6 (2.3 µm) as red, Band 5 (1.6 µm) as green, and Band 4 (0.86 µm) as blue. Vegetation appears green; hot spots (e.g. fires, urban heat) appear in red tones, while low clouds and smoke register as bluish gray. The Δr–NBT enhancement is expected to improve feature sharpness in fire fronts, boundary outlines, and thermal discontinuities without compromising shortwave infrared (SWIR) intensity fields.
2.5.3. Dust RGB
We introduced a customized Dust RGB using Band 7 (3.8 µm), Band 13 (10.4 µm), and Band 10 (7.3 µm) as red, green, and blue channels respectively. While non-standard relative to the EUMETSAT Dust RGB convention [14], this configuration was chosen to emphasize both surface thermal activity and upper atmospheric aerosol structure. Band 7 responds strongly to hot surfaces and fire sources; Band 13 serves as a midwave infrared baseline; and Band 10 lies within the water vapor absorption window, illuminating elevated plumes and cirrus features. Enhanced scenes were examined for improved continuity of elevated plumes and separation underlying thermal fields.
2.5.4. Angstrom-Like Gradient Index (ANG)
The Angstrom-Like Gradient composite [15] was constructed using Band 15 (12.4 µm), Band 11 (8.6 µm), and Band 10 (7.3 µm), arranged respectively into the red, green, and blue channels. This configuration was chosen to highlight subtle thermal contrast gradients across the longwave infrared spectrum, particularly in scenes containing dust, haze, or high-level moisture features. Band 15 provides surface and cloud-top emissivity context, Band 11 responds to mid-tropospheric structures, and Band 10 lies within the water vapor absorption zone, sensitive to elevated moisture and aerosol layers.
The resulting composite emphasizes radiative transitions across adjacent thermal channels. Warm surfaces and coarse aerosols tend to produce stronger contrasts, while finer particles and elevated haze exhibit smoother gradients. Post-enhancement imagery was examined for improved coherence in low-contrast zones and better delineation of spatial features without introducing artificial spatial texture. This diagnostic view served as an additional tool for assessing the spectral integrity and spatial sharpness afforded by the Δr–NBT enhancement across thermal gradient space.
2.5.5. The Thermal Infrared (TIR)
The Thermal Infrared (TIR) composite was generated using three channels: Band 07 (3.8 µm), Band 13 (10.4 µm), and Band 15 (12.4 µm), assigned to the red, green, and blue channels respectively. This configuration merges shortwave and longwave infrared sensitivity to capture a wide range of thermal phenomena across the scene. Band 07 is highly sensitive to high-temperature anomalies such as active fires or sunlit surfaces, providing detail on surface heat anomalies. Band 13 acts as a mid-infrared benchmark for cloud-top radiance and general surface temperature structure, while Band 15 offers longwave thermal contrast, enhancing the visibility of cooler cloud tops and upper-atmospheric moisture gradients.
Together, these channels synthesize a diagnostic thermal view that highlights multiscale radiative transitions between ground, cloud, and atmospheric layers. In scenes processed with Δr–NBT enhancement, the composite was examined for improved coherence along fire perimeters, sharper delineation of cloud deck boundaries, and the preservation of fine-scale thermal textures. This composite serves as a visual check on whether spatial sharpening augments interpretability without introducing artifacts or compromising radiometric integrity.
2.6. Qualitative and Quantitative Evaluation
To assess the spatial and spectral impact of the Δr–NBT enhancement method, we conducted side-by-side comparisons of composite imagery generated from both the bicubic-interpolated and Δr–NBT-enhanced datasets. These comparisons were structured to evaluate whether the sharpening procedure preserved radiometric fidelity while improving feature clarity and spatial coherence across multiple spectral domains.
Five composite types were constructed at each time step: True Color RGB, Shortwave Infrared (SWIR), Dust RGB, Angstrom Gradient Index (ANG), and Thermal Infrared (TIR). Each composite was formed by combining three spectral bands selected for their diagnostic utility rather than meteorological classification or aesthetic calibration. Consistent channel stacking and byte-range scaling were applied to all products, ensuring interpretability and comparability across enhancement modes. No post-processing, smoothing, or contrast adjustments were applied to the enhanced outputs.
These composites served as diagnostic frameworks for evaluating structural differentiation introduced by the enhancement algorithm. Emphasis was placed on observable changes in edge definition, plume continuity, gradient transitions, and feature sharpness. Enhancement effects were interpreted in the context of composite-specific spectral sensitivity, allowing targeted assessment of algorithm behavior across visible, shortwave, and thermal infrared regimes.
This integrated comparison framework provided both qualitative visual contrast and quantitative grounds for subsequent metric-based evaluation, where we performed basic statistical analysis for each band across the 24-hour study period. At each time step, we treated the bicubic interpolation as a baseline and compared it to the enhanced output, computing: Root Mean Square Error (RMSE); Pearson correlation coefficient (R); and Standard deviation of differences (STD).
These metrics were aggregated across bands and time steps. Although absolute validation was not possible in the absence of ground-truth sub-kilometer IR data, this analysis provided a quantitative measure of how much change the enhancement process introduced. An ideal sharpening method should maintain the large-scale thermal structure of the original image, indicated by high correlation and low RMSE, while selectively restoring fine-scale gradients. These metrics help determine whether the Δr–NBT method achieves that balance without distorting original brightness fields.
2.7. Validation and Evaluation
To evaluate the generalizability and robustness of the Δr–NBT enhancement framework, we applied the method to an independent atmospheric event on 1 November 2024 in northern Vietnam. This episode coincided with a severe smog outbreak in Hanoi, where the author was physically present during peak conditions. On that day, Hanoi’s Air Quality Index (AQI) reached 210 (“very unhealthy”), ranking as the second worst globally due to stagnant air and persistent surface-level haze [16]. The scene offered both a seasonal and structural contrast to the Australian dataset, providing an ideal test of cross-regional transferability.
Prior to finalizing the composite configurations (section 2.5), we constructed Taylor diagrams [17] using raw band reflectance and brightness temperature data across both case studies. These diagrams provided a quantitative framework for evaluating spectral consistency and structural correlation between channels. The Taylor analysis revealed that key thermal and SWIR bands formed stable groupings (or clusters) across both environments, despite differences in humidity and aerosol conditions. In particular, the Dust and TIR indices, more sensitive to moisture interference, were scrutinized for robustness. Their retained group structure across the two regions demonstrated that high-humidity regimes did not disrupt spectral coherence at the band level.
This represents a departure from both the standard EUMETSAT Dust RGB product and our own previous work based on brightness temperature differences, where it was assumed that differences between thermal infrared bands could be used to quantify aerosol type. However, as originally noted by Ackerman [18] and confirmed by our cross-regional analysis, these thermal bands lack the spectral specificity required to reliably distinguish aerosol characteristics based solely on brightness temperature differences.
This outcome informed the final RGB index selection and confirmed that the same five composite products, True Color RGB, SWIR, Dust RGB, Angstrom Gradient Index (ANG), and Thermal Infrared (TIR) could be applied across both regional studies without requiring adjustment. The composites were constructed using identical band combinations, scaling protocols, and rendering parameters. The Δr–NBT enhancement preserved spectral structure, and the validation process using Taylor diagrams provided confidence that the output remained interpretable and radiometrically sound across contrasting climatic conditions.
2.8. Availability and Code
A Bash script to process the data is available at https://github.com/MilesSowden/Himawari-HD .
All Himawari-8/9 Advanced Himawari Imager (AHI) full-disk brightness temperature data used in this study were obtained from the Bureau of Meteorology Satellite Observations Collection [19], hosted by NCI Australia [20]. The data were accessed locally via the NCI high-performance storage system at /g/data/ra22/satellite-products/arc/obs/himawari-ahi/fldk. This dataset is catalogued as part of the National Environmental Data Collection (NDP) and publicly documented at: https://opus.nci.org.au/spaces/NDP/pages/136445972/Himawari-AHI+Full+Disk+Brightness+Temperature.
This manuscript used assisted AI (Microsoft Copilot) for superficial text editing to assist with grammatical corrections and technical phrasing. All scientific content, methodology, and validation were developed and verified by the authors.
3. Results
3.1. Visual Evaluation of RGB Composites
To assess the practical benefits of the Δr–NBT enhancement, we present side-by-side composite imagery comparing the native-resolution interpolated output with the enhanced products across multiple RGB configurations. These include a natural-color RGB (Bands 1, 2, 3), a shortwave infrared composite approximating “Day Microphysics” (Bands 4, 5, 6), the EUMETSAT-style Dust RGB (Bands 11, 13, 15), and a thermal gradient index (AngIdx; Bands 13, 14, 15).. All panels are drawn from 00:00 UTC on 10 December 2019, a scene characterized by extensive bushfire smoke and convective development over southeastern Australia. This consolidated view, shown in Figure 3, offers a representative snapshot of how sharpening technique improves visual clarity and structural coherence across spectral domains. The goal is not to highlight every possible benefit but to demonstrate qualitatively where spatial enhancements restore meaningful sub-kilometer features without compromising spectral consistency or introducing artifacts.
The enhanced composites showed good internal consistency, fine smoke filaments, for instance, appeared coherently across both true color and SWIR composites, supporting the radiometric stability of the Δr–NBT enhancement. Likewise, the Dust and AngIdx products retained smooth gradients despite involving infrared difference fields, which are typically sensitive to misregistration or noise amplification. That these features remained artifact-free suggests that the method preserved spectral integrity even in composites built from multiple sharpened channels.
3.2. Quantitative Evaluation
To assess how closely the Δr–NBT-enhanced output preserves radiometric properties relative to the original imagery, we compared the enhanced result against the bicubic-interpolated baseline at 00:00 UTC for all bands. Table 1 summarizes the Root Mean Square Error (RMSE), Pearson correlation coefficient (R), and standard deviation of differences (STD) between the two versions for all Himawari-8 bands from B01 to B16.
RMSE values across the infrared bands (B07–B16) ranged from 0.0106 to 0.0173 in normalized brightness temperature units, equivalent to ~1.1 to 1.7 K differences. These are extremely small relative to the absolute temperature range of the scene and indicate minimal perturbation introduced by sharpening. Correlation values remained uniformly high, exceeding 0.98 for all thermal channels and reaching 0.996 for the visible bands. The STD values closely matched the RMSEs across all bands, suggesting the absence of any systematic bias; the method preserves the original mean brightness while injecting spatial texture.
Importantly, even channels like B15 (12.4 µm) and B05 (1.6 µm), which originate at coarser spatial resolution, showed strong agreement post-enhancement (RMSE ~0.016 and R ~0.984), further confirming that the sharpening process maintains physical consistency across spectral domains.
These findings reinforce that Δr–NBT enhances spatial structure without distorting large-scale thermal or radiometric patterns, critical for operational reliability in downstream applications.
3.3. Taylor Diagram Analysis
To examine the structural behavior of individual spectral channels following enhancement, we generated Taylor diagrams comparing Δr–NBT-enhanced outputs to bicubic-interpolated baselines at 10:00 local time for both the Australian (10 December 2019) and Vietnamese (1 November 2024) events. Each point represents a Himawari-8 band and is positioned according to its Pearson correlation coefficient (R), normalized standard deviation (σ/σ_max), and centered root mean square (RMS) difference. The diagrams are shown in Figure 4, with panel (a) for New South Wales and panel (b) for Hanoi.
Despite atmospheric and environmental differences between the two scenes, several consistent spectral clusters emerged. A visible cluster (B01, B02) exhibited the lowest normalized standard deviation, reflecting their limited response to enhancement and their strong dependence on solar geometry and surface albedo. A near infrared and shortwave infrared cluster (B04, B05, B06) formed a coherent group with moderate enhancement response and strong spatial coherence, particularly in the Australian case. These bands are sensitive to vegetation, cloud phase, and surface composition. A water vapor cluster (B08, B09, B10) remained intact across regions and times, despite reduced correlation values. This persistence indicates consistent scene behavior among moisture-sensitive mid-IR channels. Their reduced correlation reflects strong absorption variability between humid and dry regimes, emphasizing the contrast between reflectance and absorption characteristics of water vapor. A thermal infrared cluster (B11, B13, B14, B15) demonstrated stable cohesion across both regions and time frames. These channels underpin the TIR and ANG composites, and observed differences are likely attributable to variations in Angstrom coefficients, reflecting changes in aerosol particle size. Finally, an intermediate emissive cluster (B07, B12, B16) appeared loosely grouped and is interpreted as reflecting mixed sensitivity to surface heating and elevated aerosol content.
Differences were observed in individual band placements between regions, particularly within the water vapor and shortwave infrared domains; however, inter-band relationships within each cluster remained structurally stable. This cross-regional persistence directly informed the design of composite band groupings. These findings diverge from assumptions embedded in legacy products such as the EUMETSAT Dust RGB, which relies on fixed thermal brightness temperature differences (BTD) to infer aerosol types. Notably, such BTD-based reasoning was previously adopted in our own earlier work [21], where it was assumed that differential responses between thermal infrared channels could offer meaningful aerosol discrimination. However, as originally argued by Ackerman (1997) and now corroborated through Taylor diagram analysis across two distinct climatic regimes, thermal IR channels lack the spectral specificity required to reliably resolve aerosol type in high-humidity environments like northern Vietnam. In contrast, the cluster-informed grouping presented here provides a data-driven framework for composite index selection, grounded in spectral structure and resilient to regional moisture variability.
3.4. Validation on Hanoi Smog Event
As a secondary test case, we applied the Δr–NBT enhancement method to a dense haze event over northern Vietnam centered on 1 November 2024, characterized by widespread morning smog in Hanoi. Using the same sharpening parameters as applied to the Australian dataset, we processed 24 hours of Himawari-AHI full-disk imagery beginning at 20:00 UTC on 30 October (03:00 local time), covering the full diurnal cycle across a structurally uniform near-surface aerosol layer.
According to surface observations and local reports, visibility dropped below 100 m between 07:00 and 10:00 local time with a marginal improvement in visibility through the rest of the day, coinciding with strong nocturnal inversion and peak haze retention. In contrast to the Australian plume scenarios, which emphasized filamentary structure, convective boundaries, and thermal discontinuities, this test offered a valuable counterpoint: a low-contrast, optically thick environment dominated by particulate suspension rather than radiative structure.
A composite panel from this period is presented in Figure 5, comparing Δr–NBT-enhanced outputs (left column) with natural-color interpolated imagery across a four-hour window from 08:00 to 12:00 UTC (right column). The enhanced column displays all five RGB indices, True Color, SWIR, TIR, Dust, and Angstrom Gradient (from top to bottom). Despite application of spatial sharpening, no discrete structures emerge across the enhanced views, and low spectral contrast remains consistent throughout. This supports the interpretation that physical features were genuinely obscured during acquisition and not artificially degraded by interpolation.
The right column provides a temporal progression of interpolated true color scenes, capturing steady deterioration in visibility as surface haze intensified. Terrain features and cloud edges become increasingly indistinct over time, in agreement with AQI values and subjective assessment. Together, the panel illustrates both the limitations of radiometric enhancement under extreme aerosol load and the utility of Δr–NBT as a stable, nonintrusive method in low-information scenes.
These results demonstrate that the Δr–NBT framework does not generate structure where none exists. The method reliably preserves radiometric neutrality in homogeneous environments and highlights genuine thermal or visual gradients only where underlying contrast supports their emergence. This restraint is a critical property for operational usage in polluted or fog-prone regions where diagnostic false positives must be avoided.
4. Discussion
The Δr–NBT enhancement framework demonstrated consistent performance across a range of spectral composites and atmospheric conditions, offering both spatial refinement and radiometric stability. The ability of the method to retain coherence across five distinct composite types, True Color, SWIR, TIR, Dust, and ANG, suggests that sharpening can be applied uniformly without compromising diagnostic integrity. Importantly, this result was observed across two meteorologically and spectrally divergent case studies: a high-contrast, fire-driven plume environment in southeastern Australia and a low-contrast, haze-dominated pollution event in northern Vietnam.
The clustering behavior in the Taylor diagrams supports the spectral grouping used in the RGB indices and confirms that enhancement acts primarily on spatial gradients rather than altering relative band structure. Despite regional differences in humidity, surface reflectance, and aerosol optical properties, key clusters, such as the thermal infrared group (B11, B13–B15) and the SWIR group (B04–B06), retained internal consistency. This challenges conventional assumptions embedded in products such as the EUMETSAT Dust RGB, where brightness temperature differences are used to infer aerosol type. Our results, in line with Ackerman’s earlier conclusions, demonstrate that differences between thermal IR bands do not contain sufficient spectral detail to discriminate aerosol composition reliably, particularly in high-moisture regimes.
The contrasting outcomes in the Vietnam case also highlight a key strength of the Δr–NBT method: its restraint. Enhancement does not manufacture structures where there is none. In extreme haze conditions with true low information content, the method preserved scene neutrality, producing clean and interpretable imagery free from false visual cues. This property is critical in operational workflows, where artifact-free products are essential for decision-making under uncertainty.
Together, the results support the working hypothesis that radiometric sharpening, if applied with spectral awareness and compositional consistency, can serve as a general-purpose enhancement layer across diverse environmental conditions. The method is computationally efficient, parallelizable, and compatible with existing RGB composite workflows, which broadens its applicability in remote sensing, environmental monitoring, and emergency response.
Future research should explore the method’s extension to layered compositions (e.g., hybrid cloud-masking or aerosol retrieval indices), assess its performance under extreme solar zenith or off-nadir conditions, and evaluate integration with machine learning post-classification. Additional case studies from tropical cyclone development, urban heat islands, and volcanic ash events would further test generalizability. A comparative benchmark against deep-learning super-resolution methods could also help clarify the balance between interpretability, radiometric trust, and aesthetic enhancement.
5. Conclusions
This study demonstrated the utility and resilience of the Δr–NBT enhancement technique across disparate atmospheric regimes and spectral composite types. By validating performance over both high-contrast (Australian wildfire) and low-contrast (Vietnamese haze) environments, we showed that the method reliably sharpens spatial structure while preserving radiometric fidelity. Taylor diagram analysis confirmed the spectral coherence of band groupings underpinning each composite, enabling cross-regional transferability without the need for site-specific tuning.
The method’s ability to preserve neutrality in optically thick conditions, while enhancing subtle gradients in structured scenes, highlights its potential as a stable and interpretable preprocessing step for geostationary satellite imagery. The findings advocate for composite designs grounded in spectral analysis rather than prescribed band differences, particularly in humid or aerosol-laden conditions where standard RGB indices may fail.
Future applications may involve integration into real-time monitoring pipelines, or adaptation to aerosol retrieval and cloud phase classification tasks. The Δr–NBT approach offers a generalizable, low-overhead enhancement strategy compatible with diverse environmental remote sensing workflows.
Supplementary Materials
Supporting information is available at https://github.com/MilesSowden/Himawari-HD and this includes the code and high-resolution output files
Author Contributions
M.S the sole author, was responsible entirely for the article, methodology, software, and investigation including writing of the article and agrees to the published version of the manuscript.”
Funding
This research received no funding and was conducted independently of all funding or affiliation by the author.
Data Availability Statement
Restrictions apply to the availability of Himawari data. The data supporting the findings of this study are available on the Australian National Computing Infrastructure servers to authorized users. The GitHub repository (https://github.com/MilesSowden/Himawari-HD ) provides the high-resolution image outputs.
Acknowledgments
This research was undertaken with the use of the National Computational Infrastructure (NCI Australia). NCI Australia is enabled by the National Collaborative Research Infrastructure Strategy (NCRIS). We would like to express our sincere gratitude to NCI Australia and the Bureau of Meteorology (BOM) for granting access to the Himawari dataset used in this work. Their support and provision of high-quality data have been instrumental to our research.
Conflicts of Interest
Author Miles Sowden was employed by the company Sigma Theta. The Author declares that the research was conducted in the absence of any commercial or financial relationships that could be construed as a potential conflict of interest
Abbreviations
The following abbreviations are used in this manuscript:
| AOD | Aerosol Optical Depth |
| ANG | Angstrom-Like Gradient Index |
| ATS | Additive Template Sharpening |
| BTD | Brightness Temperature Difference |
| CAMS | Copernicus Atmosphere Monitoring Service |
| CDO | Climate Data Operators |
| EPSG | European Petroleum Survey Group (coordinate reference system) |
| GWR | Geographically Weighted Regression |
| GLC | Ground-Level Concentration |
| IR | Infrared |
| LUR | Land Use Regression |
| NBT | Normalized Brightness Temperature |
| RGB | Red-Green-Blue (composite imagery) |
| RMSE | Root Mean Square Error |
| STD | Standard Deviation |
| SWIR | Shortwave Infrared |
| TIR | Thermal Infrared |
| VRT | Virtual Raster (GDAL format) |
References
- JMA. Himawari-8: JMA's Next Generation Geostationary Meteorological Satellite. 2015; Available from: http://www.icao.int/APAC/Meetings/2015%20METATMSeminar/SP11_JPN%20-%20Himawari-8_JMA’s%20Next-Generation%20Geostationary%20Meteorological%20Satellite.pdf.
- Akihiro, S. , Introduction to Himawari-8 RGB composite imagery Meteorological Satellite Center Technical Note, 2020(65) DOI: https://www.data.jma.go.jp/mscweb/technotes/msctechrep65- 1.pdf#:~:text=The%20BTDB13,B1%204.
- Miller, S.D. , et al., GeoColor: A Blending Technique for Satellite Imagery. AMS, 2020. 10(1175): p. 429-448. [CrossRef]
- Ge, Y. , et al., Principles and methods of scaling geospatial Earth science data. Earth-Science Reviews, 2019. 197: p. 102897. [CrossRef]
- Markham, K. , et al., A review of methods for scaling remotely sensed data for spatial pattern analysis. Landscape Ecology, 2023. 38(3): p. 619-635. [CrossRef]
- Wickramasinghe, C.H. , et al., Development of a Multi-Spatial Resolution Approach to the Surveillance of Active Fire Lines Using Himawari-8. Remote Sensing, 2016. 8(11): p. 13. [CrossRef]
- Yamazaki, K. , Image Sharpening Method Suitable for Himawari-8 Images. Sola, 2021. 17(0): p. 224-227. [CrossRef]
- Zhang, L. , et al. Improved 1-km-Resolution Hourly Estimates of Aerosol Optical Depth Using Conditional Generative Adversarial Networks, 2021; 13. [Google Scholar] [CrossRef]
- Li, H., L. Jing, and Y. Tang, Assessment of Pansharpening Methods Applied to WorldView-2 Imagery Fusion. Sensors (Basel), 2017. 17(1). [CrossRef]
- Shang, H. , et al., Diurnal haze variations over the North China plain using measurements from Himawari-8/AHI. Atmospheric Environment, 2019. 210: p. 100-109. [CrossRef]
- She, L. , et al., Dust Detection and Intensity Estimation Using Himawari-8/AHI Observation. Remote Sensing, 2018. 10(4): p. 490. [CrossRef]
- Schmit, T.J. , et al., Applications of the 16 spectral bands on the Advanced Baseline Imager (ABI). Journal of Operational Meteorology, 2018. 06(04): p. 33-46. [CrossRef]
- Roy, D.P. , et al., Multi-temporal active-fire based burn scar detection algorithm. International Journal of Remote Sensing, 1999. 20(5): p. 1031-1038. [CrossRef]
- Liu, Y., R. Liu, and X. Cheng, Dust detection over desert surfaces with thermal infrared bands using dynamic reference brightness temperature differences. Journal of Geophysical Research: Atmospheres, 2013. 118(15): p. 8566-8584. [CrossRef]
- Schuster, G.L., O. Dubovik, and B.N. Holben, Angstrom exponent and bimodal aerosol size distributions. Journal of Geophysical Research-Atmospheres, 2006. 111(D7). [CrossRef]
- Chinh, G. , Hanoi’s air quality ranked second-worst globally by IQAir on Friday. 1 November 2024. [Google Scholar]
- Taylor, K.E. , Summarizing multiple aspects of model performance in a single diagram. Journal of Geophysical Research: Atmospheres, 2001. 106(D7): p. 7183-7192.
- Ackerman, S.A. , Remote sensing aerosols using satellite infrared observations. Journal of Geophysical Research-Atmospheres, 1997. 102(D14): p. 17069-17079. [CrossRef]
- Bureau Of Meteorology (BOM). Bureau of Meteorology Satellite Observations (Collection). NCI Australia. Himawari-AHI. [CrossRef]
- NCI Australia (NCI). Gadi Supercomputer, NCI Australia. (Service). [CrossRef]
- Sowden, M. and D. 11 7620. [CrossRef]
Figure 1.
: Effect of downscaling an image (left to right) (a) Original RGB 400x400 pixel image, (b) Downscaled by 1/10th i.e. about 5km resolution, (c) 1/40th equivalent to a 10x10 pixel “sampling” grid, (d) Downscaled by 1/100th i.e. about 50km resolution equivalent to CAMS Reanalysis resolution.
Figure 1.
: Effect of downscaling an image (left to right) (a) Original RGB 400x400 pixel image, (b) Downscaled by 1/10th i.e. about 5km resolution, (c) 1/40th equivalent to a 10x10 pixel “sampling” grid, (d) Downscaled by 1/100th i.e. about 50km resolution equivalent to CAMS Reanalysis resolution.
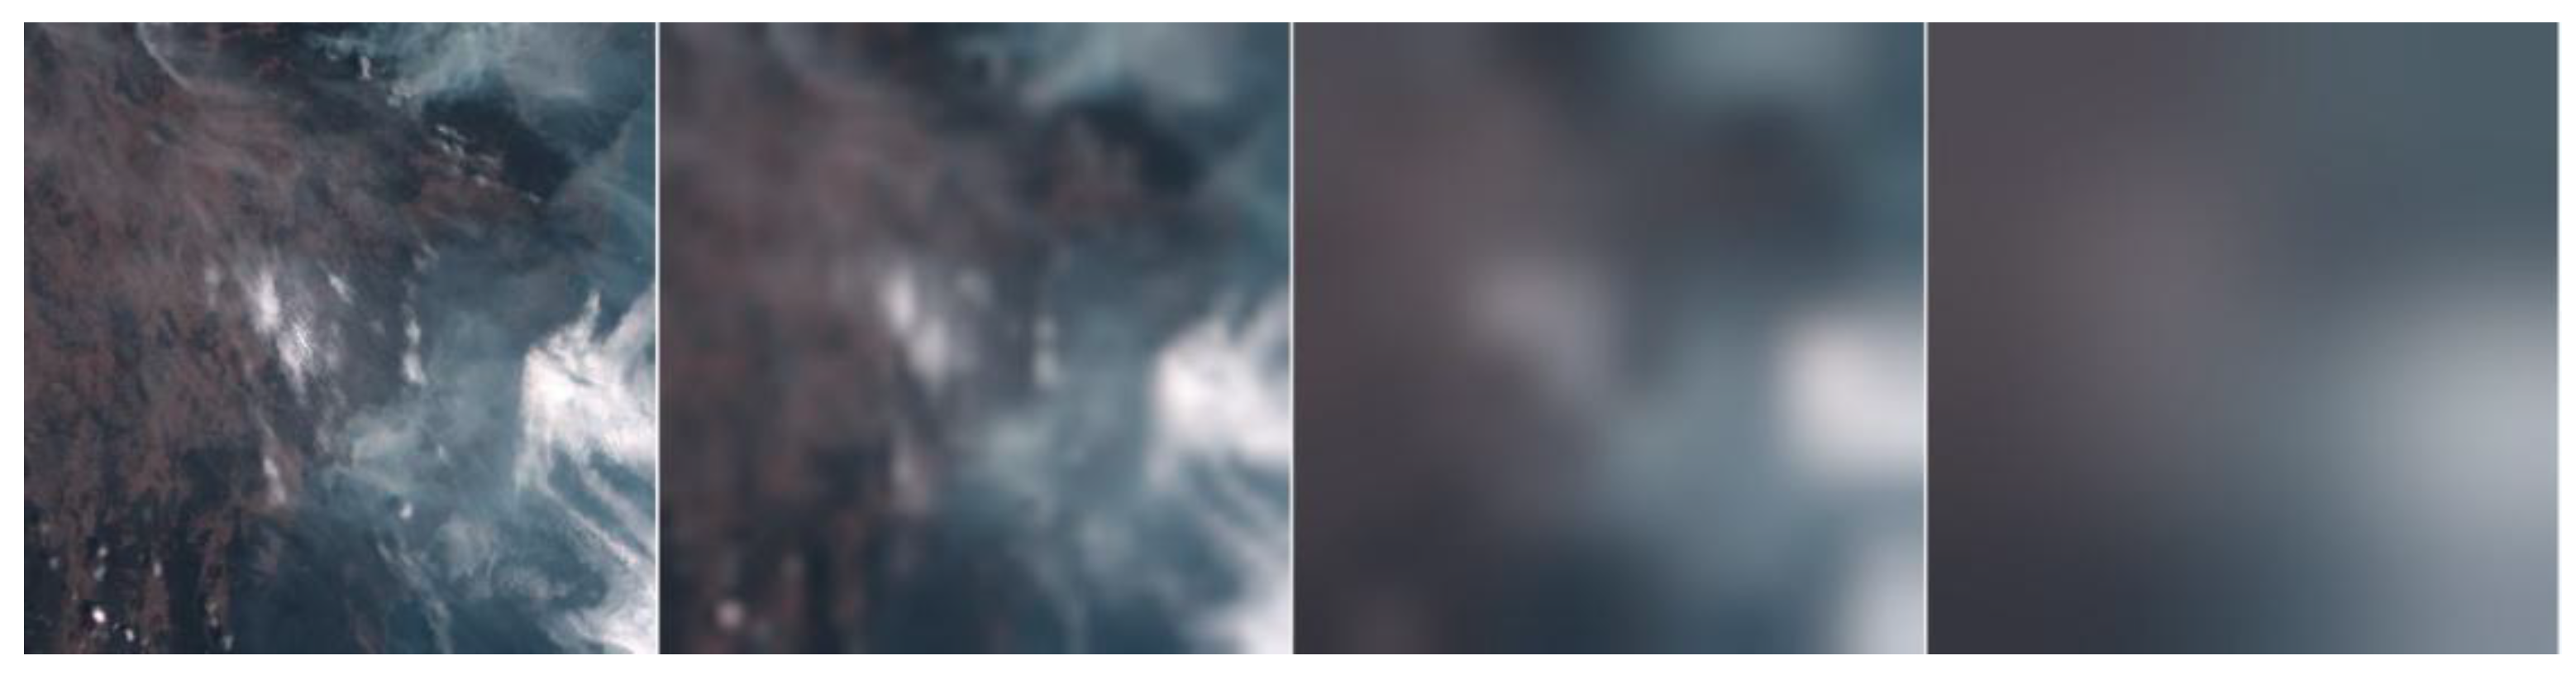
Figure 2.
Schematic of the resolution enhancement method. Thermal infrared bands are converted to degrees Celsius and normalized by dividing by 100. For each band, the red band and the target band are downscaled to 1 or 2 km resolution to compute δ. This difference field is then bicubically interpolated to 0.5 km and added to the high-resolution red band to synthesize sharpened imagery. This process injects high spatial structure into coarser bands while preserving their native radiometric signature.
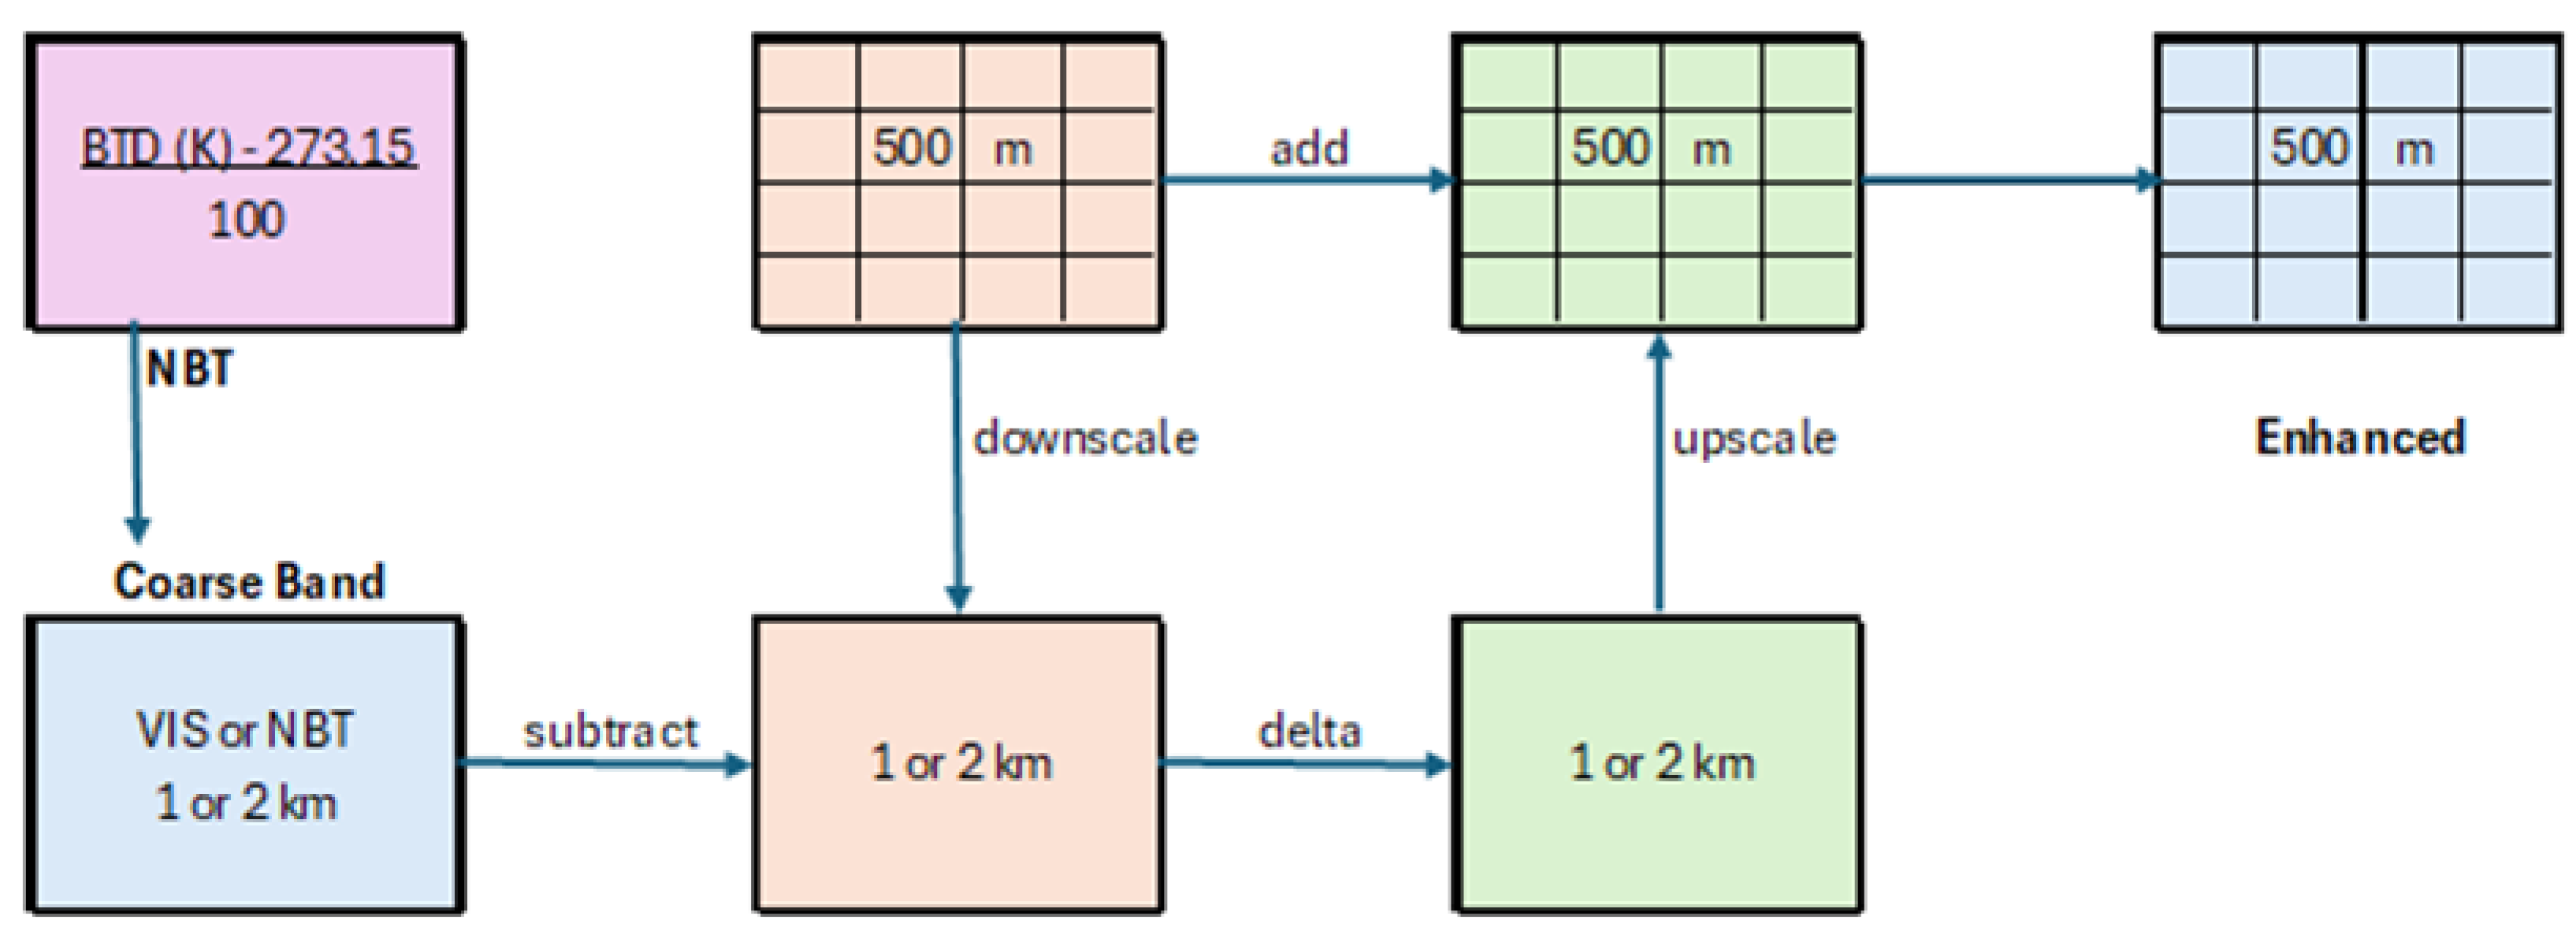
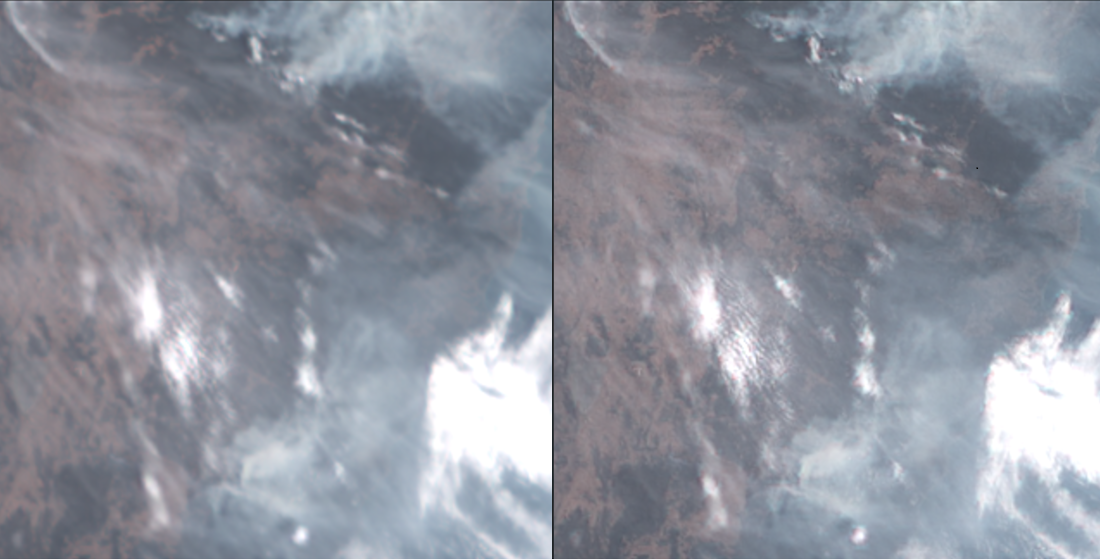
Figure 3.
Comparison of composite imagery before and after Δr–NBT enhancement at 00:00 UTC on 10 December 2019 over southeastern Australia. Left column: bicubic-interpolated baseline. Right column: Δr–NBT-enhanced output. Top row: natural-color RGB using Bands 3 (red), 2 (green), and 1 (blue). Second row: shortwave infrared (SWIR) composite using Bands 6 (red), 5 (green), and 4 (blue). Third row: thermal infrared (TIR) composite using Bands 7 (red), 13 (green), and 15 (blue), highlighting heat sources and upper-level cloud structure. Fourth row: Dust RGB using Bands 7 (red), 13 (green), and 10 (blue), showing elevated aerosol layers and moisture contrast. Bottom row: Angstrom Gradient Index (ANG) composite using Bands 15 (red), 11 (green), and 10 (blue), emphasizing spectral gradients and aerosol size differentiation. Enhanced panels show improved spatial definition, particularly along smoke filaments, cloud deck boundaries, and thermal gradients, while preserving radiometric consistency across spectral regimes.
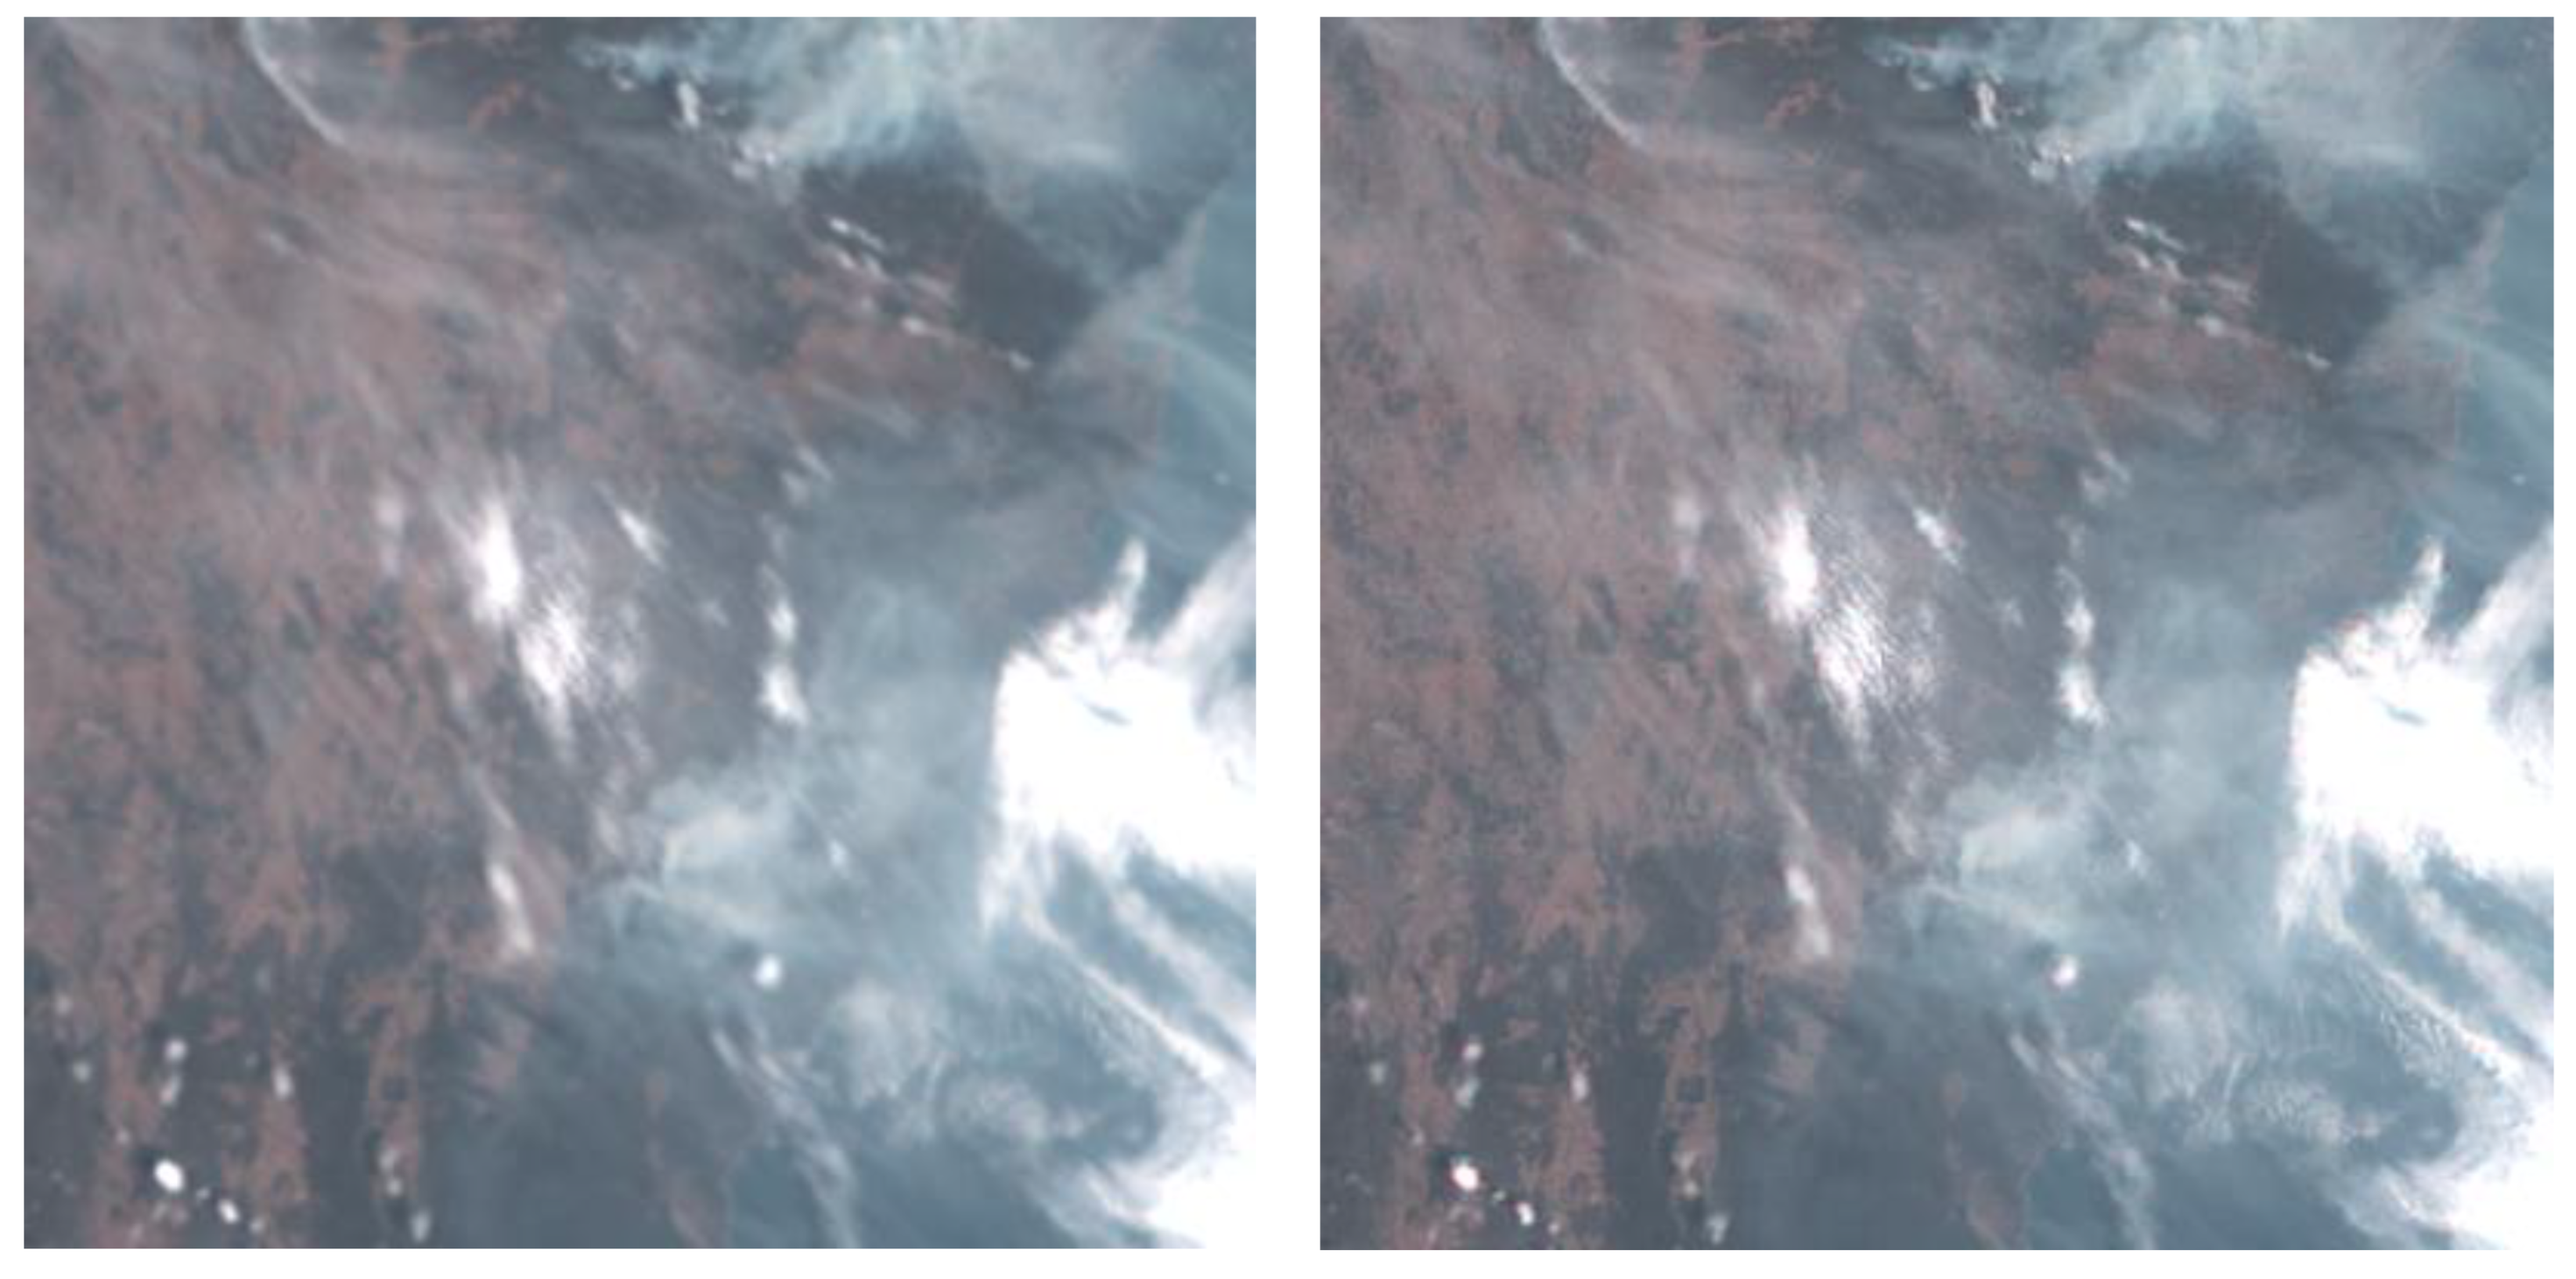
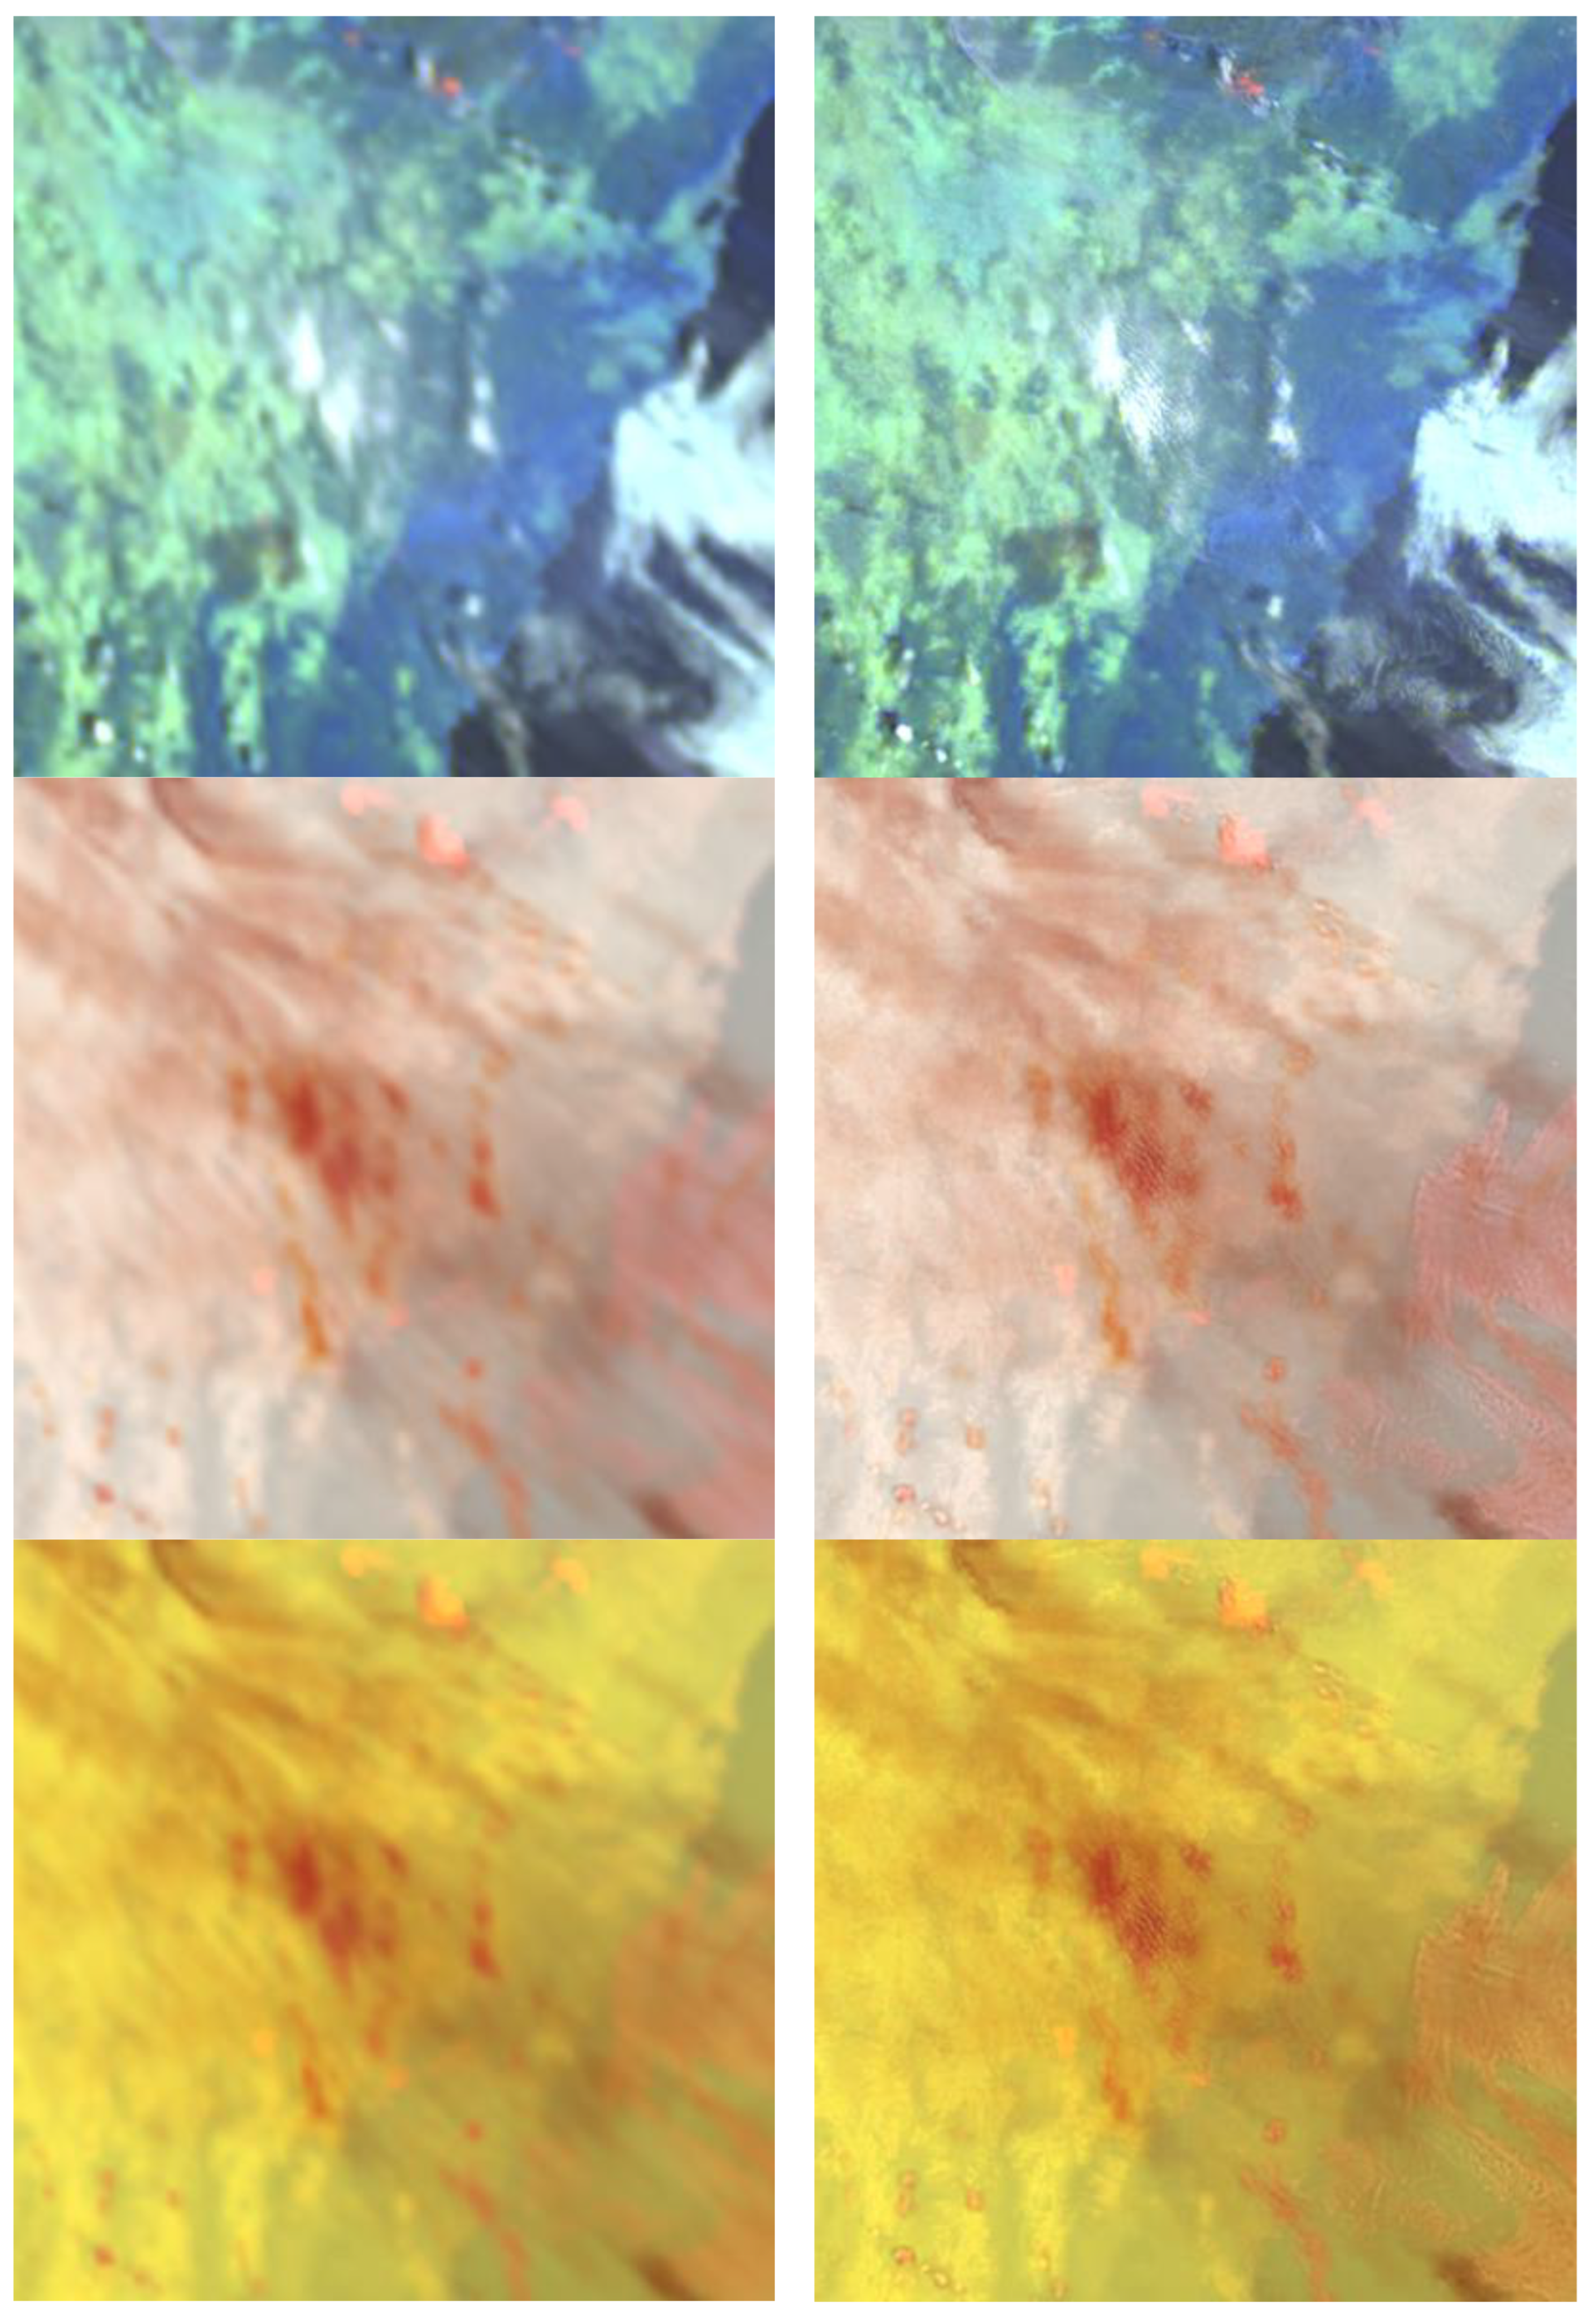
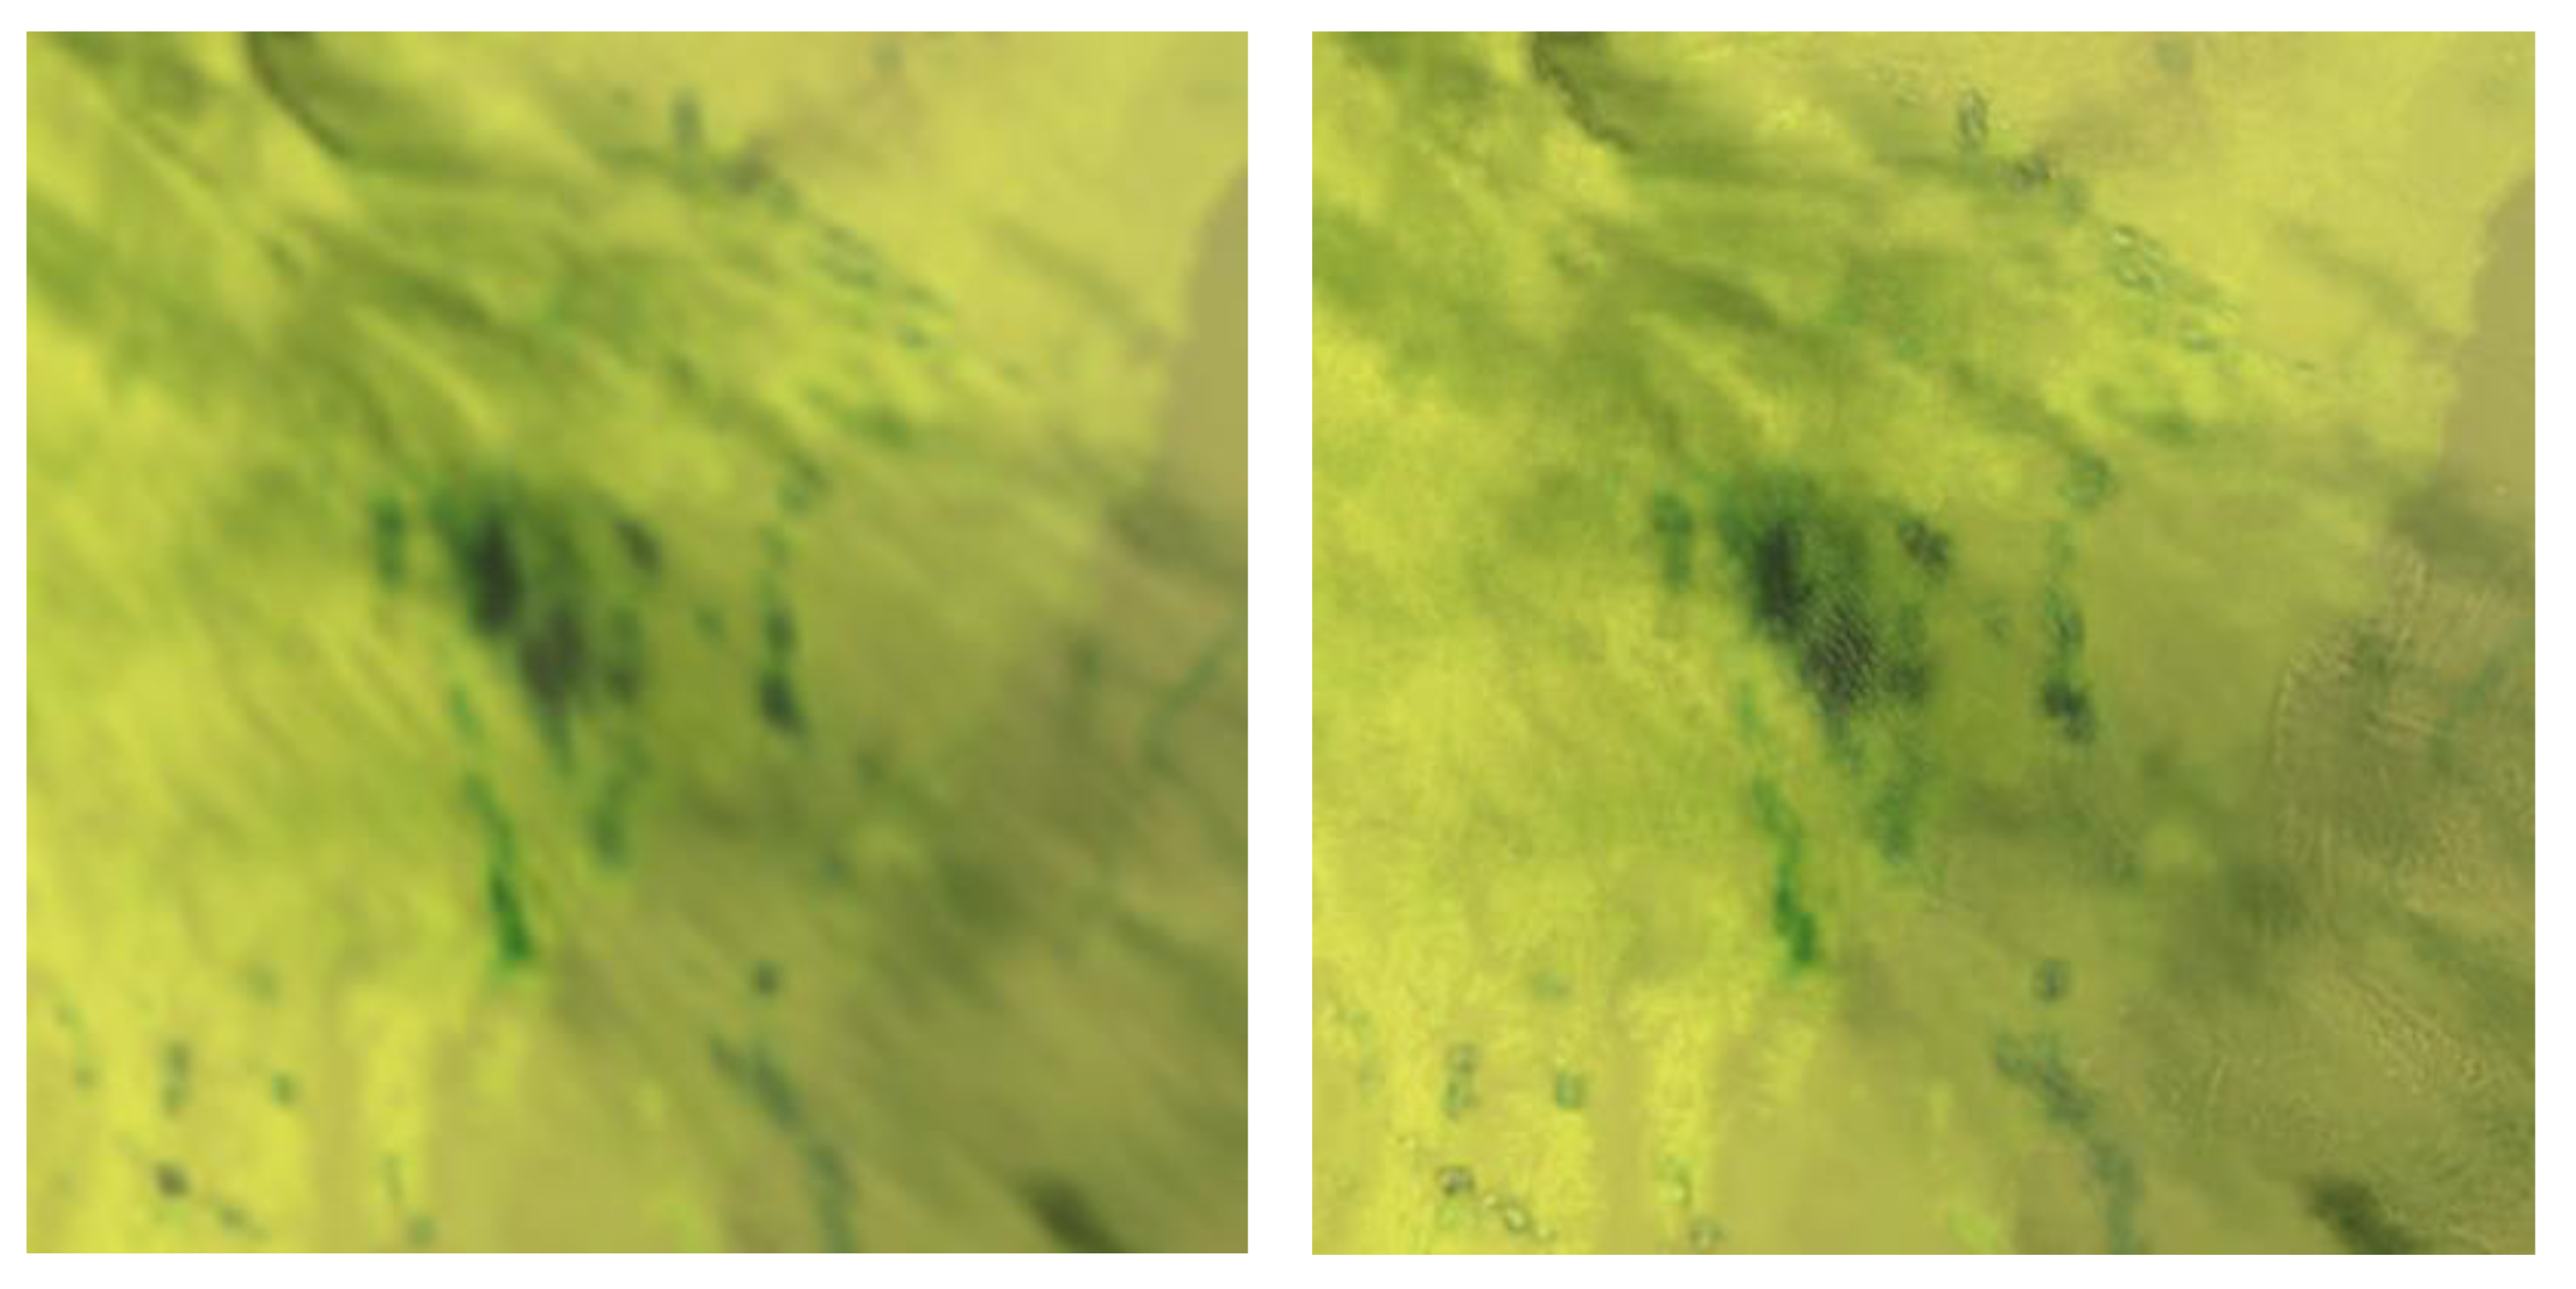
Figure 4.
Taylor diagrams (a) NSW 10 Dec 2019 and (b) Vietnam 1 November 2024, comparing Δr–NBT-enhanced images to interpolated baselines across all Himawari-8 bands at 10 AM local time. Each point represents one spectral channel, positioned by the squared correlation coefficient (R²), normalized standard deviation (with 1.0 as maximum variance across bands), and centered root mean square (RMS) difference. The plot illustrates high correlation in the Australian study but not the Vietnamese study and spectral coherence of the clustering across bands.
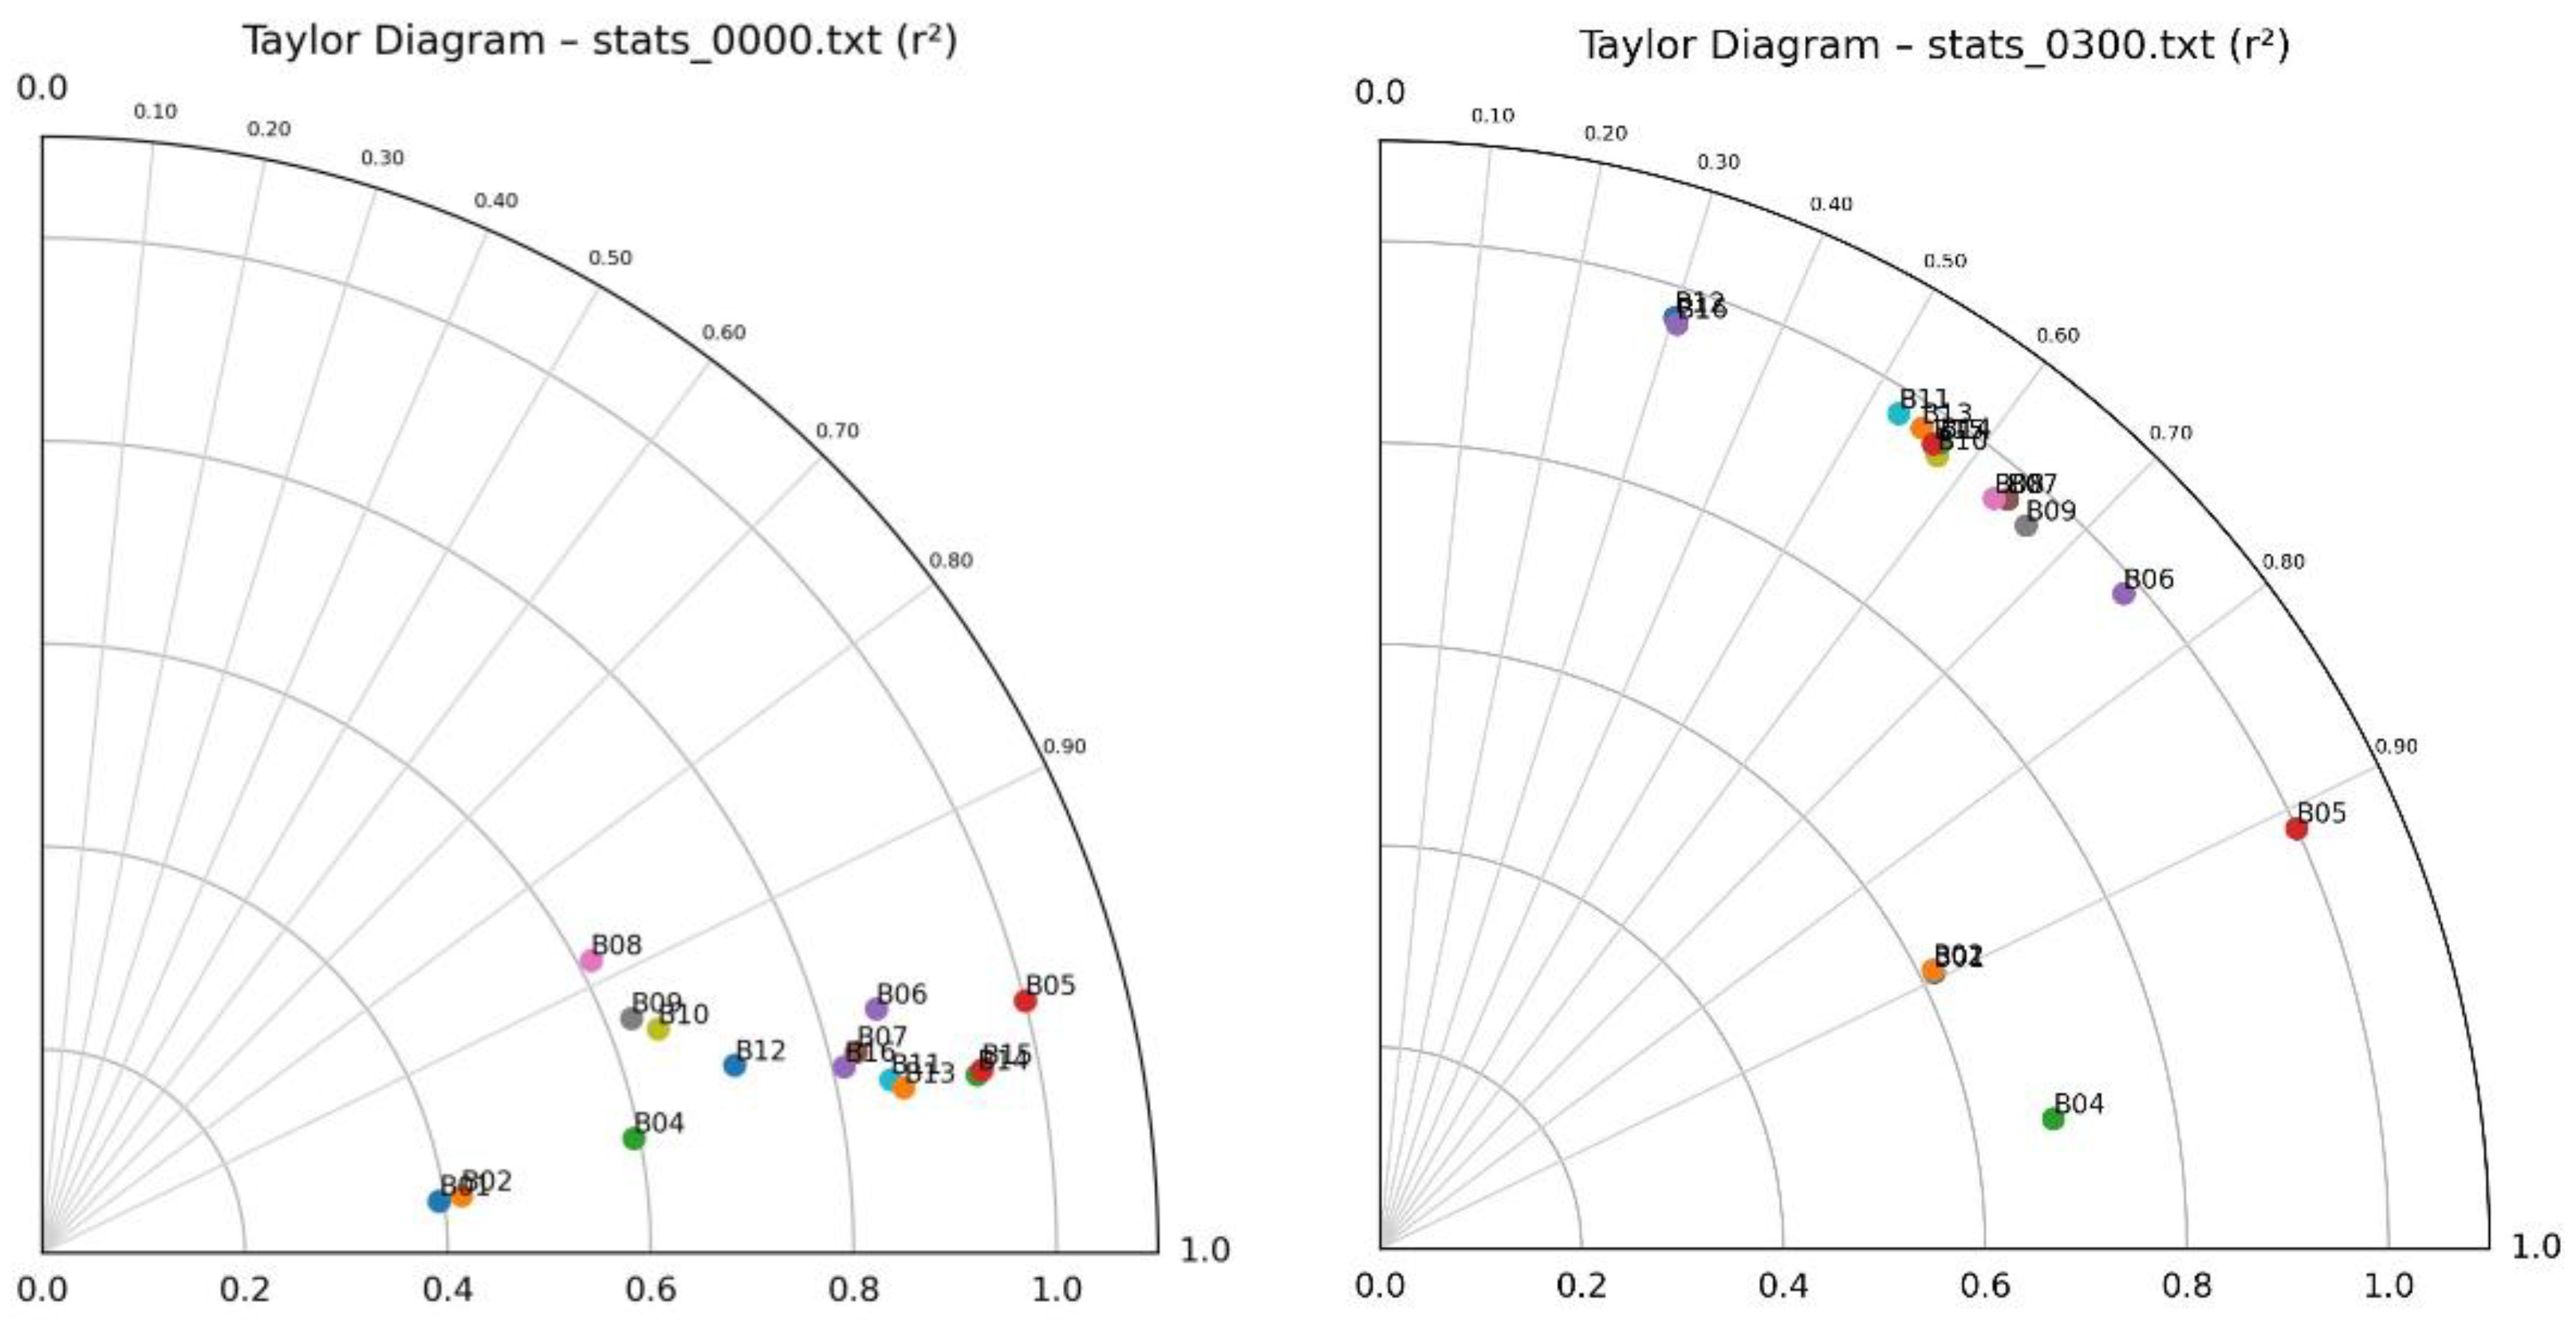
Figure 5.
Composite imagery over northern Vietnam on 1 November 2024, comparing Δr–NBT-enhanced outputs (left column) with time-progression snapshots from 08:00 to 11:00 local time (right column). Left column: enhanced images using four RGB indices, True Color, SWIR, TIR, and Dust (top to bottom). Despite sharpening, structural features remain largely absent across all indices, consistent with dense surface haze and weak spectral contrast. Right column: interpolated natural-color composite progressing hourly from 08:00 to 12:00 UTC. Visibility steadily deteriorates over time, with aerosol buildup and loss of terrain definition indicative of worsening pollution and stagnant atmospheric conditions.
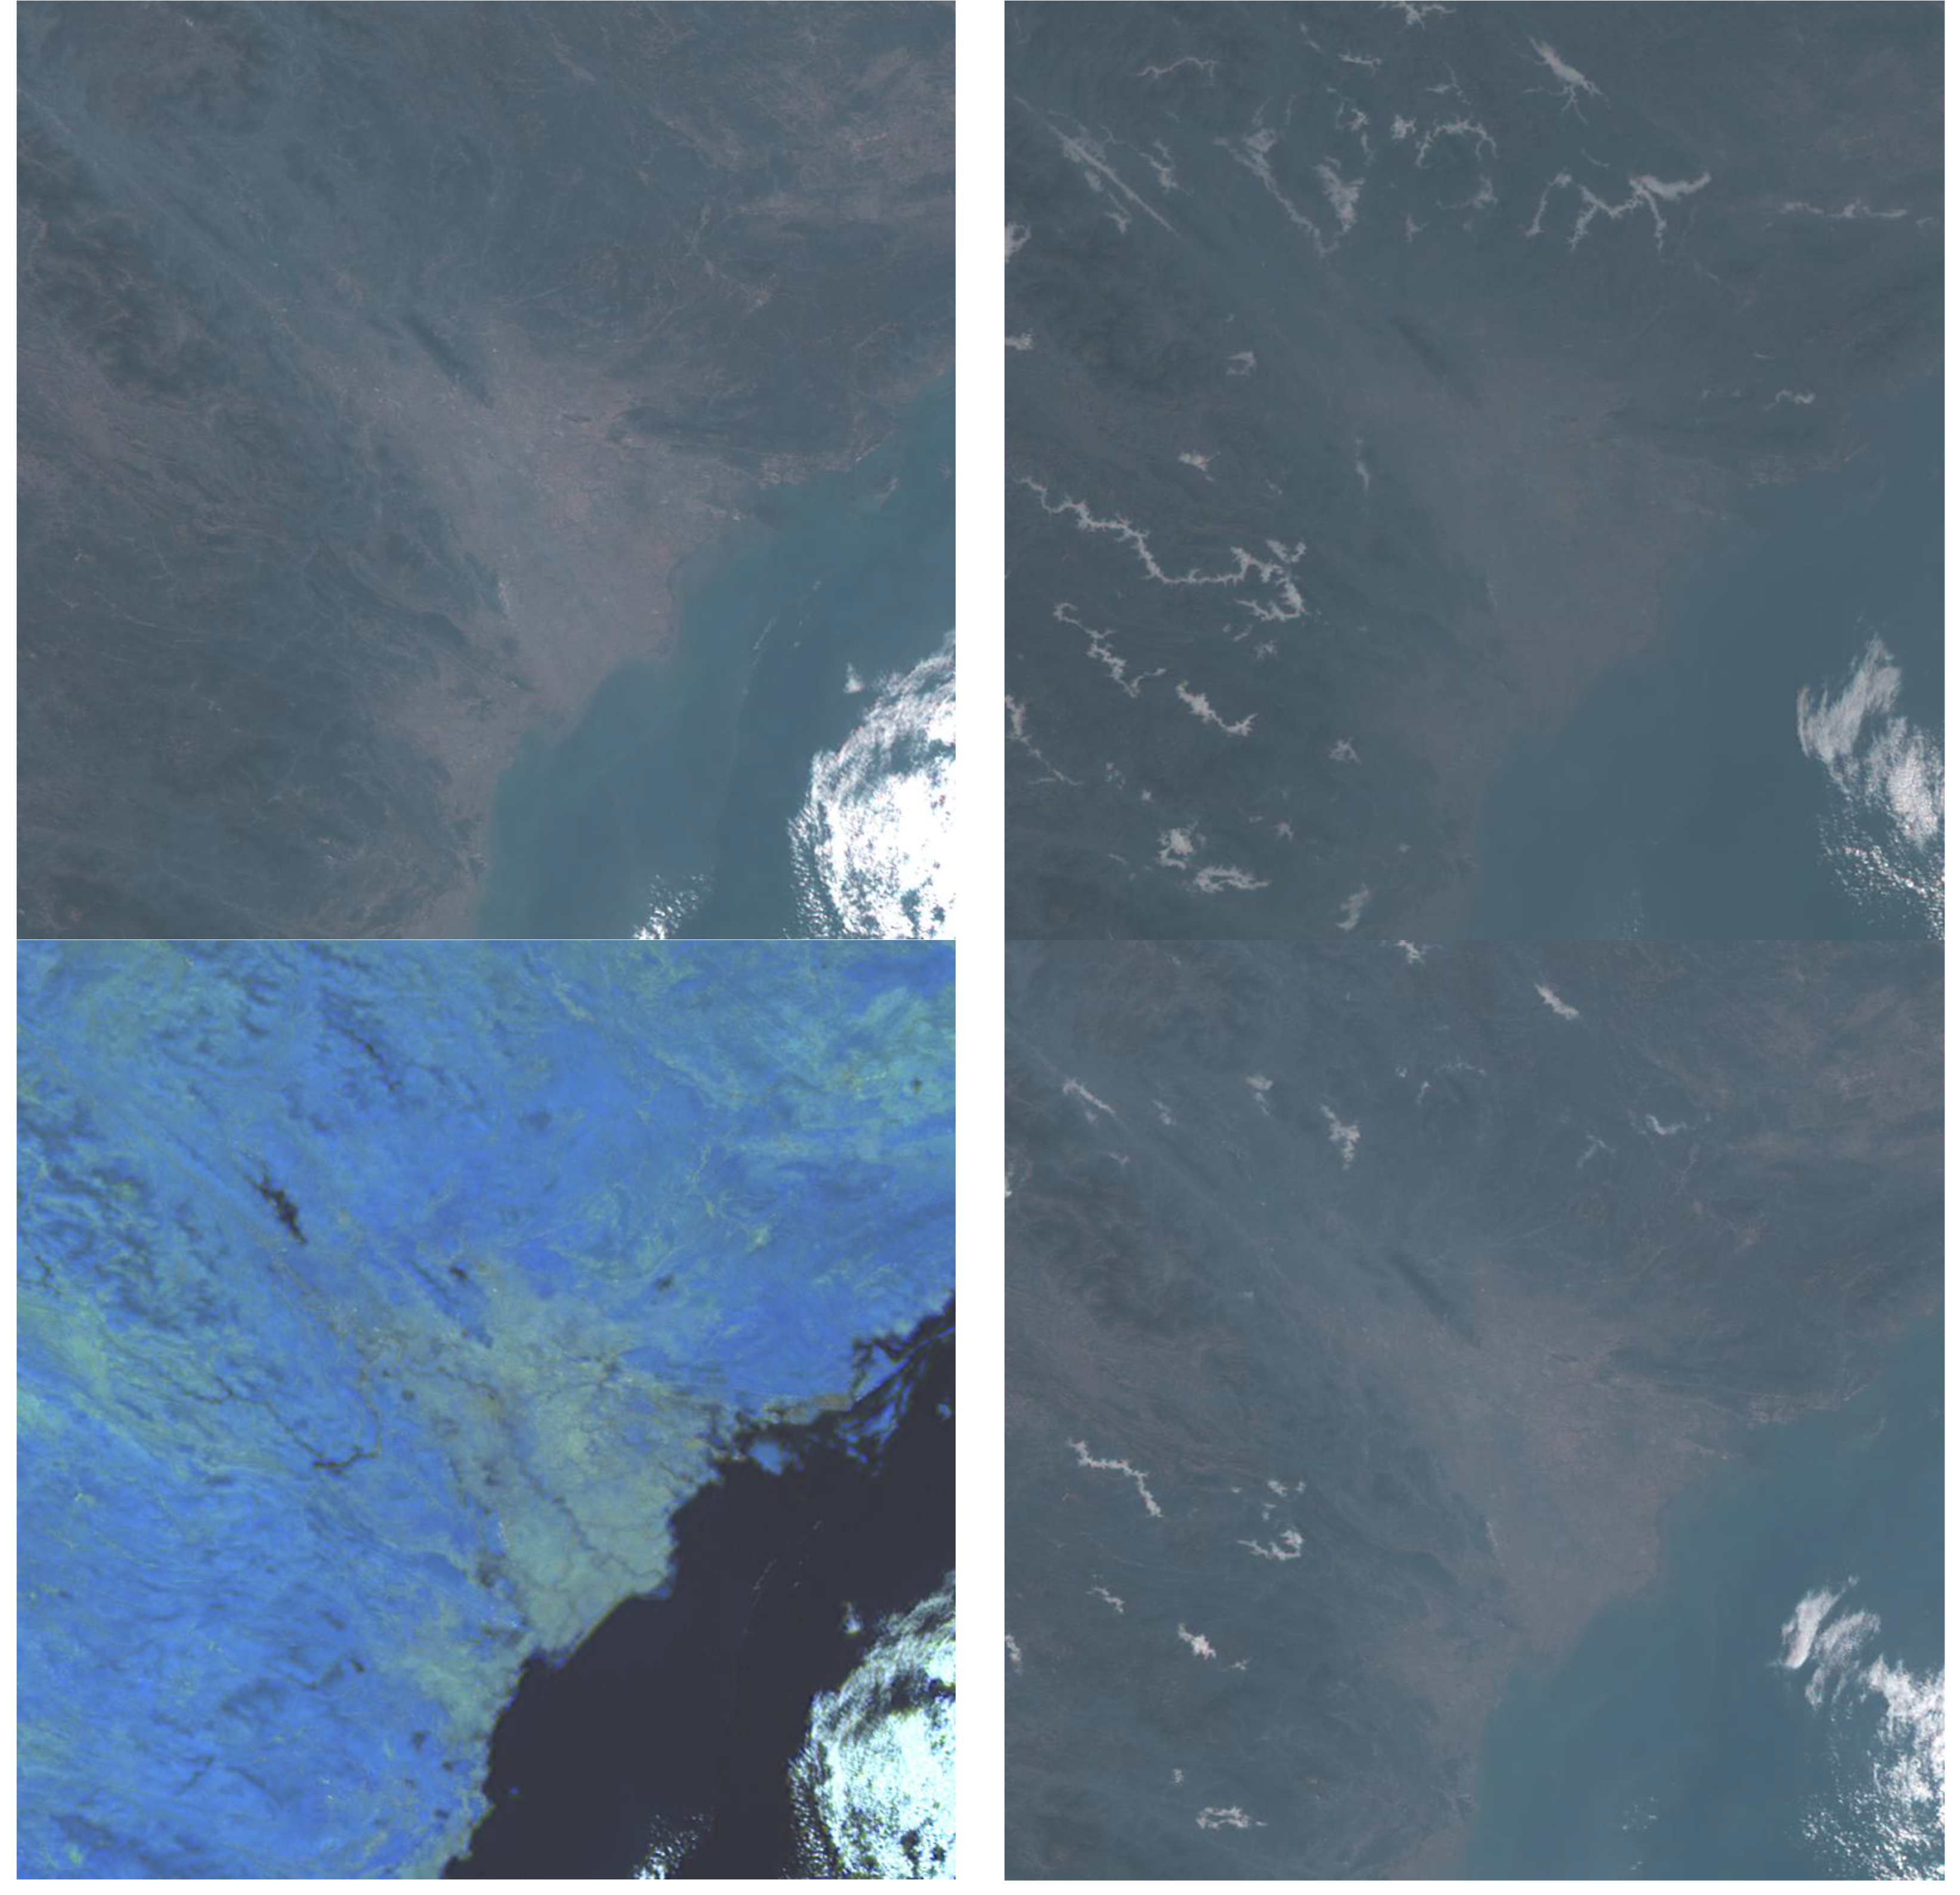
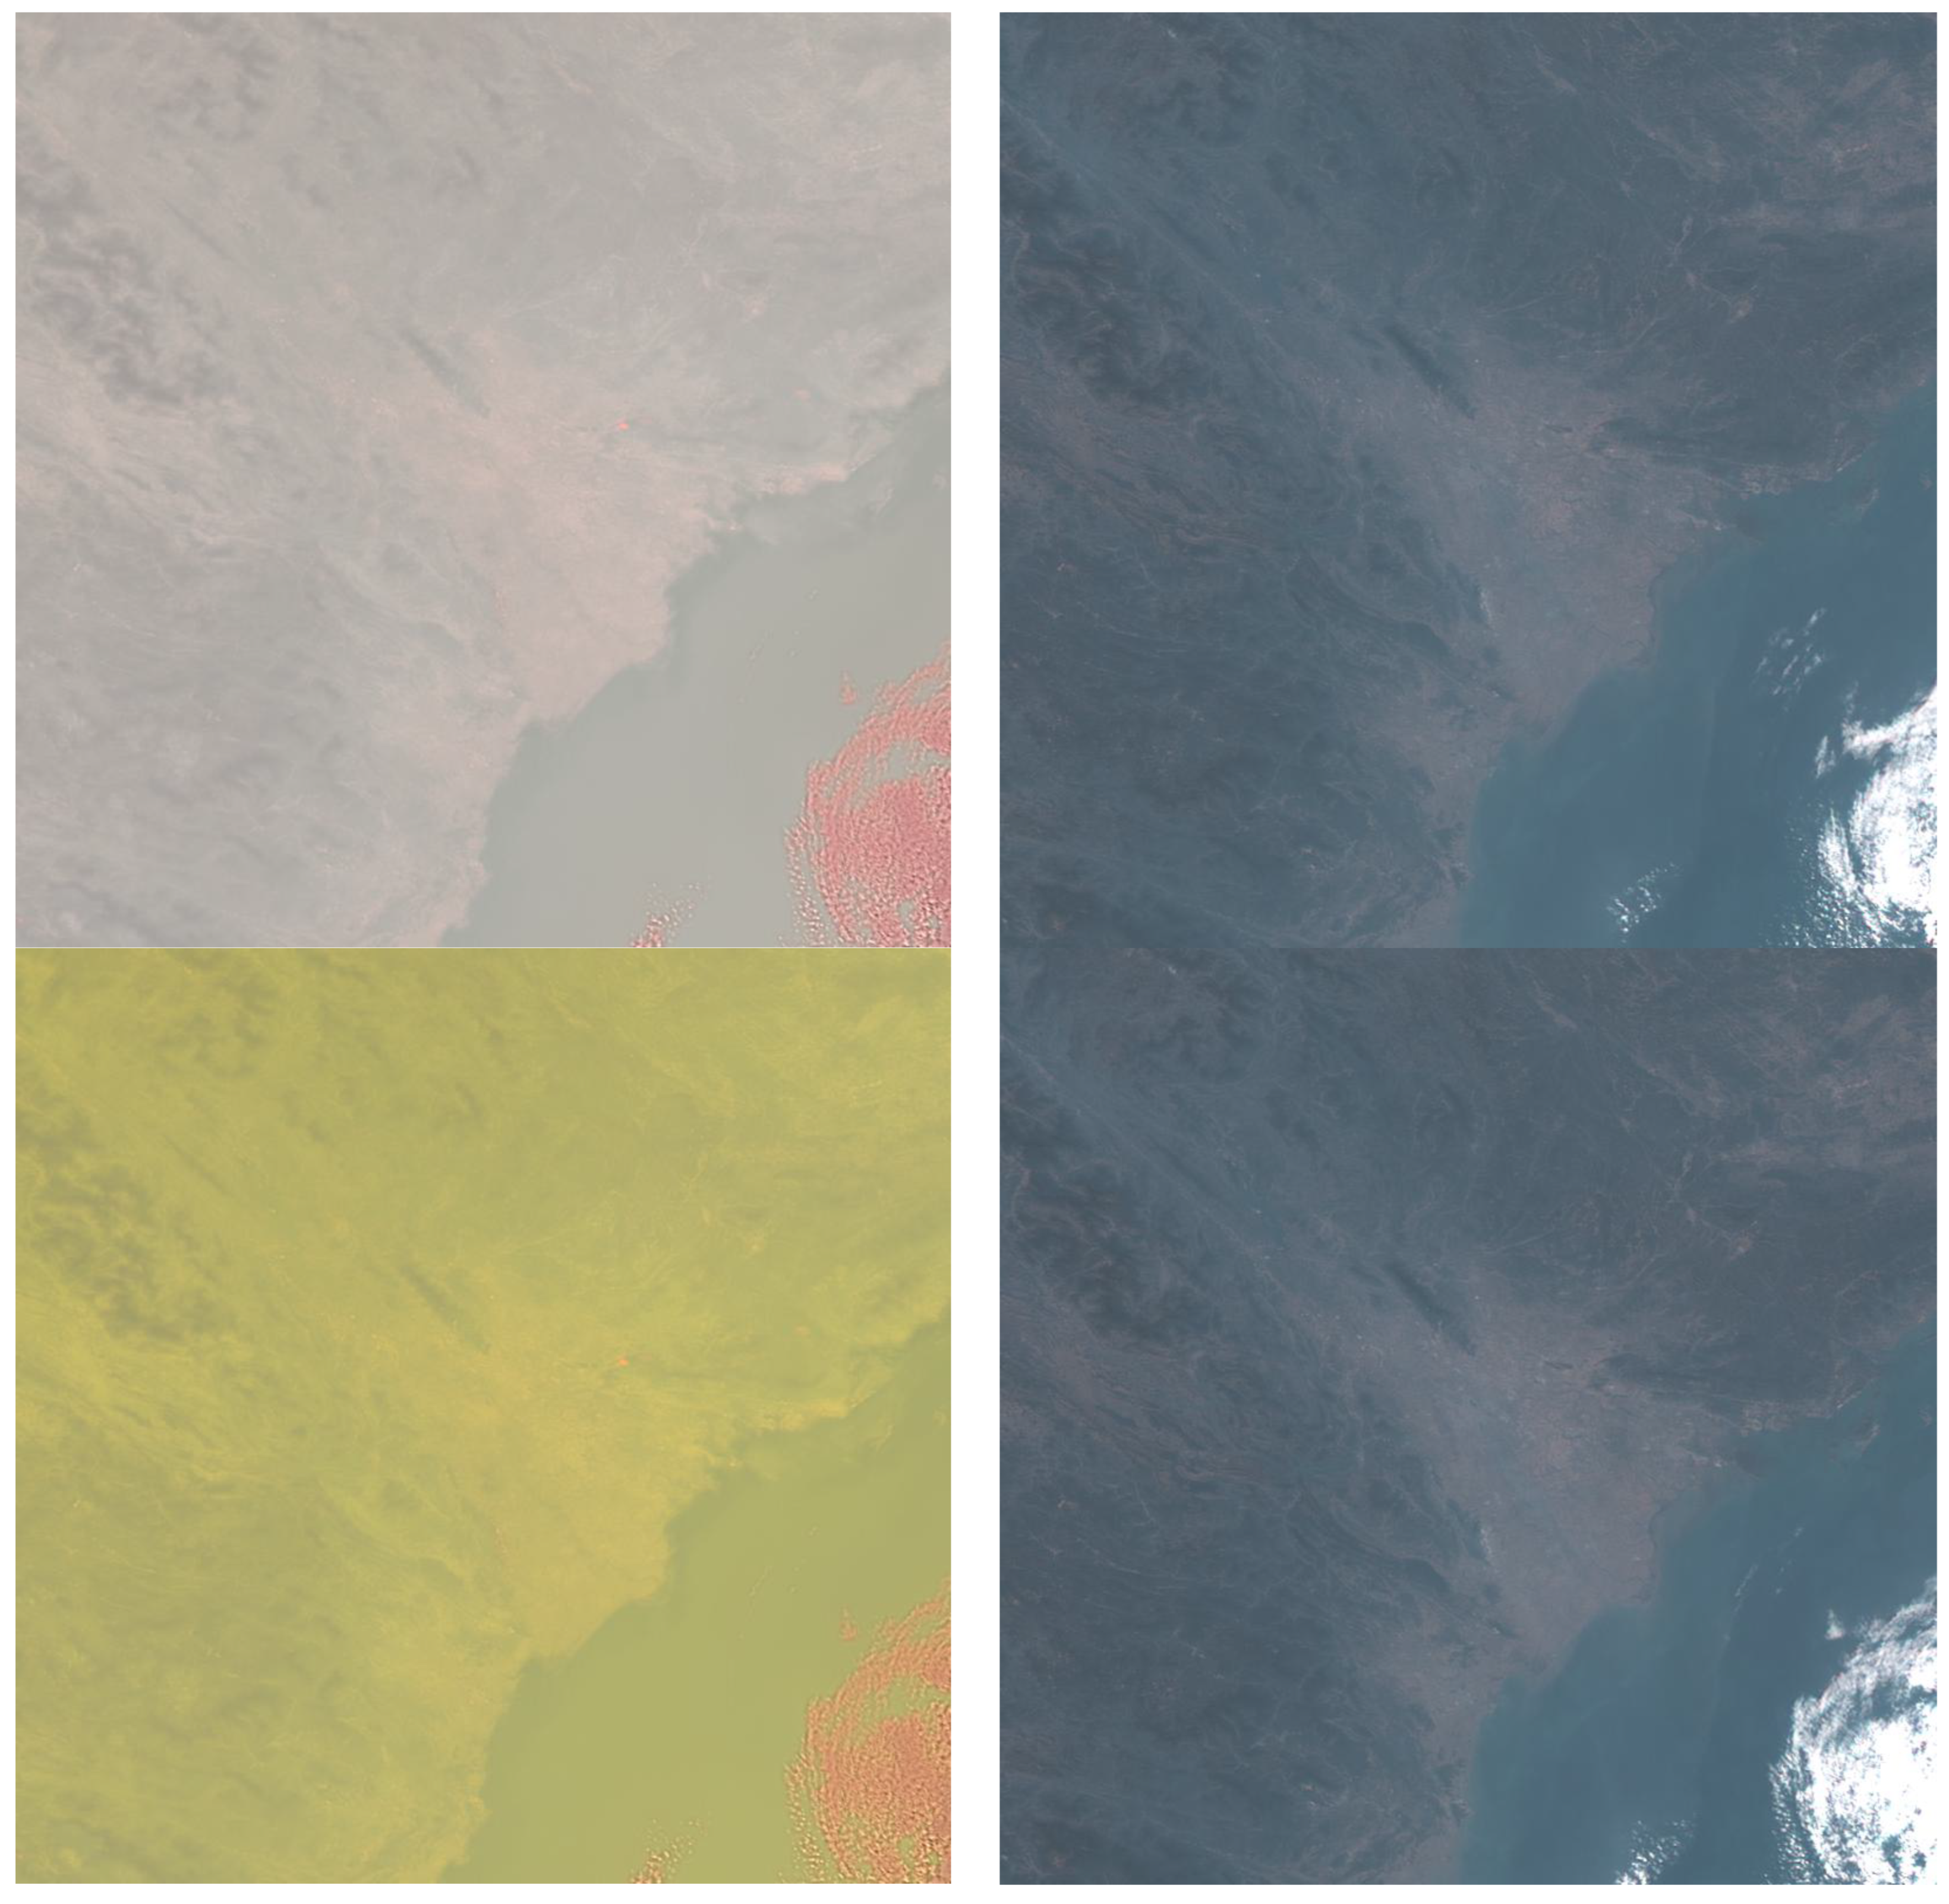

Table 1.
Difference statistics between Δr–NBT-enhanced and interpolated imagery for each Himawari-8 band at 00:00 UTC on 10 December 2019. Statistics are computed over the 400 × 400-pixel domain. All brightness temperature bands use normalized Celsius units.
Table 1.
Difference statistics between Δr–NBT-enhanced and interpolated imagery for each Himawari-8 band at 00:00 UTC on 10 December 2019. Statistics are computed over the 400 × 400-pixel domain. All brightness temperature bands use normalized Celsius units.
| Band | RMSE | Correlation | STD |
|---|---|---|---|
| B01 | 0.00684 | 0.996 | 0.00684 |
| B02 | 0.00723 | 0.995 | 0.00723 |
| B04 | 0.01029 | 0.991 | 0.01029 |
| B05 | 0.01733 | 0.984 | 0.01733 |
| B06 | 0.01484 | 0.980 | 0.01484 |
| B07 | 0.01433 | 0.985 | 0.01433 |
| B08 | 0.01063 | 0.940 | 0.01063 |
| B09 | 0.01083 | 0.964 | 0.01083 |
| B10 | 0.01119 | 0.970 | 0.01119 |
| B11 | 0.01480 | 0.990 | 0.01480 |
| B12 | 0.01226 | 0.983 | 0.01226 |
| B13 | 0.01499 | 0.991 | 0.01499 |
| B14 | 0.01626 | 0.991 | 0.01626 |
| B15 | 0.01635 | 0.991 | 0.01635 |
| B16 | 0.01407 | 0.987 | 0.01407 |
| Ave | 0.01282 | 0.982 | 0.01281 |
Disclaimer/Publisher’s Note: The statements, opinions and data contained in all publications are solely those of the individual author(s) and contributor(s) and not of MDPI and/or the editor(s). MDPI and/or the editor(s) disclaim responsibility for any injury to people or property resulting from any ideas, methods, instructions or products referred to in the content. |
© 2025 by the authors. Licensee MDPI, Basel, Switzerland. This article is an open access article distributed under the terms and conditions of the Creative Commons Attribution (CC BY) license (http://creativecommons.org/licenses/by/4.0/).
Copyright: This open access article is published under a Creative Commons CC BY 4.0 license, which permit the free download, distribution, and reuse, provided that the author and preprint are cited in any reuse.


