Submitted:
16 July 2025
Posted:
17 July 2025
You are already at the latest version
Abstract
This study presents the development of a predictive system based on artificial neural networks (ANNs) and fuzzy logic to estimate losses in an agave liquor production and packaging facility. Currently, these losses are discharged into the wastewater stream, resulting not only in the waste of finished product but also in increased environmental pollution and higher treatment costs. To address this, the agave liquor waste is converted into methane biogas via anaerobic digestion and subsequently transformed into electrical energy. The system begins with the collection of historical data from the production pro-cess, including production plans and shrinkage rates at each stage of the packaging line. These data are analyzed to identify behavioural patterns and correlations between process variables and losses, allowing a deeper understanding of the packaging process. Critical control points are identified across the production stages, and an ANN model is trained using historical data to predict losses. Fuzzy logic is employed to manage the uncertainty and subjectivity associated with identifying the stages most susceptible to waste, trans-lating qualitative assessments into quantitative metrics. This integrated approach aims to optimize operational efficiency, reduce losses, minimize environmental impact, and pro-mote sustainable practices within the agave liquor industry.
Keywords:
loss prediction
; agave liquor production
; artificial neural networks
; fuzzy logic
; sustainable manufacturing
1. Introduction
The production of agave-based liquor holds substantial economic significance both domestically and internationally. In 2020, Mexico exported approximately 308.6 million litres of tequila, indicating that eight out of every ten litres produced were consumed abroad. The United States was the primary export destination, importing 277.8 million litres—accounting for 90% of total exports. According to official data [1], the export value reached USD 2.355 billion, positioning agave liquor as Mexico’s second most important agro-industrial product, surpassed only by beer.
The agave production sector involves approximately 9,000 producers and generates around 29,000 direct and indirect jobs. The Tequila Regulatory Council [2] reported that in January 2010, 97,200 tonnes of agave were processed for tequila production. As a result, there are currently 625 registered distilleries and 80 bottling plants, with a continued increase in legally registered brands [3]. In 2020, national agave production reached 1.519 million tonnes, generating a market value of MXN 31.339 billion [4].
Production losses, or shrinkage, are a common and multifaceted phenomenon in manufacturing enterprises. These losses adversely affect operational efficiency, increase costs, and undermine the sustainability of operations. As noted by Moreno [5], shrinkage encompasses losses incurred during manufacturing processes, including raw material waste, defective products, and inefficiencies within the supply chain.
According to [6], production shrinkage typically refers to the loss of raw materials, products, or components during production, storage, transportation, and distribution. These losses significantly impact various operational aspects, particularly by increasing production costs due to the need for additional materials to meet production targets [7].
Human error is a critical contributor to production losses, often resulting from incorrect actions or decisions made by personnel. As highlighted by Torres Medina [8], such errors can severely affect operational efficiency and product quality. These errors may occur at various stages of the production process, including operational mistakes due to improper machine configuration. In the context of agave liquor production, this may involve poor calibration, leading to underfilling or inconsistent machine speeds [9].
Mechanical failures also contribute to production inefficiencies. These failures, as described by [10], include mechanical and technological malfunctions that disrupt production, reduce performance and efficiency, and may even cause complete production stoppages. Common causes include wear and tear from continuous use and component breakage due to overload or material fatigue.
In a related study, Cortés Mora [11] demonstrated the application of artificial neural networks (ANNs) and artificial intelligence (AI) for identifying bottled beverages using digital image recognition. This approach, which involves training models to detect patterns, could be adapted to monitor each stage of the bottling process—such as conveyors, fillers, cappers, and labellers—thereby enhancing system control and quality assurance in agave liquor production.
2. Problem Statement
The alcoholic beverage industry is characterized by a complex production process encompassing multiple stages, from fermentation and distillation to bottling and distribution [12]. At each stage, companies face significant challenges related to operational efficiency and product quality. A critical issue in this context is production loss, defined as any material, substance, or resource that is wasted or lost during the process.
The company under study, which specializes in the production and packaging of alcoholic beverages, has identified that losses can occur at various stages of the production line. These include the initial stages of fermentation and distillation—where losses may result from evaporation and spillage—as well as the bottling stage, where defects in raw materials (e.g., damaged bottles), overflows during filling, and leaks are common.
Additional losses may occur during storage and transportation due to improper handling or suboptimal storage conditions [13]. Reducing these losses is essential for improving the company’s profitability. A well-designed strategy can lead to resource optimization, enhancing the efficient use of raw materials and operational inputs.
Quality improvement is also a key objective. Controlled and efficient processes ensure that production time is not wasted and that resource management is optimized throughout the operation [14].
This study presents data collected from a company engaged in the production and bottling of alcoholic beverages. The objective is to predict the quantity of material that will be wasted throughout the production process. The analysis considers potential failures in machinery—specifically conveyors, fillers, cappers, labellers, and tax label applicators—as well as human errors resulting from inadequate supervision or operator mishandling.
The quantity of wasted material is calculated by quality control specialists assigned to each production line, with oversight and validation provided by line supervisors.
3. Metodology
The development of the predictive system began with the collection of historical data related to the agave liquor production process. This dataset included information from production plans and records of material losses (shrinkage) at each stage of the bottling process. Once compiled, the data were analyzed to identify behavioural patterns and correlations between process variables and observed losses. This analysis enabled a comprehensive understanding of the operational characteristics of the packaging system.
A detailed description of each stage in the production process was conducted, and critical control points—locations where defects most frequently occur—were documented. An artificial neural network (ANN) model was then implemented to predict losses, using the historical data for training purposes. The ANN was designed to learn from the operational conditions and performance metrics of the production lines.
To address the inherent uncertainty and subjectivity in determining which stages are most susceptible to waste, fuzzy logic was integrated into the system. This approach allows for the translation of qualitative assessments (e.g., “high,” “medium,” “low” efficiency) into quantitative values, thereby enhancing the precision of the model. The combined use of ANN and fuzzy logic facilitates the optimization of operational efficiency, reduction of material losses, and promotion of sustainable practices within the agave liquor industry.
4. Process Description
The production process of the alcoholic beverage manufacturing and bottling company (Figure 1) commences upon receipt of a formal request from the corporate headquarters to produce a specified quantity of product cases. These cases encompass a variety of consumer beverages, including but not limited to Agave Liqueur, Whisky, and Vodka, each corresponding to distinct production lines. The total production volume must be fulfilled by the predetermined deadline to ensure compliance with contractual obligations. Failure to meet these production targets may result in substantial financial penalties, as the clientele primarily comprises large multinational corporations that procure these products under strict delivery agreements.
The supply chain process is initiated by requesting the appropriate quantity of raw materials required for production. These materials include bottles, caps, labels (front, top, and back), tax stamps issued by the Mexican Tax Administration Service (SAT), and packaging boxes. Upon arrival at the facility, the Quality Control Department conducts a thorough inspection of the materials, employing sampling techniques to ensure that all items meet the necessary standards for operational use. Should any discrepancies or deficiencies be identified, a formal report is issued detailing the observed non-conformities and the specific characteristics of the materials received. This documentation is managed within the receiving area of the warehouse department.
Once the liqueur production is complete, the process advances to the bottling stage along the designated production lines. This begins with the transfer of the required raw materials from the warehouse to the corresponding production line, where they will be utilized in the manufacturing process. Once the materials are positioned and ready at the production line, operations commence.
The production phase initiates with the conveyor system, which facilitates the collection and movement of individual bottles along each production line. Each line operates at a specific speed, determined by the capacity and configuration of the machinery in use. The process continues to the filling station, where bottles are filled with the beverage according to the production plan established by the Plant Manager, Deputy Manager, and Department Heads, ensuring alignment with client specifications and delivery schedules.
Following the filling stage, the capping unit secures each bottle with the appropriate closure, which varies depending on the bottle design, beverage type, and product presentation. Once capped and verified for quality, the bottles proceed to the labelling station, where front, top, and back labels are applied, contingent on the product’s presentation requirements.
The final and most legally sensitive stage is the application of the tax stamp label, known as the “marbete.” This step is critical, as any failure in its execution constitutes a violation of the Mexican Federal Fiscal Code, specifically Article 82, Section XVIII. Such non-compliance may result in significant financial penalties for each improperly labelled product offered for sale through commercial distributors. The responsibility for these penalties lies with the manufacturing company.
Upon successful inspection by the Quality Control team for finished goods, the packaging process begins. This involves grouping the finished bottles into cases of twelve for efficient handling, transport, and storage. These cases are then palletized and secured by the warehouse department in preparation for shipment to the Distribution Centre (CEDIS), which is responsible for dispatching the products to their respective clients.
5. Development of the RNA-Based System – Neural Tools
Neural Tools can be employed to predict uncertain parameters within a system. Specifically, it enables the estimation and interpretation of a target variable based on the input of numerical variables that have been previously trained and validated, thereby generating predictive outputs. A dataset comprising 3,125 records was compiled from three production lines operating across two shifts, Monday through Saturday, with only one shift on Saturdays. This dataset spans from Week 1 to Week 21 of the year 2024.
Additionally, a consolidated dataset of 4,577 records was obtained, capturing data related to production losses (merma) across various stages of the bottling process, including the conveyor, filler, capper, labeller, and tax stamp labeller.
The core objective of this study is to predict the quantity of production loss per shift, based on the operational conditions of the machinery during each shift. This is achieved through the analysis of historical data to evaluate how loss values are influenced at each stage of the bottling process. Table 1 presents the production plan alongside the actual production outcomes.
Table 2 presents the historical data on the percentage of production loss (merma) recorded at each stage of the bottling process. It is important to note that the organization has established a critical threshold, stipulating that losses must not exceed 1% at any stage of the bottling operation. As illustrated in the accompanying table, the recorded values surpass this predefined limit, indicating deviations from the operational efficiency targets.
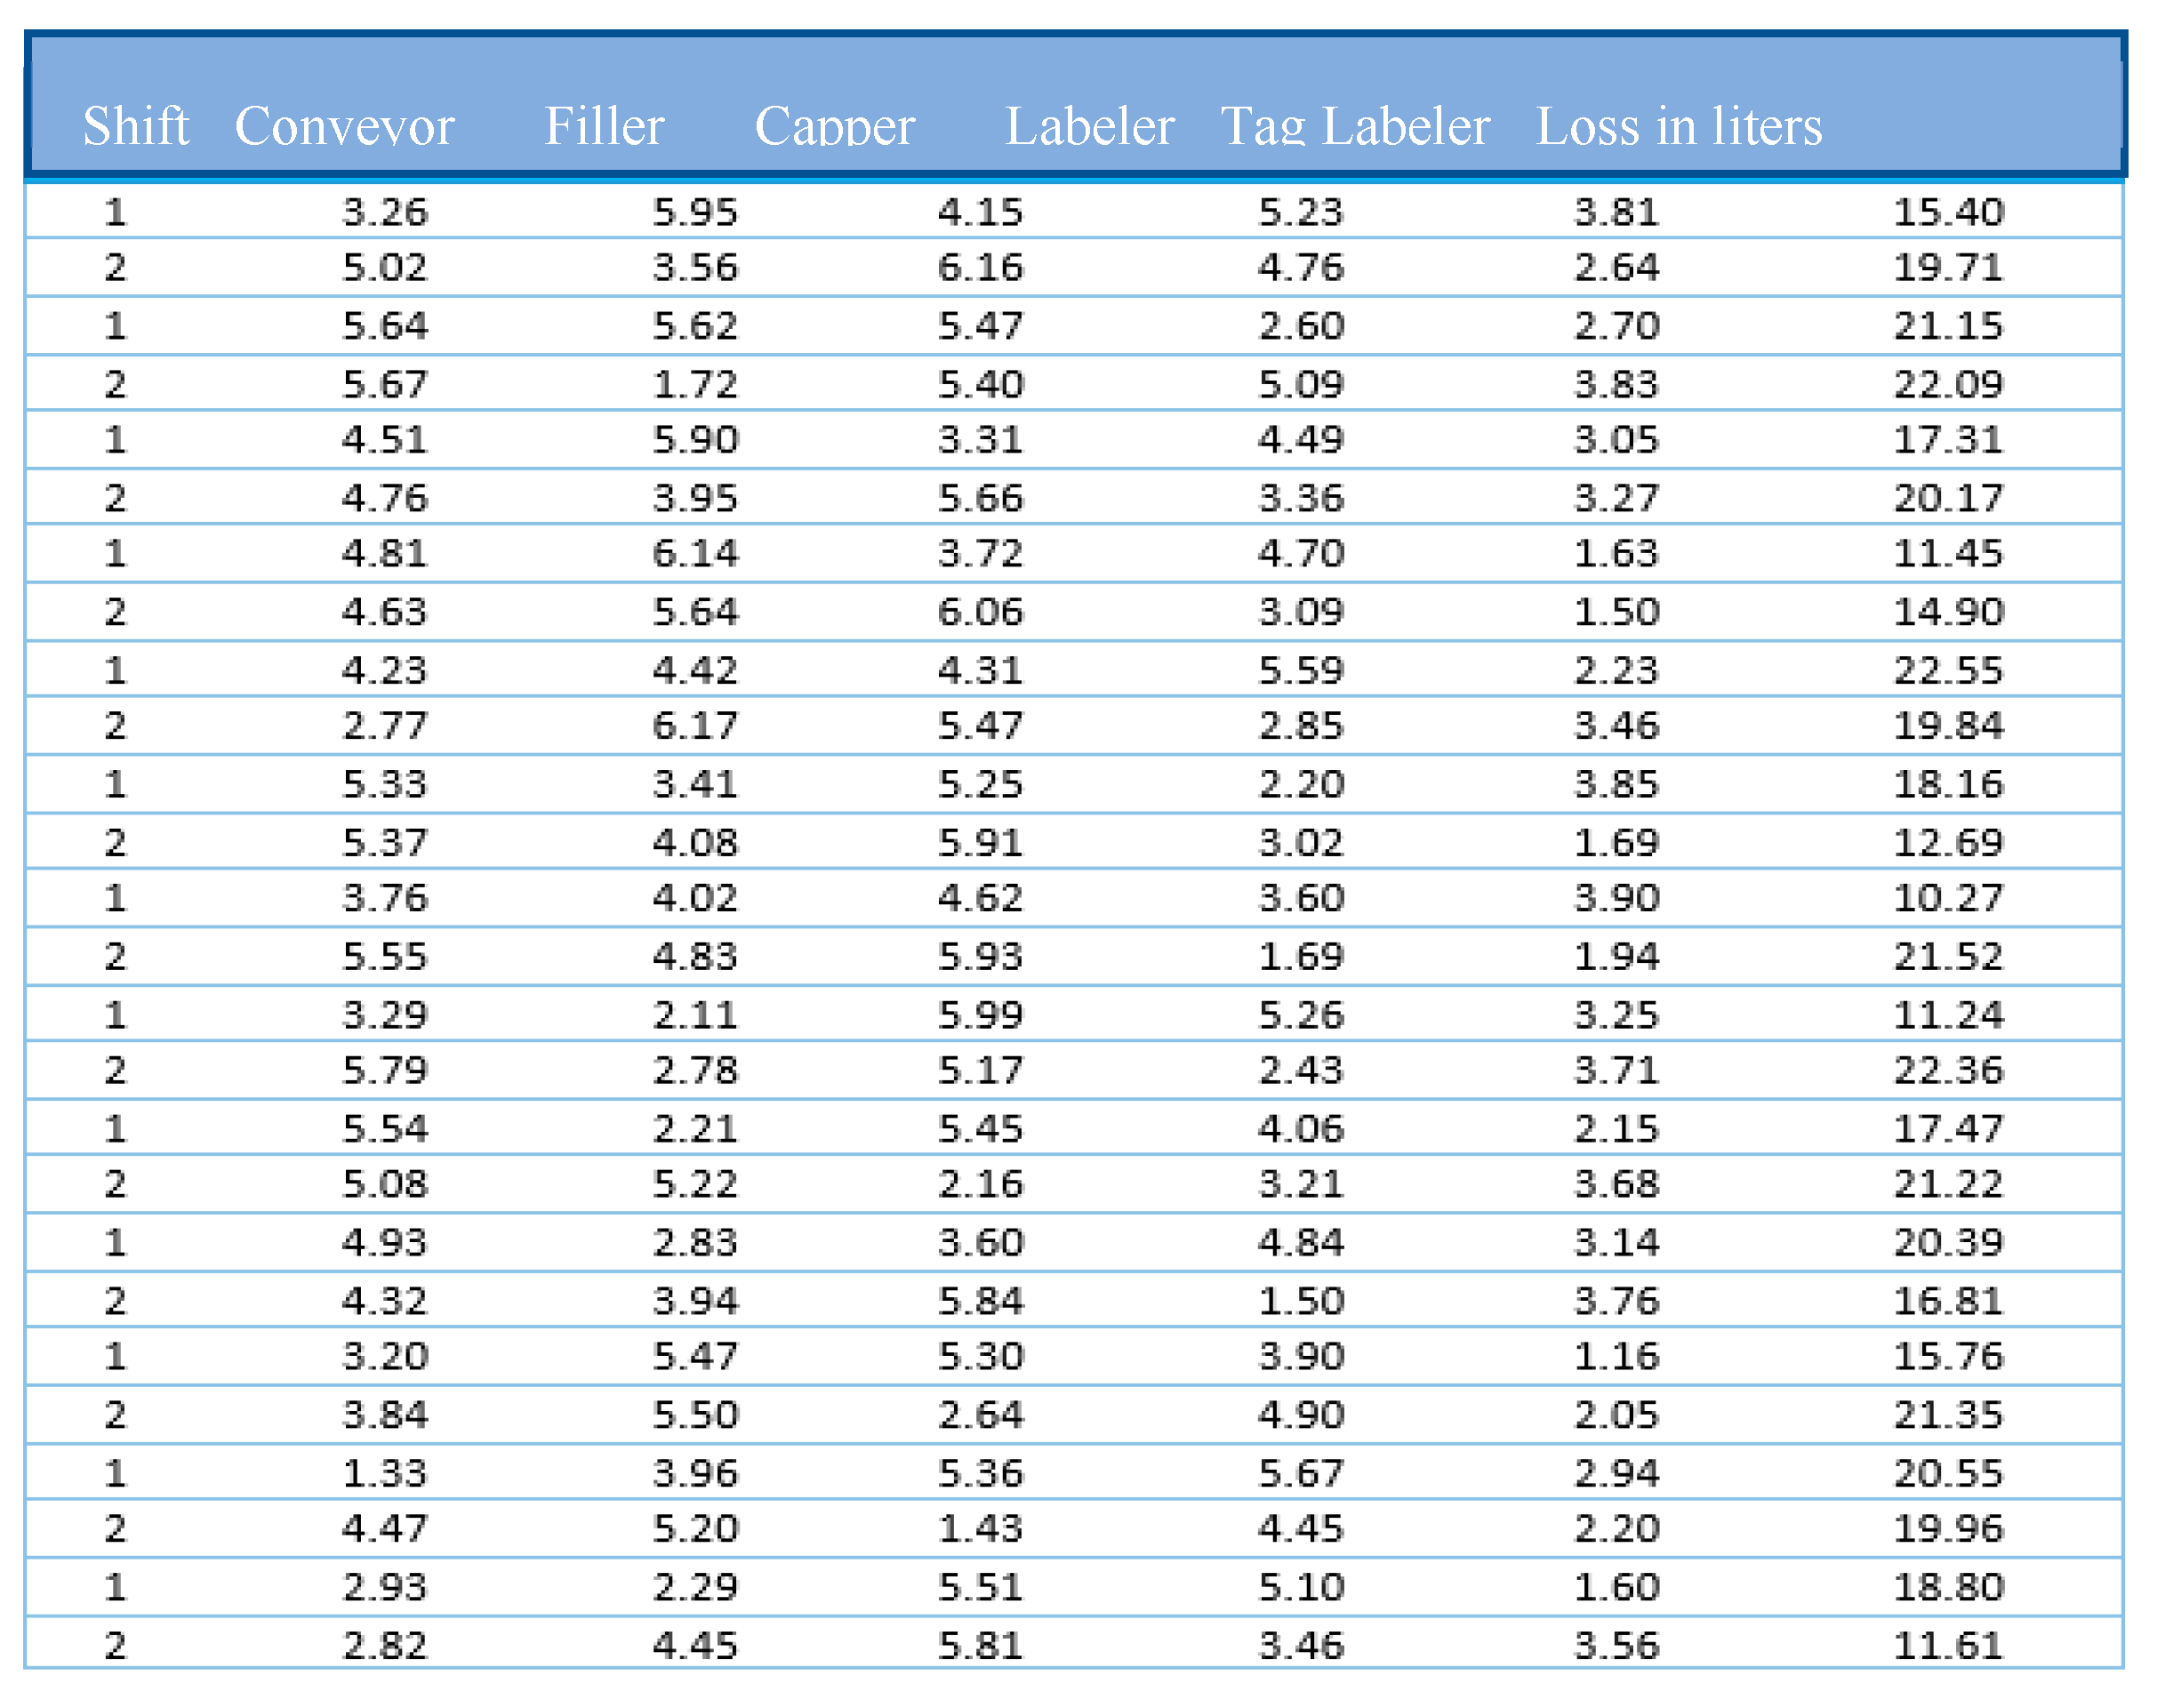
For data collection and preprocessing, the dataset was partitioned into three subsets: 70% for training the model, 20% for validation to fine-tune the parameters, and 10% for testing to evaluate final model performance. These data were organized in an Excel document, as illustrated in Figure 4, which represents the training process for Production Line One. This figure also displays the relative impact of each variable involved in the production process, following the removal of outliers attributed to uncontrollable operational factors.
Figure 2.
Representative sample of the neural network training data.
Subsequently, the training and testing datasets were employed to generate predictive outputs using the Scaled Conjugate Gradient (SCG) method, which has been widely recognized in the literature as one of the most efficient and suitable algorithms when implemented in MATLAB.
To define the model’s design and architecture, a structure was established comprising six input variables: shift, conveyor, filler, capper, labeller, and tax stamp labeller. Based on this configuration, a single output neuron was defined to predict the volume of production loss (in litres) for both shifts.
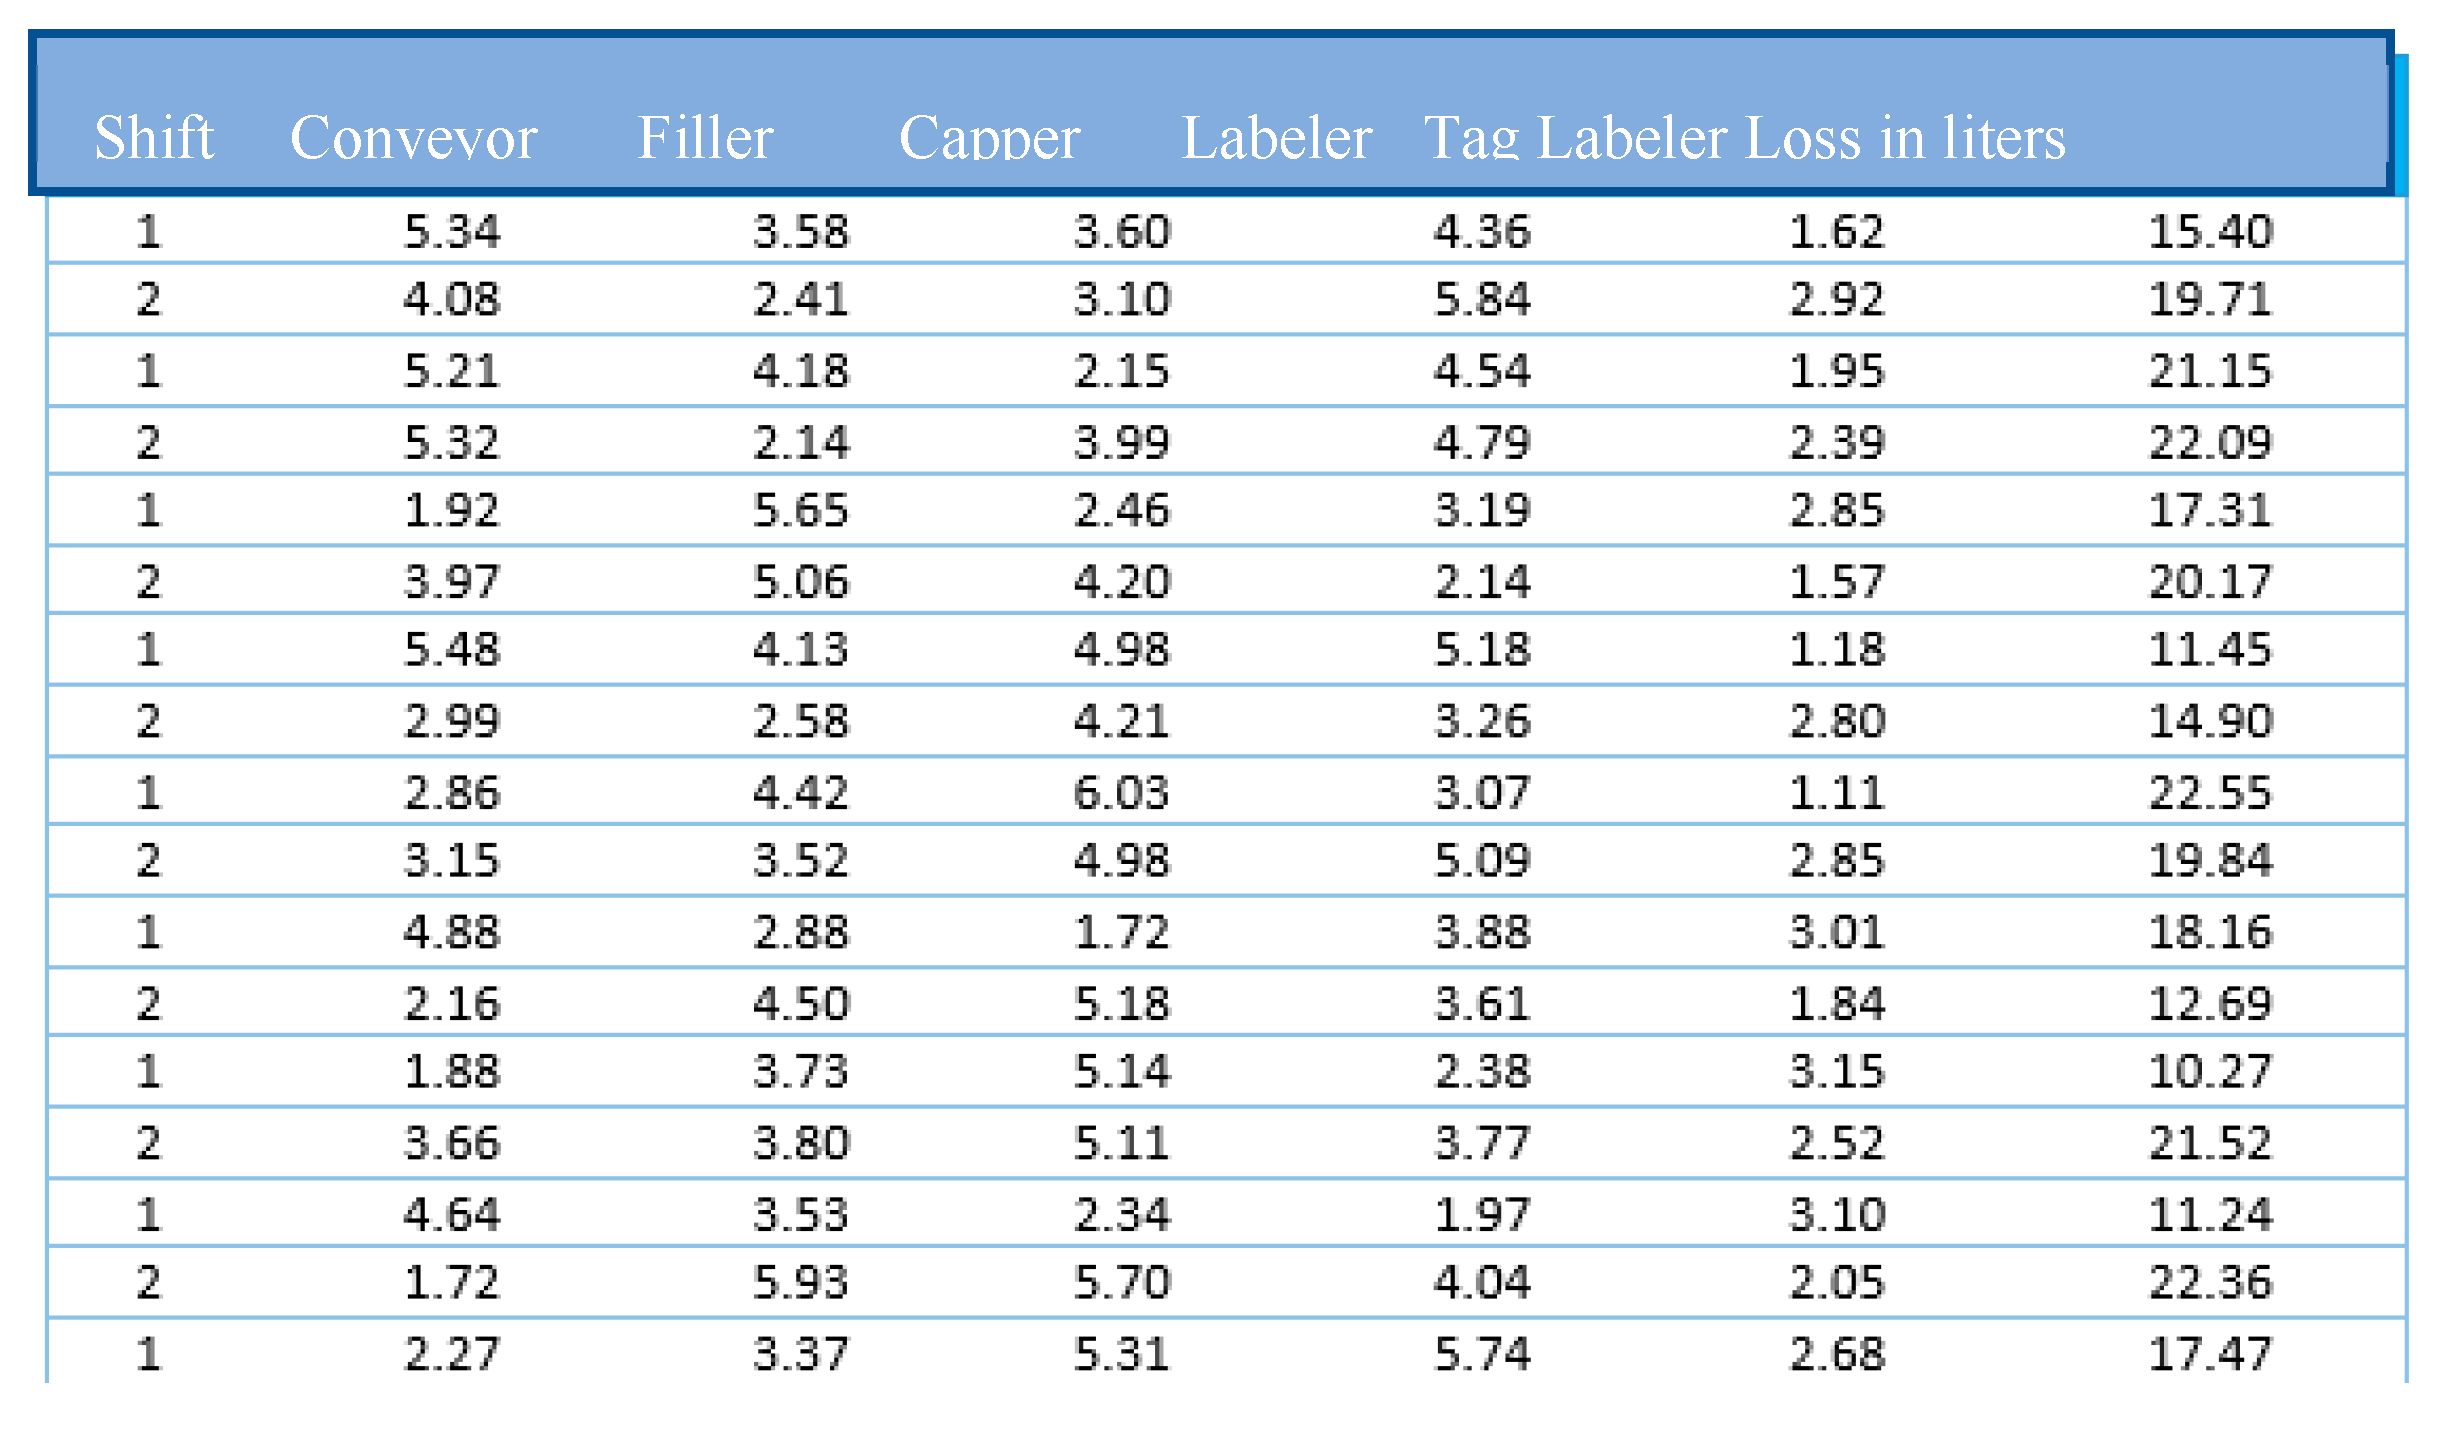
Figure 3.
Representative sample of the neural network test data.
6. Packaging Line Analysis and Loss Prediction
As shown in the preceding table, following the corresponding analyses conducted using Neural Tools, the following projections can be made: for the upcoming semester, an estimated total output of 4,856,868 bottles is anticipated. Of this total, approximately 813,815 units are expected to be lost as waste. Specifically, Shift 1 is projected to account for 47.62% of the total loss, equivalent to 387,517 defective units, while Shift 2 is expected to contribute the remaining 52.38%, corresponding to 426,299 units.

Table 3.
Analysis and production of waste obtained with the neural network.
| TOTAL LOSS PREDICTION LINE 1 | ||||
|---|---|---|---|---|
| Estimate of bottes produced for the next semester | Total losses line 1 | Shift 1 | Shift 2 | Percentage of total loss |
| 4,856,868 | 813,815 | 387,517 | 426,299 | 16.75 |
| 47.62% | 52.38% | |||
Figure 4.
Variable impacts morning shift (worker A).
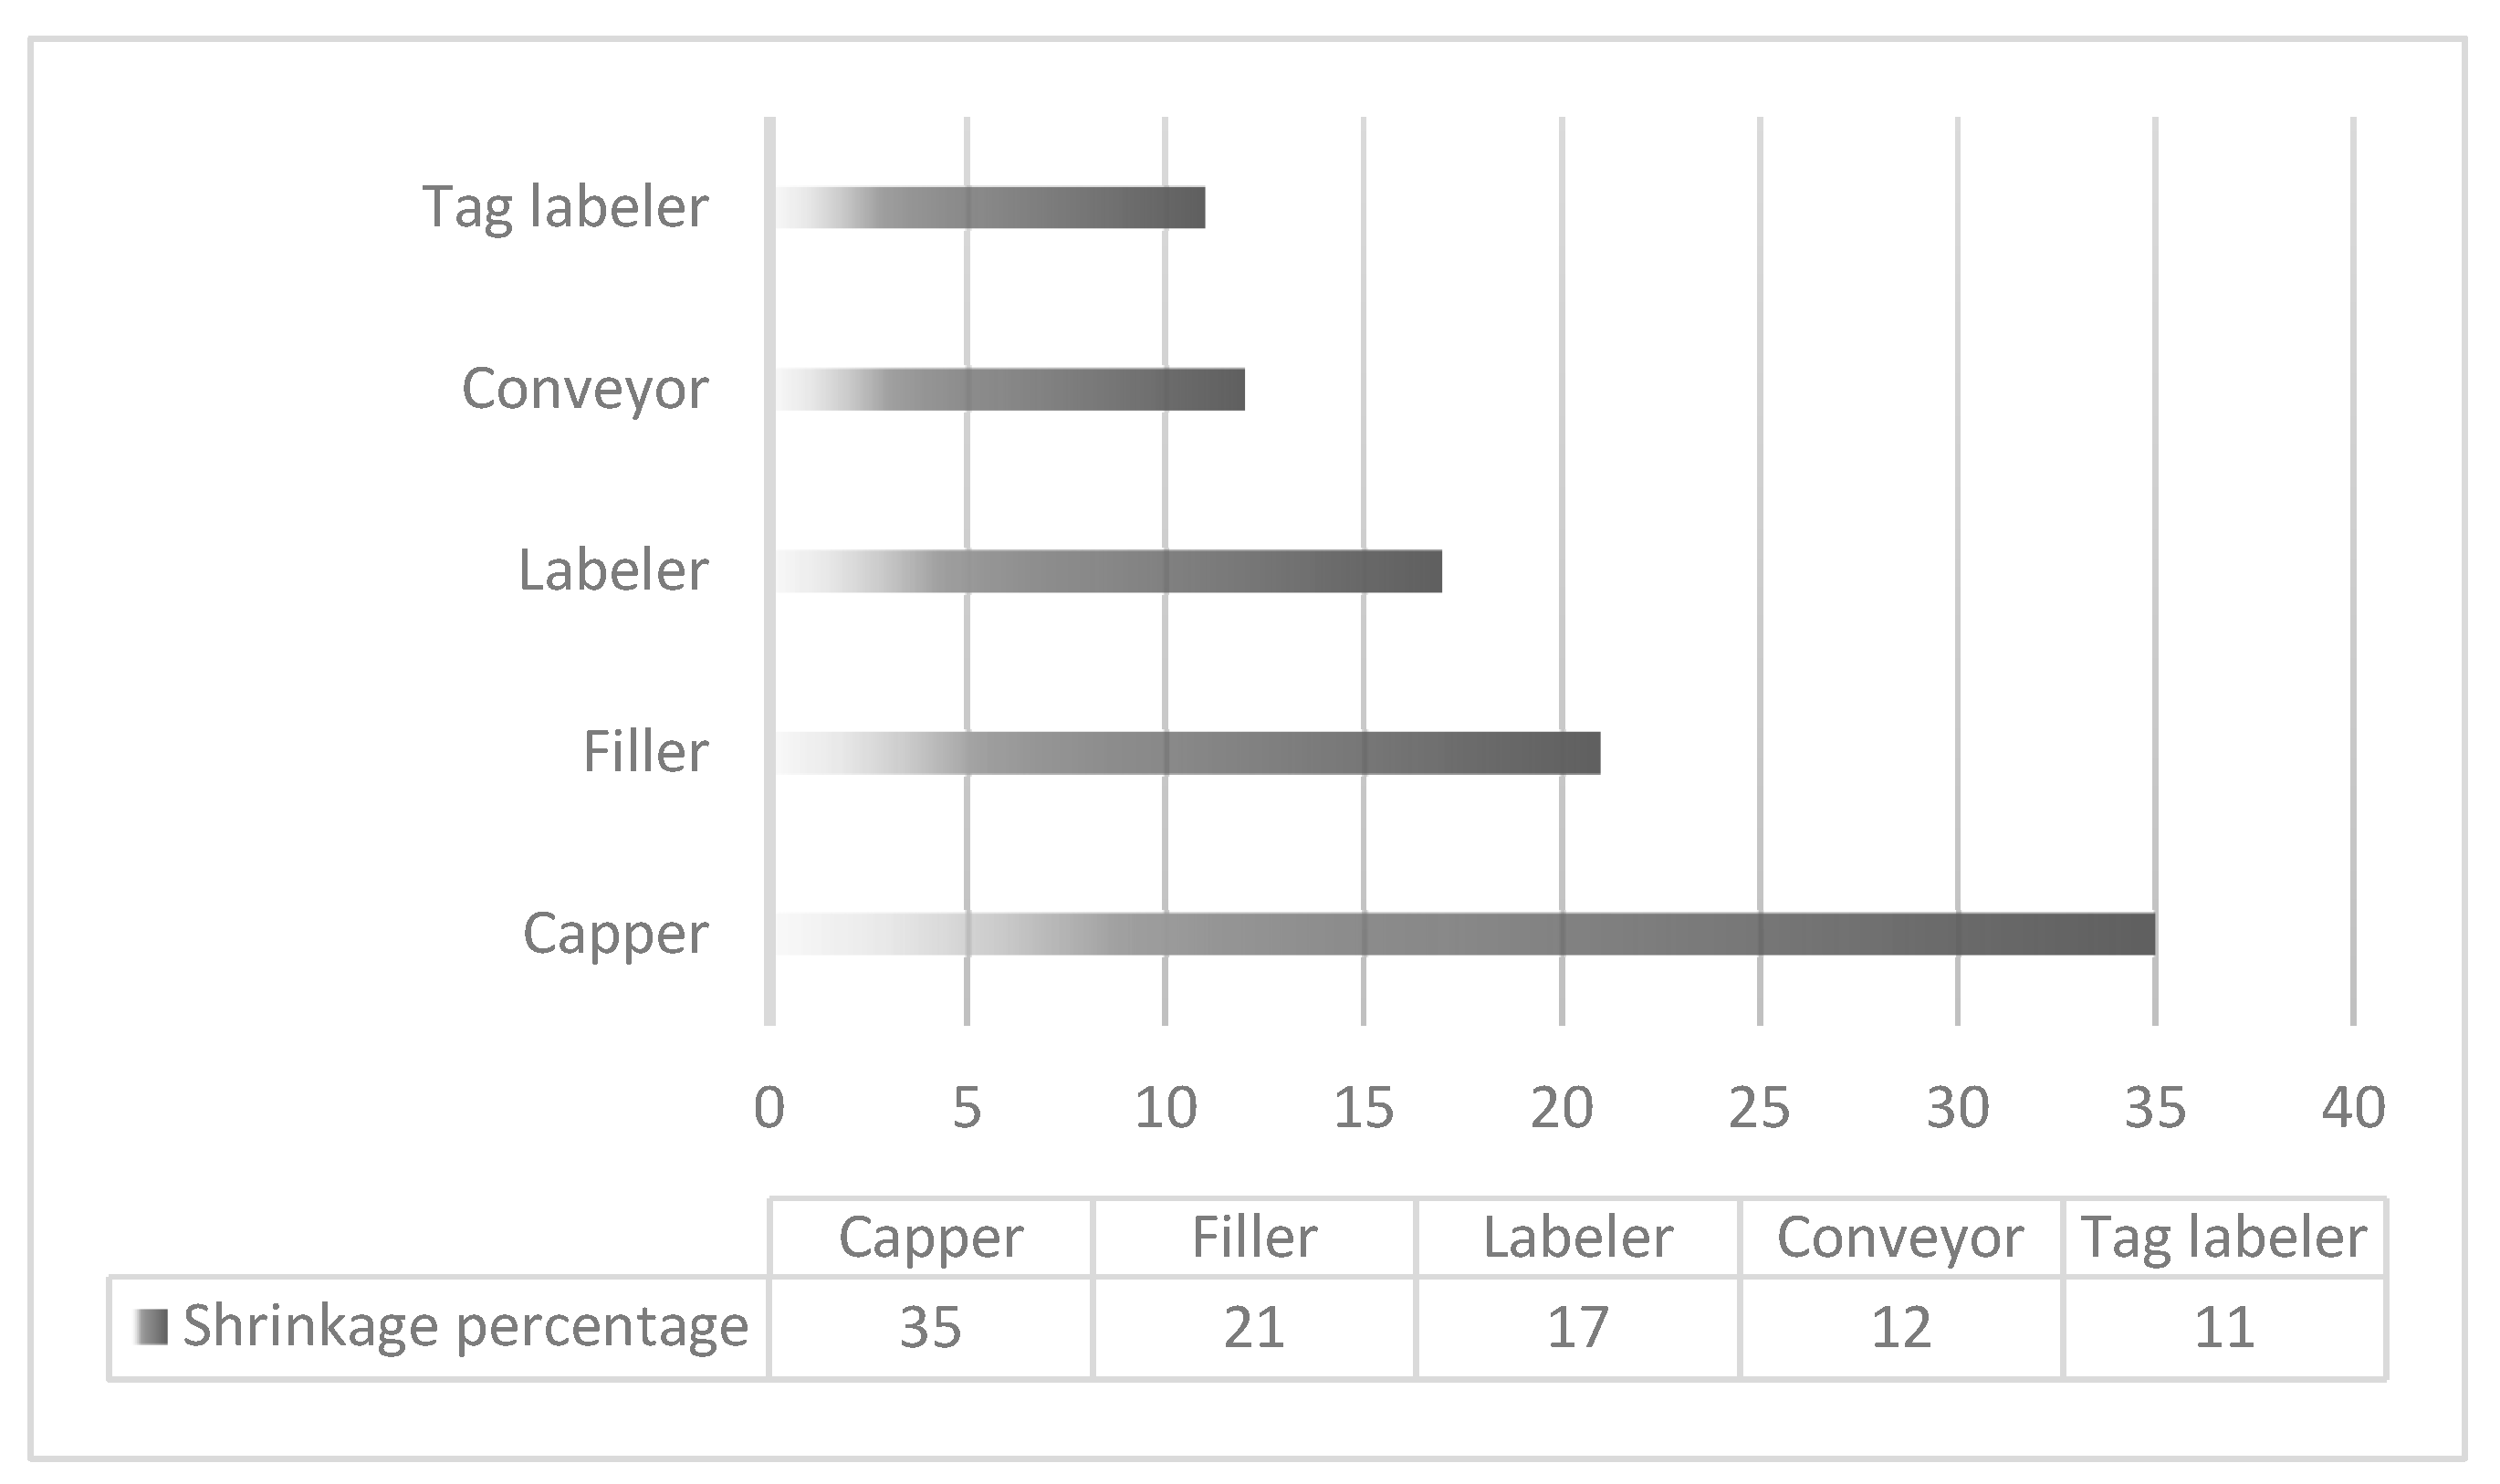
Figure 5.
Variable impacts evening shift (worker B).
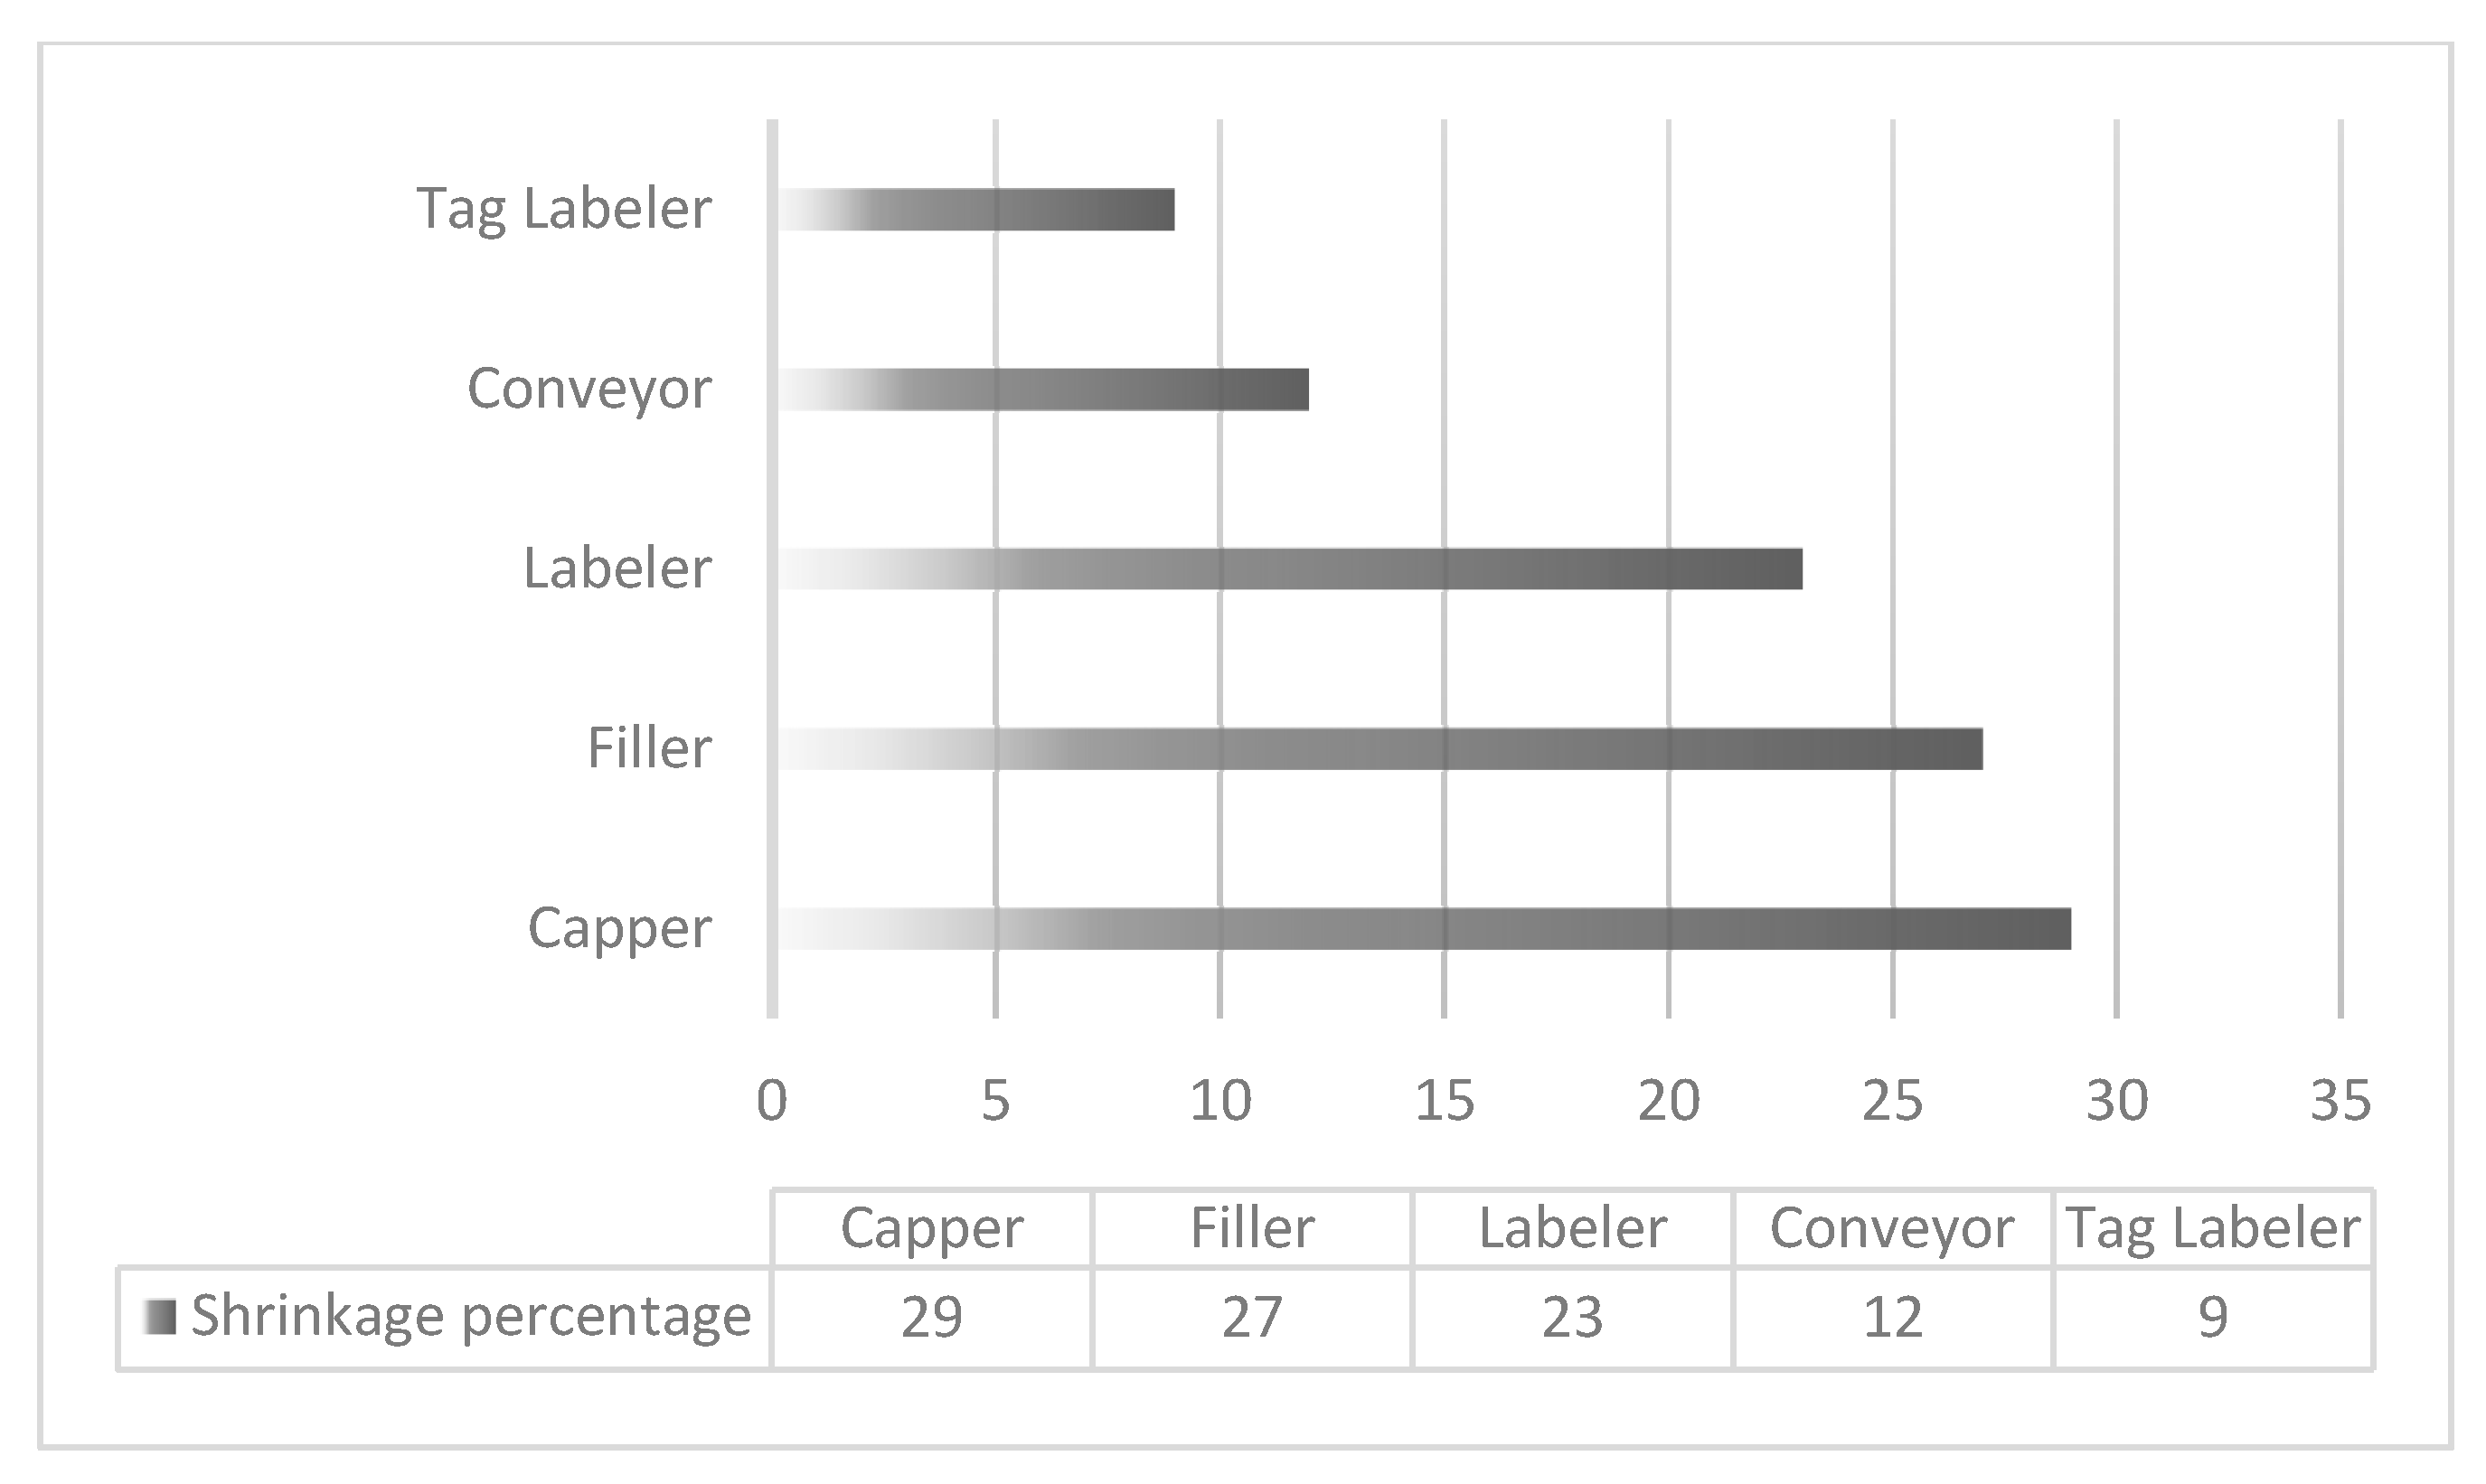
These results highlight the capper and filler as the most critical points of loss in both shifts, suggesting that targeted interventions in these stages could yield substantial improvements in efficiency and waste reduction.
The distillery operates an anaerobic EGSB biodigester with a working volume of 3.5 m³, which is used to produce methane biogas. This biogas is then utilized to generate electricity via an electric generator. The electricity produced is used to power lighting systems across various areas of the facility. However, a key limitation of this electricity generation system is the inability to store the generated electricity, as doing so would incur prohibitively high costs—such as those associated with lithium battery banks. To address this issue, the present project developed an artificial intelligence-based system for a liquor company, aimed at minimizing the discrepancy between the electricity demand of the facility’s lighting systems and the electricity generated from methane biogas derived from the distillery’s own waste. To store the biogas, a cushion-based storage system was designed and implemented, capable of holding up to 400 litres of biogas, as shown in Figure 6.
To measure biogas production from the EGSB reactor, a Cole-Parmer mass flow meter was installed. Additional work was carried out to manage the biogas produced by the reactor, including the modification of a conventional 500-litre stationary LP gas tank for use with biogas at a pressure of 120 psi. This adaptation enabled the storage of up to 13,000 litres of biogas, which is used to power a 12 KVA electric generator, providing approximately 3.8 hours of operation per tank. The system includes a check valve at the biogas inlet, a pressure gauge at the outlet, a pressure regulator with gauge, and a pressure switch to control the biogas compressor motor. A MOPESA-brand moisture filter and a liquid trap were also installed to ensure that the compressed biogas stored in the 500-litre tank can be used directly by the 12 KVA generator, which outputs a 120V, 60 Hz signal.
The electricity generated by the 12 KVA generator is fed into a central distribution bus that supplies power to the lighting systems throughout the facility. In this configuration, the generator acts as the agent. There is no feedback loop between the generator, the distribution bus, or the lighting systems. The only information available to the agent is the electricity demand requested by the distribution bus. The agent’s objective is to determine the optimal electricity production order size to minimize the total inventory level of generated electricity within the facility’s supply chain. Electricity demand data for the facility’s lighting systems exhibit two distinct behavioural patterns depending on the time of day—daytime versus nighttime—as well as weather conditions (sunny versus cloudy). The parameters for the normal distribution are N(5,1), while those for the uniform distribution are U(0,10). The agent’s action space ranges from 0 to 10 units. Experiments were conducted using both distributions to evaluate the model’s robustness.
All experiments in this study employed the same hyperparameter settings to ensure valid comparisons (Table 1). The neural network architecture consists of three layers with 128, 64, and 32 neurons, respectively. Each method was trained over 40,000 episodes. An ε-greedy strategy was used to balance exploration and exploitation. This strategy allows the agent to explore the environment before committing to an exploitation strategy. Through this iterative process, the agent refines its environmental model and gradually converges toward an optimal value function. The maximum epsilon value, εₘₐₓ = 1, decreases linearly to its minimum value, εₘᵢₙ = 0.1, over the first 10,000 training episodes. The initial hyperparameter values (Table 4) were proposed in [24] and [25]. Initially, the learning rate was set at 0.00025 and the discount factor at 0.99. However, these settings did not allow the algorithm to converge. A discount factor of 0.99 prioritizes future rewards, which is not appropriate for an infinite-horizon problem such as this. Moreover, when there is a delay between action and environmental response, a high learning rate can disrupt the learning process. The initial neural network configuration included a single hidden layer with 10 neurons.
The results of the Deep Q-Network (DQN) method with experience replay are illustrated in Figure 2c. In this figure, the outcomes under the normal distribution are represented by a blue line, while those under the uniform distribution are depicted in red. The average cost is notably higher under the uniform distribution compared to the normal distribution. Nevertheless, the agent’s actions (i.e., the electricity generator’s decisions) were consistent across both demand distribution types. It is important to highlight that, due to the inherent variability of the uniform distribution, electricity storage costs increase due to the variability in the lighting system’s electricity demand across the facility, resulting in a negative average inventory level. The behaviour of the state variables throughout the training process is depicted in Figure 7a, 7b, 7c, and 7d.
Under the uniform distribution, the electricity-generating agent learned a policy of maintaining zero inventory to minimize total cost, preferring to avoid electricity storage due to the high uncertainty in demand. Conversely, under the normal distribution, the agent adopted a policy of maintaining a minimal inventory level to reduce storage costs, as the demand pattern is more predictable. In the normal distribution scenario, total cost is primarily driven by storage costs, whereas in the uniform distribution scenario, the main cost arises from electricity shortages, necessitating purchases from the Federal Electricity Commission (CFE).
7. Development of the Fuzzy Logic System – MATLAB
To develop the fuzzy logic system, both the operational experience and the organizational need to maintain strict control over elevated waste percentages were taken into account. Based on practical knowledge, minimizing material waste is essential and depends on several stages within the production process. Accordingly, the following variables were defined:
-
- Conveyor stage
-
- Filler stage
-
- Capper stage
-
- Labeller stage
-
- Tax stamp labeller (MBT) stage
Organizational waste parameters were established to monitor and control losses at each stage, across all production lines and shifts. These were categorized as follows:
- a)
- Excellent: Waste range from 0.00% to 1.00%
- b)
- Acceptable: Waste range from 1.1% to 3.00%
- c)
- cPoor: Waste range from 3.1% to 6.00%
These classifications apply uniformly across all stages of the production process, forming a single categorization framework. That is, the percentage of waste is assessed independently at each stage, with the optimal performance level defined as a waste rate between 0% and 1%.
The following section presents the fuzzy sets corresponding to each of the variables considered in this analysis. All variables are interrelated due to their sequential role in the production process.
Figure 8.
Diffuse ranges of shrinkage determined by the company.
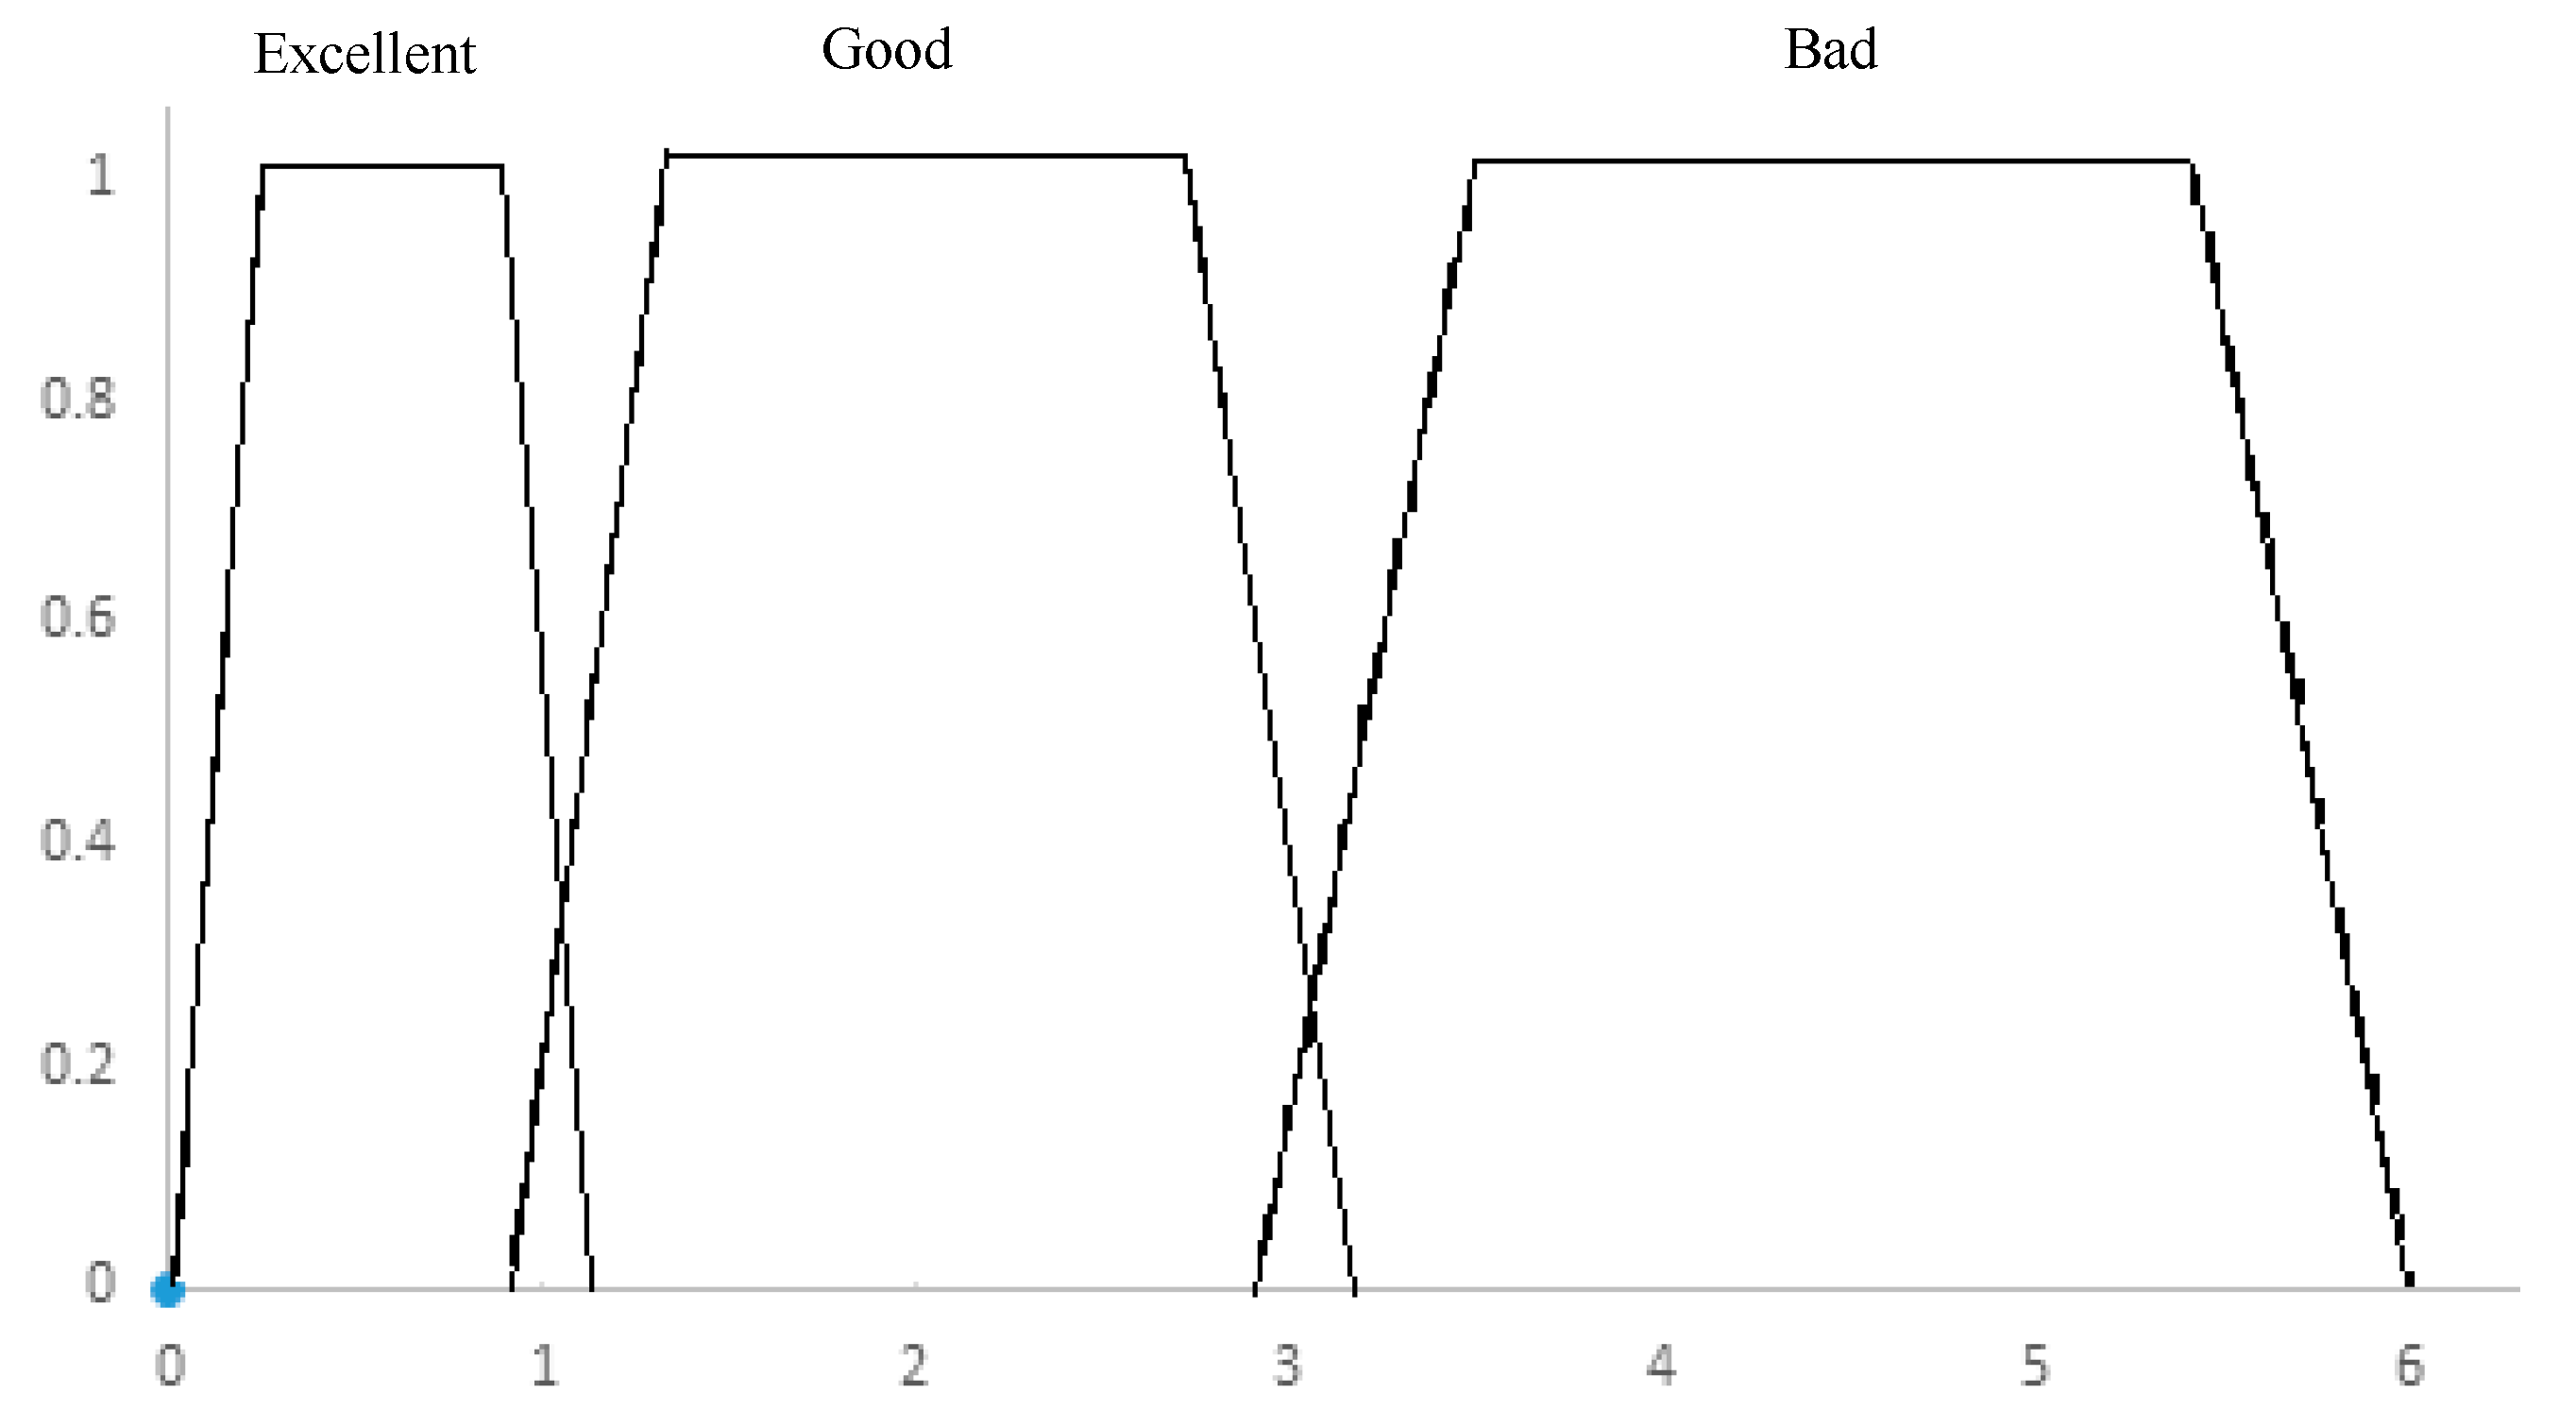
As illustrated in the figure 8, the company operates with minimal tolerance regarding raw material waste. The organizational objective is to maintain waste levels below 1.00% at each stage of the bottling process. Should waste exceed 1.1%, the performance is classified as either regular or poor, depending on the extent of the deviation by production line and shift. In cases where waste surpasses 3.00%, it becomes mandatory to halt the production line to prevent further escalation and to determine the appropriate corrective action—whether due to mechanical failure, raw material defects, or human error.
For the cumulative results of the first semester, a potential scenario was modelled using MATLAB to implement fuzzy logic. The input variables correspond to the waste percentages recorded at each stage of the production process. The system exhibits a trapezoidal behaviour, with the output variable representing the total accumulated waste.
If any of the stages—conveyor, filler, capper, labeller, or tax stamp labeller—maintain a waste level within the range of 0% to 3%, the production process continues uninterrupted. However, if any of these stages exceed the 3% waste threshold, the process must be halted immediately.
The decision rules were established based on expert knowledge and were implemented within the model illustrated in Figure 9. Only a subset of the constraints used in the MATLAB system is shown; the program subsequently performs the inference calculations.
As evidenced by the inference rules, at any point during the production process, if a stage reaches a “Poor” classification—quantitatively defined as a waste level exceeding 3%—the system is required to stop. At that point, a diagnostic analysis must be conducted to identify the root cause of the failure, whether it be mechanical malfunction, raw material inconsistency, or human error. The development of this system has significantly reduced the subjectivity previously associated with the variable behaviours observed across different production processes.
7. Results
Through the application of Artificial Neural Networks, it was possible to generate forecasts regarding the expected volume of production loss for the second half of the operational year. This predictive modelling was based on the following parameters:
Input variables: shift, conveyor, filler, capper, labeller, and tax stamp labeller.
Output variable: total quantity of production loss.
Table 5.
Second half shrinkage predictions using Artificial Intelligence.
| Second half shrinkage predictions using Artificial Intelligence | |||
|---|---|---|---|
| Finished product | Waste | Shift 1 | Shift 2 |
| 4,856,868 botellas |
813,815 productos |
Estimated loss of 47.62% defective products (387,517) |
Estimated loss of 52.38% defective products (426,299) |
The estimated failure rates for Shift 1 are as follows:
Table 6.
Failure rates for Shift 1.
| Labeler | Filler | Tag Labeler | Conveyor | Capper | Reduced liquid |
| 35% | 21% | 17% | 12% | 11% | 0.9% |
The estimated failure rates for Shift 2 are as follows:
Table 7.
Failure rates for Shift 2.
| Filler | Capper | Labeler | Conveyor | Tag Labeler | Reduced Liquid |
| 29% | 25% | 24% | 10% | 8% | 1% |
Using fuzzy logic, the primary input variables influencing production loss in the bottling process were identified. Based on the recommendations generated by the fuzzy system, adjustments to machine calibration—particularly for the labelling and filling machines—were proposed.
The objective is to reduce production loss by approximately 8% to 12%, thereby enhancing process efficiency and lowering operational costs.
This artificial intelligence tool enabled more accurate prediction—and, where applicable, reduction—of losses in the agave liqueur bottling system compared to traditional methods. The analysis further suggests that the root cause of the issue may lie in the raw materials used, specifically the type of bottle employed in the process.
8. Discussion
In the context of minimizing production losses in the liquor industry, various strategies have been proposed, including modifications to packaging materials and adjustments to filling parameters. As supported by studies [15] and [16], production losses may occur at multiple stages of the process, adversely affecting operational efficiency and increasing costs. However, the present study identified that the stages most strongly associated with waste generation are those involving the handling of bottles.
As noted by [17], human error does not necessarily imply operator incompetence, but may instead result from improper machine calibration. Citing [18], preventive maintenance significantly reduces product losses, with machinery efficiency being a key factor in minimizing waste—unlike corrective maintenance, which is the prevailing approach in the organization under study.
In [19], a hybrid system combining artificial neural networks (ANNs) and fuzzy logic was implemented to monitor and adjust solvent concentrations during beer fermentation, thereby improving the quality of the liquid product. The present project complements that research by applying the same artificial intelligence tools during the second stage of the production process—bottling.
The optimization of industrial control systems through the integration of fuzzy logic and genetic algorithms, as demonstrated in [20], has proven effective in enhancing process efficiency and stability. However, that study did not address the critical role of the bottling process. Given the operational demands and the importance of this stage, it is essential to define performance thresholds to optimize production. This aligns with the findings of [21], which emphasize the importance of machine-level analysis using neural networks. Such an approach provides a foundational framework for the agave liqueur bottling process, which involves five machines. Once the process is stabilized, it becomes possible to establish control values and performance ranges.
Quality control inspections are fundamental to minimizing losses and waste resulting from defective raw materials. As expressed in [22] and [23], improving the raw material intake process significantly enhances the ability to control waste during handling and processing, thereby contributing to overall production efficiency.
9. Conclusions
This article provides valuable insight into how each stage of the bottling process contributes to product loss. In comparison with previous studies, it is evident that while historical data analysis is beneficial, the integration of advanced techniques—such as machine learning, preventive maintenance, and quality control—can significantly enhance the accuracy of predictions and the overall efficiency of the process.
The present study demonstrated the effectiveness of employing artificial neural networks and fuzzy logic for the analysis and prediction of production losses in an Agave Liqueur bottling system. Through the collection and processing of operational data, it was possible to model loss behaviour within the process, identifying key patterns—particularly the increase in waste associated with bottle handling and labelling operations.
The results indicate that the combination of these two artificial intelligence techniques enables accurate forecasting and supports a proactive approach to optimizing the bottling system. Implementing these models will contribute to waste reduction by identifying the most critical stages of the process, thereby allowing for the establishment of preventive measures. Reusable components such as caps, bottles, and liquid can be recovered, enhancing operational efficiency and promoting greater sustainability in production.
Future research may focus on the integration of additional machine learning techniques, as well as the real-time optimization of bottling parameters, to further minimize losses and improve process profitability.
thereby improving the quality of the liquid product. The present project complements that research by applying the same artificial intelligence tools during the second stage of the production process—bottling.
The optimization of industrial control systems through the integration of fuzzy logic and genetic algorithms, as demonstrated in [20], has proven effective in enhancing process efficiency and stability. However, that study did not address the critical role of the bottling process. Given the operational demands and the importance of this stage, it is essential to define performance thresholds to optimize production. This aligns with the findings of [21], which emphasize the importance of machine-level analysis using neural networks. Such an approach provides a foundational framework for the agave liqueur bottling process, which involves five machines. Once the process is stabilized, it becomes possible to establish control values and performance ranges.
Quality control inspections are fundamental to minimizing losses and waste resulting from defective raw materials. As expressed in [22] and [23], improving the raw material intake process significantly enhances the ability to control waste during handling and processing, thereby contributing to overall production efficiency.
9. Conclusions
This article provides valuable insight into how each stage of the bottling process contributes to product loss. In comparison with previous studies, it is evident that while historical data analysis is beneficial, the integration of advanced techniques—such as machine learning, preventive maintenance, and quality control—can significantly enhance the accuracy of predictions and the overall efficiency of the process.
The present study demonstrated the effectiveness of employing artificial neural networks and fuzzy logic for the analysis and prediction of production losses in an Agave Liqueur bottling system. Through the collection and processing of operational data, it was possible to model loss behaviour within the process, identifying key patterns—particularly the increase in waste associated with bottle handling and labelling operations.
The results indicate that the combination of these two artificial intelligence techniques enables accurate forecasting and supports a proactive approach to optimizing the bottling system. Implementing these models will contribute to waste reduction by identifying the most critical stages of the process, thereby allowing for the establishment of preventive measures. Reusable components such as caps, bottles, and liquid can be recovered, enhancing operational efficiency and promoting greater sustainability in production.
Future research may focus on the integration of additional machine learning techniques, as well as the real-time optimization of bottling parameters, to further minimize losses and improve process profitability.
References
- Herrera-Pérez, L.; Valtierra-Pacheco, E.; Ocampo-Fletes, I.; Tornero-Campante, M. A.; Hernández-Plascencia, J. A.; Rodríguez-Macías, R. (2018). Esquemas de contratos agrícolas para la producción de Agave tequilana Weber en la región de tequila, Jalisco. Agricultura, Sociedad y Desarrollo. 2018, 15, 619–637. [Google Scholar] [CrossRef]
- Valencia Sandoval, K.; Rojas Rojas, M.M.; Alvarado Lagunas, E.; Duana Avila, D. Innovación agroindustrial del agave (Agave tequilana Weber var. azul): valoración financiera para la obtención de inulina. Agro Productividad. 2020, 13, 1–6. [Google Scholar] [CrossRef]
- Valencia Sandoval, K.; Rojas Rojas, M. M.; Godínez Montoya, L. Innovación en Negocios Tradicionales: El Caso del Agave, Más Allá del Tequila. Innovaciones De Negocios. 2023, 1, 18–31. [Google Scholar] [CrossRef]
- Ceja, R.; González, D. R.; Ruiz, J. A.; Rendón, L. A.; Flores, J. G. Detección de restricciones en la producción de agave azul (Agave tequilana Weber var. azul) mediante percepción remota. Terra Latinoamericana, 2017, 35, 259–268. [Google Scholar] [CrossRef]
- Moreno-Hernández, A.; Estrella-Chulim, N.; Escobedo-Garrido, S.; Bustamante-González, A.; Gerritsen, P. W. Prácticas de manejo agronómico para la sustentabilidad: características y medición en agave tequilana weber en la Región Sierra de Amula, Jalisco. Tropical and Subtropical Agroecosystems. 2011, 14, 159–169. [Google Scholar]
- Pérez-Hernández, E.; Chávez-Parga M., C.; González-Hernández, J. C. Revisión del agave y el mezcal. Revista Colombiana de Biotecnología, 2016, XVIII, 148–164. [Google Scholar]
- Song, N. ; Xie. Y.; Ching, W.; Siu, T. A real option approach for investment opportunity valuation. Journal of Industrial & Management Optimization. 2017, 13, 1213–1235. [Google Scholar]
- Torres-Medina, Y. The analysis of human error in manufacturing: a key to improve production quality. Rev. UIS. Ing. 2020, 19, 53–62. [Google Scholar] [CrossRef]
- Carrillo-Gutiérrez, T.; Reyes-Martínez, R. M.; Arredondo-Soto, K. C.; Solis-Quinteros, M. M. Análisis del error humano y la calidad del producto en la industria de manufactura de dispositivos médicos. Estudio de caso. 3C Tecnología. Glosas de innovación aplicadas a la pyme. 2021, 10, 73–91. [Google Scholar] [CrossRef]
- Kolus, A.; Wells, R.; Neumann, P. Production quality and human factors engineering: A systematic review and theoretical framework. Applied Ergonomics. 2018, 73, 55–89, 2018. [Google Scholar] [CrossRef]
- Cortés Mora, A.A. Uso de redes neuronales e inteligencia artificial en el procesamiento y análisis de fotografías digitales para identificar bebidas embotelladas en neveras y/o góndolas. 2018. Recovery from: https://revistas.poligran.edu.co/index.php/wpmis/article/view/1075.
- Thorvald, P.; Lindblom, J.; Andreasson, R. On the development of a method for cognitive load assessment in manufacturing. Robotics and Computer-Integrated Manufacturing. 2019, 59, 252–266. [Google Scholar] [CrossRef]
- AR Racking. Merma en el almacenaje industrial: Concepto, causas y soluciones. AR Racking. 2025. Recovery form: https://www.ar-racking.com/mx/blog/merma-en-el-almacenaje-industrial-concepto-causas-y-soluciones/.
- International Organization for Standardization. Quality management systems — Requirements. 2015. Recovery from: https://www.iso.org/obp/ui/#iso:std:iso:9001:ed-5:v1:es.
- Fan, G.; Li, A.; Zhao, Y.; Moroni, G.; Xu, L. Human factors complexity measurement of human-based station of assembly line. Human Factors and Ergonomics in Manufacturing & Service Industries. 2018, 28, 342–351. [Google Scholar] [CrossRef]
- Santos López, F.M.; Santos de la Cruz, E. Aplicación de un modelo para la implementación de logística inversa en la etapa productiva. Industrial Data. 2010, 13, 32–39. [Google Scholar] [CrossRef]
- Salas-Arias, K.M.; Madriz-Quirós, C.E.; Sánchez-Brenes, O.S.; Sánchez-Brenes, M.; Hernández-Granados, J.B. Factores que influyen en errores humanos en procesos de manufactura moderna. Revista Tecnología en Marcha, 2018, 31, 22–34. [Google Scholar] [CrossRef]
- Ferrer-Blas, R.I.; Galarcep-Barba, I.; Solano-Gaviño, J.C. Lean Manufacturing en la producción de alimentos: Revisión sistemática, análisis bibliométrico y propuesta de aplicación. Scientia Agropecuaria, 2024, 15, 569–579. [Google Scholar] [CrossRef]
- Bowler, A.; Escrig, J.; Pound, M.; Watson, N. Predicting alcohol concentration during beer fermentation using ultrasonic measurements and machine learning. Fermentation (Basel). 2021, 7, 1–13. [Google Scholar] [CrossRef]
- Mariajayaprakash, A.; Senthilvelan, T.; Gnanadass, R. Optimization of process parameters through fuzzy logic and genetic algorithm–A case study in a process industry. Applied Soft Computing. 2015, 1, 94–103. [Google Scholar] [CrossRef]
- Averill, A.F. The usefulness and application of fuzzy logic and fuzzy AHP in the materials finishing industry. Transactions of the Institute of Metal Finishing. 2020, 98, 224–233. [Google Scholar] [CrossRef]
- Vargas-Hernandez, J.G. Steadiness approach and change approach in perspective of industrial engineer. Ingeniería Industrial Actualidad y Nuevas tendencias. 2016, 17, 153–174. [Google Scholar]
- Kayri, M. Predictive abilities of bayesian regularization and Levenberg–Marquardt algorithms in artificial neural networks: A comparative empirical study on social data. Mathematical and Computational Applications, 2016, 21, 1–11. [Google Scholar] [CrossRef]
- Gijsbrechts, J.; Boute, R.N.; Van Mieghem, J.A.; Zhang, D.J. Can deep reinforcement learning improve inventorymanagement. Performance on dual sourcing, lost sales and multi-echelon problems. Manufacturing & Service Operations Management. 2022, 24, 1349–1368. [Google Scholar]
- Oroojlooyjadid, A.; Nazari, M.; Snyder, L. V.; Takac, M. A deep q-network for the beer game: Deep reinforcement learning for inventory optimization. Manufacturing & Service Operations Management 2022, 24, 285–304. [Google Scholar] [CrossRef]
Figure 1.
Liquor plant supply chain.
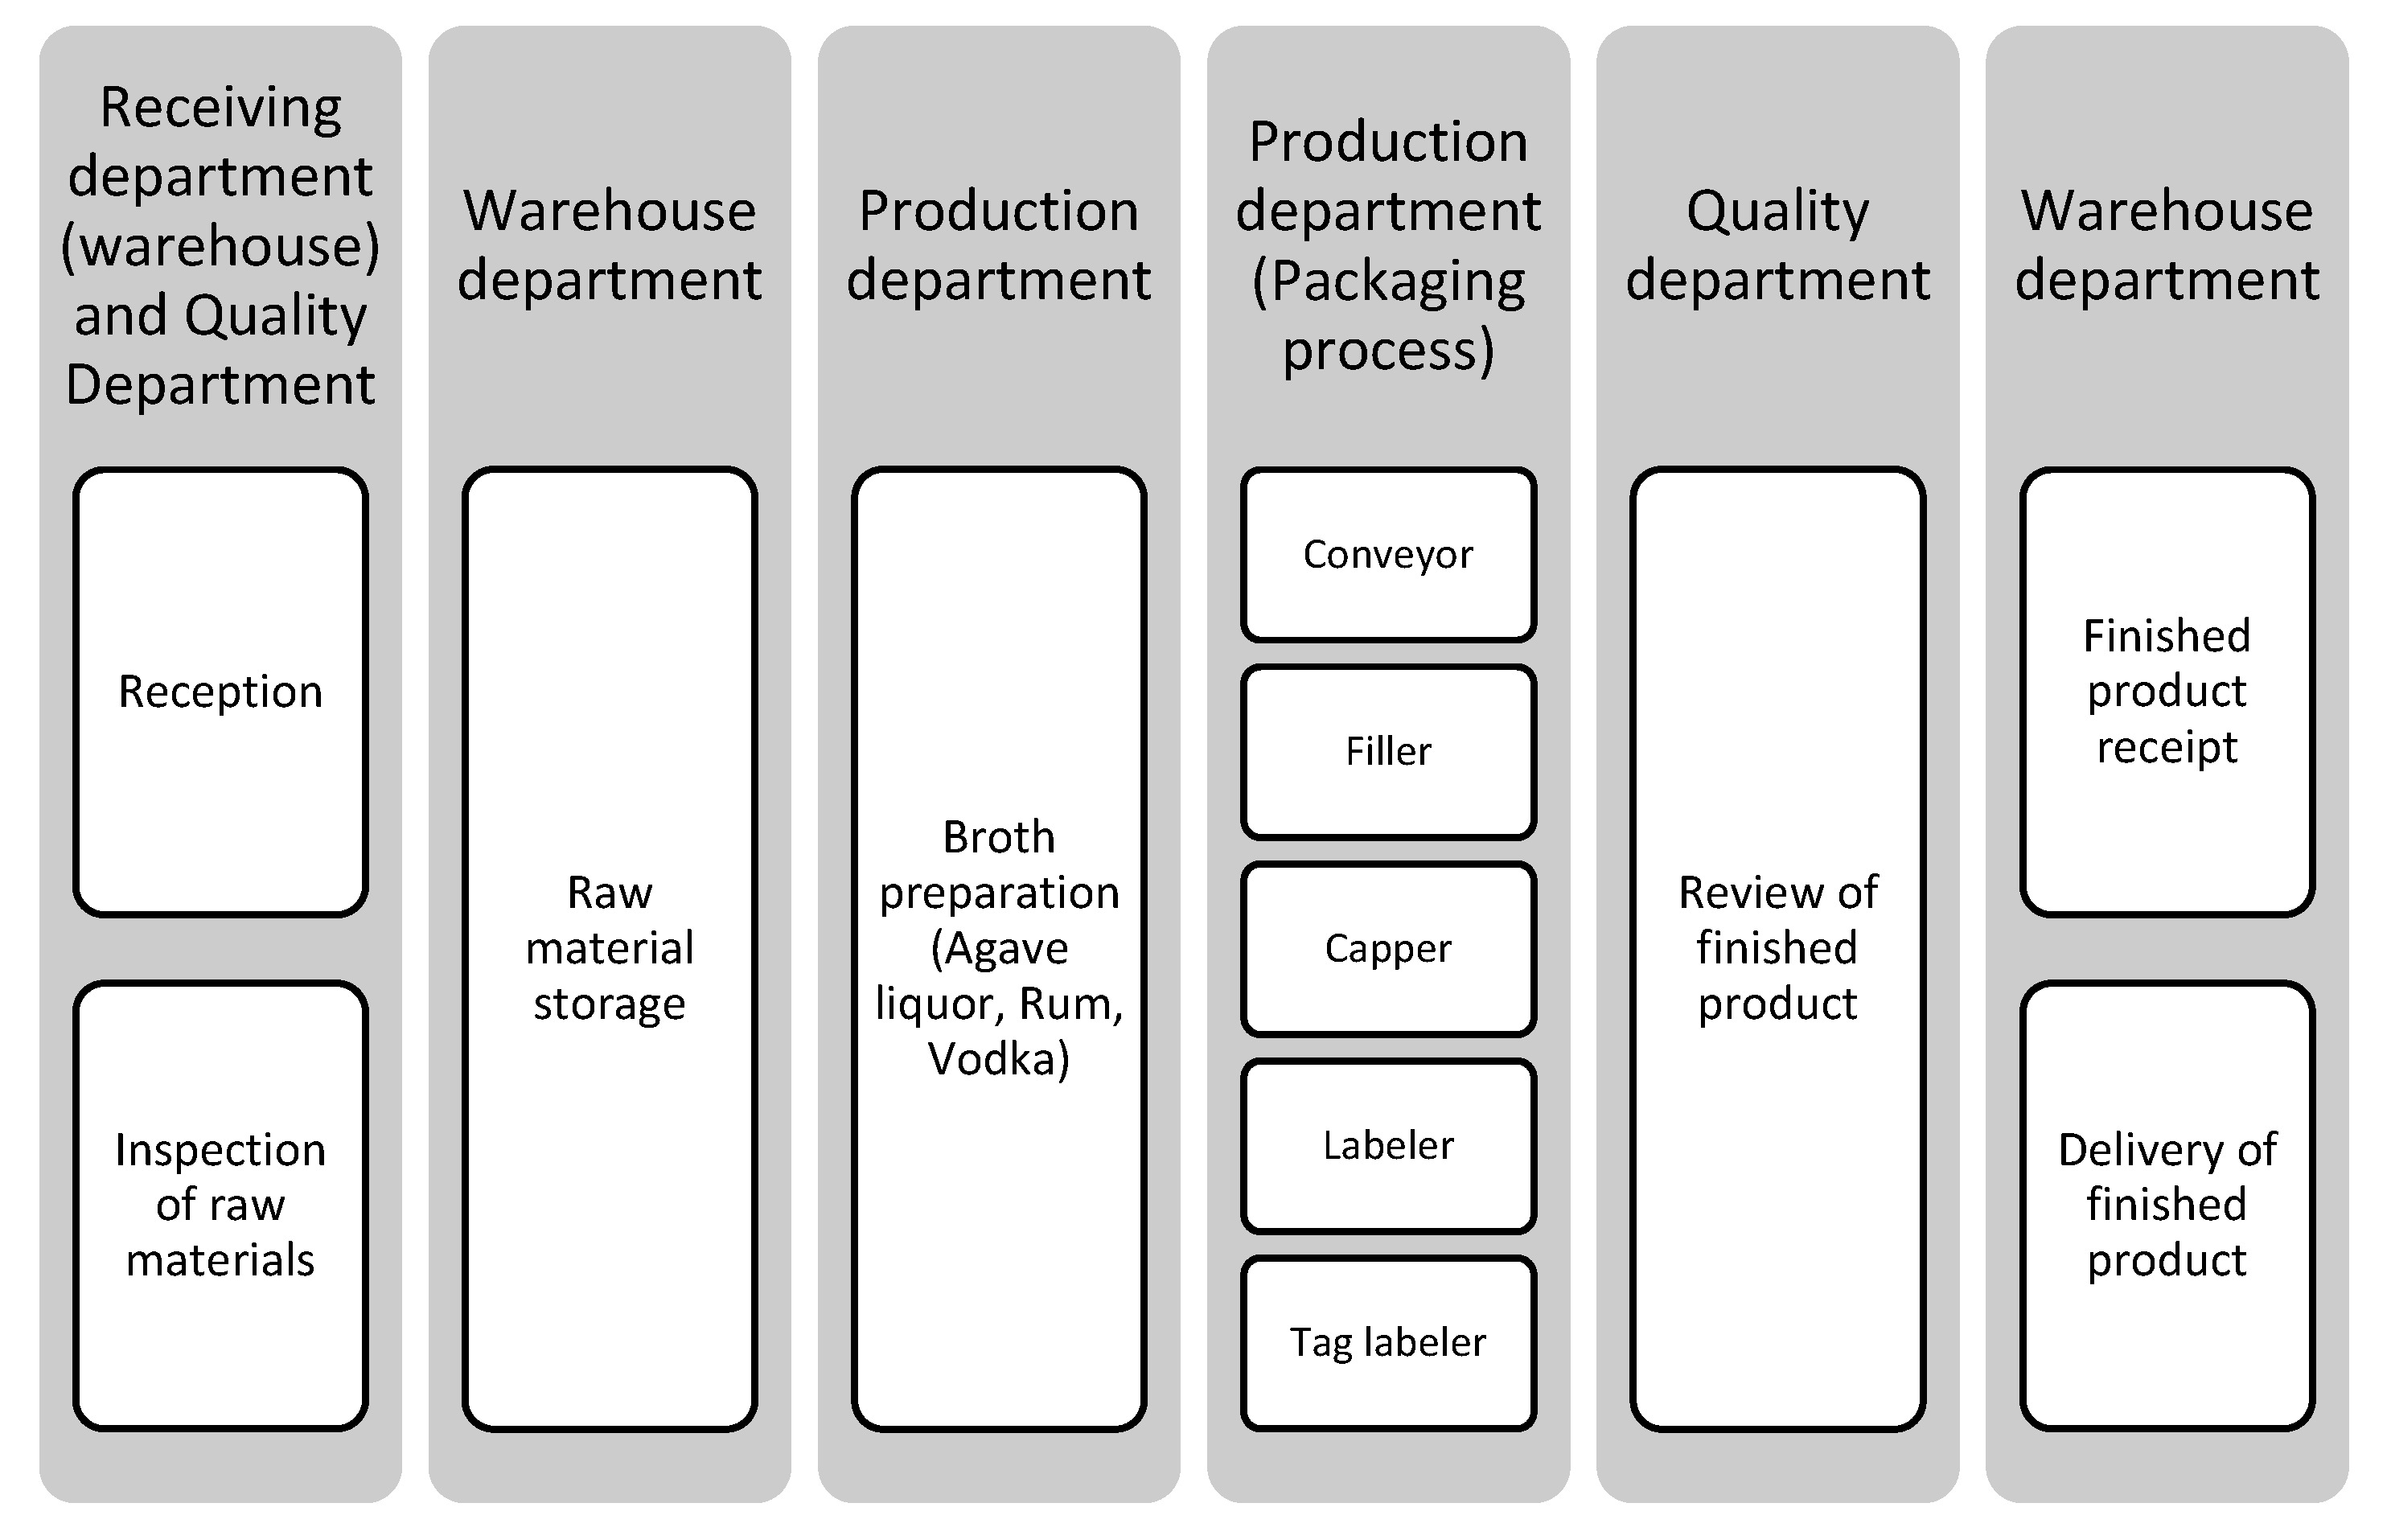
Figure 6.
Biogas storage system.
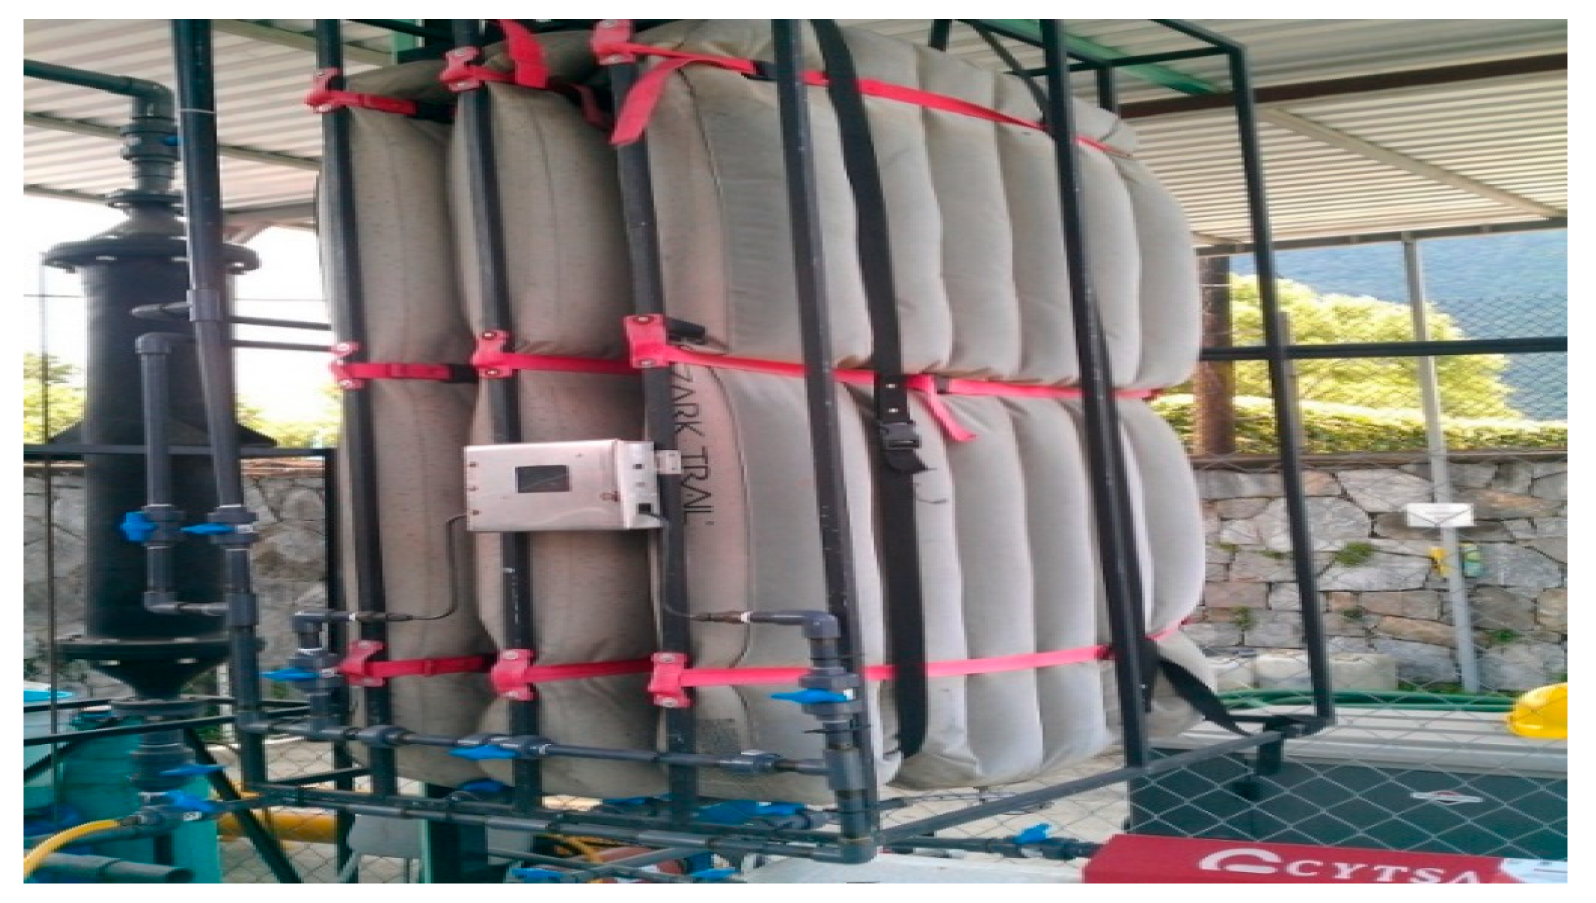
Figure 7.
Evolution of state variables during training.
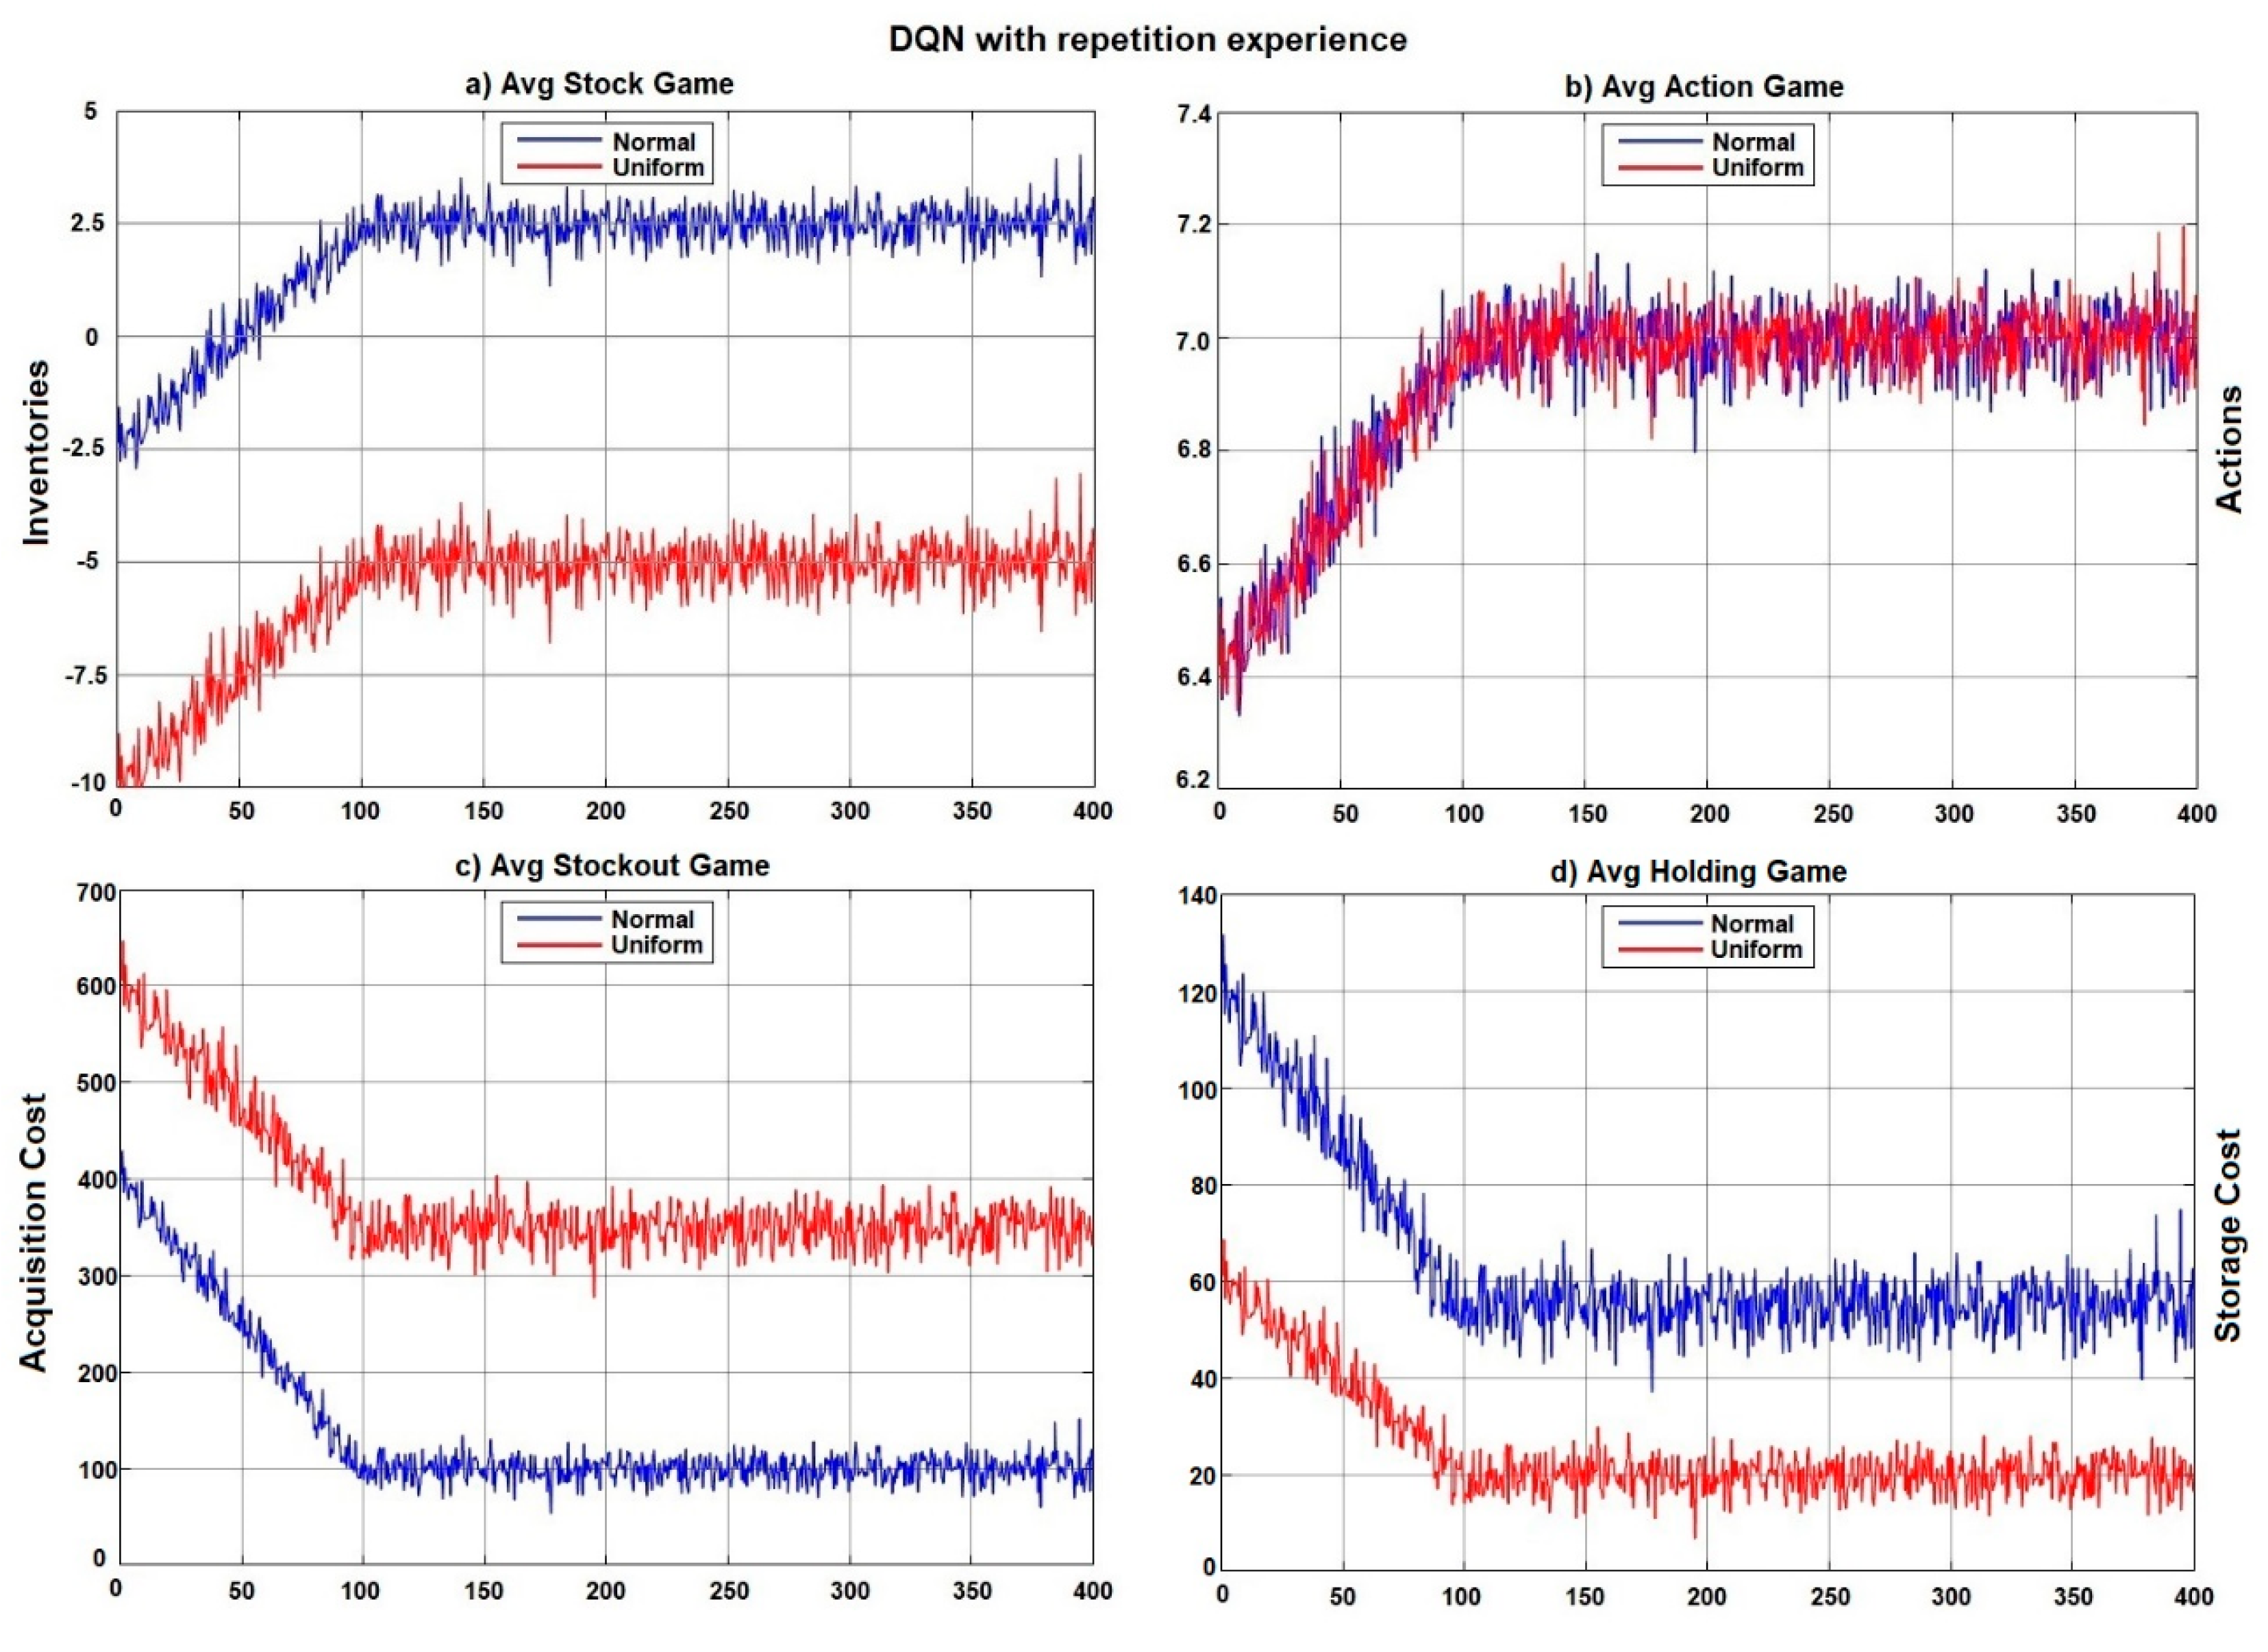
Figure 9.
Fuzzy rules for the model.
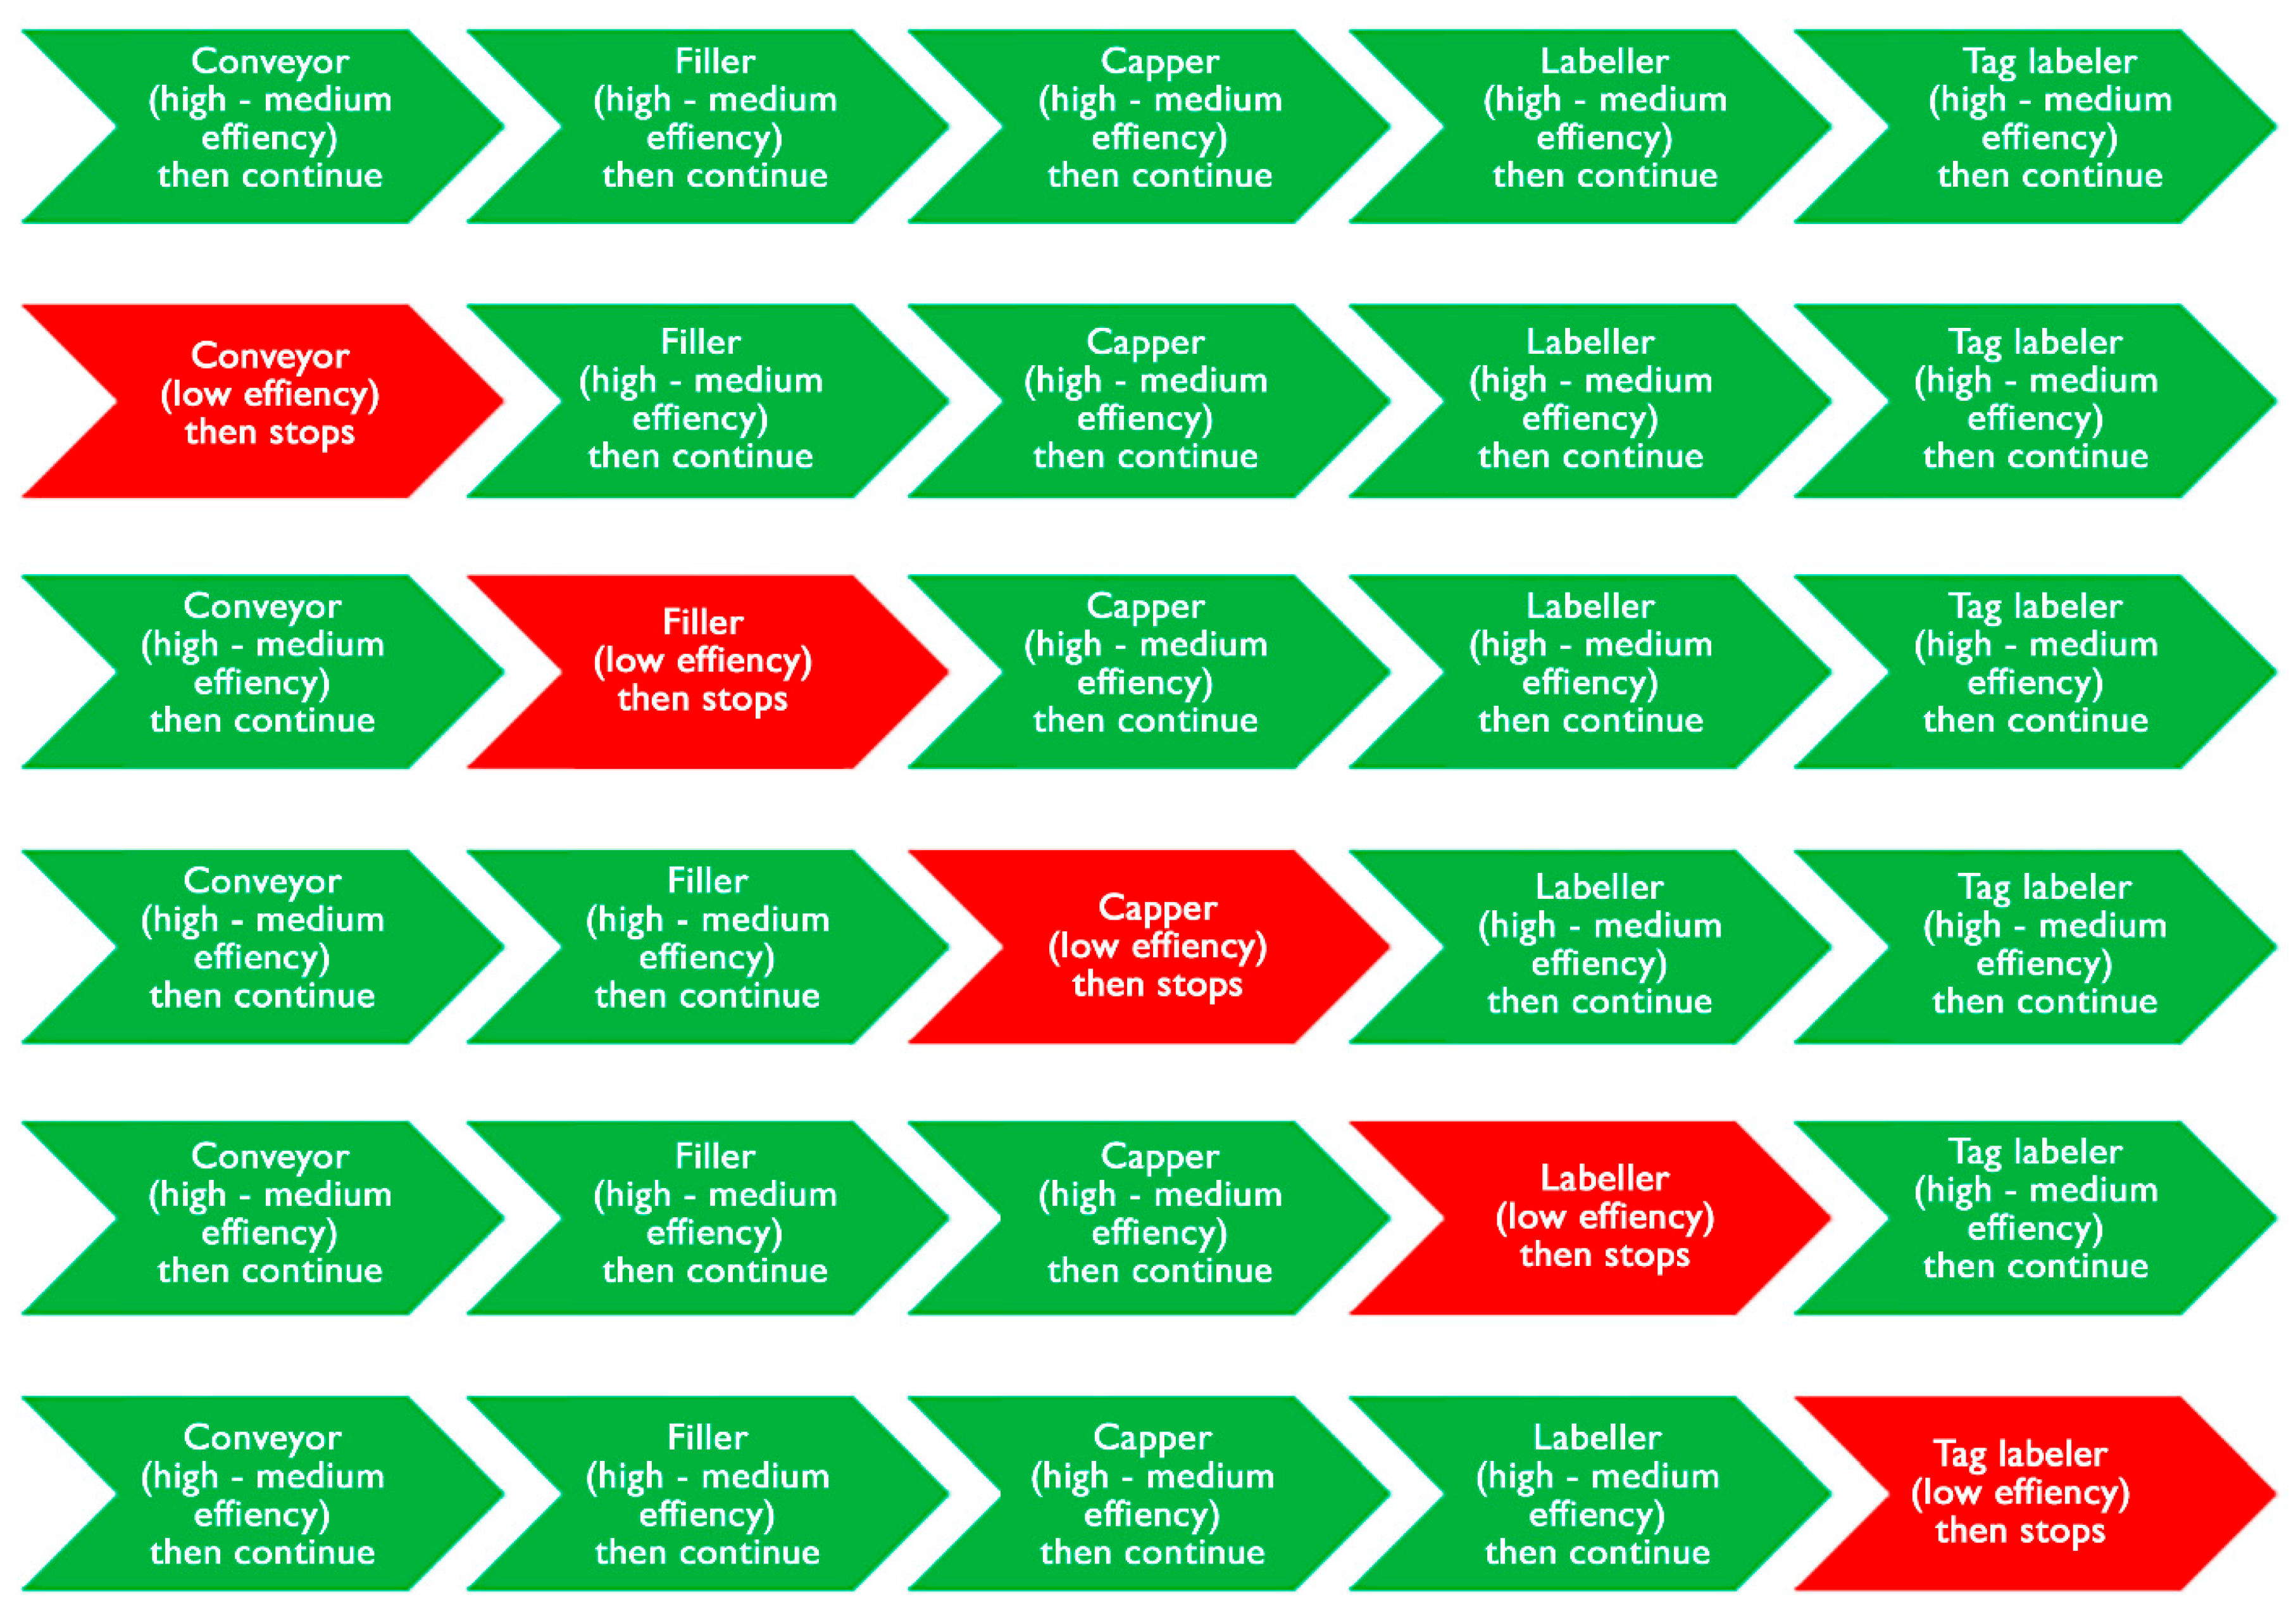
Table 1.
Example of eproductioen data for the first half of 2024.
| 2024 | SHIFT | LINE MANAGER | LINE 1 | PRODUCTION PLAN | MACHINE FAILURES |
|
|---|---|---|---|---|---|---|
| WEEK 1 | MONDAY | SHIFT 1 | Worker A | 1715 | 1800 | 0 |
| SHIFT 2 | Worker B | 1755 | 1800 | 0 | ||
| TUESDAY | SHIFT 1 | Worker A | 1812 | 1800 | 0 | |
| SHIFT 2 | Worker B | 1760 | 1800 | 0 | ||
| WEDNESDAY | SHIFT 1 | Worker A | 1653 | 1800 | 1 | |
| SHIFT 2 | Worker B | 1747 | 1800 | 1 | ||
| THURSDAY | SHIFT 1 | Worker A | 1890 | 1800 | 0 | |
| SHIFT 2 | Worker B | 1816 | 1800 | 0 | ||
| FRIDAY | SHIFT 1 | Worker A | 1763 | 1800 | 1 | |
| SHIFT 2 | Worker B | 1682 | 1800 | 2 | ||
| SATURDAY | SHIFT 1 | Worker A | 1708 | 1800 | 1 | |
| SHIFT 2 |
Table 2.
Examples of data on losses first half.
| WEEK | DAY | SHIFT | LINE | CAP | LABEL | LIQUID | BOTTLE | TAG | BOX |
|---|---|---|---|---|---|---|---|---|---|
| WEEK 1 | MONDAY | SHIFT 1 | LINE 1 | 1.46 | 1.74 | 4.51 | 5.22 | 2.09 | 4.86 |
| SHIFT 2 | LINE 1 | 1.45 | 2.02 | 4.35 | 3.63 | 3.80 | 3.54 | ||
| TUESDAY | SHIFT 1 | LINE 1 | 3.60 | 4.84 | 2.83 | 4.93 | 3.14 | 4.06 | |
| SHIFT 2 | LINE 1 | 4.76 | 2.10 | 5.51 | 5.71 | 2.35 | 3.68 | ||
| WEDNESDAY | SHIFT 1 | LINE 1 | 1.85 | 3.48 | 4.71 | 3.22 | 2.98 | 4.10 | |
| SHIFT 2 | LINE 1 | 4.16 | 4.72 | 2.92 | 4.54 | 1.34 | 5.46 | ||
| THURSDAY | SHIFT 1 | LINE 1 | 3.61 | 1.89 | 3.37 | 2.60 | 1.08 | 3.84 | |
| SHIFT 2 | LINE 1 | 3.44 | 4.82 | 5.18 | 2.55 | 3.28 | 2.43 | ||
| FRIDAY | SHIFT 1 | LINE 1 | 2.46 | 5.85 | 5.65 | 1.92 | 2.38 | 4.99 | |
| SHIFT 2 | LINE 1 | 3.01 | 5.46 | 4.80 | 1.48 | 1.75 | 3.36 | ||
| SATURDAY | SHIFT 1 | LINE 1 | 2.31 | 2.04 | 3.71 | 2.83 | 3.35 | 4.44 | |
| SHIFT 2 | LINE 1 |
Table 4.
Configuration of hyperparameters.
| Hyperparameters | Values |
|---|---|
| Gamma | 0.9 |
| Learning rate | 0.00001 |
| Agent history (m) | 3 |
| Number of neurons per layer | [128, 64, 32] |
| Activation function | [RELU, RELU, RELU, LogSigmoide ] |
| Loss function | MSE |
| mini batch size | 64 |
| Optimization algorithm | Adam |
Disclaimer/Publisher’s Note: The statements, opinions and data contained in all publications are solely those of the individual author(s) and contributor(s) and not of MDPI and/or the editor(s). MDPI and/or the editor(s) disclaim responsibility for any injury to people or property resulting from any ideas, methods, instructions or products referred to in the content. |
© 2025 by the authors. Licensee MDPI, Basel, Switzerland. This article is an open access article distributed under the terms and conditions of the Creative Commons Attribution (CC BY) license (http://creativecommons.org/licenses/by/4.0/).
Copyright: This open access article is published under a Creative Commons CC BY 4.0 license, which permit the free download, distribution, and reuse, provided that the author and preprint are cited in any reuse.


