Submitted:
16 July 2025
Posted:
17 July 2025
You are already at the latest version
Abstract
Application of intense infrared (IR) laser to analyze carbohydrate polymers is shown. IR free electron laser (FEL) driven by a linear accelerator possesses unique spectroscopic features in terms of extensive wavelength tunability and high laser energy in the IR region from 1000 cm-1 (10 mm) to 4000 cm-1 (2.5 mm). The FEL can induce IR multiphoton dissociation reaction against various molecules by giving the vibrational excitation energy to the corresponding chemical bonds. Chitin from crayfish and cellulose fiber were irradiated by the FELs that are tuned to nC-O (9.1-9.8 mm), nC-H (3.5 mm), and dH-C-O (7.2 mm) in glycoside bonds, and their low-molecular weight sugars were separated, which were revealed by combining synchrotron-radiation IR spectroscopy and electrospray ionization mass spectrometry. The intense IR laser can be proposed as “molecular scalpel” for dissecting and direct analyzing internal components in rigid biopolymers.
Keywords:
infrared
; free electron laser
; carbohydrate
; polysaccharides
; vibrational excitation
; multiphoton dissociation
; synchrotron radiation
1. Introduction
Carbohydrate is one of key players along with protein, nucleic acid, and lipid among biological polymers in biochemical system [1,2,3]. Especially, polysaccharides (containing more than 20 monomeric sugars) exist at various states in nature, for example, as components of plant tissues [4,5], cellular matrices of animal tissues [6,7], outer shells of insect and crustacean [8,9,10], and cell wall of microorganism [11,12]. There are two types of natural polysaccharides regarding the chemical composition: homo-glycan and hetero-glycan. In the former type, amylose, amylopectin, and glycogen are composed of glucosyl bonds that are linked via α-1, 4 or α-1, 6 bonds [13,14,15]. Cellulose is polymerized by β-1,4 bonds [16,17], and chitin is constructed by β-1,4GcNAc units [18,19]. Both polysaccharides are structured by fiber-like carbohydrate chains, contrasting to globular chains in starch. In the hetero-glycan, heparin is composed of glucosamine and iduronic acid [20,21], hyaluronic acid is constructed by glucuronic acid and N-acetylglucosamine [22,23], and glucomannan is polymerized by glucose and mannose [24,25]. Those carbohydrate polymers perform important roles in the expression of biological functions in addition to potential resources of pharmaceutical agents and food additives [26,27]. To understand the functional roles of those carbohydrates in biological system, it is much necessary to disclose the detailed structure of polysaccharides.
In many cases, it is important for characterization of whole structures of parent carbohydrate polymers to analyze a part of the oligomerized or the monomeric states. For detection of monomeric sugars, colorimetric assay is conventionally used [28,29,30,31,32,33]. For example, anthrone-sulfuric acids can be widely applied for aldose and reducing sugars [28,29,30], Elson-Morgan method using Ehrlich reagent is used for detection of glucosamine [31], and carbazole-sulfuric acid is effective for detection of uronic acids [32,33]. In the clinical chemistry, fluorescence labeling method was developed due to requiring for detection of small amounts of sugar ingredients in biological tissues [34,35]. Quantification of glucose in blood by using fluorescent-labeling boronic acid derivatives [34] and detection of glucose and lactose in serum by using fluorescent iron complex combined with oxidases are developed [35]. For analysis of oligosaccharide structures, various fluorescent labeling reagents are developed as well, and especially, 2-amino pyridine is useful in derivatization of oligosaccharides for detection by high performance liquid chromatography (HPLC) [36,37]. Capillary electrophoresis (CE) can also be a powerful tool for investigating molecular weights of various types of sugars more sensitively than the conventional HPLC [38,39].
As for structural analysis of natural polysaccharides, major analytical techniques are listed in Table 1.
Amylose content is analyzed by various quantitative and qualitative methods including near infrared (NIR) and Raman spectroscopies, CE, and atomic force microscopy (AFM) [40]. Also, size-exclusion chromatography (SEC), multiple-angle laser light scattering (MALLS), and 1H nuclear magnetic resonance (NMR) are employed for analysis of the soluble fraction in hot water from rice flour [41]. Amylopectin from corn starch is analyzed by SEC, MALLS, and differential scanning calorimetry (DSC) [42]. In addition, starch alteration by enzymatic hydrolysis is thoroughly investigated by scanning-electron microscope (SEM), X-ray diffraction (XRD), Fourier transform infrared (FT-IR) spectroscopy, 1H NMR, high-performance anion exchange chromatography with pulsed amperometry detection (HPAEC-PAD), DSC, and Rapid Visco Analyzer (RVA) [43]. In particular, HPAEC-PAD is a reliable tool for determining carbohydrate chain length distribution in natural polysaccharides [44]. Glycogen associated with lung disease can be analyzed by matrix-assisted laser desorption/ionization-mass spectrometry imaging (MALDI-MSI) combining with N-glycosidase hydrolysis [45]. Photoacoustic spectroscopy (PAS) and 1H NMR can be utilized for investigating fiber and crystallin conformations of cellulose [46]. In addition, thermogravimetric (TG) analysis was introduced as a new method for determining the relative contents of cellulose, hemicellulose, and lignin in biomass samples [47]. Chitin is analyzed by various methods by using FT-IR, XRD, SEM, UV-Vis-spectroscopy, mass spectrometry (MS), and NMR spectroscopy [48,49]. Heparin can be quantitatively analyzed by enzymatic digestion followed by liquid-chromatography (LC)-MS and strong anion exchange (SAX) chromatography [50]. Particularly, attenuated total reflectance (ATR) FT-IR is employed for analysis of solid-phase samples from a library of various glycosaminoglycan [51]. The molecular distribution of hyaluronic acid can be analyzed by using HPLC-SEC system [52], and solid-state nanopore sensor is developed as a more sensitive detector [53]. Sugar composition of glucomannan can be analyzed by ion exchange chromatography and gel permeation chromatography followed by combining thin-layer chromatography (TLC), FT-IR, and 13C NMR [54]. N-glycan is analyzed by CE combined with MALDI-MS and electrospray ionization (ESI)-MS [55].
In general, deproteinization and extraction using water and organic solvents at low- or high- temperatures are frequently employed as pre-treatments for collecting polysaccharides from natural resources prior to spectroscopic studies [56]. In addition, enzymes are applied to cleave the co-valent bonds in the glycol-polymers to separate monolithic functional carbohydrates from the complex polymerized materials [57]. Those procedures are actually necessary for isolating and analyzing polysaccharides distinct from other ingredients such as proteins, but it is undeniable that the stepwise routine process is often time-consuming.
2. Feature of Method
Many biological and organic molecules possess mid-and near- IR absorption bands from 1000 to 4000 cm−1 (= 2.5 to 10 μm): C=O stretching at 1600−1800 cm−1 (5.5−6.0 μm), N−H bending at 1400−1600cm−1 (6.0−7.0 μm), H−C−O bending at 1200−1300 cm−1 (7.0−7.5 μm), and O−H, N-H, and C-H stretching vibrational modes at 2500−3000 cm−1 (3.0−4.0 μm) [61,62]. If an intense IR laser is irradiated onto an organic molecule, IR multi-photon dissociation (IRMPD) reaction can be induced by the vibrational excitation (VE) energy with the corresponding resonant wavelength, and the chemical bond can be dissociated by the VE energy that exceeds the bond energy [63,64,65]. The IRMPD can be facilitated by IR free electron laser (FEL) [66,67].
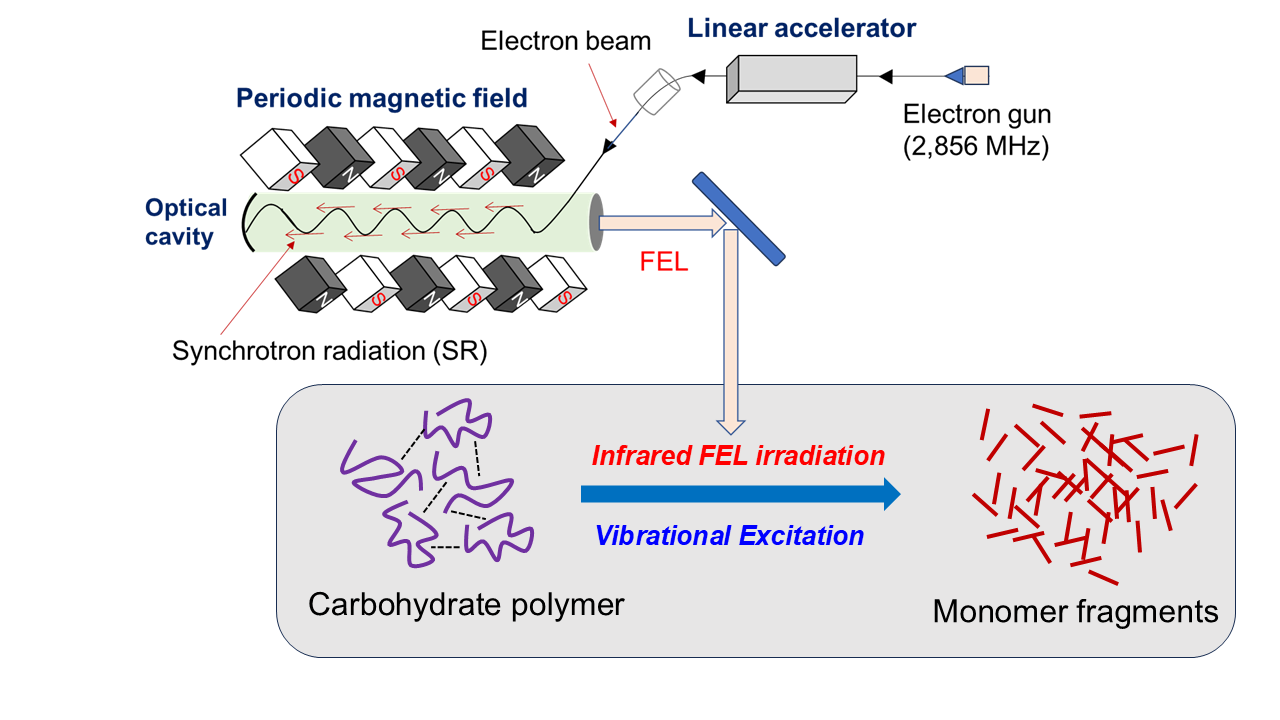
Oscillation of FEL is based on a successive interaction of accelerated electron beam (EB) with synchrotron radiation (SR) in a periodic magnetic field called as undulator (Figure 1) [68,69,70,71,72,73,74]. The EB is originated from a radiofrequency (RF) electron gun (2,856 MHz) and is accelerated to 100 MeV by an RF linear accelerator. The SR is stored in an optical cavity, which possesses concave mirrors at both ends. The stored SR is amplified through FEL interactions with EB. As the result, FEL lasing and power saturation can be achieved and highly coherent intense laser light is extracted through a coupling hole in one of the concave mirrors (Figure 1).
Samples are typically put on a slide base or put in a glass tube, and the laser beam can be transported from a beam port onto the sample surface as shown in Figure 2. Since the size of the transported FEL beam is large (>10 mm in diameter), a focusing lens or an off-axis parabola mirror is used for focusing FEL beam onto the sample.
The infrared FEL has unique characteristics compared to thermal light source in laboratory-level IR spectroscopy instrument as follows (Figure 3):
(1) Tunable wavelengths
The oscillation wavelengths of the FEL are tunable generally within the 2.0 - 20 μm (5,000 – 500 cm-1) range, which covers the absorption frequencies of various vibrational modes of biomolecules (Figure 3a). Many organic molecules have a variety of vibrational modes such as C=O stretching, N-H bending, H-C-O bending, and O-H stretching vibrational modes at 1000-3000 wavenumbers (cm-1). The FELs can excite those vibrational modes wavelength-selectively, and the IRMPD reaction can modify the chemical structure of many molecules in biological matters, gas-phase chemicals, and organic materials. A wavelength of the oscillation beam can be tuned by adjusting the space interval of the undulator or changing the kinetic energy of EB. The typical FEL spectra at 5.8 μm (1,724 cm-1) and 9.6 μm (1,041 cm-1) are shown in Figure 3b [75]. The full-width at half maximum was approximately 100–300 nm in both wavelengths.
(2) Pulse structure
The FEL has complex temporal structure called “pulse train” or “burst pulse,” where several thousands of micro-pulses having 0.1-2 ps duration are bunched in one macro-pulse [70,71]. One macro-pulse has 2-15 μs duration, and the repetition rate is ranged from 2 to 5 Hz. The interval of the micro-pulse is 350 ps that is originated from the frequency of electronic gun (2,856 MHz). In the burst mode experiments, micro-pulse rate is divided by 64 (44.6 MHz), where one macro-pulse consists of several hundred micro-pulses [72,73,74].
(3) High laser energy
The macro-pulse energy is ranged from 5 to 25 mJ, and the beam diameter can be set to approximately 200−400 μm on the sample surface by using a parabolic mirror or a focusing lens made of CaF2 (f = 100 mm) in general. The irradiation effect of the FEL at various fluences on the sample can be investigated by changing the laser energies.
We applied the FEL to analyze solid-phase carbohydrate polymers with combination of synchrotron-radiation infrared microscopy (SR-IRM) and ESI-MS. It can be suggested that the FEL can unveil the persistent structure of the carbohydrates accompanied by releasing their monomeric units without any pre-treatments under atmospheric conditions. The use of SR-IRM analysis improves the spatial resolution with a high signal-to-noise (S/N) ratio compared to that using a thermal radiation beam in laboratory-level instrument because high-energy light can be focused onto a small area (several micro-meters squares) of a dry sample film [76,77].
Analytical studies of two representative carbohydrates by using FELs are shown as described below.
3. Analysis of Chitin
Chitin is a main component of outer shell of crustaceans including shellfish, shrimp, crab, and beetle [78,79]. We analyzed natural powder of the outer shell of crayfish by using the FEL oscillation system (Figure 4-6) [58]. Several adult crayfishes (Procambarus clarkii) were collected from local ponds and maintained in separate plastic containers under a dark/light cycle of 12 h/12 h, and fresh water was changed during feeding. Five molting shells were collected and one solid arm was rip out from the shell and mashed in a mortar, and the resulting powder (ca. 50 mg) was placed in a 5 mL triangular flask. This powder was directly subjected to the FEL irradiation (Figure 4). For detection of conformational changes of polysaccharide structure, SR-IRM in BL6B of UVSOR was used [80]. The instrument was composed of an IRT-7000 IR microscope combined with an FT/IR-6100 series spectrometer, and the mid-IR spectra were measured by Michelson-type interferometer in reflection mode. The sample powder (ca.10 mg) was suspended in water (1 mL), and the mixture (20 μL) was placed on a stainless-steel base. After drying, the plate was put on a horizontally mutable stage, and observations were performed by 16 × Cassegrain lens with an aperture of 50 μm × 50 μm.
The broadband peak around 1100 cm-1 corresponds to the glycoside bond (νC-O), and the intensity was largely decreased after the irradiation at 9.8 μm compared to the non-irradiation (Figure 5). In addition, both peaks at 1550 cm-1 and at 1650 cm-1 were clearly decreased by the irradiation. This region contains N-H bending vibrational mode and C=O stretching vibrational mode of N-acetylglucosamine residues in chitin, respectively. Therefore, it can be implied that a part of carbohydrate chain in crayfish was cleaved, and the N-acetylglucosamine was released by the irradiation.
LC-ESI-MS analysis is shown (Figure 6). An elution peak at 4.6 min was more increased in the case of irradiation at 9.8 μm than the case of irradiation at 5.0 μm (low-absorption wavelength), and other peaks are hardly changed. The increased eluate indicates N-acetylglucosamine (b). Mass chromatograms showed that the intensity of mass peaks corresponding to 243 Da was more increased at 9.8 μm than at 5.0 μm (c). The mass value of 243 Da corresponds to a sodium ion adduct of N-acetylglucosamine residue (221 Da) because of negative-ion mode measurement.
Next, commercially available chitin powder was irradiated by the FEL, and SR-IRM spectra of the chitin is shown in Figure 7. A peak at 1005 cm-1 corresponding to νC-O was decreased (upper) compared to the irradiation at 5.0 μm (2,000 cm-1) (middle) and non-irradiation (bottom) after irradiation at 9.8 μm (1020.4 cm-1). Amide carbonyl band at 1651 cm−1 (νC=O) in N-acetyl glucosamine residues was more increased than the peak at 1617 cm-1 after irradiation at 9.8 μm (upper) compared to the irradiation at 5.0 μm (middle). Therefore, the glycoside bonds were cleaved and the main chain of chitin was deformed by the C-O targeting irradiation similarly with the outer shell of crayfish. Taken together, it can be concluded that the FEL irradiation at 9.8 μm can degrade the chitin chain and release N-acetylglucosamine units. This method requires no pretreatment such as boiling in acidic water or solubilization using organic solvents.
4. Analysis of Cellulose
Cellulose is a major element of woods, and the degradation product, mono- and oligo-saccharides, attract attentions as the carbon source of bacteria fermenting bioethanol [81,82]. In addition, cellulose nanofibers are developed as functional biomaterials such as biocompatible cell membranes, antibacterial sheets, and food packaging composites in healthcare and pharmaceutical industry [83,84]. However, the cellulose is structured by many glycoside linkages and is generally difficult to be chemically regulated. As shown in SR-IRM spectrum of cellulose (Figure 8), there are four bands at 9.1, 7.2, 3.5 μm, and 3.0 μm [59]. These bands can be assigned to νC−O, δH−C− O, νC−H, and νO−H around the acetal carbon in cellulose, respectively. The FEL was tuned to those wavelengths and irradiated to the cellulose fiber in a glass bottle at room temperature under atmosphere.
The cleavage of the glucoside bonds was revealed by SR-IRM analysis (Figure 9). The νC−O modes are observed from 1000 to 1100 cm−1 (right panel), and after irradiations at 9.1 μm, and 9.1 μm following 7.2 μm, or 3.5 μm, these bands were clearly decreased compared to the non-irradiation (top) and irradiation at 3.0 μm (bottom). In the NIR region at around 3400 cm−1 (gray dotted line), the half width (as indicated by a double-headed arrow) was about 350 cm−1 in the non-irradiation sample (top) and 400 cm−1 in the sample after irradiation at 3.0 μm (bottom). On the contrary, all three irradiations at 9.1 μm, 9.1 μm following 7.2 μm, and 9.1 μm following 3.5 μm shortened the half width to about 300 cm−1. These changes in the hydroxy group region mean that the FEL irradiations except for 3.0 μm largely altered the structure of cellulose from the non-irradiation sample. Together with the spectral change in the mid-IR region, it is surely that the irradiations targeting the acetal group caused the dissociation of the glucoside bonds in the cellulose.
ESI-MS profiles of the non-irradiated sample (a) and samples after irradiation at 9.1 μm following 7.2 μm (b) and 3.5 μm (c) are shown in Figure 10. There were many peaks detected after irradiations compared to the non-irradiation. This indicates that these irradiations caused fragmentation of the cellulose chain. Mass peaks at 689.2, 527.2, 365.1, and 203.0 Da can be assigned to tetra-saccharide, tri-saccharides, cellobiose, and glucose as each sodium ion adduct, respectively.
Productions of cellobiose and glucose can also be investigated by mass chromatography analysis (Figure 11). The continuous irradiations at 9.1 μm following 3.5 μm (light green) and 7.2 μm (deep blue) afforded more amount of cellobiose than the singe irradiation at 9.1 μm (brown), and the continuous irradiations following 3.5 μm was most effective for production of glucose. It can be considered that the VE at 3.5 μm can disrupt the interchain hydrogen bonds and unveil the fiber structure, which leads to cleavage of the glucoside bonds by the IRMPD reaction at C−O stretching vibrational mode. The irradiation at 3.0 μm (light blue) that corresponds to the O−H stretching mode was not effective for production of those saccharides. This implies that the glucoside bond was not affected by the activation of the hydroxy group.
5. Discussion
In this study, we show a physicochemical approach using an intense IR laser as a “molecular scalpel” to analyze solid-phase carbohydrate polymers using chitin and cellulose as model samples. In the case of chitin, the glycoside bonds were cleaved by laser irradiation targeting the C−O stretching vibrational mode (9.8 μm), and N-acetylglucosamine residue was released from the crude shells of crayfish. In the case of cellulose, the continuous irradiation targeting C-O and C-H stretching modes was effective for the cleavage of the glucoside bonds. It can be estimated that the VE giving to the acetal group is effective in degrading polysaccharides into their monomeric sugars.
The physical method using intense IR laser requires no specific conditions such as acidic or alkaline solutions, organic solvents, high pressures, and high temperature, although high electric power for maintaining the instrument operation is needed. One beneficial point of the use of FEL for analysis of complex polymers is the wavelength-tunability. For example, both cleavage of glycoside bonds and dissociation of the hydrogen bonds in the assembled carbohydrate chains can proceed in one sample tube by changing the irradiation wavelengths. Furthermore, the laser-induced dissociation reaction can be completed within several shots of macro-pulse (several milliseconds) due to the pulse structure of the FEL. These physical characteristics have an advantage over the biochemical system using microbial enzymes with regard to the rapidness and the simplicity of the experiment setup. By the similar approach, we can modify lignin that is one of major components of woods alongside cellulose, and the rigid aromatic polymer can be analyzed by the FEL irradiation [60].
Finally, we suggest other possible applications of the FEL in polymer science. Similarly with natural carbohydrates, textile fiber is also rigid polymers. For example, fiber plastics such as polyester and polyamide, fiber proteins such as wool keratin and silk fibroin are polymerized by co-valent linkages of C-C, C-O, and C-N bonds [85,86,87,88]. Textiles often contain dyes, and those insoluble materials cause environmental pollution [89]. As for analysis of dyes, CE is frequently used, and heating with strong acids or alkaline solutions are employed as the pre-treatments [90]. A direct analysis of textile dyes was pioneeringly performed by using matrix-assisted IR laser desorption electrospray ionization mass spectrometry [91]. In that study, the IR laser was tuned to 2.9 μm corresponding to O-H stretching mode of water, which induced desorption of particles of textile fiber. We can suppose the use of FEL as molecular dissection tool for analysis of textile fibers. The textile organic materials exhibit many IR absorption bands as C-O stretching and N-H bending modes, and the irradiation experiments can be performed on the above organic fibers if the FEL can be tuned to those wavelengths. It can be expected that the fragmentation patterns of fibers are different dependent on the irradiation wavelengths, which can allow us to estimate the molecular compositions of the fiber structures. In addition, the monomer materials can be produced from the rigid polymerized fibers by the laser irradiation, and the system can be applied to regenerate the textiles that are wasted in the soil and ocean environments.
As another persistent polymers, per- and poly-fluorinated alkyl substances (PFAS) can be represented, and those small amounts of contaminations including in drinking water are analyzed by solid-phase extraction followed by liquid chromatography/tandem mass spectrometry (LC/MS/MS) [92]. In addition, PFAS contents along with volatile organic compounds in kitchenware are investigated by using GC-MS [93]. We can suppose that the FEL irradiation can affect the conformation of PFAS dependent on the specific wavelengths. Stretching vibrational mode of C-F is observed at 1000-1500 cm-1, and the VE energy targeting the C-F bonds can be deposited onto the fluorinated molecules, which can induce the degradation of the backbone conformation. This pre-treatment by using the FEL can be applied to the following analyses by the conventional chromatography and mass spectrometry. These studies are now undergoing in our laboratories.
6. Conclusions
We summarized various analytical techniques for carbohydrate polymers briefly and described an original spectroscopic approach by employing intense IR laser in polymer analysis. The FEL oscillates in IR region from 1000 cm-1 (10 μm) to 4000 cm-1 (2.5 μm) and can be applied to irradiate rigid carbohydrates represented as chitin and cellulose. After the wavelength-specific irradiations to their solid-phase materials under atmospheric conditions, each monomeric sugar and oligosaccharides are detected by ESI-MS, and the conformational changes of the parent polymeric structures are observed by SR-IRM. The fragmentation and degradation mechanisms are based on IRMPD reaction that is induced by the VE energy from a linear accelerator. The IR laser described herein can be used not only for unveiling rigid carbohydrate polymers but also as a pre-treatment method for dissolving the intact polymerized structure prior to separation from other ingredients by LC and molecular analysis by MS. In addition, the FEL technique can be adopted to irradiate many types of biological and organic molecules by tuning the irradiation wavelengths to their specific vibrational modes. Nonetheless, the current FEL system is installed at a synchrotron radiation facility, and it is expected to develop a laboratory-level IR laser instruments that possess both high laser energy and wavelength tunability in future.
Author Contributions
Conceptualization, T.K.; methodology, H.Z., K.N, T.S. and Y.H.; software, K.H., T.S., and H.Z.; validation, H.Z. and Y.H.; formal analysis, T.K.; investigation, T.K.; resources, Y.H. and H.Z.; data curation, K.N. and T.S.; writing—original draft preparation, T.K.; writing—review and editing, H.Z., T.S. and Y.H.; visualization, T.K.; supervision, Y.H.; project administration, T.K., H.Z., T.S. and Y.H.; funding acquisition, T.K. All authors have read and agreed to the published version of the manuscript.
Funding
This research was supported by the TIA collaborative research program “Kakehashi” (TK23-007 and TK22-050).
Data Availability Statement
The original data are available on request from the corresponding author.
Acknowledgments
Part of this work was supported by the Advanced Research Infrastructure for Materials and Nanotechnology in Japan (ARIM) of the Ministry of Education, Culture, Sports, Science, and Technology (MEXT) under project issue number 23 NM0121. Part of this research was performed at the BL6B of the UVSOR Synchrotron Facility, Institute for Molecular Science (IMS programs 23IMS6662 and 23IMS6845) and SR Center of Ritsumeikan University (Subject Number: S19001). This study was partly conducted through collaborative research with LEBRA at Nihon University and the Joint Usage/Research Program on Zero-Emission Energy Research, Institute of Advanced Energy, Kyoto University (ZE2022A-15 and ZE2023A-20).
Conflicts of Interest
The authors declare no competing financial interests.
Abbreviations
The following abbreviations are used in this manuscript:
| FEL | Free electron laser |
| IRMPD | Infrared multi photon dissociation |
| SR-IRM | Synchrotron radiation infrared microscopy |
| ESI-MS | Electron spray ionization mass spectrometry |
| SR | Synchrotron radiation |
| VE | Vibrational excitation |
| EB | Electron beam |
| RF | Radiofrequency |
| HPLC | High performance liquid chromatography |
| CE | Capillary electrophoresis |
| NIR | Near infrared |
| AFM | Atomic force microscopy |
| SEC | Size-exclusion chromatography |
| MALLS | Multiple-angle laser light scattering |
| NMR | Nuclear magnetic resonance |
| DSC | Differential scanning calorimetry |
| HPAEC-PAD | High-performance anion exchange chromatography with pulsed amperometry detection |
| MALDI-MSI | Matrix-assisted laser desorption/ionization-mass spectrometry imaging |
| PAS | Photoacoustic spectroscopy |
| TG | Thermogravimetric |
| XRD | X-ray diffraction |
| SEM | Scanning-electron microscope |
| MS | Mass spectrometry |
| ATR | Attenuated total reflectance |
| LC-MS | Liquid chromatography mass spectrometry |
| TLC | Thin-layer chromatography |
References
- Yu H, Chen X. Carbohydrate post-glycosylational modifications. Org Biomol Chem. 2007 Mar 21;5(6):865-72. [CrossRef]
- Su L, Hendrikse SIS, Meijer EW. Supramolecular glycopolymers: How carbohydrates matter in structure, dynamics, and function. Curr Opin Chem Biol. 2022 Aug;69:102171. [CrossRef]
- Wisnovsky S, Bertozzi CR. Reading the glyco-code: New approaches to studying protein-carbohydrate interactions. Curr Opin Struct Biol. 2022 Aug;75:102395. [CrossRef]
- Voiniciuc C, Pauly M, Usadel B. Monitoring Polysaccharide Dynamics in the Plant Cell Wall. Plant Physiol. 2018 Apr;176(4):2590-2600. [CrossRef]
- Sandhu AP, Randhawa GS, Dhugga KS. Plant cell wall matrix polysaccharide biosynthesis. Mol Plant. 2009 Sep;2(5):840-50. [CrossRef]
- Bayer, IS. Hyaluronic Acid and Controlled Release: A Review. Molecules. 2020 Jun 6;25(11):2649. [CrossRef]
- El Masri R, Crétinon Y, Gout E, Vivès RR. HS and Inflammation: A Potential Playground for the Sulfs? Front Immunol. 2020 Apr 3;11:570. [CrossRef]
- Muthukrishnan S, Mun S, Noh MY, Geisbrecht ER, Arakane Y. Insect Cuticular Chitin Contributes to Form and Function. Curr Pharm Des. 2020;26(29):3530-3545. [CrossRef]
- Qiu S, Zhou S, Tan Y, Feng J, Bai Y, He J, Cao H, Che Q, Guo J, Su Z. Biodegradation and Prospect of Polysaccharide from Crustaceans. Mar Drugs. 2022 May 2;20(5):310. [CrossRef]
- Koirala P, Bhandari Y, Khadka A, Kumar SR, Nirmal NP. Nanochitosan from crustacean and mollusk byproduct: Extraction, characterization, and applications in the food industry. Int J Biol Macromol. 2024 Mar;262(Pt 1):130008. [CrossRef]
- Wear MP, Jacobs E, Wang S, McConnell SA, Bowen A, Strother C, Cordero RJB, Crawford CJ, Casadevall A. Cryptococcus neoformans capsule regrowth experiments reveal dynamics of enlargement and architecture. J Biol Chem. 2022 Apr;298(4):101769. [CrossRef]
- Gow NAR, Latge JP, Munro CA. The Fungal Cell Wall: Structure, Biosynthesis, and Function. Microbiol Spectr. 2017 May;5(3):10.1128/microbiolspec.funk-0035-2016. [CrossRef]
- Roth C, Weizenmann N, Bexten N, Saenger W, Zimmermann W, Maier T, Sträter N. Amylose recognition and ring-size determination of amylomaltase. Sci Adv. 2017 Jan 13;3(1):e1601386. [CrossRef]
- Myers AM, Morell MK, James MG, Ball SG. Recent progress toward understanding biosynthesis of the amylopectin crystal. Plant Physiol. 2000 Apr;122(4):989-97. [CrossRef]
- Brust H, Orzechowski S, Fettke J. Starch and Glycogen Analyses: Methods and Techniques. Biomolecules. 2020 Jul 9;10(7):1020. [CrossRef]
- Aditya T, Allain JP, Jaramillo C, Restrepo AM. Surface Modification of Bacterial Cellulose for Biomedical Applications. Int J Mol Sci. 2022 Jan 6;23(2):610. [CrossRef]
- Agarwal, UP. Analysis of Cellulose and Lignocellulose Materials by Raman Spectroscopy: A Review of the Current Status. Molecules. 2019 Apr 27;24(9):1659. [CrossRef]
- Chen W, Cao P, Liu Y, Yu A, Wang D, Chen L, Sundarraj R, Yuchi Z, Gong Y, Merzendorfer H, Yang Q. Structural basis for directional chitin biosynthesis. Nature. 2022 Oct;610(7931):402-408. [CrossRef]
- Anand S, Azimi B, Lucena M, Ricci C, Candito M, Zavagna L, Astolfi L, Coltelli MB, Lazzeri A, Berrettini S, Moroni L, Danti S, Mota C. Chitin nanofibrils modulate mechanical response in tympanic membrane replacements. Carbohydr Polym. 2023 Jun 15;310:120732. [CrossRef]
- Rubinson KA, Chen Y, Cress BF, Zhang F, Linhardt RJ. Heparin’s solution structure determined by small-angle neutron scattering. Biopolymers. 2016 Dec;105(12):905-13. [CrossRef]
- Qiao M, Lin L, Xia K, Li J, Zhang X, Linhardt RJ. Recent advances in biotechnology for heparin and heparan sulfate analysis. Talanta. 2020 Nov 1;219:121270. [CrossRef]
- Wu Y, Zhao S, Wang J, Chen Y, Li H, Li JP, Kan Y, Zhang T. Methods for determining the structure and physicochemical properties of hyaluronic acid and its derivatives: A review. Int J Biol Macromol. 2024 Dec;282(Pt 6):137603. [CrossRef]
- Marcotti S, Maki K, Reilly GC, Lacroix D, Adachi T. Hyaluronic acid selective anchoring to the cytoskeleton: An atomic force microscopy study. PLoS One. 2018 Oct 25;13(10):e0206056. [CrossRef]
- Sun Y, Xu X, Zhang Q, Zhang D, Xie X, Zhou H, Wu Z, Liu R, Pang J. Review of Konjac Glucomannan Structure, Properties, Gelation Mechanism, and Application in Medical Biology. Polymers (Basel). 2023 Apr 12;15(8):1852. [CrossRef]
- Li H, Fu A, Hui H, Jia F, Wang H, Zhao T, Wei J, Zhang P, Lang W, Li K, Hu X. Structure characterization and preliminary immune activity of a glucomannan purified from Allii Tuberosi Semen. Carbohydr Res. 2025 Mar;549:109375. [CrossRef]
- Du B, Meenu M, Liu H, Xu B. A Concise Review on the Molecular Structure and Function Relationship of β-Glucan. Int J Mol Sci. 2019 Aug 18;20(16):4032. [CrossRef]
- Pourtalebi Jahromi L, Rothammer M, Fuhrmann G. Polysaccharide hydrogel platforms as suitable carriers of liposomes and extracellular vesicles for dermal applications. Adv Drug Deliv Rev. 2023 Sep;200:115028. [CrossRef]
- Yonggang Wang1,2 •Yanjun Jing1,2 • Feifan Leng1,2 • Shiwei Wang1,2 •Fan Wang1,2 • Yan Zhuang1,2 • Xiaofeng Liu1,2 • Xiaoli Wang3 • Xueqing Ma4, Establishment and Application of a Method for Rapid Determination of Total Sugar Content Based on Colorimetric Microplate. Sugar Tech (July-Aug 2017) 19(4):424–431.
- ROE, JH. The determination of sugar in blood and spinal fluid with anthrone reagent. J Biol Chem. 1955 Jan;212(1):335-43.
- Omondi S, Kosgei J, Agumba S, Polo B, Yalla N, Moshi V, Abong’o B, Ombok M, McDermott DP, Entwistle J, Samuels AM, Ter Kuile FO, Gimnig JE, Ochomo E. Natural sugar feeding rates of Anopheles mosquitoes collected by different methods in western Kenya. Sci Rep. 2022 Nov 29;12(1):20596. [CrossRef]
- Clarke AJ, Cox PM, Shepherd AM. The chemical composition of the egg shells of the potato cyst-nematode, Heterodera rostochiensis Woll. Biochem J. 1967 Sep;104(3):1056-60. [CrossRef]
- BOWNESS, JM. Application of the carbazole reaction to the estimation of glucuronic acid and flucose in some acidic polysaccharides and in urine. Biochem J. 1957 Oct;67(2):295-300. [CrossRef]
- Felz S, Vermeulen P, van Loosdrecht MCM, Lin YM. Chemical characterization methods for the analysis of structural extracellular polymeric substances. Water Res. 2019 Jun 15;157:201-208. [CrossRef]
- Wang HC, Lee AR. Recent developments in blood glucose sensors. J Food Drug Anal. 2015 Jun;23(2):191-200. [CrossRef]
- Ge J, Mao W, Wang X, Zhang M, Liu S. The Fluorescent Detection of Glucose and Lactic Acid Based on Fluorescent Iron Nanoclusters. Sensors (Basel). 2024 May 27;24(11):3447. [CrossRef]
- Hase S, Hara S, Matsushima Y. Tagging of sugars with a fluorescent compound, 2-aminopyridine. J Biochem. 1979 Jan;85(1):217-20. [CrossRef]
- Rothenberg BE, Hayes BK, Toomre D, Manzi AE, Varki A. Biotinylated diaminopyridine: an approach to tagging oligosaccharides and exploring their biology. Proc Natl Acad Sci U S A. 1993 Dec 15;90(24):11939-43. [CrossRef]
- Volpi N, Maccari F, Linhardt RJ. Capillary electrophoresis of complex natural polysaccharides. Electrophoresis. 2008 Aug;29(15):3095-106. [CrossRef]
- Szigeti M, Meszaros-Matwiejuk A, Molnar-Gabor D, Guttman A. Rapid capillary gel electrophoresis analysis of human milk oligosaccharides for food additive manufacturing in-process control. Anal Bioanal Chem. 2021 Mar;413(6):1595-1603. [CrossRef]
- Yuling Wang, Xingqi Ou, Qais Ali Al-Maqtari, Hong-Ju He, Norzila Othman. Evaluation of amylose content: Structural and functional properties, analytical techniques, and future prospects. Food Chemistry: X 24 (2024) 101830. [CrossRef]
- Rachelle M. Ward, Qunyu Gao, Hank de Bruyn, Robert G. Gilbert, and Melissa A. Fitzgerald, Improved Methods for the Structural Analysis of the Amylose-Rich Fraction from Rice Flour. Biomacromolecules 2006, 7, 866–876. [CrossRef] [PubMed]
- J. P. Mua and D. S. Jackson, Relationships between Functional Attributes and Molecular Structures of Amylose and Amylopectin Fractions from Corn Starch. J. Agric. Food Chem. 1997, 45, 3848−3854.
- Jia X, Xu J, Cui Y, Ben D, Wu C, Zhang J, Sun M, Liu S, Zhu T, Liu J, Lin K, Zheng M. Effect of Modification by β-Amylase and α-Glucosidase on the Structural and Physicochemical Properties of Maize Starch. Foods. 2024 Nov 24;13(23):3763. [CrossRef]
- Wang, B.; Xu, J.; Guo, D.; Long, C.; Zhang, Z.; Cheng, Y.; Huang, H.; Wen, P.; He, H.; He, X. Research on the Relationship between the Amylopectin Structure and the Physicochemical Properties of Starch Extracted from Glutinous Rice. Foods 2023, 12, 460. [Google Scholar] [CrossRef] [PubMed]
- Conroy, L.R. , Clarke, H.A., Allison, D.B. et al. Spatial metabolomics reveals glycogen as an actionable target for pulmonary fibrosis. Nat Commun 14, 2759 (2023). [CrossRef]
- Csóka, L. , Csoka, W., Tirronen, E. et al. Integrated analysis of cellulose structure and properties using solid-state low-field H-NMR and photoacoustic spectroscopy. Sci Rep 15, 2195 (2025). [CrossRef]
- Díez, D.; Urueña, A.; Piñero, R.; Barrio, A.; Tamminen, T. Determination of Hemicellulose, Cellulose, and Lignin Content in Different Types of Biomasses by Thermogravimetric Analysis and Pseudocomponent Kinetic Model (TGA-PKM Method). Processes 2020, 8, 1048. [Google Scholar] [CrossRef]
- Triunfo, M. , Tafi, E., Guarnieri, A. et al. Characterization of chitin and chitosan derived from Hermetia illucens, a further step in a circular economy process. Sci Rep 12, 6613 (2022). [CrossRef]
- Jolanta Kumirska, Małgorzata Czerwicka, Zbigniew Kaczyński, Anna Bychowska, Krzysztof Brzozowski, Jorg Thöming and Piotr Stepnowski. Application of Spectroscopic Methods for Structural Analysis of Chitin and Chitosan. Mar. Drugs 2010, 8, 1567–1636. [CrossRef]
- Pierre Mourier, Pascal Anger, Céline Martinez, Fréderic Herman, Christian Viskov. Quantitative compositional analysis of heparin using exhaustive heparinase digestion and strong anion exchange chromatography. Analytical Chemistry Research 3 (2015) 46–53. [CrossRef]
- Anthony, J. Anthony J. Devlin, Courtney J. Mycroft-West, Jeremy E. Turnbull, Marcelo Andrade de Lima, Marco Guerrini, Edwin A. Yates, Mark A. Skidmore. Analysis of Heparin Samples by Attenuated Total Reflectance Fourier-Transform Infrared Spectroscopy in the Solid State. ACS Cent. Sci. 2023, 9(3), 381–392. [Google Scholar] [CrossRef]
- Suárez-Hernández, L.A.; Camacho-Ruíz, R.M.; Arriola-Guevara, E.; Padilla-Camberos, E.; Kirchmayr, M.R.; Corona-González, R.I.; Guatemala-Morales, G.M. Validation of an Analytical Method for the Simultaneous Determination of Hyaluronic Acid Concentration and Molecular Weight by Size-Exclusion Chromatography. Molecules 2021, 26, 5360. [Google Scholar] [CrossRef] [PubMed]
- Felipe Rivas, Osama K. Zahid, Heidi L. Reesink, Bridgette T. Peal, Alan J. Nixon, Paul L. DeAngelis, Aleksander Skardal, Elaheh Rahbar1 & Adam R. Hall. Label-free analysis of physiological hyaluronan size distribution with a solid-state nanopore sensor. NATURE COMMUNICATIONS (2018) 9:1037. [CrossRef]
- Omar Ishrud, Muhammad Zahid, Viqar Uddin Ahmad, and Yuanjiang Pan. Isolation and Structure Analysis of a Glucomannan from the Seeds of Libyan Dates. J. Agric. Food Chem. 2001, 49, 3772–3774. [CrossRef] [PubMed]
- Grace Lu, Cassandra L. Crihfield, Srikanth Gattu, Lindsay M. Veltri, and Lisa A. Holland. Capillary Electrophoresis Separations of Glycans. Chem. Rev. 2018, 118, 7867–7885. [CrossRef]
- Tang Z, Huang G. Extraction, structure, and activity of polysaccharide from Radix astragali. Biomed Pharmacother. 2022 Jun;150:113015. [CrossRef]
- Karnaouri A, Chorozian K, Zouraris D, Karantonis A, Topakas E, Rova U, Christakopoulos P. Lytic polysaccharide monooxygenases as powerful tools in enzymatically assisted preparation of nano-scaled cellulose from lignocellulose: A review. Bioresour Technol. 2022 Feb; 345:126491. [CrossRef]
- Kawasaki, T. , Nagase A., Hayakawa K., Teshima F., Tanaka K., Zen H., Shishikura F., Sei N., Sakai T., Hayakawa Y. Infrared Free-Electron Laser: A Versatile Molecular Cutter for Analyzing Solid-State Biomacromolecules. ACS Omega 2025 Apr 2;10(14):13860-13867. [CrossRef]
- Kawasaki, T.; Sakai, T.; Zen, H.; Sumitomo, Y.; Nogami, K.; Hayakawa, K.; Yaji, T.; Ohta, T.; Tsukiyama, K.; Hayakawa, Y. Cellulose Degradation by Infrared Free Electron Laser. Energy Fuels 2020, 34, 9064−9068. [Google Scholar] [CrossRef]
- Kawasaki, T.; Zen, H.; Sakai, T.; Sumitomo, Y.; Nogami, K.; Hayakawa, K.; Yaji, T.; Ohta, T.; Nagata, T.; Hayakawa, Y. Degradation of Lignin by Infrared Free Electron Laser. Polymers 2022, 14, 2401. [Google Scholar] [CrossRef] [PubMed]
- Helburn R, Nolan K. Characterizing biological macromolecules with attenuated total reflectance-Fourier transform infrared spectroscopy provides hands-on spectroscopy experiences for undergraduates. Biochem Mol Biol Educ. 2022 Jul;50(4):381-392. [CrossRef]
- Johnson JB, Walsh KB, Naiker M, Ameer K. The Use of Infrared Spectroscopy for the Quantification of Bioactive Compounds in Food: A Review. Molecules. 2023 Apr 4;28(7):3215. [CrossRef]
- Soulby AJ, Heal JW, Barrow MP, Roemer RA, O’Connor PB. Does deamidation cause protein unfolding? A top-down tandem mass spectrometry study. Protein Sci. 2015 May;24(5):850-60. [CrossRef]
- Smith SI, Guziec FS Jr, Guziec L, Brodbelt JS. Interactions of sulfur-containing acridine ligands with DNA by ESI-MS. Analyst. 2009 Oct;134(10):2058-66. [CrossRef]
- Theisen A, Wootton CA, Haris A, Morgan TE, Lam YPY, Barrow MP, O’Connor PB. Enhancing Biomolecule Analysis and 2DMS Experiments by Implementation of (Activated Ion) 193 nm UVPD on a FT-ICR Mass Spectrometer. Anal Chem. 2022 Nov 15;94(45):15631-15638. [CrossRef]
- J.J. Valle, J.R. Eyler, J. Oomens, D.T. Moore, A.F.G. van der Meer, G. von Helden, G. Meijer, C.L. Hendrickson, A.G. Marshall, G.T. Blakney, Free electron laser-Fourier transform ion cyclotron resonance mass spectrometry facility for obtaining infrared multiphoton dissociation spectra of gaseous ions, Rev. Sci. Instrum. 76 (2) (2005) 023103. [CrossRef]
- Zavalin A, Hachey DL, Sundaramoorthy M, Banerjee S, Morgan S, Feldman L, Tolk N, Piston DW. B Kinetics of a collagen-like polypeptide fragmentation after mid-IR free-electron laser ablation. Biophys. J. 2008 Aug;95(3):1371-81. [CrossRef]
- P G O’Shea, H P Freund. Free-electron lasers. Status and applications. Science 2001 Jun 8;292(5523):1853-8. [CrossRef]
- F. Glotin, R. Chaput, D. Jaroszynski, R. Prazeres, and J.-M. Ortega. Infrared subpicosecond laser pulses with a free-electron laser. Phys. Rev. Lett. 71, 2587 (1993). [CrossRef]
- Zen, H.; Suphakul, S.; Kii, T.; Masuda, K.; Ohgaki, H. Present status and perspectives of long wavelength free electron lasers at Kyoto University. Phys. Procedia 2016, 84, 47–53. [Google Scholar] [CrossRef]
- Zen, H.; Hajima, R.; Ohgaki, H. Full characterization of superradiant pulses generated from a free-electron laser oscillator. Sci. Rep. 2023, 13, 6350. [Google Scholar] [CrossRef] [PubMed]
- Hayakawa, Y.; Sato, I.; Hayakawa, K.; Tanaka, T. First lasing of LEBRA FEL at Nihon University at a wavelength of 1. 5 μm. Nucl. Instrum. Methods Phys. Res. A 2002, 483, 29–33. [Google Scholar] [CrossRef]
- Nakao, K.; Hayakawa, K.; Hayakawa, Y.; Inagaki, M.; Nogami, K.; Sakai, T.; Tanaka, T.; Zen, H. Pulse Structure Measurement of Near-Infrared FEL in Burst-Mode Operation of LEBRA Linac. In Proceedings of FEL2012; Nara, Japan, 2012, p 472.
- Sakai, T.; Hayakawa, K.; Tanaka, T.; Hayakawa, Y.; Nogami, K.; Sei, N. Evaluation of Bunch Length by Measuring Coherent Synchrotron Radiation with a Narrow-Band Detector at LEBRA. Condens. Matter 2020, 5, 34. [Google Scholar] [CrossRef]
- T. Kawasaki, H. Zen, K. Ozaki, H. Yamada, K. Wakamatsu and S. Ito. Application of mid-infrared free-electron laser for structural analysis of biological materials. J. Synchrotron Rad. (2021). 28, 28-35. [CrossRef]
- Kakoulli, I. , Prikhodko, S.V., Fischer, C., Cilluffo, M., Uribe, M., Bechtel, H.A., Fakra, S.C. and Marcus, M.A. (2013) Distribution and Chemical Speciation of Arsenic in Ancient Human Hair Using Synchrotron Radiation. Analytical Chemistry, 86, 521-526. [CrossRef]
- Ling, S., Qi, Z., Knight, D.P., Huang, Y., Huang, L., Zhou, H., Shao, Z. and Chen, X. (2013) Insight into the Structure of Single Antheraea pernyi Silkworm Fibers Using Synchrotron FTIR Microspectroscopy. Biomacromolecules, 14, 1885-1892. [CrossRef]
- Liu S, Sun J, Yu L, Zhang C, Bi J, Zhu F, Qu M, Jiang C, Yang Q. Extraction and characterization of chitin from the beetle Holotrichia parallela Motschulsky. Molecules. 2012 Apr 17;17(4):4604-11. [CrossRef]
- Zainol Abidin NA, Kormin F, Zainol Abidin NA, Mohamed Anuar NAF, Abu Bakar MF. The Potential of Insects as Alternative Sources of Chitin: An Overview on the Chemical Method of Extraction from Various Sources. Int J Mol Sci. 2020 Jul 15;21(14):4978. [CrossRef]
- Kimura S, et al. Infrared and terahertz spectromicroscopy beam line BL6B(IR) at UVSOR-II. Infrared Phys Technol. 2006; 49: 147–51. [CrossRef]
- Devi A, Bajar S, Kour H, Kothari R, Pant D, Singh A. Lignocellulosic Biomass Valorization for Bioethanol Production: a Circular Bioeconomy Approach. Bioenergy Res. 2022;15(4):1820-1841. [CrossRef]
- Zhan Y, Wang M, Ma T, Li Z. Enhancing the potential production of bioethanol with bamboo by γ-valerolactone/water pretreatment. RSC Adv. 2022 Jun 7;12(26):16942-16954. [CrossRef]
- Zhong, C. Industrial-Scale Production and Applications of Bacterial Cellulose. Front Bioeng Biotechnol. 2020 Dec 22;8:605374. [CrossRef]
- Sharma A, Thakur M, Bhattacharya M, Mandal T, Goswami S. Commercial application of cellulose nano-composites - A review. Biotechnol Rep (Amst). 2019 Feb 15;21:e00316. [CrossRef]
- Šaravanja A, Pušić T, Dekanić T. Microplastics in Wastewater by Washing Polyester Fabrics. Materials (Basel). 2022 Apr 6;15(7):2683. [CrossRef]
- Palacios-Mateo C, van der Meer Y, Seide G. Analysis of the polyester clothing value chain to identify key intervention points for sustainability. Environ Sci Eur. 2021;33(1):2. [CrossRef]
- Xue Y, Lofland S, Hu X. Thermal Conductivity of Protein-Based Materials: A Review. Polymers (Basel). 2019 Mar 11;11(3):456. [CrossRef]
- Wu R, Ma L, Liu XY. From Mesoscopic Functionalization of Silk Fibroin to Smart Fiber Devices for Textile Electronics and Photonics. Adv Sci (Weinh). 2022 Feb;9(4):e2103981. [CrossRef]
- Al-Tohamy R, Ali SS, Li F, Okasha KM, Mahmoud YA, Elsamahy T, Jiao H, Fu Y, Sun J. A critical review on the treatment of dye-containing wastewater: Ecotoxicological and health concerns of textile dyes and possible remediation approaches for environmental safety. Ecotoxicol Environ Saf. 2022 Feb;231:113160. [CrossRef]
- Sałdan, A.; Król, M.; Wo’ zniakiewicz, M.; Ko’ scielniak, P. Application of Capillary Electromigration Methods in the Analysis of Textile Dyes—Review. Molecules 2022, 27, 2767. [Google Scholar] [CrossRef] [PubMed]
- Kristin H. Cochran, Jeremy A. Barry, David C. Muddiman, and David Hinks. Direct Analysis of Textile Fabrics and Dyes Using Infrared Matrix-Assisted Laser Desorption Electrospray Ionization Mass Spectrometry. Anal. Chem. 2013, 85, 831−836.
- Pelch KE, McKnight T, Reade A. 70 analyte PFAS test method highlights need for expanded testing of PFAS in drinking water. Sci Total Environ. 2023 Jun 10;876:162978. [CrossRef]
- Nancy Wolf, Lina Müller, Sarah Enge, Tina Ungethüm & Thomas J. Simat (2024) Analysis of PFAS and further VOC from fluoropolymer-coated cookware by thermal desorption-gas chromatography-mass spectrometry (TD-GC-MS), Food Additives & Contaminants: Part A, 41:12, 1663-1678. [CrossRef]
Figure 1.
Oscillation system of free-electron laser (FEL). The system is composed of major three parts: Linear accelerator, Periodic magnetic field, and Optical cavity.
Figure 1.
Oscillation system of free-electron laser (FEL). The system is composed of major three parts: Linear accelerator, Periodic magnetic field, and Optical cavity.
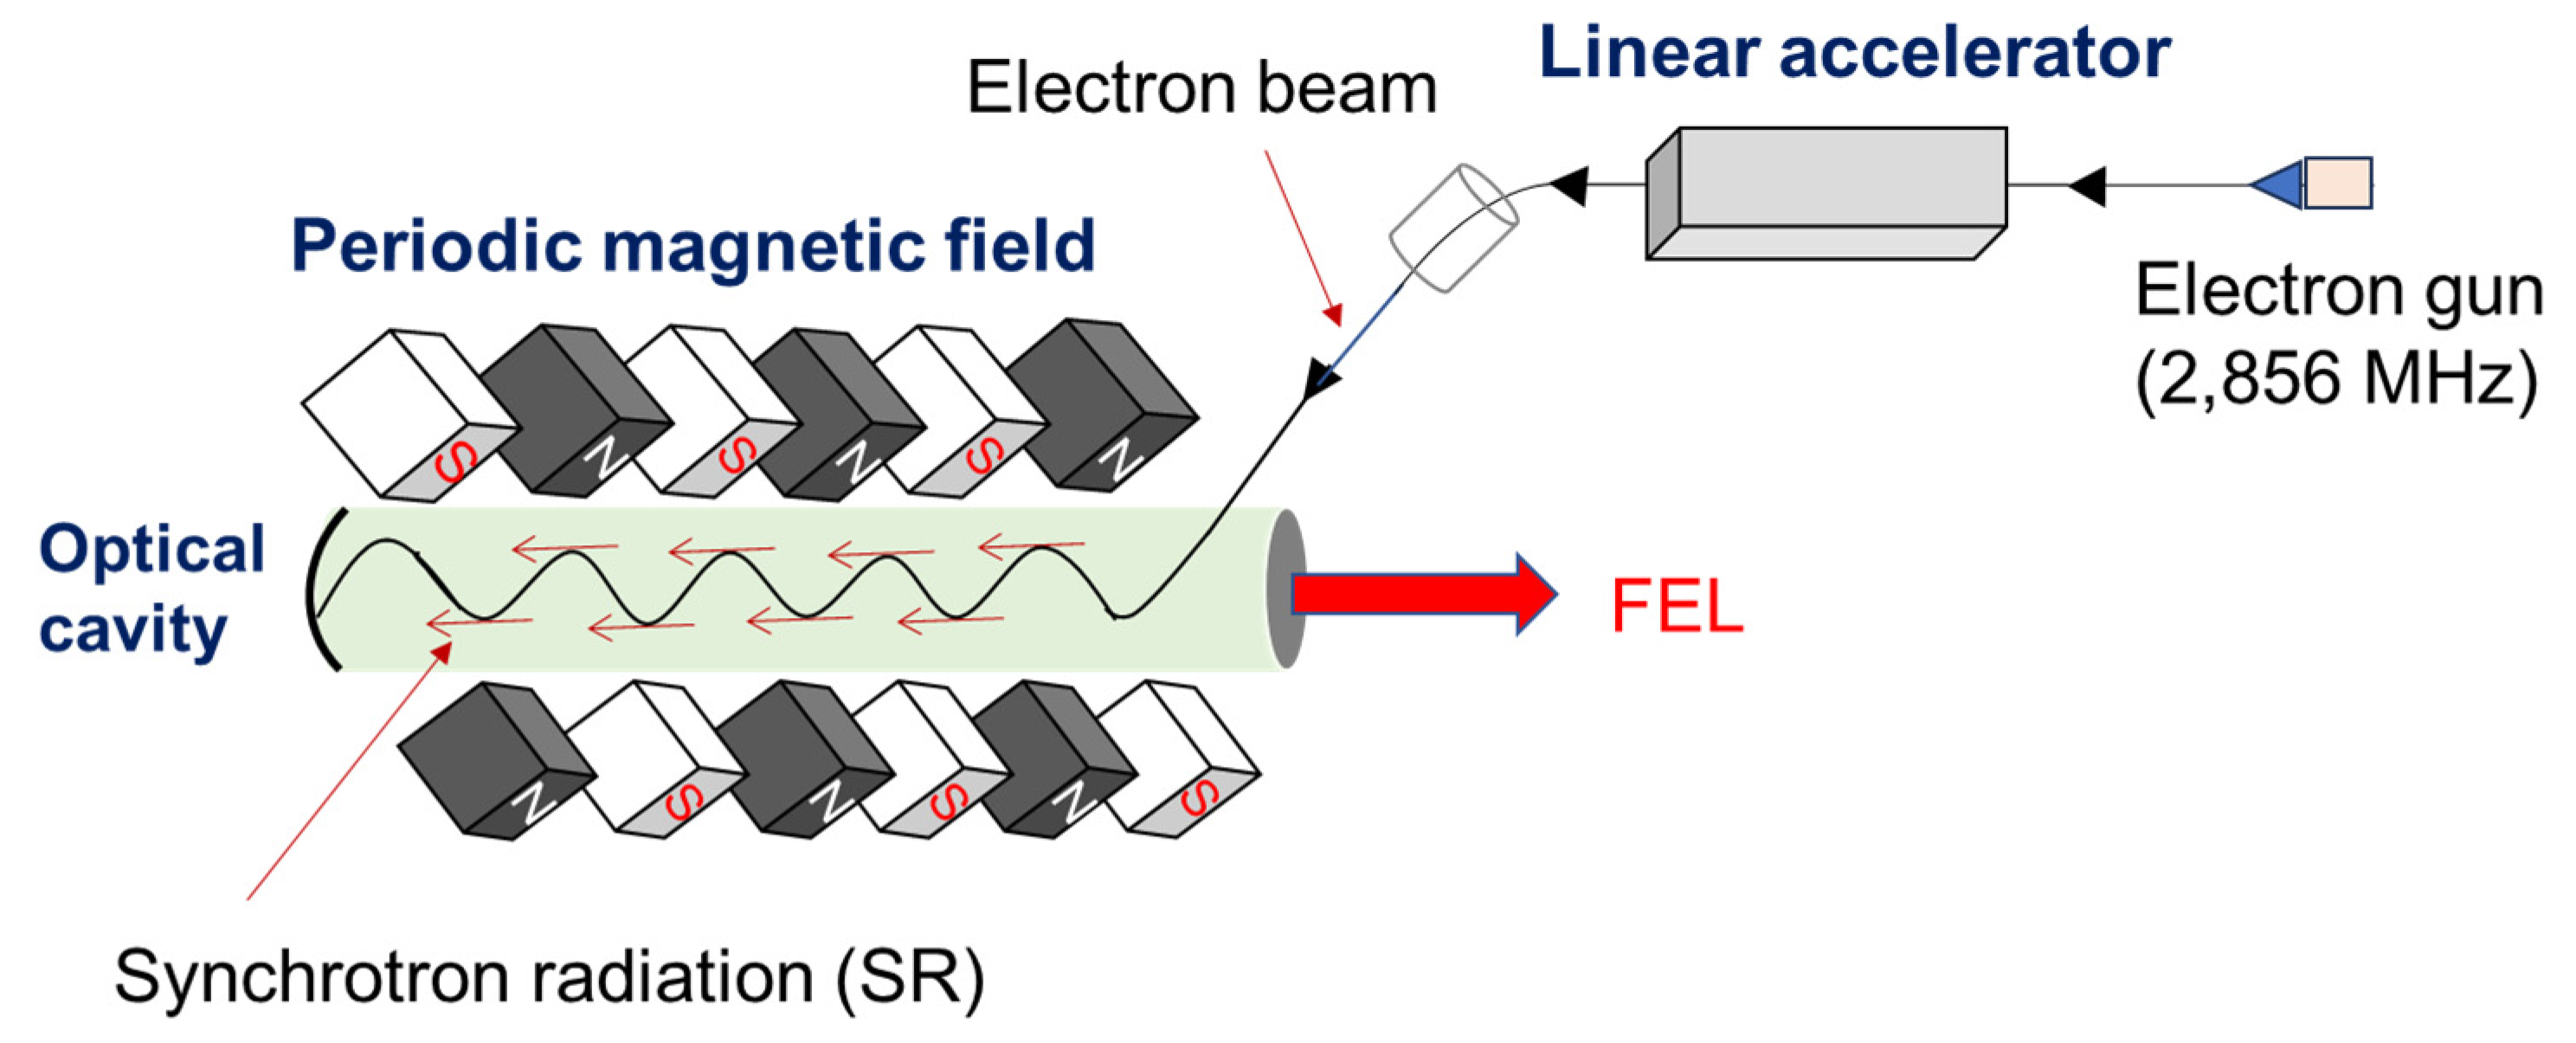
Figure 2.
An example of irradiation set up. Right: overall beam line; Left: local beam line above sample film. The FEL is introduced onto the sample through three reflection mirrors and one focusing lens from beam port. The photograph is taken at LEBRA, Nihon University.
Figure 2.
An example of irradiation set up. Right: overall beam line; Left: local beam line above sample film. The FEL is introduced onto the sample through three reflection mirrors and one focusing lens from beam port. The photograph is taken at LEBRA, Nihon University.
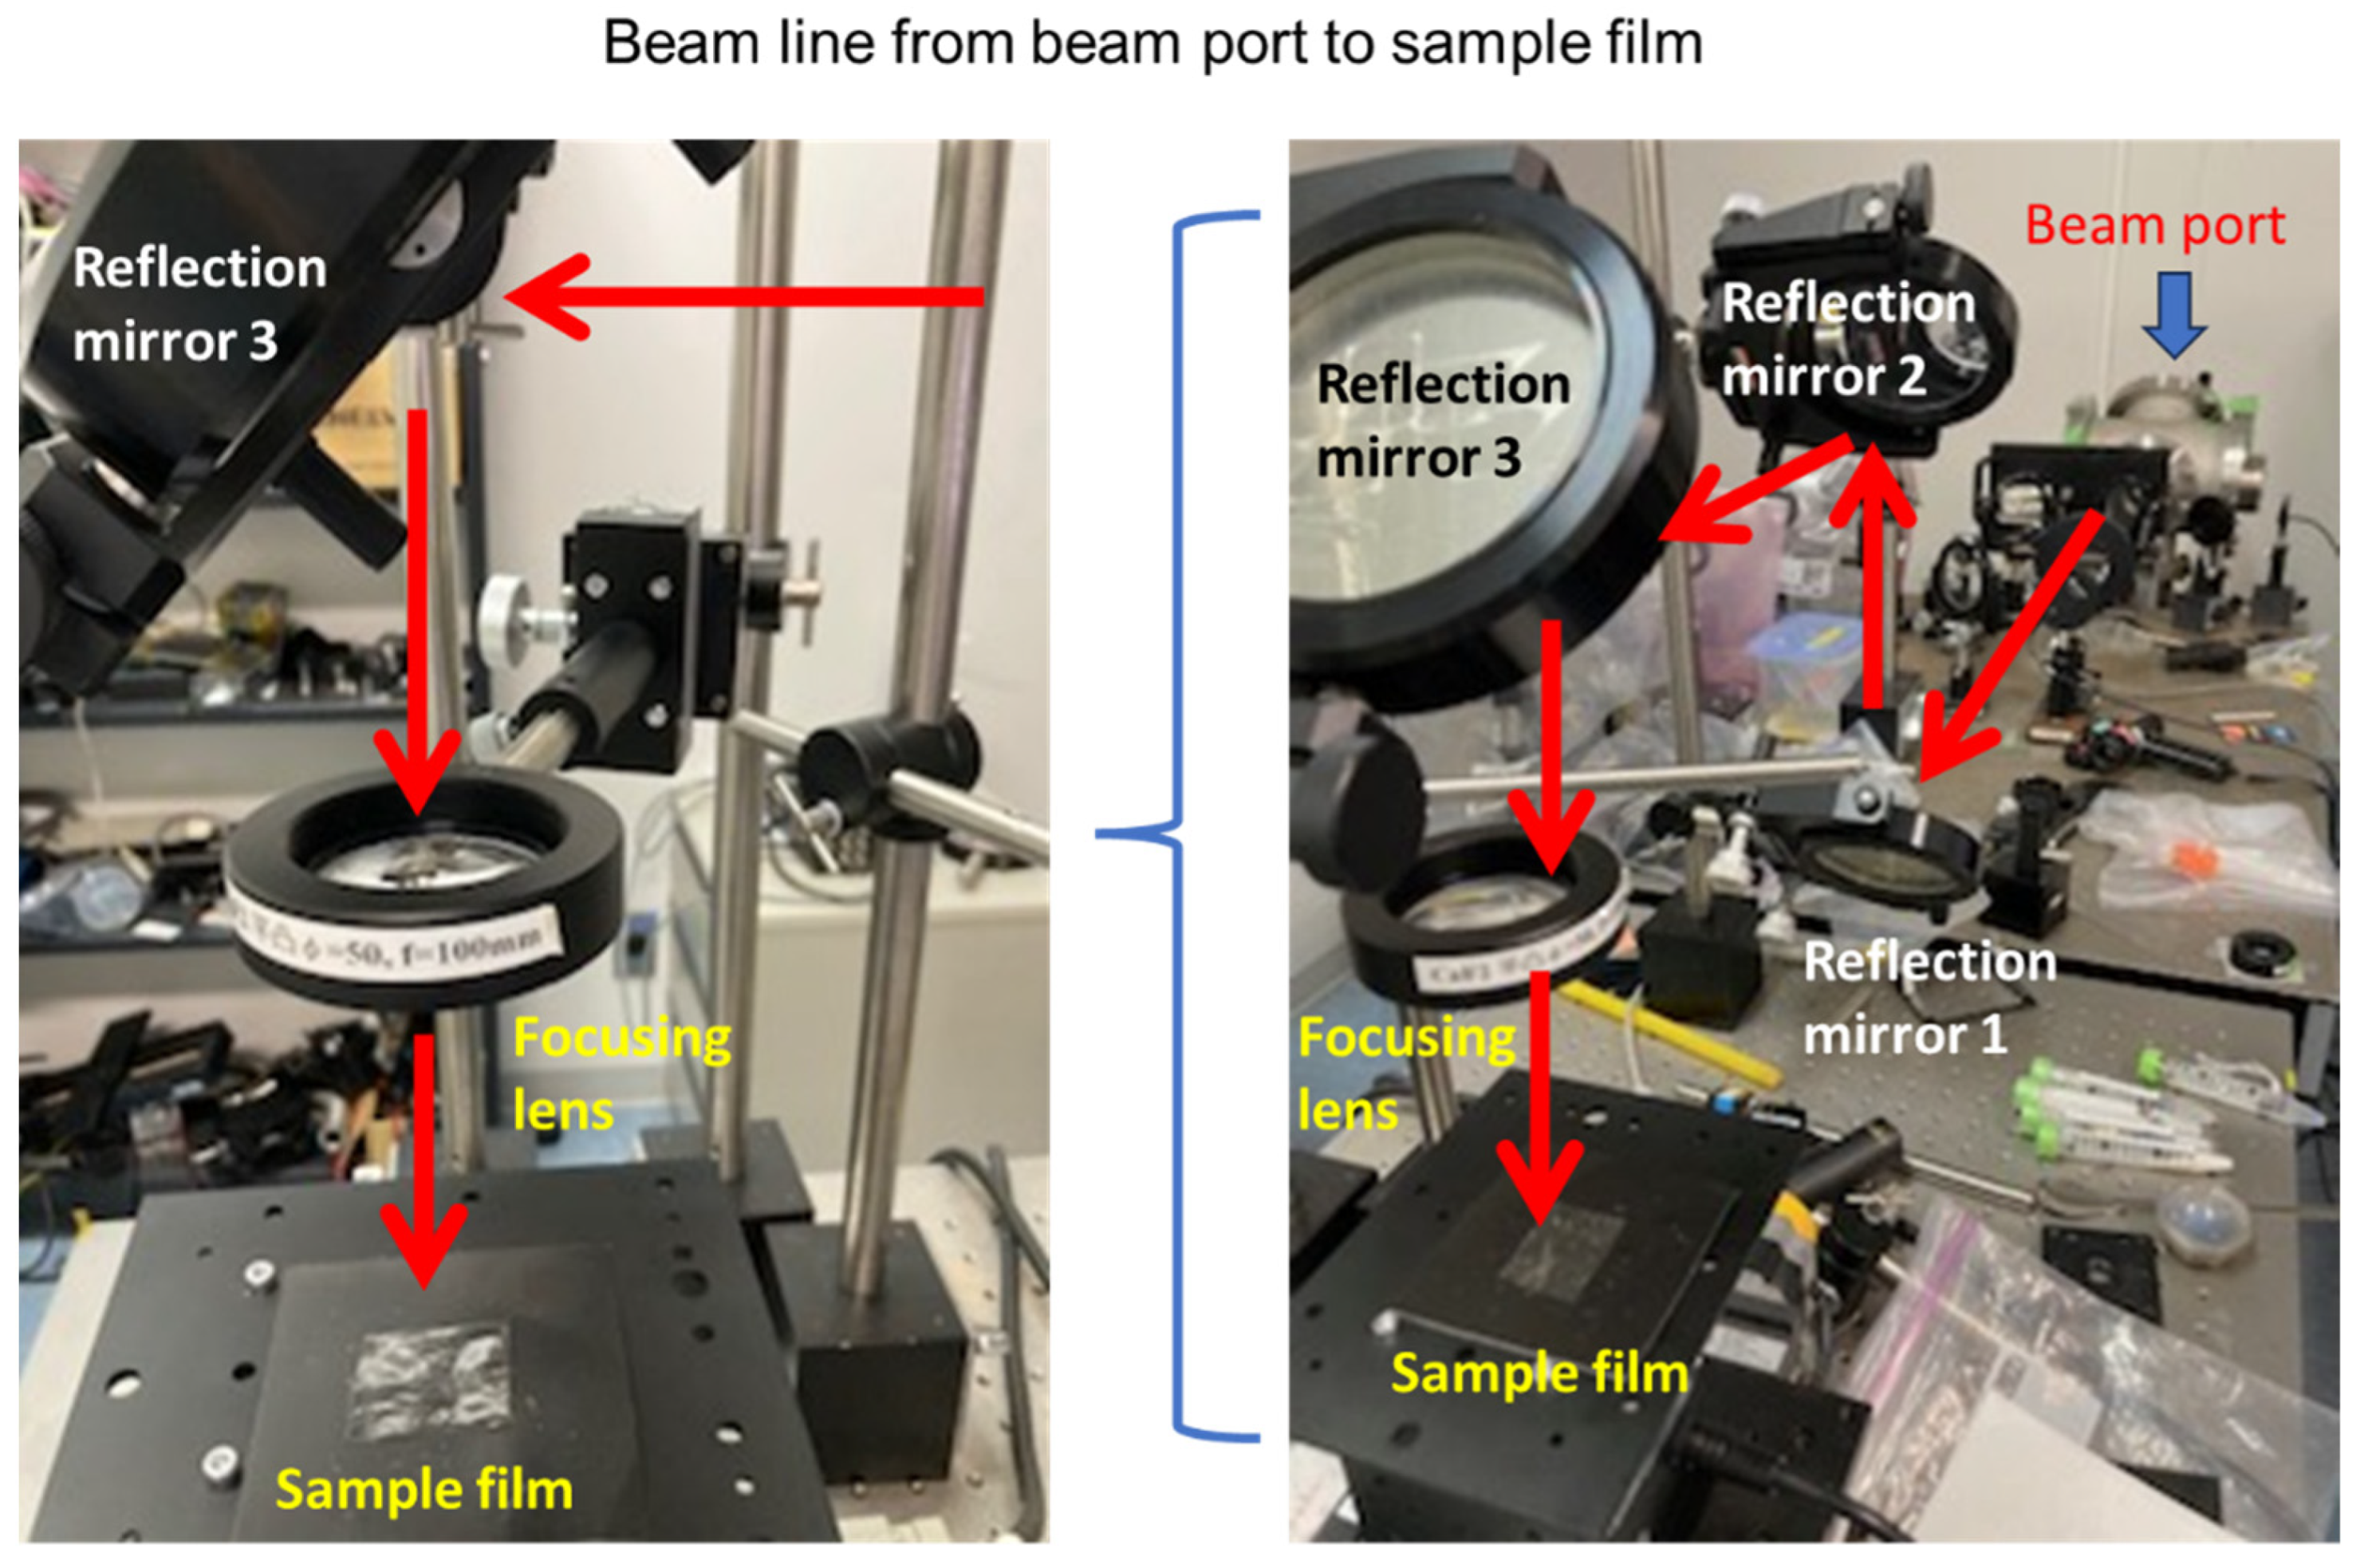
Figure 3.
Characteristic of FEL. (a) Tunable wavelengths in IR region containing various vibrational modes of molecules. (b) Representative FEL spectra from 5.5 to 11.5 μm [75].
Figure 3.
Characteristic of FEL. (a) Tunable wavelengths in IR region containing various vibrational modes of molecules. (b) Representative FEL spectra from 5.5 to 11.5 μm [75].
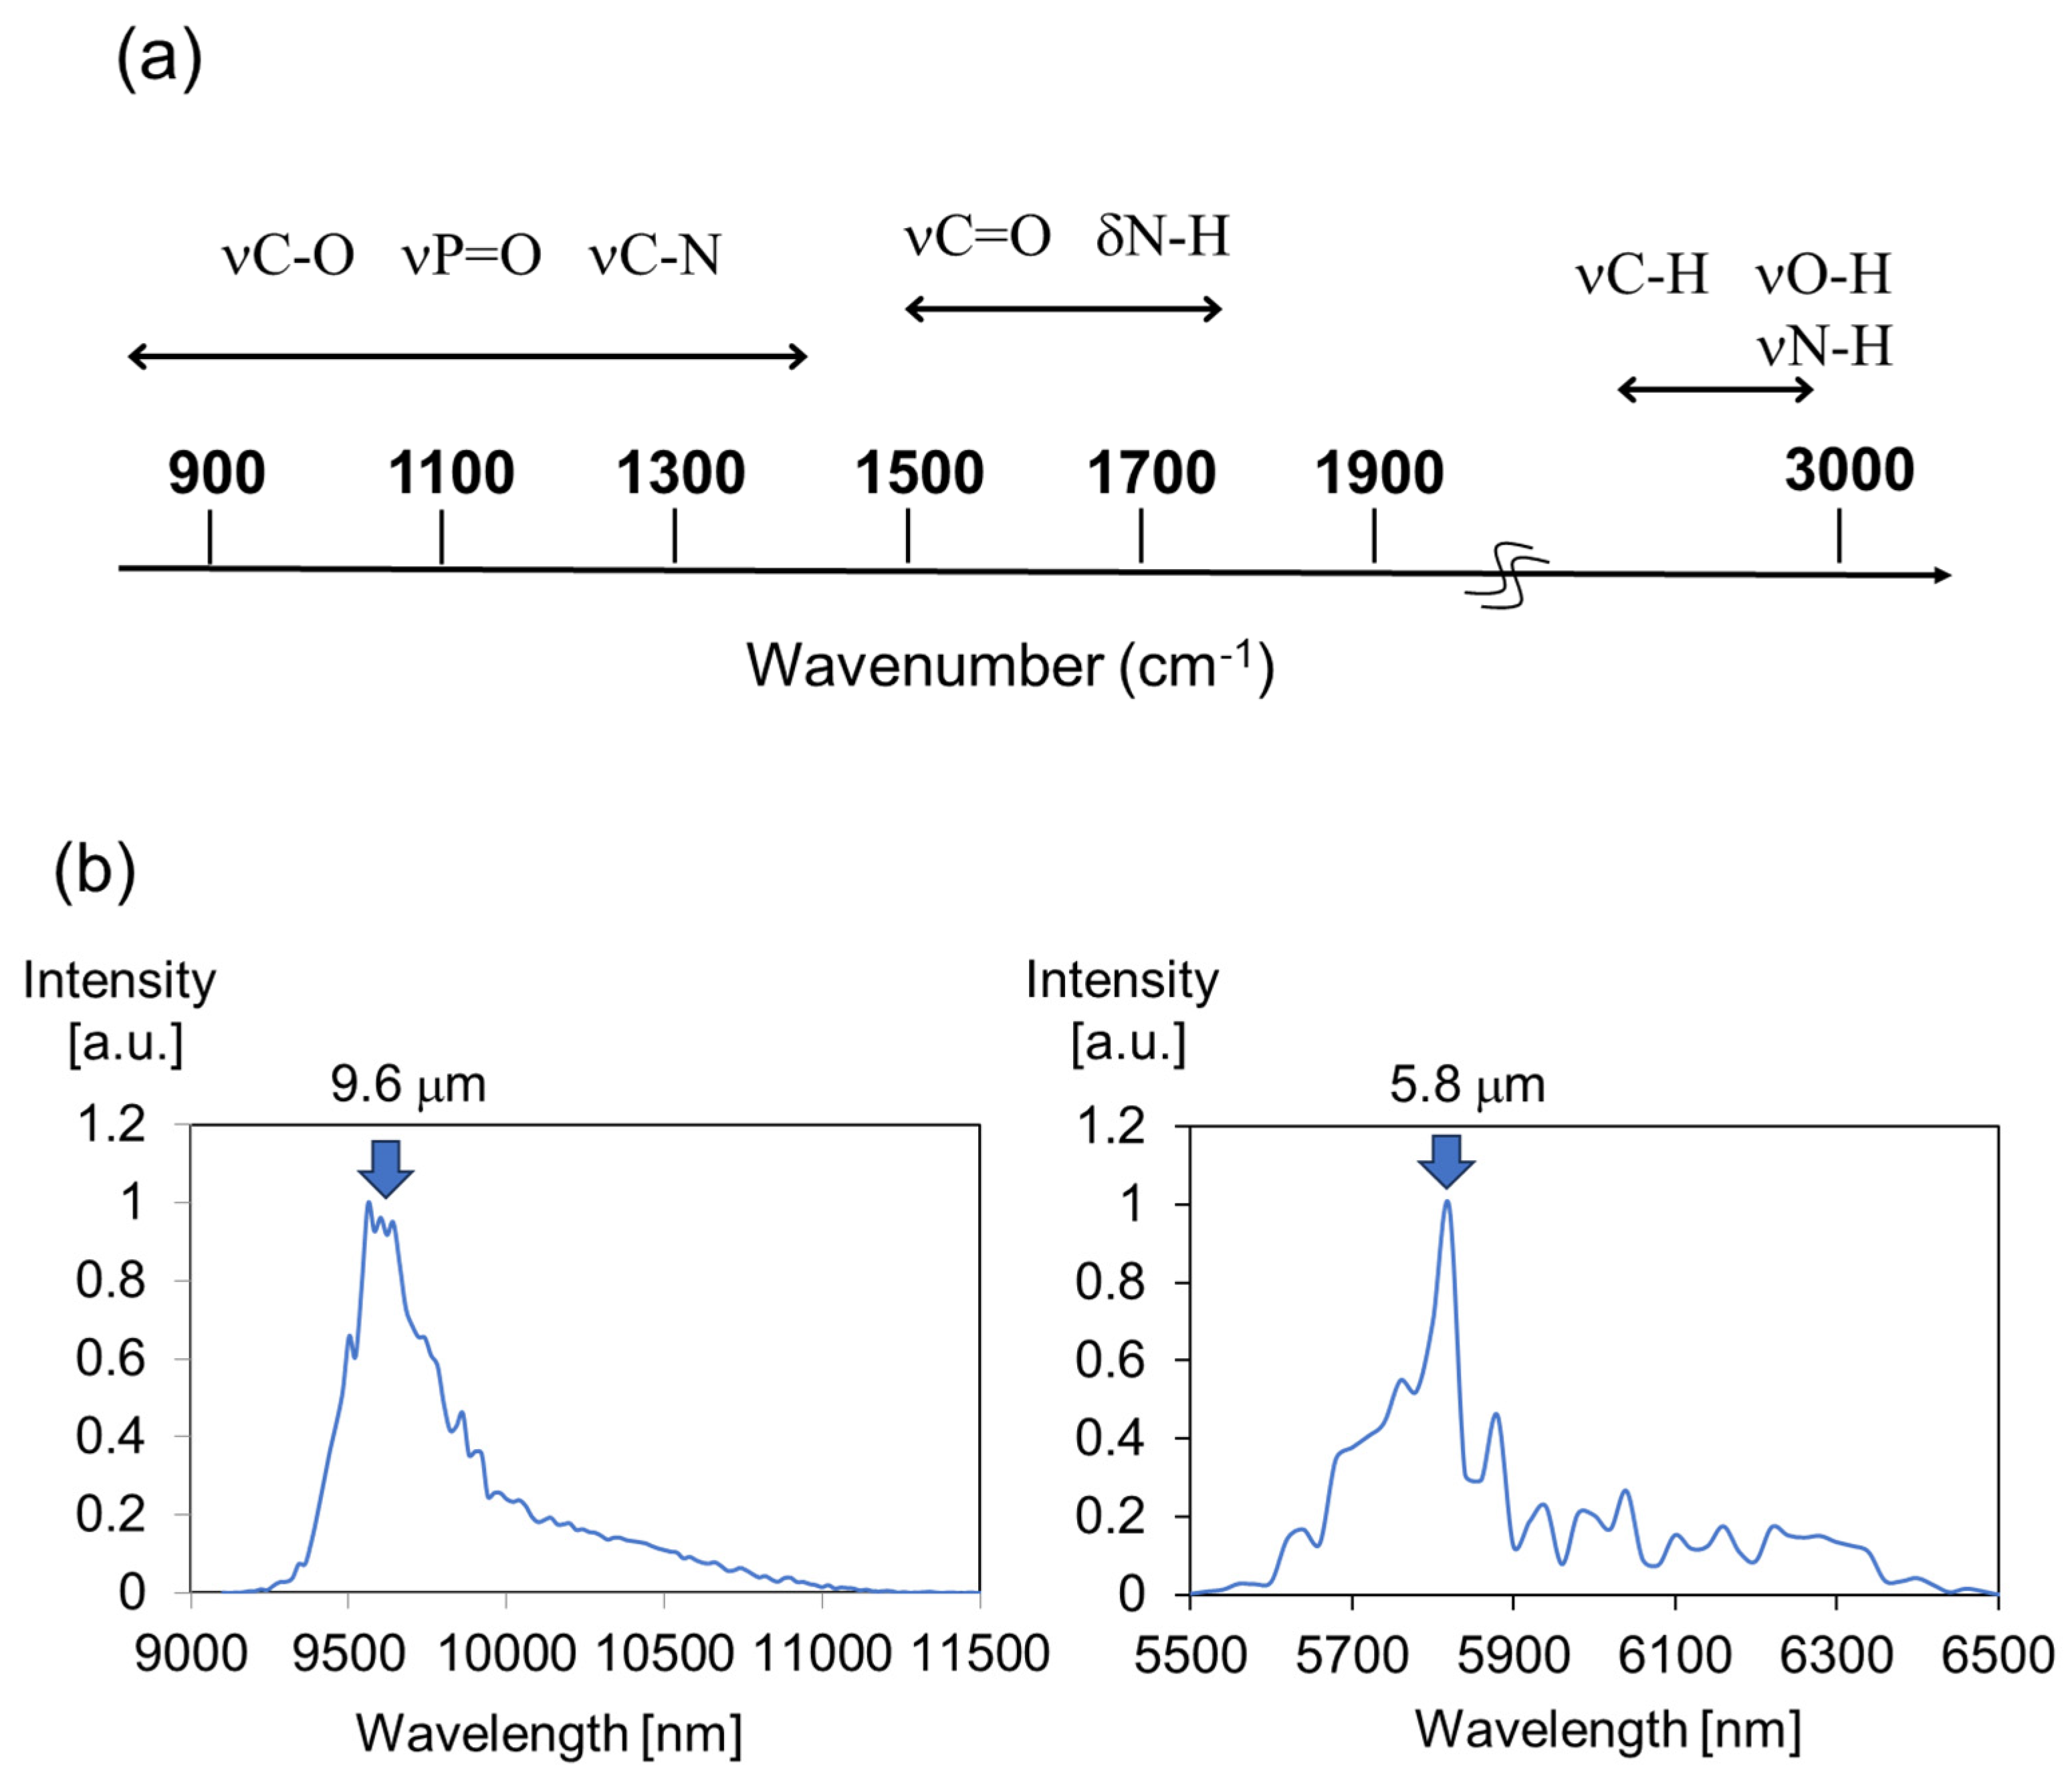
Figure 4.
Scheme from sample preparation to structural analysis of solid-state crayfish shells [58].
Figure 4.
Scheme from sample preparation to structural analysis of solid-state crayfish shells [58].
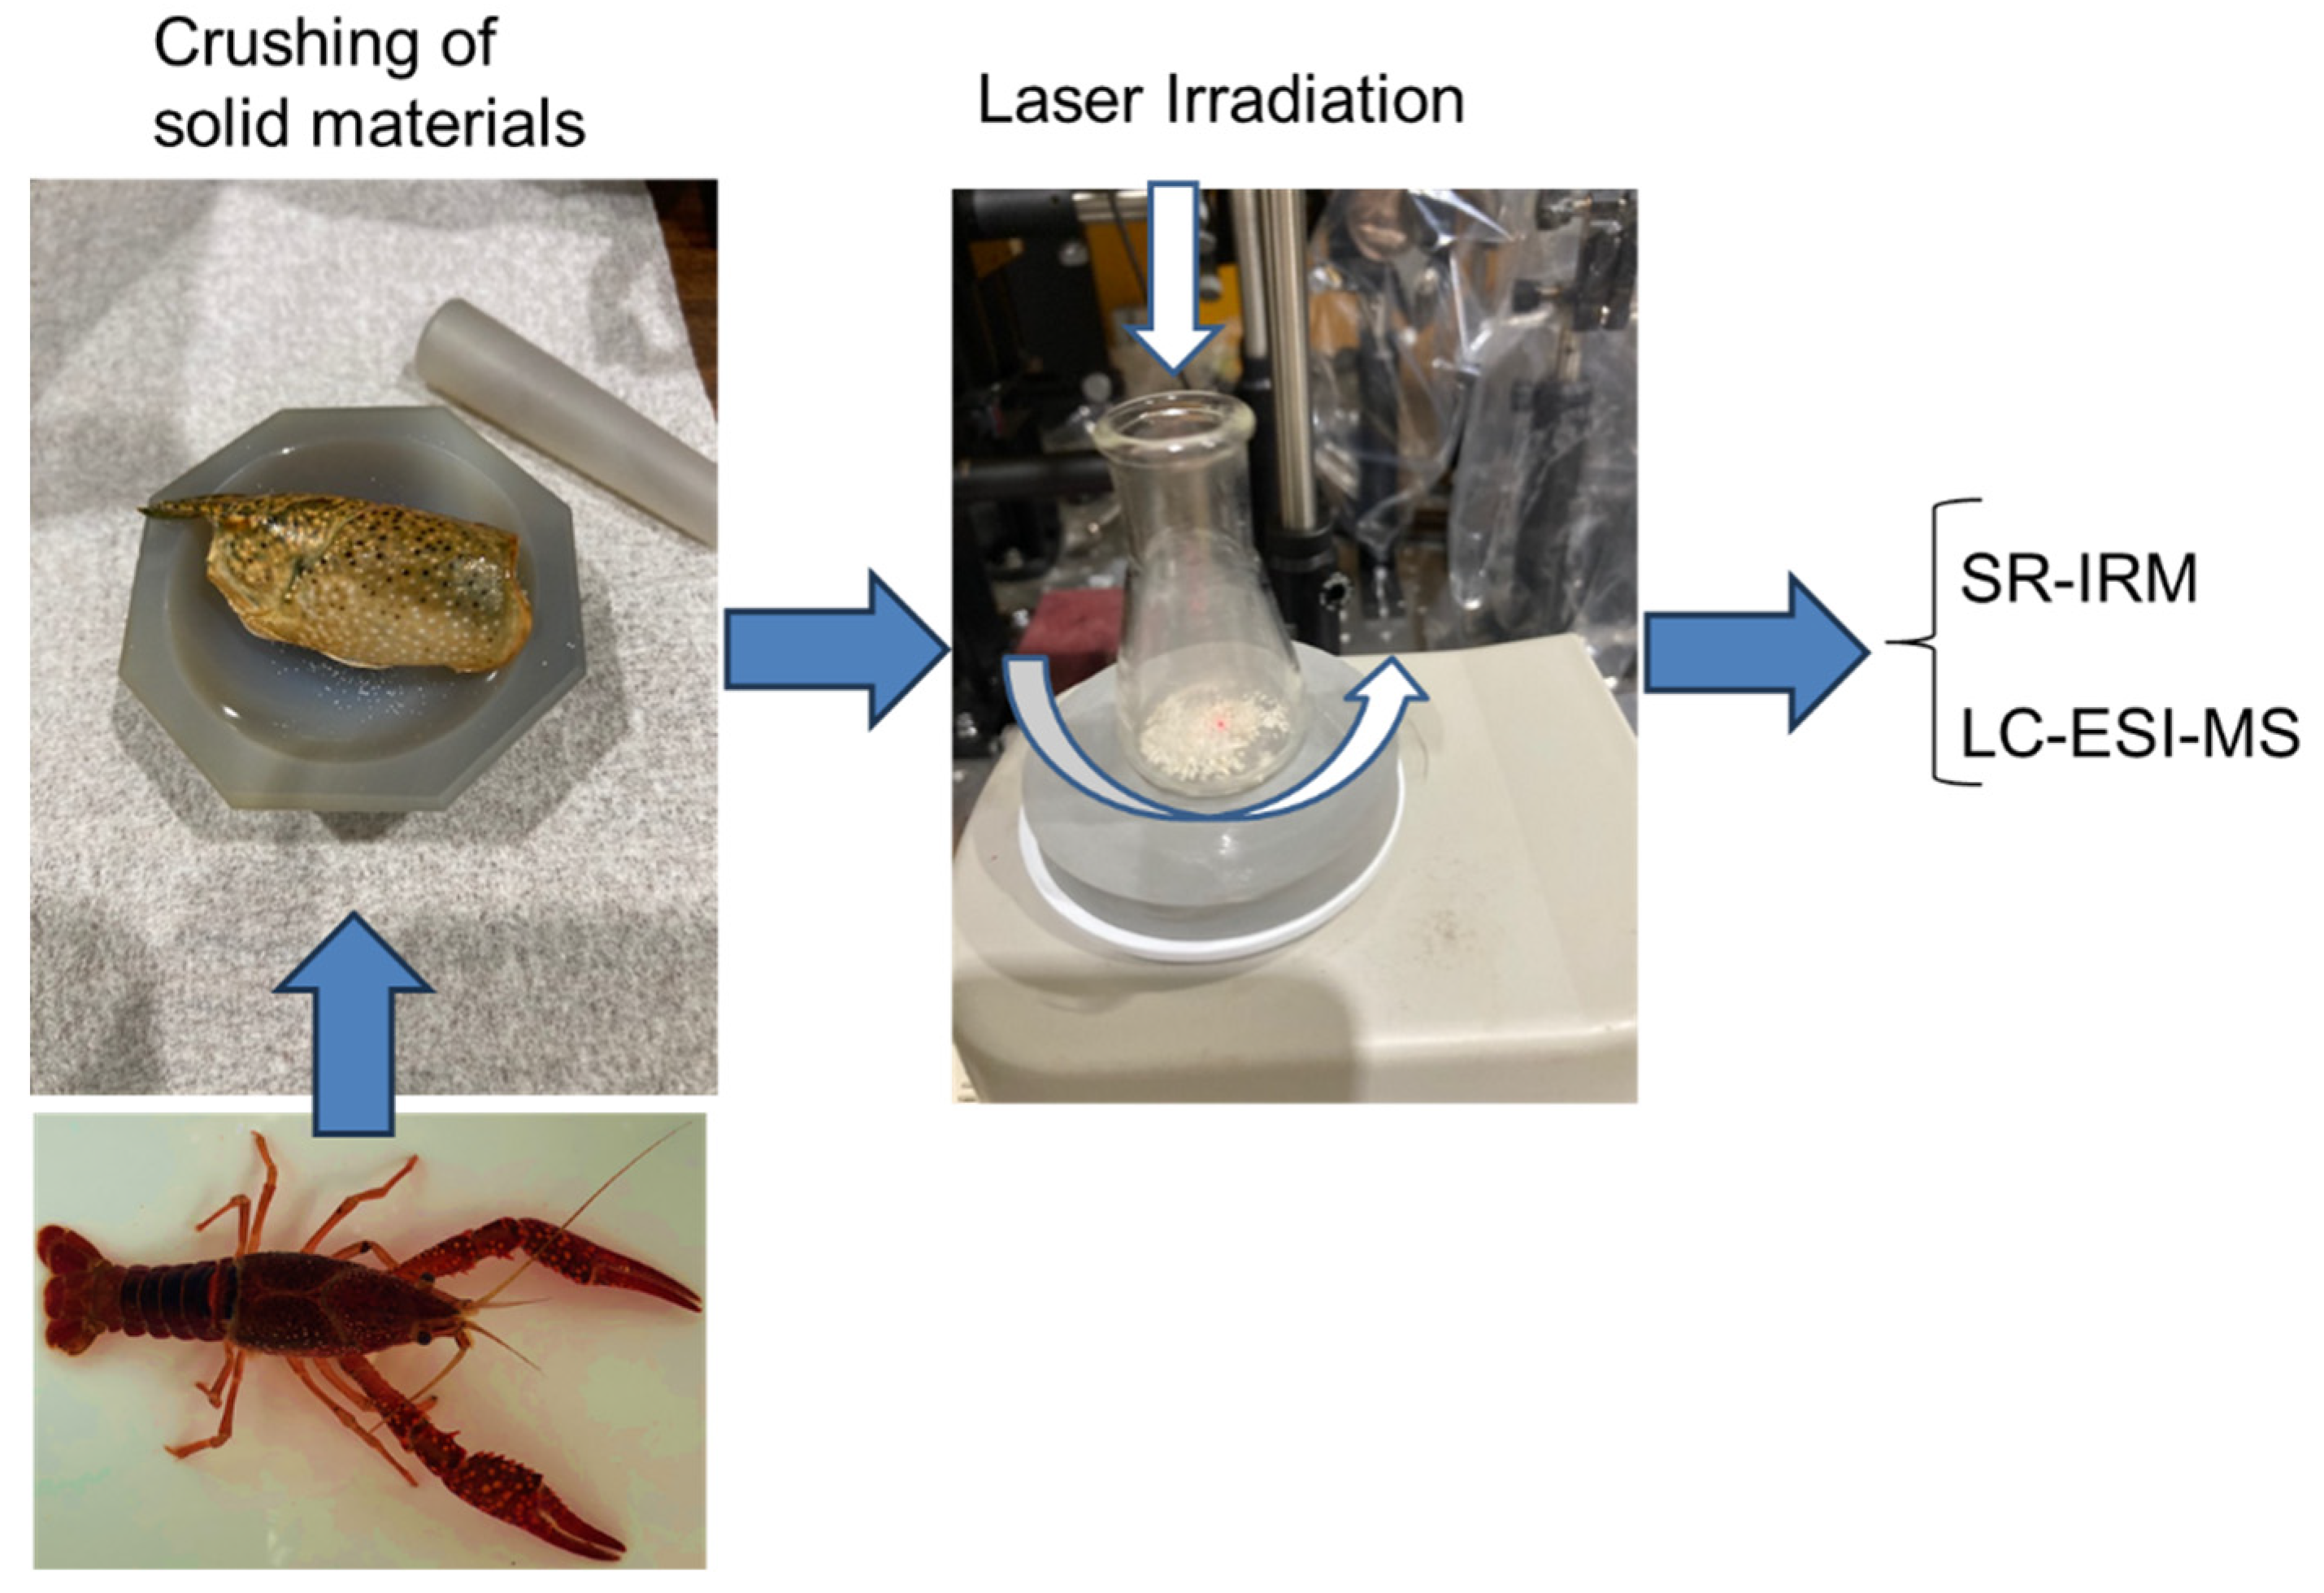
Figure 5.
SR-IRM spectra of outer shell of crayfish [58]. Upper: irradiation at 9.8 μm; bottom: non-irradiation.
Figure 5.
SR-IRM spectra of outer shell of crayfish [58]. Upper: irradiation at 9.8 μm; bottom: non-irradiation.
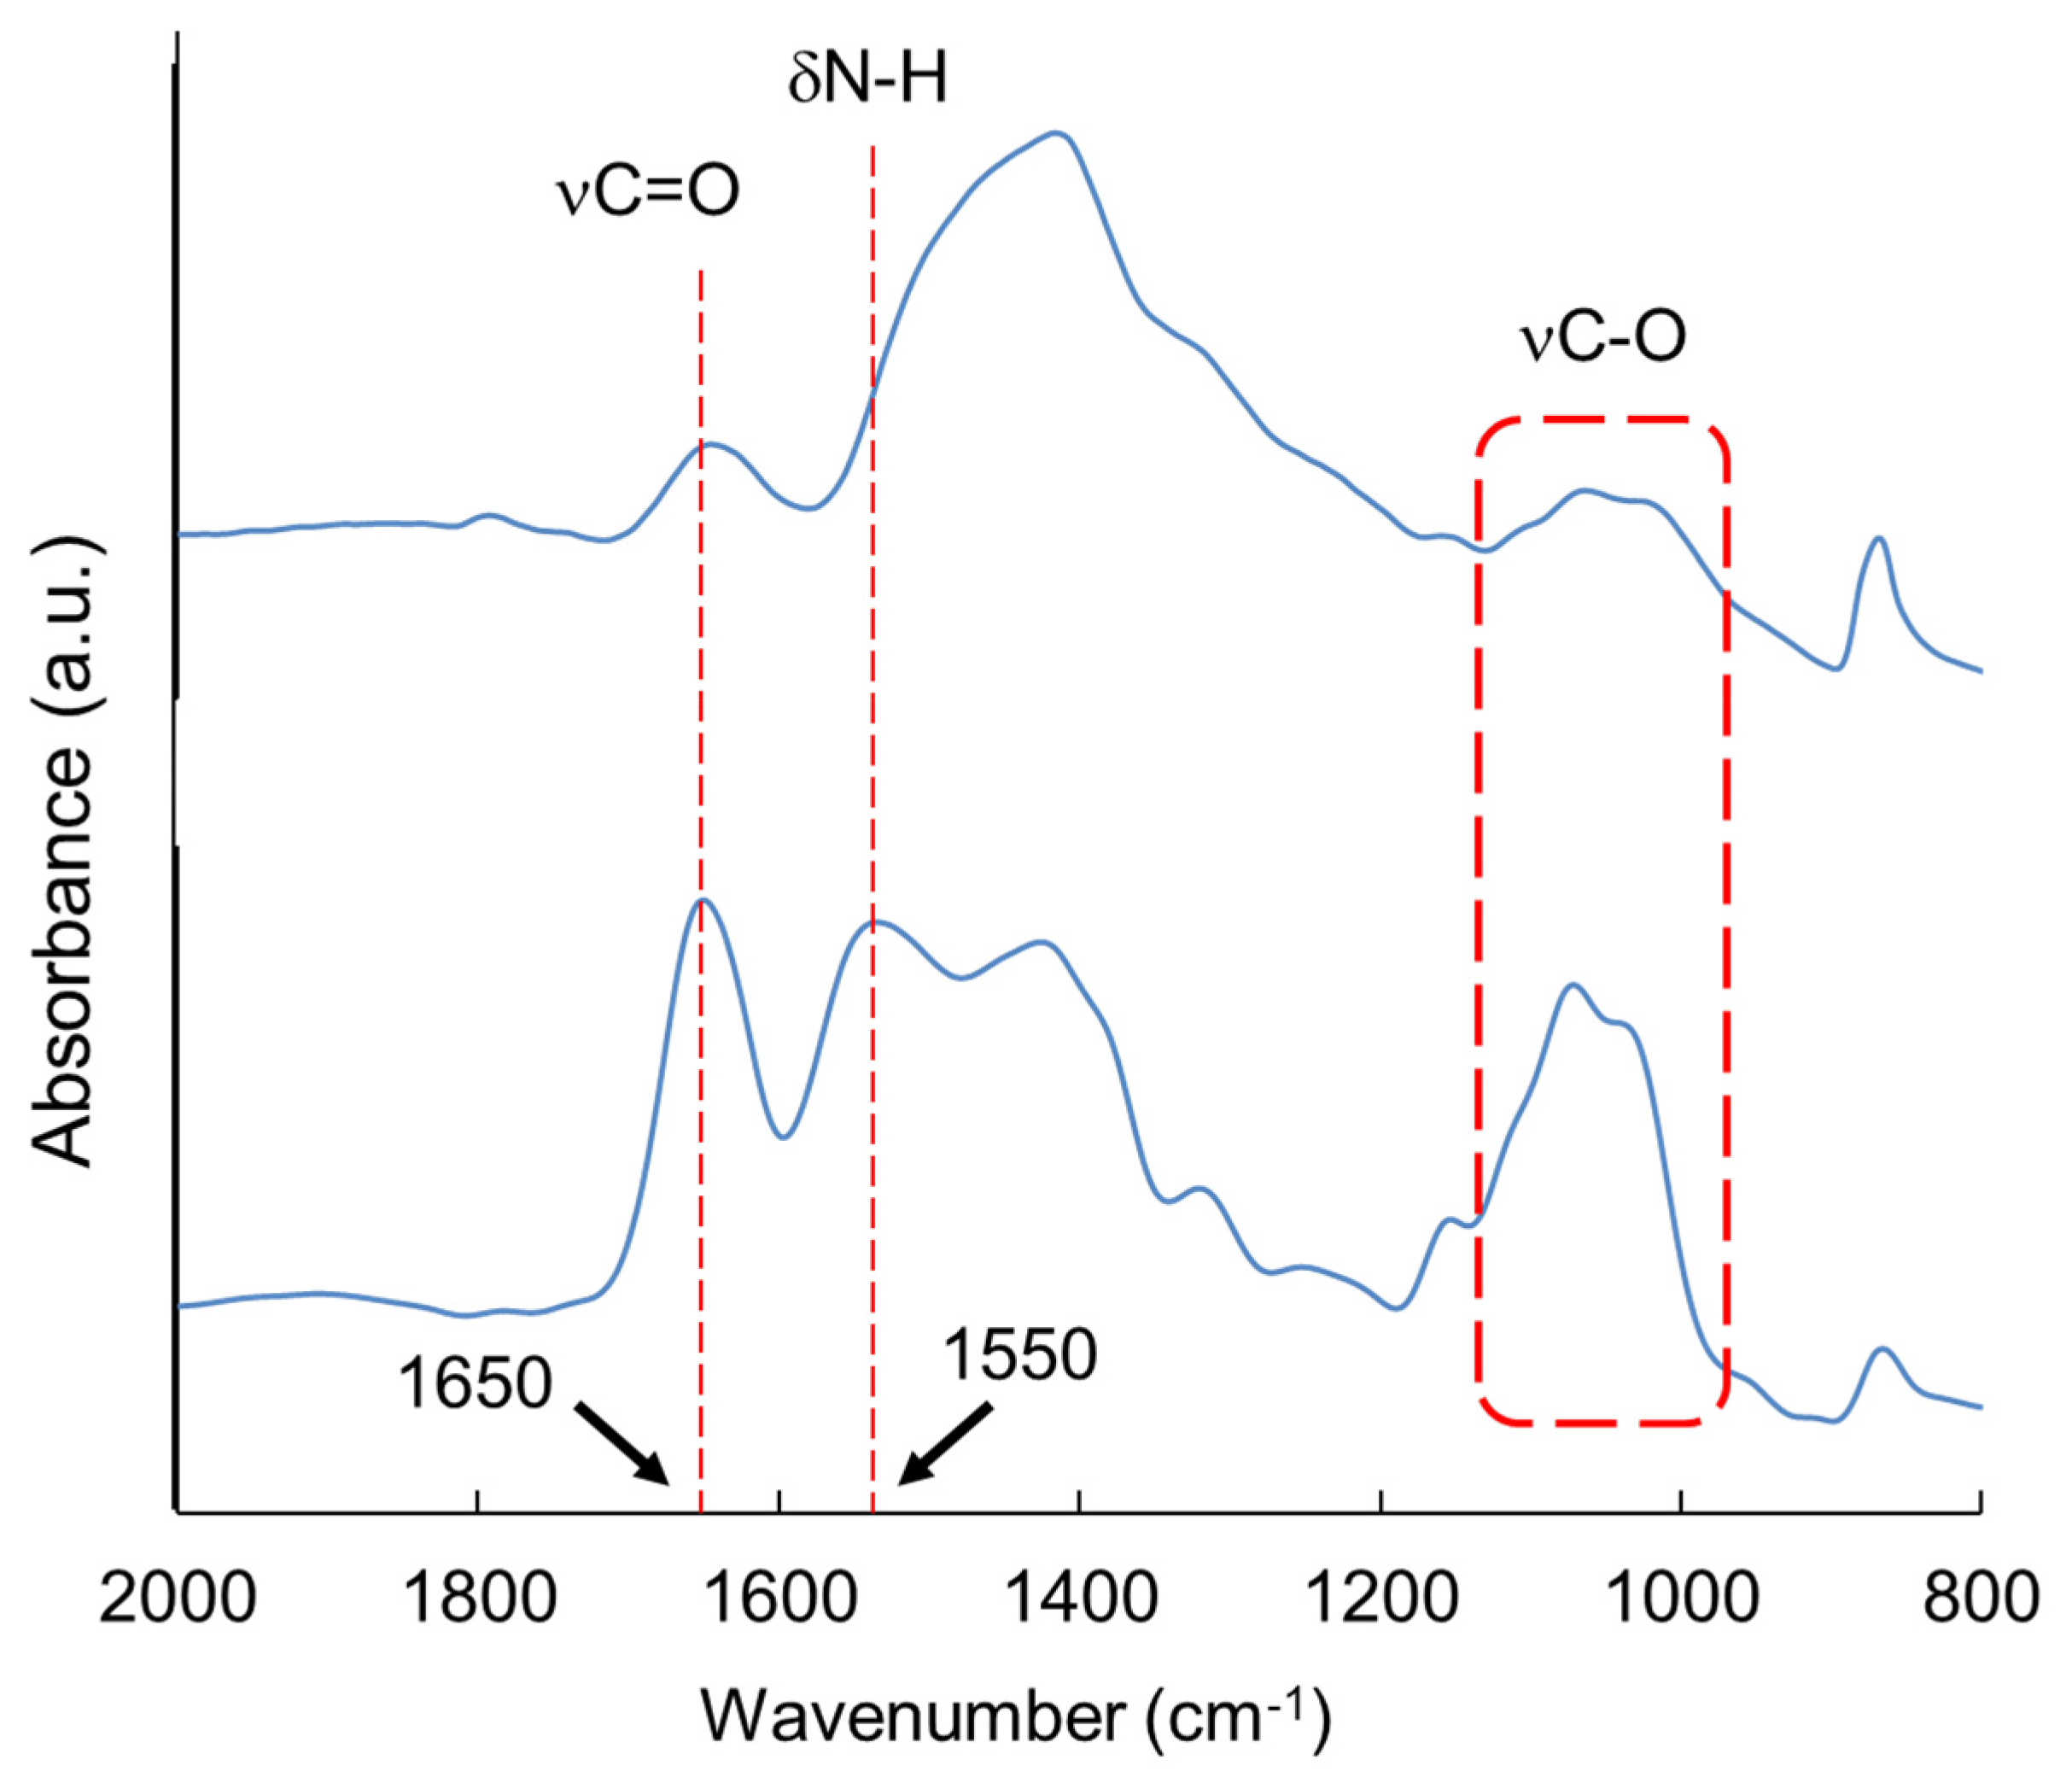
Figure 6.
LC-ESI-MS analysis of crayfish arm after irradiation by FEL [58]. (a) LC profiles after FEL irradiation at 9.8 μm (red) and 5.0 μm (black). (b) LC profile of N-acetyl glucosamine alone. (c) ESI-MS chromatograms of 243 Da after irradiations at 9.8 μm (red) and 5.0 μm (black).
Figure 6.
LC-ESI-MS analysis of crayfish arm after irradiation by FEL [58]. (a) LC profiles after FEL irradiation at 9.8 μm (red) and 5.0 μm (black). (b) LC profile of N-acetyl glucosamine alone. (c) ESI-MS chromatograms of 243 Da after irradiations at 9.8 μm (red) and 5.0 μm (black).
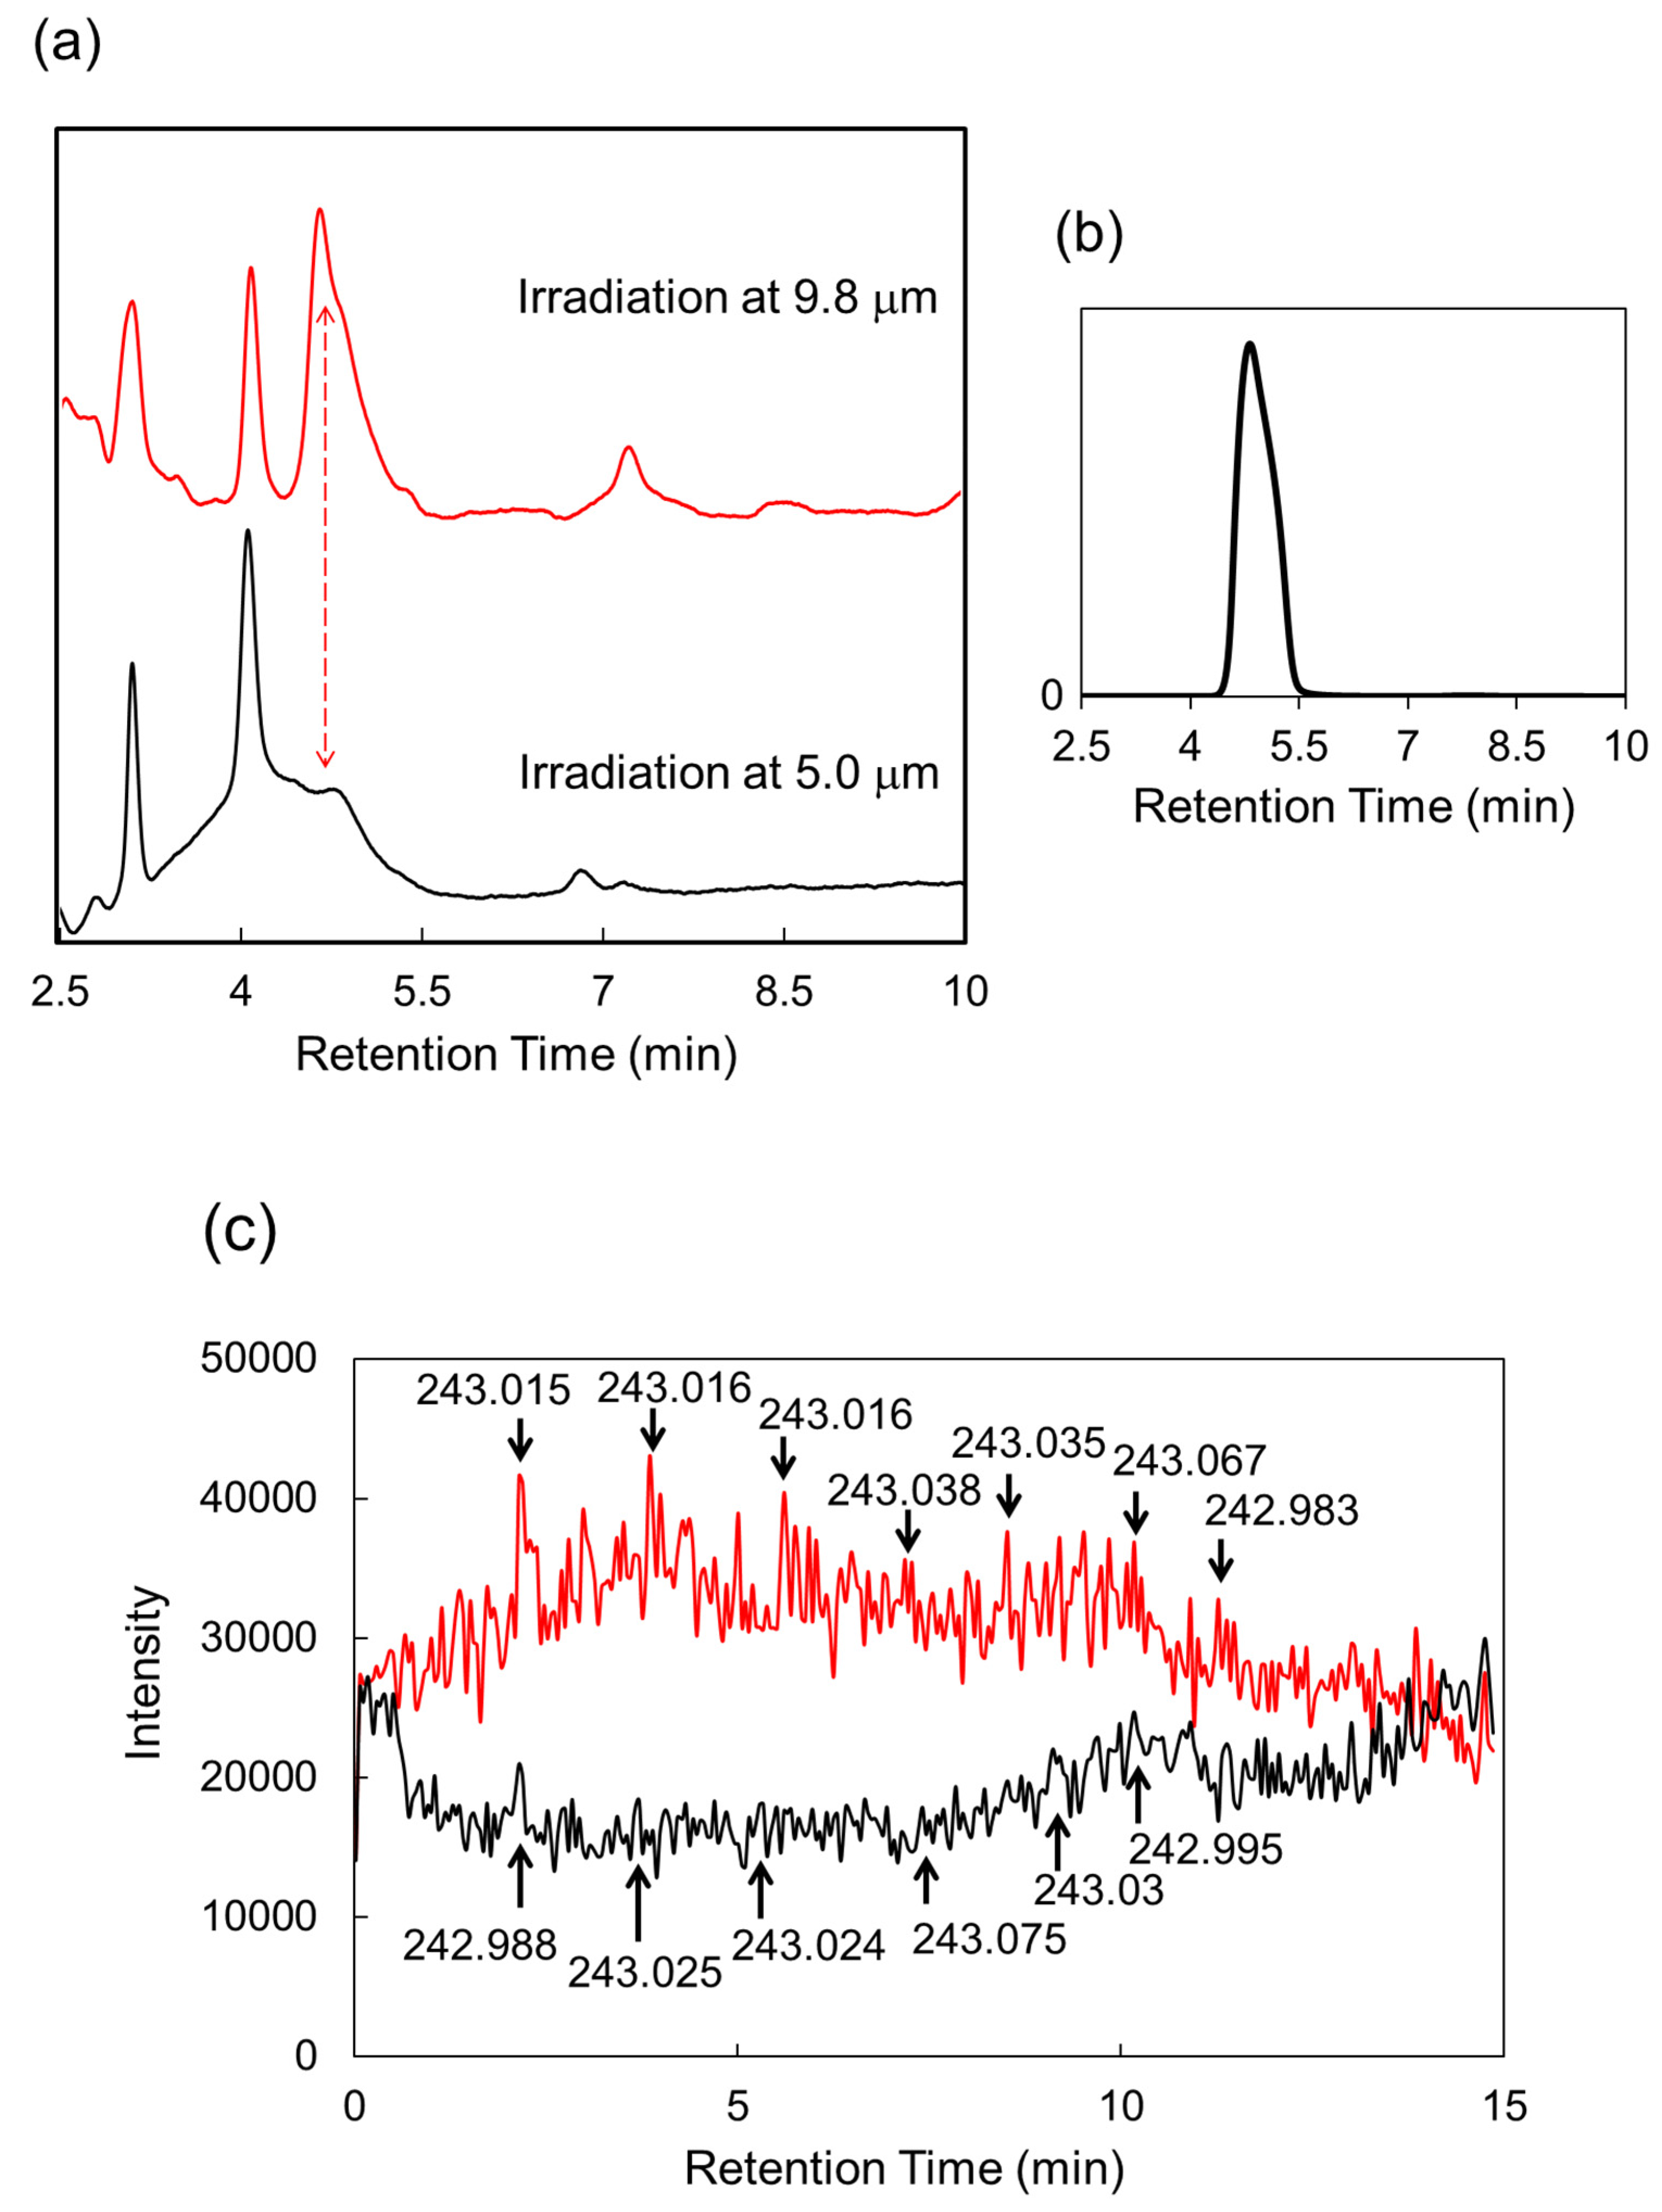
Figure 7.
SR-IRM spectra of chitin powder [58]. Upper: irradiation at 9.8 μm; middle: irradiation at 5.0 μm; bottom: non-irradiation.
Figure 7.
SR-IRM spectra of chitin powder [58]. Upper: irradiation at 9.8 μm; middle: irradiation at 5.0 μm; bottom: non-irradiation.
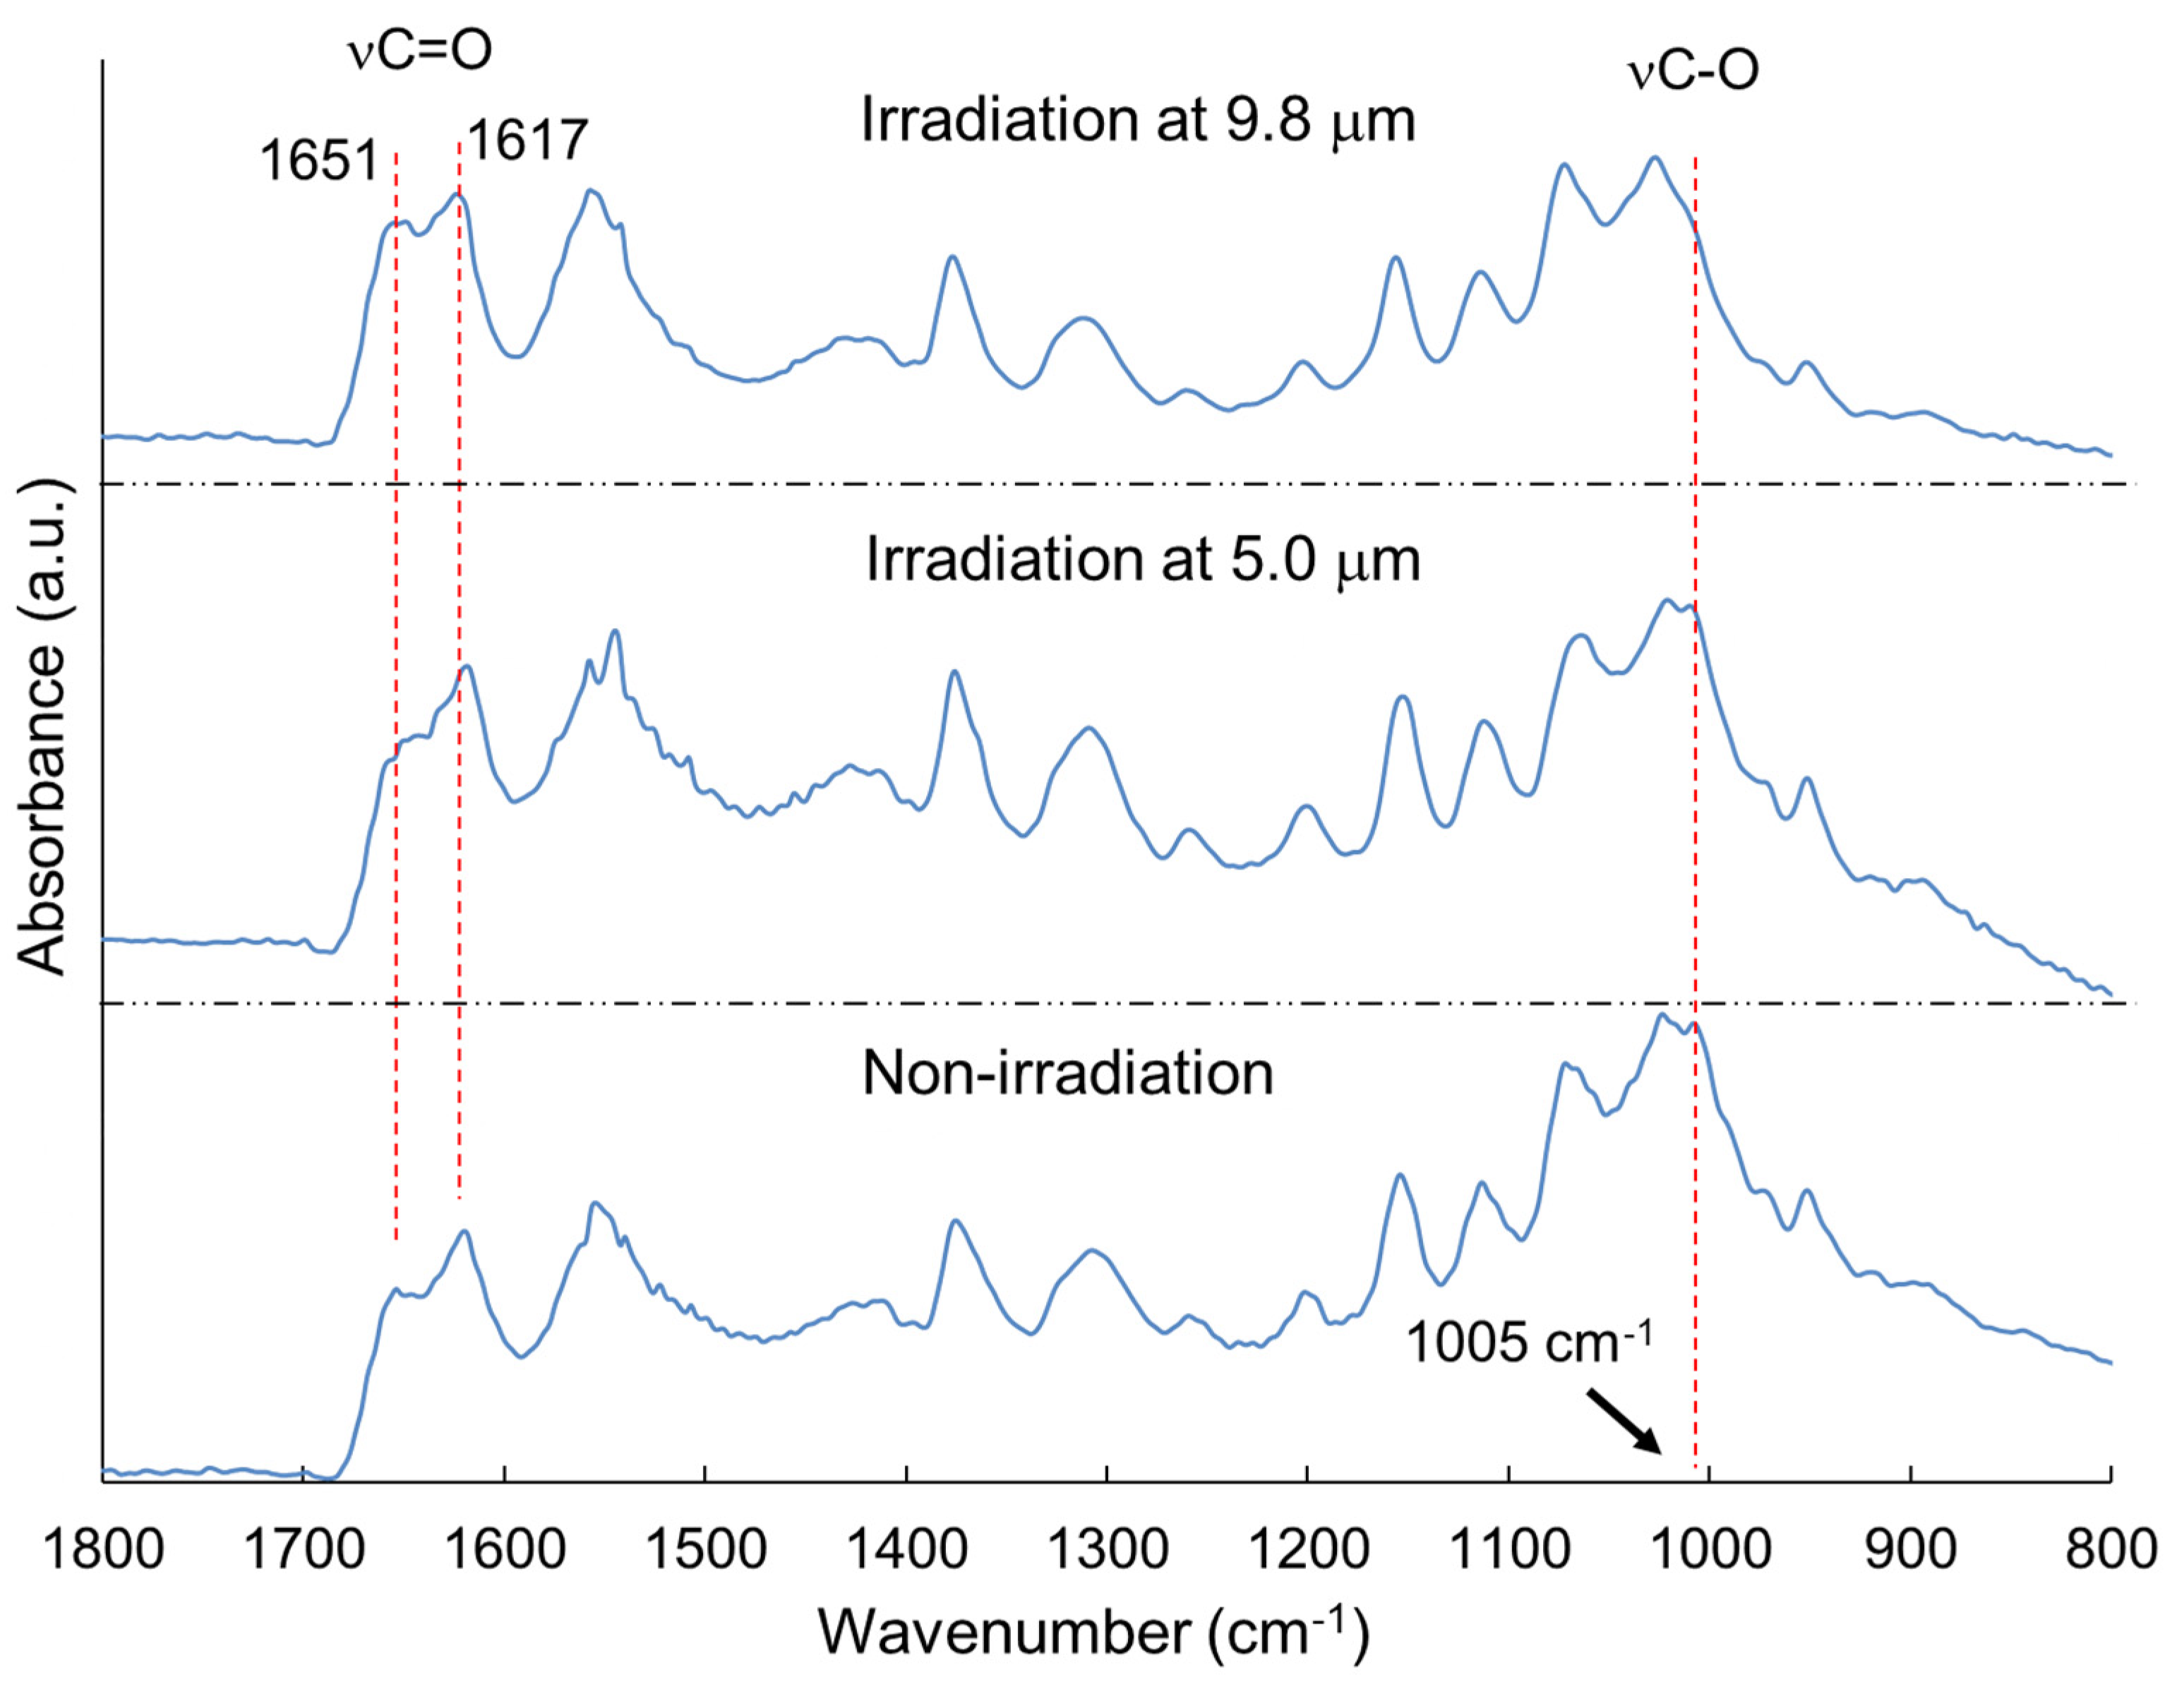
Figure 8.
Wavelengths of FEL targeting glycoside bonds in cellulose [59]. Upper: FT-IR spectrum; Bottom: resonant wavelengths around glycoside bond applied for the FEL irradiation.
Figure 8.
Wavelengths of FEL targeting glycoside bonds in cellulose [59]. Upper: FT-IR spectrum; Bottom: resonant wavelengths around glycoside bond applied for the FEL irradiation.
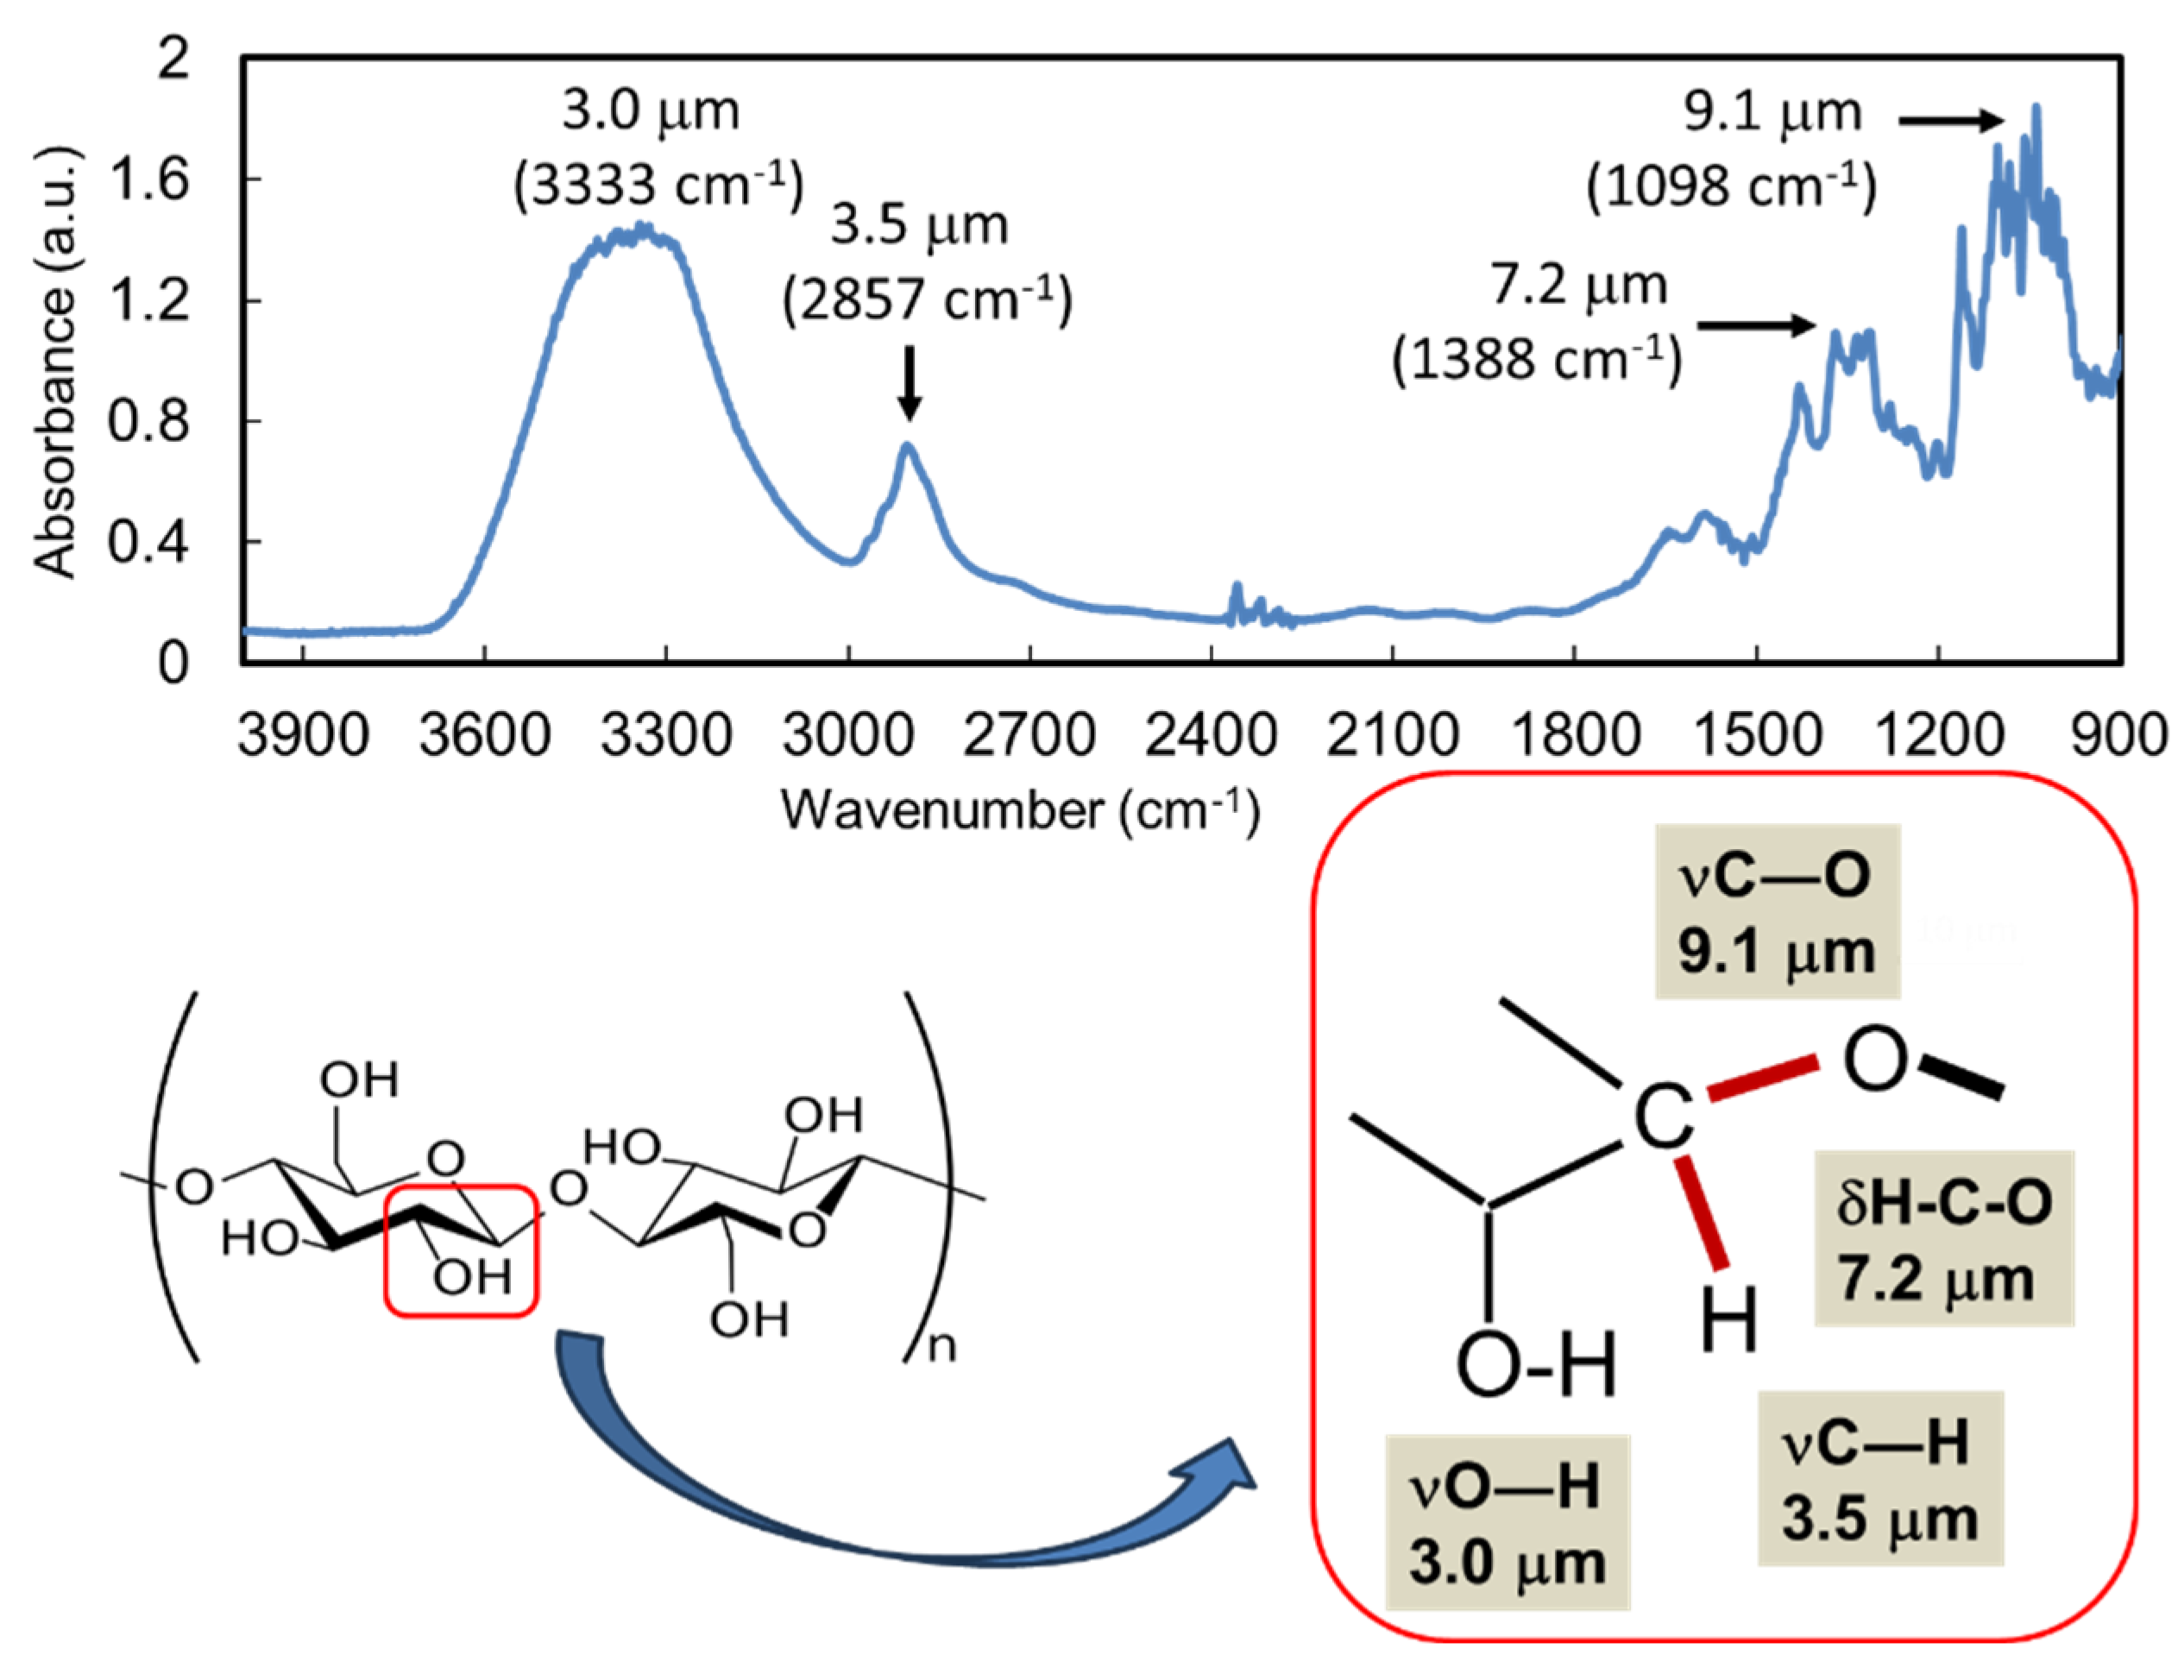
Figure 9.
SR-IRM spectra of cellulose after FEL irradiation [59]. Right: mid-IR region; left: near-IR region.
Figure 9.
SR-IRM spectra of cellulose after FEL irradiation [59]. Right: mid-IR region; left: near-IR region.
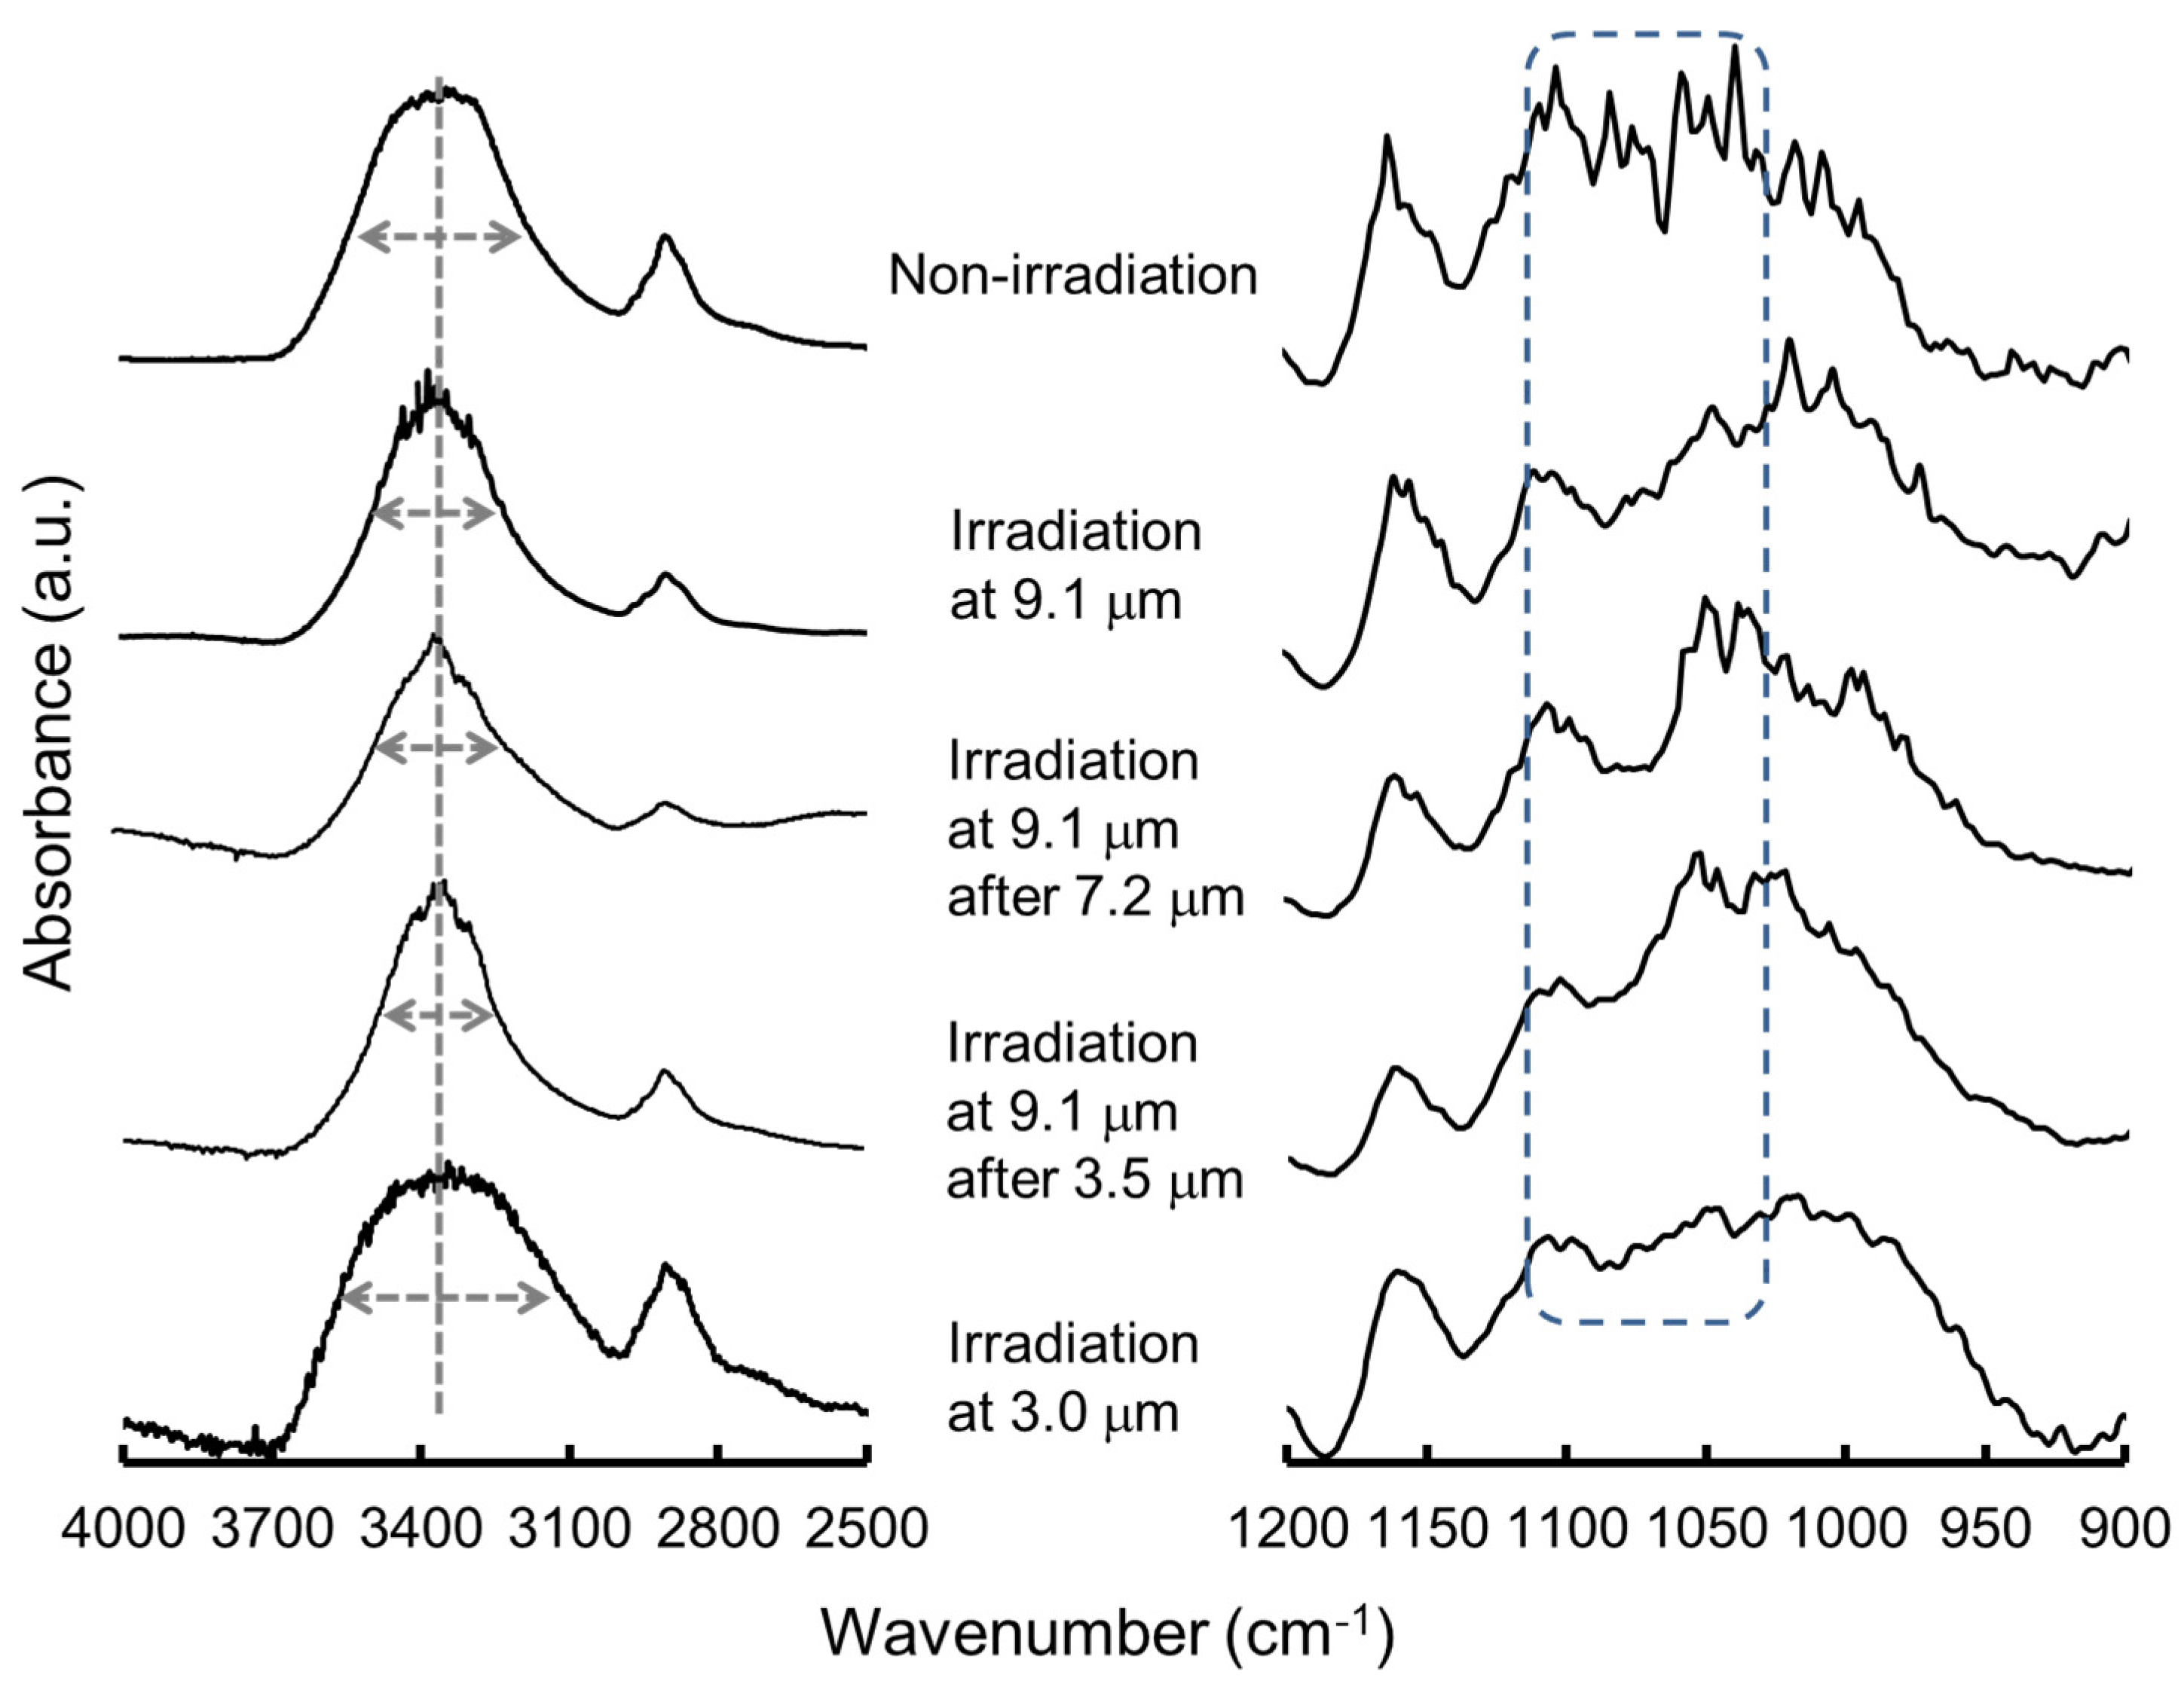
Figure 10.
ESI-MS profiles [59]. (a) Non-irradiation; (b) Irradiations at 9.1 μm after 7.2 μm; (c) Irradiations at 9.1 μm after 3.5 μm. Blue numbers indicate mono-, di-, tri-, and tetra-saccharide of glucose.
Figure 10.
ESI-MS profiles [59]. (a) Non-irradiation; (b) Irradiations at 9.1 μm after 7.2 μm; (c) Irradiations at 9.1 μm after 3.5 μm. Blue numbers indicate mono-, di-, tri-, and tetra-saccharide of glucose.
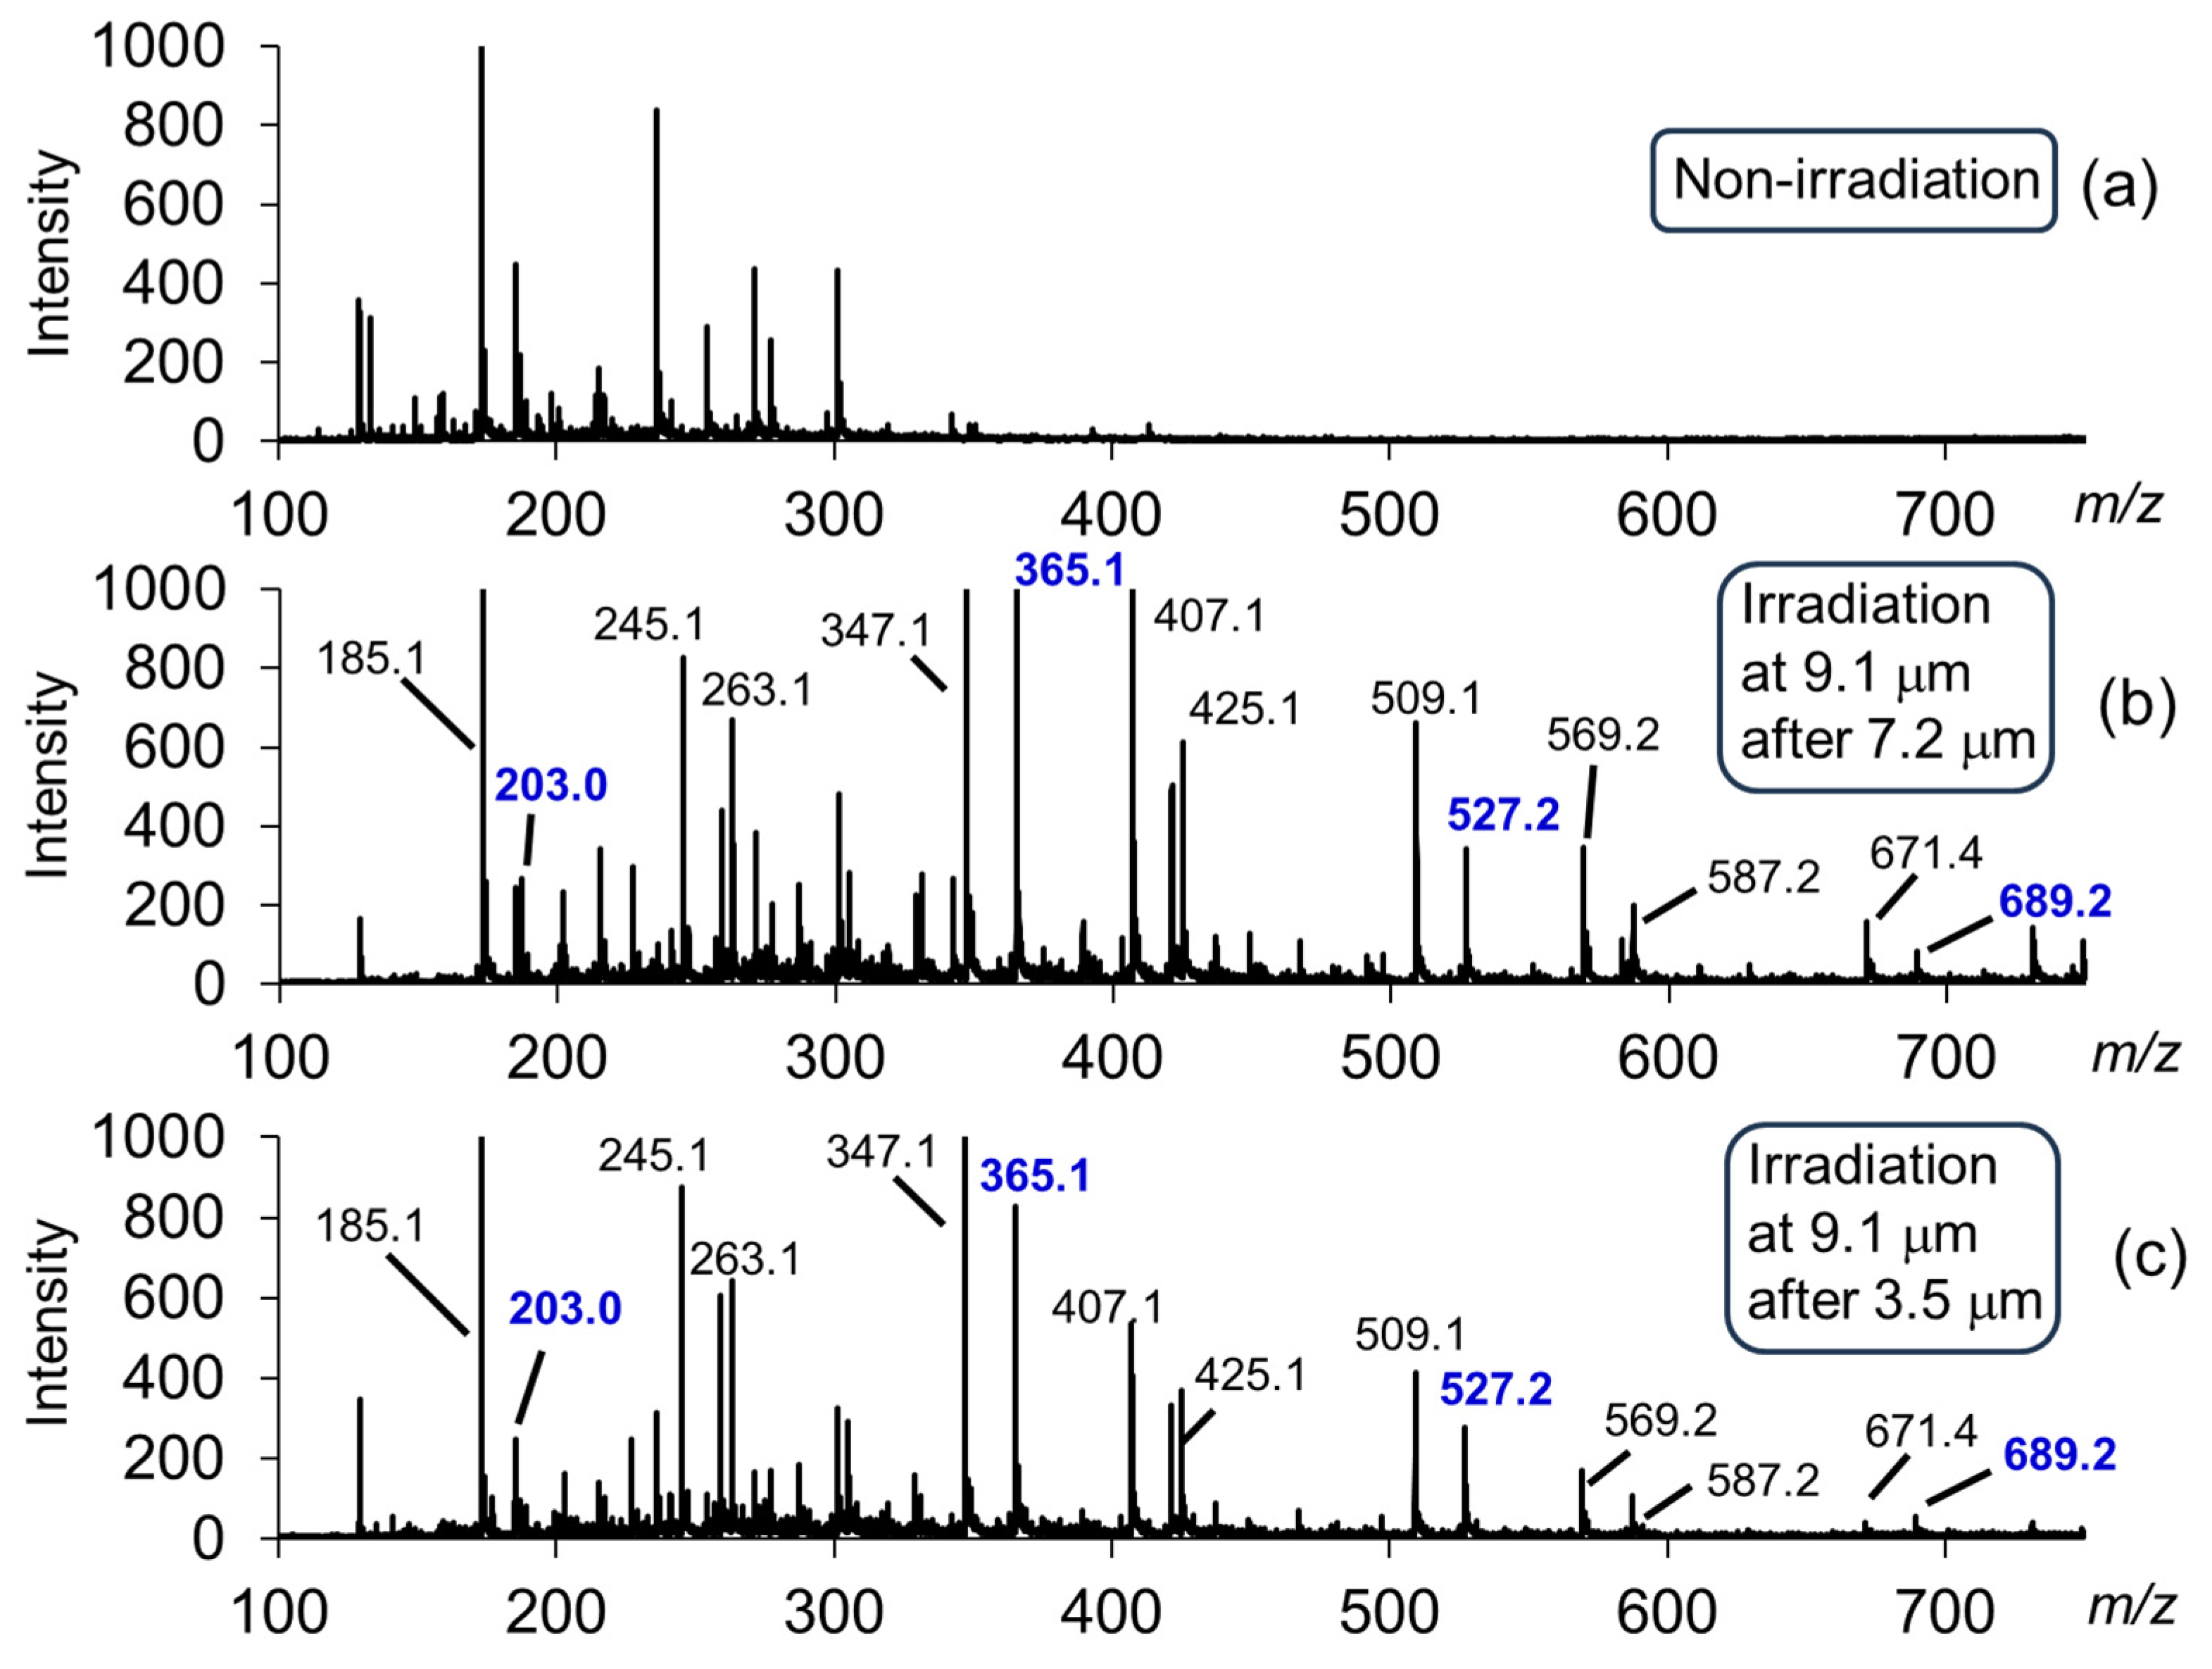
Figure 11.
MS chromatograms of cellobiose and glucose after irradiation by FELs [59]. Black: non-irradiation; brown: irradiation at 9.1 μm; light green: irradiation at 9.1 μm following 3.5 μm; deep blue: irradiation at 9.1 μm following 7.2 μm; light blue: irradiation at 3.0 μm.
Figure 11.
MS chromatograms of cellobiose and glucose after irradiation by FELs [59]. Black: non-irradiation; brown: irradiation at 9.1 μm; light green: irradiation at 9.1 μm following 3.5 μm; deep blue: irradiation at 9.1 μm following 7.2 μm; light blue: irradiation at 3.0 μm.
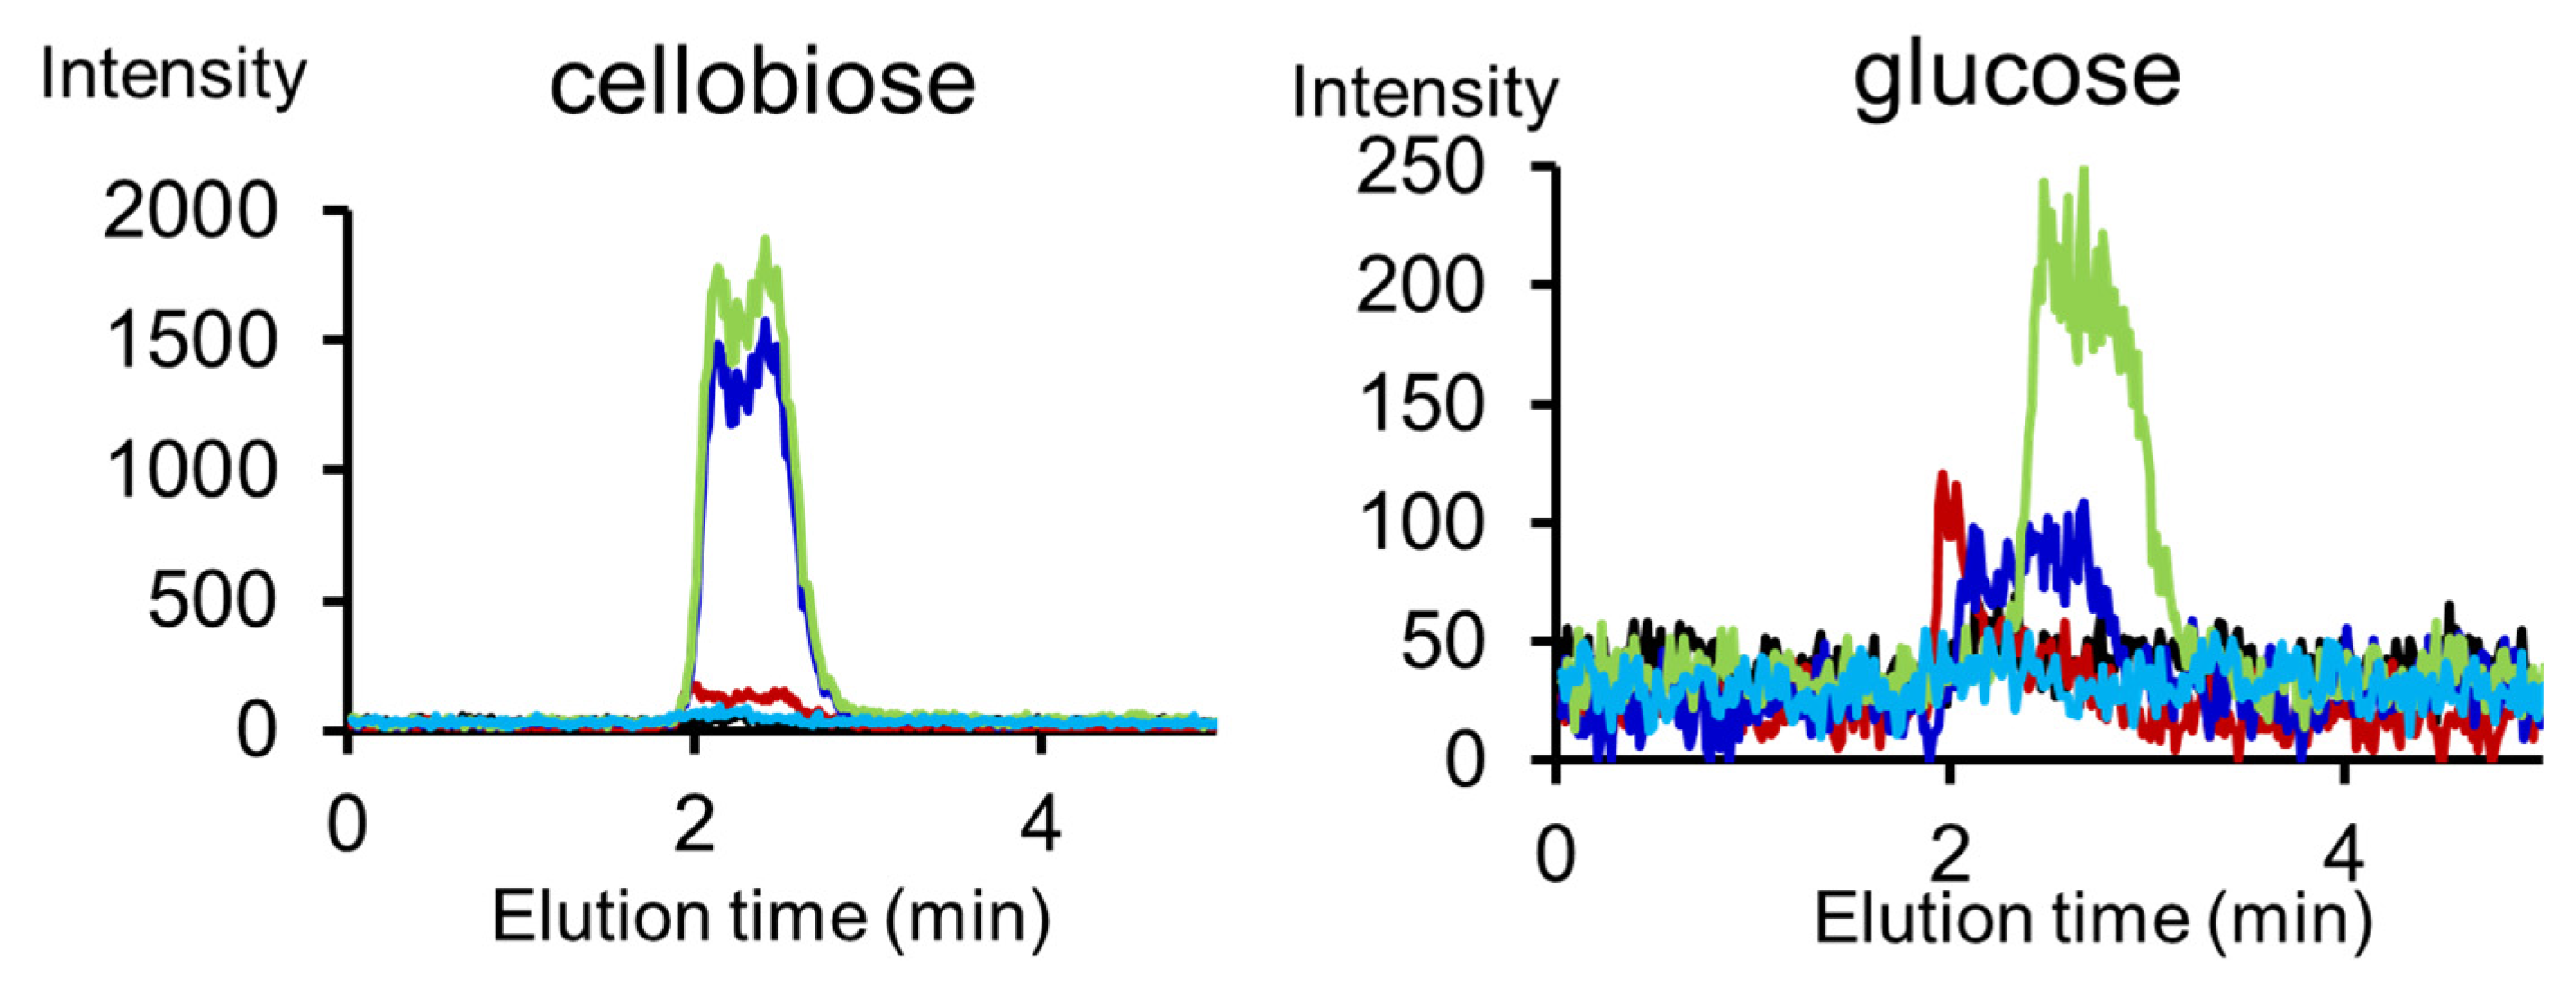

Table 1.
Various analytical techniques for natural carbohydrate polymers.
| Carbohydrate polymers | Analytical techniques | Ref. |
|---|---|---|
| Amylose | NIR, Raman, CE, AFM SEC, MALLS, 1H NMR |
40 41 |
| Amylopectin | SEC, MALLS, DSC SEM, XRD, FT-IR, 1H NMR, HPAEC-PAD, DSC, RVA |
42 43 |
| Glycogen | MALDI-MSI, N-glycosidase hydrolysis | 45 |
| Cellulose |
1H NMR, PAS TG |
46 47 |
| Chitin | FT-IR, XRD, SEM XRD, FT-IR, UV-Vis, MS, 13C NMR |
48 49 |
| Heparin | LC-MS, SAX ATR-FTIR |
50 51 |
| Hyaluronic acid | HPLC-SEC Nanopore sensor |
52 53 |
| Glucomannan | TLC, FT-IR, 13C NMR | 54 |
| N-Glycan | CE, MALDI-MS, ESI-MS | 55 |
Disclaimer/Publisher’s Note: The statements, opinions and data contained in all publications are solely those of the individual author(s) and contributor(s) and not of MDPI and/or the editor(s). MDPI and/or the editor(s) disclaim responsibility for any injury to people or property resulting from any ideas, methods, instructions or products referred to in the content. |
© 2025 by the authors. Licensee MDPI, Basel, Switzerland. This article is an open access article distributed under the terms and conditions of the Creative Commons Attribution (CC BY) license (https://creativecommons.org/licenses/by/4.0/).
Copyright: This open access article is published under a Creative Commons CC BY 4.0 license, which permit the free download, distribution, and reuse, provided that the author and preprint are cited in any reuse.


