
Submitted:
15 July 2025
Posted:
17 July 2025
You are already at the latest version
Abstract
Wireless Sensor Networks (WSNs) are key enablers of efficient communication in the Internet of Things (IoT) ecosystem. These networks comprise numerous sensor nodes that collaboratively collect and transmit data, requiring adaptive and energy-efficient management. However, high node density and resource limitations introduce challenges such as control overhead, packet collisions, interference, and energy inefficiency. To mitigate these issues, this paper adopts the Hybrid Wireless Mesh Protocol (HWMP), standardized under IEEE 802.11s for Wireless Mesh Networks (WMNs), as the routing protocol in WSNs. HWMP’s hybrid design combining reactive and proactive routing is well-suited for dynamic and mobile environments, making it applicable to WSNs operating under similar conditions. Building on this foundation, we propose a community-aware topology control mechanism that constructs a Connected Dominating Set (CDS) to serve as the network’s energy-efficient backbone. Node selection is guided by centrality metrics and detected community structures to enhance routing efficiency and network longevity. The mechanism is evaluated across six mobility scenarios characterized by realistic movement patterns. Comparative results show that incorporating community structure significantly improves routing performance and reduces energy consumption, validating the approach’s effectiveness in real-world WSN deployments.
Keywords:
topology control
; centrality metrics
; connected dominating set
; energy-efficient
; mobility models
1. Introduction
Wireless Sensor Networks (WSNs) have become essential in today’s digital landscape, driven by the rapid expansion of the Internet of Things (IoT). By 2024, the global IoT ecosystem comprises more than 15 billion interconnected devices, with projections indicating this number will double by 2030 [1]. Notably, Greater China alone accounts for approximately 5 billion IoT devices, emphasizing the widespread adoption of this technology. Furthermore, about two-thirds of these devices actively utilize IoT capabilities, showcasing its deep integration into daily life. Among the numerous applications, remote asset monitoring is one of the most prevalent, solidifying WSNs as a critical enabler in the IoT paradigm.
Efficient management of WSNs is crucial for their optimal performance. Modern networks must exhibit self-organization and autonomous maintenance [2]. The most common scenario involves networks formed mainly by mobile sensor nodes deployed in diverse environments. With technological advancements, WSNs are evolving into comprehensive sensing systems within the IoT framework, facilitating various applications such as environmental monitoring, healthcare, and smart cities [3]. As a result, mobile sensor nodes are becoming a significant research focus, aiming to leverage real-time information for enhanced personal and environmental benefits.
In WSNs, sensor nodes act as data collectors and relays [2]. However, due to the large number of nodes present in these networks, it is neither practical nor energy-efficient for all nodes to participate in routing. Common challenges include routing overhead, high packet collision probability, interference, and energy inefficiency.
To address these challenges, it becomes necessary to implement robust and scalable routing strategies that ensure energy-efficient communication. In this work, we adopt the Hybrid Wireless Mesh Protocol (HWMP) initially designed for Wireless Mesh Networks (WMNs) and standardized in IEEE 802.11s as the routing protocol within a WSN context [4,5]. Despite its origins in WMNs, HWMP’s hybrid design combines proactive and reactive routing modes, making it well-suited for dynamic and decentralized environments such as mobile WSNs [6]. This methodological alignment allows us to treat the WSN as a mesh-based system for this study, leveraging WMN features while addressing the resource and energy constraints inherent to WSN deployments.
Furthermore, mobile sensor networks often follow human mobility patterns. Traditionally, researchers relied on random mobility models such as the Random Waypoint Mobility (RWM) model [7], favored for its simplicity. However, these models fail to accurately represent real-world mobility patterns. Subsequent research has highlighted the importance of three key mobility properties: spatial, temporal, and social. Among these, social properties are particularly relevant, as they define connectivity characteristics between different nodes. Consequently, more realistic mobility models have emerged, including SWIM [8], SLAW [9], SMOOTH [10], and disaster area models [11].
Networks with human-like mobility patterns often exhibit an organized community structure. A community is defined as a subset of nodes within a network where intra-community connections are denser than those with the rest of the network [12]. Various community detection algorithms have been developed, including heuristic-based [13,14,15], balanced color heuristics [16], and optimization-based approaches [17,18,19]. Additionally, centrality-based methods, such as those in [20,21], leverage centrality metrics like betweenness centrality to identify community boundaries. These techniques are comprehensively reviewed in [22,23,24].
Integrating numerous smart devices with social relationships justifies the incorporation of social characteristics into network design strategies [25,26]. Given the challenges in WSNs and their overlap with WMNs in mesh-based topologies, implementing topology control mechanisms that consider nodes’ social interactions is essential for improving network efficiency and energy conservation.
In summary, this paper proposes and evaluates a community-aware topology control mechanism based on the centrality characteristics of a WSN. First, various mobility models are analyzed and applied to sensor nodes. Once the nodes exhibit mobility, a topology control mechanism is designed, leveraging centrality metrics and community detection techniques. The final objective is constructing a Connected Dominating Set (CDS) that forms an energy-efficient routing backbone. The proposed approach’s performance is compared with an unstructured network and a topology control mechanism that disregards community structure across multiple scenarios.
The remainder of this paper is structured as follows. Section 2 presents a theoretical framework to understand the study better. Section 3 reviews related works. The design and evaluation of the proposed topology control mechanism are detailed in Section 4. Section 5 presents results and discusses. Finally, Section 6 outline the conclusions and future research directions.
2. Theoretical Background
This section presents the foundational elements that support our proposed topology control mechanism. Although the study focuses on a Wireless Sensor Network (WSN) scenario, we adopt the Hybrid Wireless Mesh Protocol (HWMP) initially defined in the IEEE 802.11s standard for Wireless Mesh Networks (WMNs) as the routing protocol [5]. HWMP’s hybrid nature, combining proactive and reactive strategies, makes it highly adaptable to dynamic, mobile, and decentralized WSN environments [6]. By incorporating this protocol, we enable mesh-like routing behavior within WSNs, aligning with our goal of achieving scalable and energy-efficient topologies.
To build a robust theoretical foundation, we next examine the key components of the system: WSN characteristics and the rationale for using HWMP, followed by topology control strategies, human mobility models, community detection methods, and centrality metrics. These concepts provide the necessary background to understand the design and evaluation of our community-aware topology control mechanism.
2.1. Wireless Sensor Networks
Wireless Sensor Network (WSN) comprises spatially distributed sensor nodes that monitor and record environmental conditions such as temperature, sound, and pressure, transmitting the collected data to a central location for analysis and processing. Each sensor node typically consists of a microcontroller, a radio transceiver with an internal or external antenna, an electronic circuit for interfacing with the sensors, and an energy source, usually a battery [27,28]. These nodes collaborate to form a network capable of self-organization and self-healing, making WSNs suitable for environmental monitoring, industrial process control, and healthcare applications [29,30,31].
Maintaining reliable communication becomes challenging when sensor nodes are mobile or deployed over extensive areas. To address this, integrating concepts from Wireless Mesh Networks (WMNs) into WSNs has proven effective [32]. WMNs are low-cost, self-configurable multi-hop networks designed to provide ubiquitous wireless connectivity through mesh routers (MRs) [33]. These MRs are typically powerful devices with multiple radio interfaces that create a robust backbone, facilitating connectivity among nodes [34].
By incorporating mesh routers into WSNs, the network benefits from enhanced scalability, extended coverage, and improved fault tolerance. This mesh routers can handle high traffic loads and manage dynamic topologies, addressing common challenges in WSNs, such as limited energy resources and communication range. This integration enables the development of more resilient and efficient sensor networks that are capable of supporting various applications in complex environments [32,35].
2.2. Hybrid Wireless Mesh Protocol
The Hybrid Wireless Mesh Protocol (HWMP), initially specified in the IEEE 802.11s standard, is pivotal in enabling dynamic and energy-efficient routing in wireless mesh-based architectures [36]. While HWMP was initially designed for Wireless Mesh Networks (WMNs), its flexible hybrid routing strategy combining both reactive and proactive mechanisms makes it highly applicable to Wireless Sensor Networks (WSNs), particularly in Internet of Things (IoT) scenarios where mobility and topology changes are frequent.
HWMP’s hybrid approach supports efficient data dissemination under varying network conditions. In its reactive mode, route discovery is initiated only when a source station (STA) needs to transmit data to an unknown destination. This is achieved by broadcasting a Path Request (PREQ) message, which allows intermediate nodes to establish or update paths to the target node [4,37]. This on-demand mechanism is particularly beneficial for energy-constrained WSNs with low node density and dynamic traffic patterns, as it minimizes unnecessary control overhead.
On the other hand, the proactive mode of HWMP configures one or more nodes as root stations that periodically broadcast PREQ messages to maintain updated routing information. Nodes receiving these messages calculate optimal paths to the root, considering metrics such as link quality and hop count [37]. This mode is advantageous in more stable topologies and supports hierarchical communication flows, which can contribute to reducing energy consumption through structured routing.
Moreover, HWMP introduces a hierarchical network organization by categorizing nodes into specific roles, such as mesh routers, bridge routers, and end stations [38]. This role-based structure enhances scalability and energy efficiency by delegating communication tasks according to each node’s capabilities and positions within the network.
By integrating HWMP within WSNs, this work leverages mesh-like communication patterns to build scalable, robust, and energy-aware routing topologies, aligning with the broader goals of efficient IoT connectivity and long-term network sustainability [32].
2.3. Topology Control
Topology control is a foundational technique in the domain of wireless networks. It facilitates the modification of network parameters, thereby enabling the creation and maintenance of a particular network topology, thus achieving predetermined network properties [39]. Its significance is particularly pronounced in the domains of ad hoc networks and Wireless Sensor Networks (WSNs), where it plays a pivotal role. The fundamental objective of topology control is to reduce energy consumption while mitigating radio interference. Consequently, it serves to minimize packet collisions [40].
One of the primary concerns within client WMNs is the establishment of an appropriate network topology that serves as the foundation for the implementation of higher-level routing protocols [41]. Given the inherent dynamism of these networks, where topologies are in continuous change, routing schemes must demonstrate robustness in the face of these alterations.
A predominant approach to topology control mechanisms revolves around the adjustment of node transmission power [40,42,43]. In such systems, the employment of high transmission power levels can lead to complications related to interference, while low power levels result in network fragmentation. Alternatively, certain mechanisms are contingent upon the power mode of individual nodes, encompassing transmission, reception, idle, and sleep states. Furthermore, certain mechanisms adopt a clustering approach, often relying on the strategic selection of a Connected Dominating Set (CDS), as exemplified in the works of Qi et al. [44] and Farooq et al. [45].
The challenge inherent in finding a Dominant Set (DS) hinges on identifying a subset D of nodes in the network graph, such that each node belongs to D or is adjacent to it [46]. The formation of a connected graph by the nodes within this DS results in the transition of the DS to the form of a CDS. The nodes that comprise the CDS constitute the network’s backbone. The quality of the resultant reduced topology can be assessed on various criteria, including connectivity, energy efficiency, throughput, and resilience to mobility dynamics [47].
2.4. Human Mobility Models
In the domain of Wireless Sensor Networks (WSNs) and Wireless Mesh Networks (WMNs) simulations with mobility devices, the employment of representative scenarios that closely resemble real-world conditions is of critical importance. The attainment of this degree of realism frequently necessitates the incorporation of mobility traces into the networks under examination [48]. However, acquiring authentic mobility traces for particular scenarios poses a considerable challenge, necessitating significant time, resources, and the deployment of numerous devices. Consequently, a pragmatic approach entails the utilization of synthetic traces generated by mobility models. These models encapsulate human behavior patterns through mathematical formulations, thereby offering a means to approximate the movements of network nodes. Leveraging mobility models enables the production of network performance evaluations that closely mirror real-world outcomes.
In this context, the Random Waypoint Mobility (RWM) [7] model is one of the most frequently utilized mobility models. In this study, we have considered the most relevant models in light of contemporary human behavior. Table 1 summarizes the main characteristics of the discussed models relevant to simulations in WSN and WMN. This comparison emphasizes the complexity, realism, and application contexts of each model, which supports selecting appropriate models for specific simulation requirements.
2.4.1. Lévy Walk Model
In the study of mobility models, the Lévy walk model is a notable paradigm. This model encapsulates aspects of human behavior by integrating statistical characteristics associated with Lévy walk movements, a form of random motion primarily governed by diffusion processes [51]. Initially devised to elucidate the behaviors of certain animal species [52,53], the Lévy walk model transformed when Rhee et al. introduced the concept of a truncated Lévy walk (TLW) model [49]. The TLW model attempts to replicate human decision-making processes when navigating toward intended destinations, lending a degree of intentionality to the otherwise stochastic nature of Lévy walks.
The TLW model has notably served as the basis for subsequent mobility models, including SWIM, SLAW, and SMOOTH. These models have contributed to a more nuanced understanding of network node mobility patterns within the context of WSNs.
2.4.2. Small World in Motion (SWIM)
Small World In Motion (SWIM) is an efficient, parameter-sparse mobility model designed to emulate human mobility patterns. Unlike other models, which require many input parameters, SWIM captures human behavior by simulating tendencies, such as frequenting nearby places or popular social spots, over time.
SWIM divides the simulation area into cells equivalent in size to the node’s transmission radius. Nodes have individual weights based on cell popularity and distance from their randomly assigned home location. SWIM also uses a cell distance weight parameter (), which governs node behavior; higher values promote proximity to home and neighbors, while lower values encourage exploration of popular locations. SWIM offers a streamlined approach to modeling complex social mobility patterns in wireless networks [8].
2.4.3. Self-Similar Least-Action Human Walk (SLAW)
Self-Similar Least-Action Human Walk (SLAW) is a comprehensive mobility model designed to simulate complex human behaviors. While it involves more input parameters than SWIM, SLAW leverages contemporary statistical patterns derived from human mobility studies, including truncated power-law distributions, pause times, inter-contact times, fractal waypoints, and individually defined mobility zones [9,54,55].
SLAW is designed to represent diverse social scenarios, such as university campuses, shopping centers, restaurants, and theme parks. It can generate mobility traces for regular trips, which are common for individuals with set routines, as well as sporadic trips, which are ideal for modeling those who visit random locations. This flexibility distinguishes SLAW from models such as RWM or TLW.
2.4.4. SMOOTH Mobility Model
SMOOTH emerges as a pragmatic and realistic mobility model, offering a simplified alternative to SLAW while retaining essential human behavioral characteristics [10]. Like SLAW, SMOOTH incorporates critical mobility and human behavior attributes.
Although the Hurst parameter is simpler than that of SLAW, it still yields commendable performance. In SMOOTH, the movement of nodes is intricately linked to social behavioral patterns and community dynamics. For example, certain offices in a building, such as a conference room, may receive more frequent visits than others. Consequently, SMOOTH generates clusters of varying sizes and randomly distributes them. The number of clusters is an input parameter, and each group is assigned a different popularity value. Popularity dictates the frequency of visits to each group, thus influencing the likelihood that a group will be selected as a destination. This approach effectively captures the dynamics of human behavior within various settings [56].
2.4.5. Disaster Area Model
In an intriguing approach outlined in [11], a unique mobility model is introduced to simulate disaster scenarios. The primary objective is to create scenarios in which to test and assess the optimal and efficient performance of communication systems under challenging circumstances. Due to the critical importance of reliable communication systems in disaster scenarios, this model paves the way for evaluating topology control techniques in such environments. Consequently, it has garnered our attention and is under consideration for integration into this research effort.
The disaster area model is based on the concept of room separation, where care rooms and the locations of rescue personnel are strategically distributed throughout the simulation area. Key areas incorporated into the model include the incident location (IL), the emergency patient waiting area (PWT), the casualties clearing station (CCS), the transport zone (comprising the ambulance and helicopter areas), and the technical operation command (TOC) [11] .
2.4.6. Map-Based Mobility Model
Most mobility models, including SWIM, SLAW, and SMOOTH, operate without considering geographic boundaries. These models are scale-free by nature and show no variation in response to geographical constraints. However, the work presented by [50] is a notable departure from this convention. It incorporates geographical restrictions into the SLAW mobility model, producing the Map-Based Self-Similar Least-Action Human Walk (MSLAW) model. This enhancement introduces a novel dimension to performance results in mobile network simulations.
Furthermore, integrating geographic boundaries enables interaction with propagation models, leveraging the distribution of buildings and environmental obstructions to improve the model’s accuracy in representing real-world scenarios.
2.5. Community Detection
In graph theory, it is important to understand the difference between network partitioning and community detection. Network partitioning involves dividing a network into groups of roughly equal size. The number of groups and their sizes are predetermined. However, communities in reality exhibit varying sizes. Community detection, on the other hand, seeks to uncover these network properties and accommodate the inherent heterogeneity found in actual communities.
Several metrics are used to evaluate the quality of a community structure, with modularity being the most widely embraced. Defined by Newman and Girvan [17], modularity quantifies the discrepancy between edge density within a community and the expected density if the edges were distributed randomly in the network. For weighted networks, modularity (Q) is calculated using Equation 1.
where, A is the adjacency matrix, represents the edge weight between nodes i and j, denotes the sum of edge weights connected to node i, signifies the assigned community for node i, equals 1 if and 0 otherwise, and m is half the sum of all edge weights in the graph.
Essentially, community detection involves grouping nodes based on strong internal connections and weaker external connections. Many algorithms have been proposed for this task, but optimal community detection algorithms are NP-hard, particularly those focused on maximizing modularity. Therefore, approximation algorithms are often preferred. Many existing algorithms focus on binary networks, where edges have a weight value of 1 if they exist and 0 if they do not, as in certain environments, such as biological networks. However, real-world networks are typically weighted, requiring community detection algorithms that account for these weight values [57].
2.6. Centrality Metrics
In the field of social network analysis, graph-theoretic metrics are widely used to identify the most critical nodes in a network. Centrality measures are particularly valuable because they are designed to identify the most influential actors. The following components are considered the most relevant for this study.
2.6.1. Betweenness Centrality
Betweenness centrality is assumed to play a central role in this study. It is defined as the fraction of all shortest paths between pairs of nodes that pass through a given node. In essence, this metric quantifies the extent to which a node can control the flow of information between other nodes within the network. The betweenness centrality of a node v is shown in Equation 2.
where is the number of shortest paths between j and k, is the number of shortest paths between j and k that pass through v and N is the total number of nodes in the network [58].
Regarding communities, in [57] two centrality metrics derived from the betweenness centrality are defined: Intra-centrality and Inter-centrality.
2.6.2. Intra-Centrality
Intra-centrality () measures the influence of a node within its community. It is calculated by determining its betweenness centrality while considering only nodes that belong to the communication, as shown in Equation 3.
where is the community to which v belongs and is the total number of nodes that belong to . If a node belongs to more than one community, then it has an value for each community to which it belongs. This occurs in the case of overlapping communities.
2.6.3. Inter-Centrality
The inter-centrality () of a node v for two communities and is defined as the betweenness centrality of v considering only the nodes that belong to either community (see Equation 4). If a node belongs to more than one community, then it has an intra-community betweenness centrality value for each community to which it belongs (in the case of overlapping communities). In general, inter-centrality measures the capability of a node to communicate these two communities. Each node has a value for each pair of communities in the network.
Intra-centrality is a useful method for identifying the most influential nodes within a single area. However, inter-centrality does not appear to be a viable method for detecting nodes that bridge two or more densely populated regions. This is because advance knowledge of all the communities in the network is required, and each node would generate an value for each pair of communities, implying high memory usage.
2.6.4. Bridging Centrality
Bridging centrality is a derivative of betweenness centrality. It identifies nodes that facilitate substantial information flow between densely connected regions, which are often characterized by high modularity [59]. Bridging centrality () combines betweenness centrality () and the bridging coefficient () of a node, as shown in Equation 5. is defined in Equation 6.
where is the degree of node v and is the set of neighbor nodes of v. According to [59], the nodes that are actually considered bridging nodes are those within the 25% with the highest values in the network.
3. Related Work
Due to their potential to improve network efficiency, topology control mechanisms for wireless sensor networks (WSNs) have garnered significant attention in the scientific community. This surge in interest has prompted numerous studies compiling various topology control techniques.
One of the primary objectives of topology control is to optimize energy usage and extend battery life. This challenge has spurred significant efforts within the scientific community to address this issue. For instance, in [39], a detailed overview of distributed topology control techniques is provided, with a primary emphasis on extending battery life in wireless sensor networks (WSNs). These techniques fall into two categories: 2D and 3D algorithms. 2D algorithms are further divided into power adjustment, power mode, clustering, and hybrid approaches. Conversely, 3D algorithms address topology control in specialized settings, such as indoor or underwater environments. Similarly, [60] presents a comprehensive review of topology control techniques in WSNs, with a focus on full coverage, barrier coverage, sweep coverage, energy management, and power control.
Furthermore, in [61], a taxonomy is introduced to classify topology control problems in WSNs. The two main classifications are network coverage and network connectivity. These works also emphasize the importance of energy management as a foundational framework for addressing topology control challenges. Similarly, Huang et al. [62] contribute to a taxonomy of topology control algorithms, primarily emphasizing energy efficiency for Internet of Things (IoT) applications. These algorithms fall into three categories: homogeneous, heterogeneous, and miscellaneous. The first two categories assume homogeneity or heterogeneity among network devices, respectively, while the "others" category considers factors such as device location, direction, and neighboring nodes.
In recent years, topology control based on discrete Markov processes has emerged as an effective strategy for extending the operational lifetime of star-configured wireless sensor networks (WSNs). This strategy models node state transitions in active, inactive, or sleep modes. It also dynamically optimizes duty cycles to minimize energy consumption without sacrificing connectivity [63,64]. Meanwhile, federated learning has gained prominence as a privacy-preserving approach to training AI models collaboratively across distributed devices, ranging from mobile phones to healthcare systems and autonomous vehicles, by keeping raw data localized and only exchanging model updates [65,66]. Comprehensive surveys of federated learning have identified several key challenges, such as non-independent and identically distributed data, data heterogeneity, communication efficiency, and model security. These surveys have also speculated about the potential evolution of federated learning toward artificial consciousness, which is subject to rigorous ethical scrutiny. Together, these studies outline the current state of the art at the intersection of energy-efficient WSN design and decentralized, privacy-aware machine learning.
Other studies focus on strategically placing network elements to improve topology. In [67], the authors review placement strategies, buffering capacity, and mobility models for implementing Throwboxes in delay-tolerant networks (DTNs). Throwboxes serve as relays between network nodes to improve delivery rates, reduce delays, and alleviate the load on mobile nodes.
Other studies emphasize devising adaptable topology control techniques. In [68], the focus is on topology control in mobile ad hoc networks (MANETs). The authors propose a method to determine the optimal topology during update intervals through node group prediction, thereby minimizing the nodes’ cumulative energy consumption. Conversely, in [69], the authors specify topology control for monitoring landslides in WSNs. This flexible topology works in both normal and emergency conditions. This approach demonstrates the versatility and applicability of topology control in specialized contexts.
In the domain of community awareness, a considerable body of literature employs Social Network Analysis (SNA) methodologies, frequently utilizing centrality metrics such as betweenness centrality, degree centrality, and closeness centrality, among others. As demonstrated in [70], nodes with a high degree of centrality can influence the dependability of Wireless Mesh Networks (WMNs). The efficacy of the TDMA channel access scheduling algorithm implemented in high-centrality nodes is demonstrated through its implementation in the nodes, thereby showcasing network performance enhancements. In the study by Meghanathan et al. [71], centrality metrics are employed to identify Connected Dominating Sets (CDSs) in complex graphs. The formation of the smallest CDSs is often predicated on betweenness centrality. In addition, an investigation was conducted in [72] that entailed a comparison between degree, closeness, and betweenness centrality metrics to establish a WMN backbone. The findings indicated that betweenness centrality exhibited enhanced stability and fragmentation performance in networks with randomly distributed nodes. In contrast, Shifani et al. propose the IoT-based Secured Data Exchange Protocol (IoTSDEP) in order to further enhance community awareness through SNA in [73]. This paradigm enables social communities in Wireless Sensor Networks (WSNs) to share information in a decentralized and resilient manner. By leveraging lightweight encryption, secure routing, and intrusion detection, the system enhances efficiency, scalability, privacy, and trust.
A subset of research endeavors involves the integration of centrality metrics and community structures with the objective of enhancing network performance. As stated in the research paper "Bubble Rap" [74], a routing algorithm is provided that is rooted in social behavior. This algorithm integrates community structure knowledge and node centrality values to facilitate routing decisions. The "Bubble Rap" protocol is designed to facilitate the dissemination of data packets to prominent nodes within the network framework. This dissemination process is informed by a combination of global and local rankings, thereby ensuring the optimal delivery of information. In [57], an algorithm for packet forwarding is proposed in Delay-Tolerant Networks (DTNs), which utilizes community structures and metrics of intercentrality and intracentrality.
Despite the preponderance of prior studies in topology control that have focused on transmission power adjustment and node placement, there have been independent and joint endeavors to develop topology control and packet forwarding algorithms through the utilization of centrality metrics and community structures. This work introduces a community-aware topology control method for WSNs, emphasizing the discovery of a connected dominant set (CDS) within a homogeneous WMN. Nodes outside this CDS deactivate their routing functions, leading to reduced topologies. The proposed approach is evaluated and compared with a non community-aware topology control method exclusively reliant on centrality metrics.
4. Topology Control Mechanism
In this section, an overview of the environment under research is provided. In the following section, we delineate the community detection algorithm that was utilized for the evaluation. We proceed to assess various router selection methods based on centrality metrics and community structures. Consequently, an exhaustive evaluation of the resulting reduced topologies was conducted for all scenarios evaluated in this study.
4.1. Scenarios Under Consideration
In this study, the scenarios were selected according to the criteria outlined in [48] with the objective of closely replicating the environments of social behavior in real life. Each scenario under consideration comprises a WSN that has been expanded to a WMN, consisting of 100 nodes that adhere to the 802.11s standard. The nodes have been meticulously positioned within a delineated area measuring 1024 by 520 meters. In order to maintain uniformity and objectivity in the evaluation process, it is imperative that all simulations adhere to a consistent structural foundation. The duration of each simulation is fixed at 500 seconds. The distinguishing factor among these scenarios is the mobility model that governs the movement of the nodes. The integration of six distinct mobility models has been successfully executed. The following models are employed: The following terms are to be considered: SWIM, SLAW, SMOOTH, Disaster Area, Map-Based, and Random Waypoint.
The objective of this study is to validate performance enhancements across a spectrum of realistic settings. The input parameter configurations for the initial four mobility models comply with the specifications delineated in [8,9,10,11]. In the case of the map-based scenario, it emulates a portion of Cuenca, Ecuador. In the Random Waypoint Mobility (RWM) model, each node autonomously selects a destination and proceeds toward it along a straight path at a randomly determined speed within the range of to . For the purposes of this study, the node movement speed has been set to vary between 2 and 4 meters per second, with a maximum pause time of 20 seconds.
For all models of mobility, with the exception of the map-based model, the Bonnmotion software is employed [75]. Conversely, the map-based model utilizes SUMO software for emulation.
4.1.1. Community Detection
As previously indicated, the adoption of human mobility patterns by nodes within the network naturally gives rise to the formation of communities over time as a result of social interactions. These communities are distinguished by the observation of increased temporal and spatial interactions among their constituent nodes. Consequently, the initial step in devising a community-aware topology control mechanism is to identify and track these evolving communities within each scenario.
The Louvain algorithm, as delineated in [76,77], has been identified as the optimal approach for community detection. This algorithm is characterized by its global and centralized nature, with a foundation in modularity maximization. It demonstrates proficiency in the identification of communities within weighted networks. The acceleration of the Louvain algorithm is achieved through the implementation of the Grappolo tool, which utilizes parallel execution techniques as outlined in the work by Lu et al. [78].
The Louvain algorithm requires the weight matrix of the network’s links as an input parameter. The construction of this matrix is predicated on the nodes and the connections between them. The nodes are derived from the mobility traces of each mobility model, while the edge weights are determined by simulating the same nodes under the 802.11s standard and the HWMP protocol to establish connections [79].
That is, the edge weights are determined by the expression , where represents the airtime link metric of 802.11s, and denotes the maximum value of observed throughout the network. The Airtime Link Metric is a quantitative metric that quantifies the channel resources required for transmitting a frame over a specific link. Lower metric values are indicative of more favorable links. Therefore, the maximum difference between the nodes’ values, that is, , is indicative of the strength of the link between the two nodes. The output is a matrix comprising the nodes and the community to which each is assigned.
4.2. Routers Selection
In Section 2.6, the emphasis is placed on the significance of betweenness centrality and its derivatives in the context of network information flow regulation and forwarding. A higher betweenness centrality value for a node is indicative of greater control over the information flowing between nodes. Given that the topology under study exhibits a community structure due to the various applied mobility models, it becomes evident that topology control design should consider these communities. In accordance with the findings of prior studies [48,59,72], the decision has been made to utilize betweenness and bridging centrality metrics in the selection of routers.
This work proposes a methodology for selecting the most central nodes within each community based on betweenness centrality, as well as the nodes that optimally connect the communities to each other using bridging centrality. This approach is intended to establish a group of mesh routers (MRs) and thereby construct the backbone network.
For the bridging nodes, the selection criterion invariably encompasses the top 25% of nodes that exhibit the highest values of bridging centrality within the network. This percentage aligns with the conclusions drawn from prior research, as outlined in [59], where the definition of bridging nodes was derived from empirical studies.
In this study, we propose and assess three distinct selection methods for central nodes based on betweenness centrality within each community. The selection methods include the k most central nodes, Community-Aware Highest Betweenness Intra-Centrality Neighbor (C-A HN), and Community-Aware Highest Betweenness Centrality Neighbor (C-A HN). Furthermore, a comparative analysis is incorporated with the topology control method proposed in [72], referred to as "2 Highest Betweenness Centrality Neighbors" (2HN). The subsequent sections will provide a detailed exposition of each of these methods.
4.2.1. k-Most Central Nodes in Each Community
In this method, a specific number, denoted k, of the most central nodes within each community is selected based on their betweenness centrality () values. In this study, we specifically assess two values of k, namely and . Furthermore, as previously mentioned, we identify the top 25% bridging nodes as MRs. These selected nodes will serve as MRs and form the backbone.
4.2.2. Community-Aware Highest Intra-Centrality Neighbor (C-A HN)
The proposed method entails the selection of a neighbor node with the highest value by each node in the network, thereby designating it as a router. In addition to the previously described methodology of selecting the top 25% of bridging nodes, the following steps are to be taken. As delineated in Equation 1, signifies the betweenness centrality of a node, evaluated exclusively within its community. Nodes that do not belong to the same community are assigned an value of 0 and therefore not considered for router selection. The approach of nodes selecting immediate neighbors as routers ensures that there are no isolated nodes left in the network, except for those without established peer links.
4.2.3. Community-Aware Highest Betweenness Centrality Neighbor (C-A HN)
In this method, each node calculates its betweenness centrality () without taking into account the community of the node or the communities to which other nodes belong. Subsequently, each node selects its neighbor with the highest betweenness centrality value within the same community. In order to be considered eligible, neighboring nodes must belong to the same community as the node in question. Consequently, the node is only required to ascertain its community in order to restrict the selection to eligible neighbors.
4.2.4. 2 Highest Betweenness Centrality Neighbors (2HN)
This mechanism is predicated exclusively on centrality metrics, eschewing any consideration of edge weights. In the 2HN method, each node selects its two neighbors with the highest betweenness centrality values as mesh routers (MRs). As in C-A HN, 2HN is predicated on a CDS whose elements constitute the network backbone. This method does not take into account the community structure of the network. This decentralized approach enhances network performance and promotes greater energy efficiency in comparison to WMNs that lack topology control [72].
4.3. Network Connectivity Assessment
As previously employed in a related study [72], the efficacy of each method was assessed by evaluating two vital attributes of the resulting topologies: the fragmentation of the resulting backbone and the number of isolated nodes.
The quantification of graph fragmentation is achieved through the implementation of a metric delineated in [80] which conceptualizes fragmentation as the proportion of nodes that are disconnected from one another. It is asserted that the generated backbone should demonstrate an absence of fragmentation, thereby signifying that all selected router nodes must ensure the maintenance of direct or indirect connectivity. The presence of fragmentation in a network is indicative of its disconnection. However, while a connected backbone is vital, it does not necessarily ensure the absence of isolated nodes. To address this concern, a further evaluation of the number of isolated nodes associated with each proposed method is warranted. The utilization of these two evaluation measures in conjunction facilitates the selection of the optimal method concerning network connectivity.
As illustrated in Figure 1, Figure 2, and Figure 3, the topologies generated by each proposed method are depicted, with the corresponding backbones shown in each case. In the accompanying illustrations, blue nodes are indicative of selected routers (MRs), green nodes are representative of mesh client nodes (MCs) that do not route traffic, and red nodes are representative of isolated nodes. The ensuing results are contingent upon the SWIM scenario, with a temporal frame of 30 seconds. However, an exhaustive analysis of snapshots from all six proposed scenarios reveals consistent patterns.
The results obtained from each method are summarized in Table 2. This table includes the backbone fragmentation and the count of isolated nodes. The method of selecting k most central nodes in each community, with and , reveals the presence of fragmented backbones and numerous isolated nodes (see Figure 1). This observation indicates that the selection of routers is not optimal. Conversely, the C-A HN method achieves complete backbone connectivity without isolated nodes, selecting 49% nodes as mesh routers (see Figure 2). In a similar vein, the methods C-A HN and 2HN both attain full backbone connectivity, with 40% and 47% of the nodes selected as routers, respectively (see Figure 3). In summary, the C-A HN and 2HN methods have been shown to consistently yield superior network connectivity results. For this reason, they have been selected for further analysis in this study.
4.4. Analysis of the Resulting Topologies
In this section, an analysis of the resulting topologies obtained through the C-A H N control mechanism is carried out. To conduct the analysis, 50 simulations were executed, with each simulation lasting 500 seconds. Additionally, topology control was updated at an interval of 5 seconds for each mobility model, which comprised 100 mesh nodes.
The initial segment of Table 3 presents the outcomes of the number of routers selected by the C-A H N method for the six mobility models. The results are expressed in terms of minimum, maximum, mean, and standard deviation values, denoted by . On average, approximately 39% of the nodes function as routers in all scenarios. The RWM scenario necessitates the implementation of a substantial number of mesh routers, thereby substantiating the efficacy of the proposed method in conjunction with socially aware mobility models that emulate real-life community structures.
The second section of Table 3 presents a compilation of data concerning the number of state transitions (between MR and MC) that occurred in the nodes during the simulation for each scenario. As was the case in the initial section, the results are expressed with the minimum value, maximum, mean, and standard deviation, denoted by . As anticipated, scenarios such as Disaster Area and SWIM demonstrate a greater propensity for state transitions due to their elevated degree of mobility and dynamism, wherein nodes frequently undergo transitions between groups or communities. On average, 23 state changes occur during the simulation period in these scenarios, equivalent to a rate of 2.76 changes per minute. Conversely, the SMOOTH scenario exhibits the fewest alterations, with nodes predominantly relocating to proximate family neighborhoods. Consequently, the state change rate for this scenario averages 1.46 changes per minute. State changes directly impact node energy consumption. Temporary role assignments enable nodes to deactivate their routing functionalities intermittently, thereby averting protracted battery drainage.
The final part of Table 3 offers a summary of the mean number of edges in both reduced and full topologies (all nodes as MR) during the simulation. The C-A HN topology control has been demonstrated to achieve edge reduction percentages ranging from 31% to 44%. This has been shown to result in enhanced network performance, as detailed in Section 5.
5. Results and Discussion
In this section, an evaluation of the network’s performance following the application of different topology control mechanisms was conducted. The topology control mechanisms evaluated included no topology control, topology control without community awareness (2HN), and community-aware topology control (C-A HN), which is the proposed approach.
To assess these mechanisms, extensive simulations were performed using the ns-3 network simulator, considering both the reactive (on-demand) and proactive modes of the HWMP routing protocol. The network under consideration consists of 100 nodes that move according to various mobility models within an area of 1024 × 520 meters, as described in Section 4.1.
For each scenario, four snapshots were considered, with varying numbers of simultaneously active UDP data flows ranging from 10 to 40, independently simulated. All UDP data flows utilized 512-byte packet lengths with a 20 millisecond interarrival time. The transmission time was configured to 200 seconds, leading to the transmission of 10,000 packets in each peer-to-peer data flow.
To ensure the reliability of the results, 50 statistically independent executions were performed for each data flow scenario. The mean values of the results from the 200 runs for each case were subsequently calculated and averaged. The results are presented with a confidence interval of 95%.
5.1. Reactive Mode Results
In this section, an evaluation of the reactive mode of the HWMP routing protocol is conducted. A multifaceted evaluation approach is employed to assess network performance, encompassing several pivotal parameters. These include the rate of routing management messages, the total number of packets received successfully, the total number of forwardings per successfully received packet, the network efficiency as reflected by the packet delivery ratio (PDR), and the nodes’ power consumption.
The evaluation process commences with an examination of the network in two distinct configurations: the first configuration is characterized by the absence of topology control, wherein all nodes function as routers, and the second configuration involves the implementation of topology control, utilizing the C-A HN and 2HN methods. In order to illustrate the advantages of applying topology control, the SWIM scenario is employed for this evaluation.
As demonstrated in Figure 4, the implementation of a topology control mechanism has been shown to result in substantial enhancements, including a reduction in routing messages (Figure 4), a decrease in packet forwarding (Figure 4), and an increase in successfully received packets (Figure 4). Consequently, an enhancement in network efficiency is observed, as evidenced by an increase in the packet delivery ratio (Figure 4). Conversely, due to the reduced number of routing messages and the decreased packet forwarding per received packet, a lower energy consumption is observed (see Figure 4). The efficacy of implementing a topology control mechanism in a network can be demonstrated. The efficacy of the system is enhanced in all aspects, thereby mitigating prevalent issues such as packet collision and interference that are precipitated by the substantial density of nodes.
In future studies, the research team will focus on comparing metrics between 2HN and C-A HN. This will allow them to ascertain the impact of considering community structure in the topology control mechanism.
5.1.1. Rate of Routing Management Messages
In this subsection, the average rate of routing management messages concerning the number of data flows across all scenarios considered is examined, as illustrated in Figure 5. As predicted, an escalation in traffic load—that is to say, the quantity of data flows—results in an augmented rate of routing messages, particularly in the context of evaluating an on-demand routing protocol.
It is imperative to underscore that this diminution in routing messages exerts a direct influence on energy consumption within the network. This reduction is primarily attributed to the fact that nodes that are not selected as routers do not transmit routing management messages.
It is noteworthy that in the map-based scenario (see Figure 5), both topology control mechanisms generate a comparatively low rate of routing messages (less than 60,000 packets) in contrast to the other scenarios. This phenomenon is primarily attributable to the spatial distribution of the nodes. In a map-based model, nodes predominantly move along linear paths, such as streets and sidewalks. This results in fewer dense regions compared to open areas, such as parks or shopping centers. Consequently, path resolution requires fewer routing messages.
As illustrated in Table 5, the proposed method, C-A HN, has been demonstrated to achieve an average percentage reduction in routing messages when compared to the previous proposal, 2HN, in a range of scenarios. This enhancement ranges from 17.64% in the map-based scenario to a substantial 38.29% in the SWIM scenario.
5.1.2. Total Data Forwardings
In this subsection, an analysis is conducted of the total number of data forwardings in all scenarios considered. As illustrated in Figure 6, the results for each scenario are presented as a function of traffic load.
As anticipated, with rising traffic load (number of data flows), the aggregate number of data transmissions concomitantly rises. This phenomenon aligns with the operational characteristics of on-demand routing protocols, which are designed to address data transmission demands by initiating route discovery and maintenance processes.
It is imperative to acknowledge that the implementation of topology control mechanisms leads to a decrease in the aggregate number of data forwardings. This decline is primarily attributable to the reduced selection of nodes as routers within the network, resulting in diminished route discoveries and data relay operations.
The specific impact of topology control methods, such as C-A HN and 2HN, on the total data forwarding can be observed in Figure 6. These methods can also be compared with the scenario without topology control. This reduction in data transmission serves to illustrate the enhanced efficiency of the network with the implementation of topology control mechanisms, thereby further underscoring the merits of these mechanisms in the management of data transmissions.
5.1.3. Successfully Received Packets
In this subsection, the number of successfully received packets is examined as a function of the number of active data flows across all scenarios. The results are presented in Figure 7.
The observed trend in the number of successfully received packets is consistent with network saturation. As the number of active data flows increases, the network approaches a state of saturation, resulting in a plateau in the number of received packets. The plateau effect is particularly evident in scenarios involving 40 simultaneous flows.
A substantial enhancement in the number of successfully received packets has been observed in a variety of scenarios, including SWIM, SLAW, Map-based, and RWM (see Figure 7, Figure 7, Figure 7 and Figure 7). The efficacy of these enhancements can be attributed to the implementation of topology control methods, such as C-A HN and 2HN.
However, for the scenarios of the SMOOTH and Disaster Area (see Figure 7 and Figure 7), there is negligible to no substantial enhancement in the number of successfully received packets. The negligible variations observed in these scenarios are within the confidence intervals, indicating that the topology control methods have minimal impact in these specific scenarios. The Disaster Area scenario, distinguished by its dense regions, may exhibit a comparatively diminished capacity for improvement as a result of its distinct characteristics.
In essence, the implementation of topology control mechanisms has been demonstrated to enhance the network’s efficiency by increasing the number of successfully received packets in various scenarios. However, the impact of these mechanisms varies depending on the characteristics of the specific scenario.
5.1.4. Total Data Forwardings per Successfully Received Packet
In this subsection, the relationship between the number of forwarded packets and the number of packets successfully received in all scenarios is explored (see Figure 8). It has been observed that the proposed method C-A HN requires a smaller number of forwarded packets compared to the previous method 2HN.
In the majority of scenarios, there is an increasing trend in the number of forwarded packets as the number of data flows increases. This phenomenon can be attributed to an increase in packet retransmissions, which, in turn, results in a higher number of collisions within the network. This trend persists until a saturated state is attained, which typically occurs between 25 and 30 flows for the majority of mobility models. However, in the SLAW scenario (see Figure 8), an early saturation state is observed, occurring at 20 data flows. This phenomenon can be attributed to the relatively high number of edges in the reduced topology for the SLAW scenario, as evidenced in Table 4. This results in increased interference and a higher number of forwardings per received packet.
As presented in Table 5, the proposed method C-A HN exhibits a mean percentage reduction in data forwardings per successfully received packet compared to the previous method 2HN for each mobility model. As previously discussed, the Disaster Area scenario demonstrates a comparatively diminished decrease in comparison to alternative scenarios, primarily attributable to its high degree of density.
In general, the proposed topology control method C-A HN has been demonstrated to be effective by reducing the number of forwarded packets per successfully received packet, resulting in improved network efficiency. However, the extent of this improvement varies depending on the specific characteristics of the scenario.
5.1.5. Network Efficiency in Terms of Packet Delivery Ratio
In this subsection, the network’s efficiency is examined in terms of the packet delivery ratio (PDR), a pivotal performance metric calculated by dividing the number of successfully received packets by the total number of transmitted packets. A parallel can be drawn between the trends observed in PDR and those depicted in Figure 7.
As demonstrated in Figure 9, the findings underscore substantial enhancements in PDR for SWIM, SLAW, Map-based, and RWM scenarios across all traffic loads. Conversely, the SMOOTH and Disaster Area scenarios (illustrated in Figure 9 and Figure 9) exhibit minimal to no efficiency enhancements. This observation is reinforced by the data in Table 5 (sixth column), which confirms the insignificant improvements in these scenarios. This outcome is anticipated, as the PDR metric is intrinsically associated with the number of successfully received packets (as discussed in Section 5.1.3), where no substantial enhancements were observed for these scenarios.
It is noteworthy that columns 4 and 6 in Table 5 exhibit identical improvement values, a consequence of the direct proportionality between PDR and the number of successfully received packets. In general, the proposed topology control method C-A HN has been shown to enhance network efficiency, particularly in scenarios characterized by community structure, such as SWIM, SLAW, Map-based, and RWM. However, the extent of the improvement in question is subject to variation depending on the characteristics inherent to particular scenarios.
5.1.6. Energy Consumption
The enhanced efficiency of the network, in conjunction with substantial decreases in the transmission of routing messages and the forwarding of packets, results in quantifiable energy consumption reductions throughout the network. In accordance with the approach delineated in [72], we assess energy consumption employing the model established in [81].
To facilitate a comprehensive analysis, the intermediate operating point of 20 active data flows is the focal point of this study. At this stage, the network is neither overload-prone nor operates under negligible traffic loads. In order to facilitate a more profound comprehension of this parameter, the average reduction of network energy consumption when employing the C-A HN method is presented in Table 5, in comparison to the 2HN.
Specifically, in the SLAW scenario, approximately 70% of the nodes consume less than 7 Joules under both methods. However, the remaining 30% of the nodes demonstrate energy savings when using the C-A HN method compared to 2HN. It is noteworthy that the Map-based scenario achieves the lowest energy consumption. This is due to the limited volume of routing messages and packet forwarding, which reduces energy-intensive operations across the network.
5.2. Proactive Mode
In this section, the proactive mode of the HWMP routing protocol was examined. In this operational mode, one or more mesh stations are designated as roots, thereby serving as gateways for communication within the network. These root nodes facilitate the creation and maintenance of distance vector trees.
In order to enhance network performance, root stations are strategically placed in the geography of the network. To assess the impact of this configuration, multiple simulations were conducted with varying numbers of root stations—ranging from one to three—using the same configurations as in the previous reactive mode evaluations.
5.2.1. Rate of Routing Management Messages
For this parameter, a constant traffic load of 25 data flows is utilized, divided into two parts. The first part involves downloading 20 streams from root stations to randomly selected nodes, and the second part involves uploading 5 streams from randomly selected nodes to root stations.
As illustrated in Figure 10, the results demonstrate variations in the rate of routing management messages, contingent on the number of root stations present in all scenarios. Each mobility model exhibits a distinct pattern; however, a common trend is a reduction in routing messages with the C-A HN method compared to 2HN.
As illustrated in Table 6, the second column provides a quantitative summary of the average percentage reduction in this parameter when comparing C-A HN with 2HN. It is evident that the reduction percentage is less significant for the SLAW and disaster area scenarios, while the other scenarios display substantial reductions. This finding indicates the effectiveness of the C-A HN method.
5.2.2. Network Efficiency in Terms of Packet Delivery Ratio
Network efficiency, measured in terms of Packet Delivery Ratio (PDR), is assessed with 25 data flows (similar to Section 5.2.1) and varying numbers of configured root stations: one, two, and three. As illustrated in Figure 11, the results are presented for all scenarios.
In most cases, a trend emerges in which an increase in the number of root stations leads to improved network efficiency. This outcome is attributed to the more balanced distribution of the network load between the gateways, resulting in fewer packet collisions and higher network efficiency.
As illustrated in Table 6 (3rd column), the mean enhancement in network efficiency attained by the C-A HN method in comparison with 2HN is evident. While the majority of scenarios demonstrate only marginal improvements, the map-based scenario is noteworthy with a substantial 34.02% enhancement.
5.2.3. Energy Consumption
For the analysis of energy consumption, we introduce three configured root stations and simulate 75 data flows (60 downloads and 15 uploads) to ensure representative results. To provide a quantitative perspective, Table 6 presents the average reduction in the overall energy consumption of the network achieved by C-A HN compared to 2HN in the fourth column. The fifth column provides these values specifically for non-root stations. It is clear to see that for all mobility models, energy consumption is reduced.
6. Conclusions
This paper introduces a community-aware topology control mechanism, C-A HN, for wireless mesh networks, using centrality metrics. The mechanism identifies crucial nodes within communities (determined by the centrality of the betweenness) and those that facilitate communication between communities (identified by the centrality of the bridging), forming the backbone of the network. The efficacy of C-A HN was assessed in six distinct scenarios employing various mobility models, yielding an average reduction in active edges in the network ranging from 30.52% to 41.47%.
When subjected to low traffic loads, C-A HN demonstrated enhanced network performance in both reactive and proactive modes of the HWMP mesh routing protocol in comparison to the previous method, 2HN. This configuration has been demonstrated to reduce the number of routing messages and forwardings, thereby enhancing network efficiency and reducing energy expenditure. These results substantiate the efficacy of C-A HN in realistic wireless mesh network scenarios.
Despite the utilization of a centralized approach in the present proposal, future endeavors may involve the exploration of distributed community detection algorithms and centrality calculation methods. Furthermore, the incorporation of novel metrics, such as remaining node energy, device type, or geographical location, into centrality calculations has the potential to enhance the efficacy and adaptability of the mechanism.
Author Contributions
Conceptualization, A.V-R. and L.J.C.L.; methodology, J.D.B., C.R.C and A.V-R.; software, J.D.B. and C.R.C; validation, J.D.B. and C.R.C; formal analysis, J.D.B. and A.V-R.; investigation, J.D.B. and A.V-R.; resources, J.D.B.; data curation, J.D.B. and C.R.C; writing—original draft preparation, J.D.B. and C.R.C; writing—review and editing, A.V-R. and L.J.C.L.; visualization, J.D.B.; supervision, A.V-R. and L.J.C.L.; project administration, A.V-R.; funding acquisition, A.V-R.
Funding
This research was funded by Universidad de Cuenca, Vicerrectorado de Investigación e Inovación.
Institutional Review Board Statement
Not applicable.
Informed Consent Statement
Not applicable.
Data Availability Statement
Data will be made available on request.
Conflicts of Interest
The authors declare no conflicts of interest. The funder had no role in the design of the study; in the collection, analyses, or interpretation of data; in the writing of the manuscript; or in the decision to publish the results.
Abbreviations
The following abbreviations are used in this manuscript:
| WSN | Wireless Sensor Network |
| IoT | Internet of Things |
| WSN | Wireless Sensor Network |
| WMN | Wireless Mesh Network |
| HWMP | Hybrid Wireless Mesh Protocol |
| CDS | Connected Dominating Set |
| RWM | Random Waypoint Mobility |
| SWIM | Small World In Motion |
| SLAW | Self-Similar Least-Action Human Walk |
| SMOOTH | Simplified Mobility Model for Human Walks |
| IL | Incident Location |
| PWT | Patient Waiting Area |
| CCS | Casualties Clearing Station |
| TOC | Technical Operation Command |
| MSLAW | Map-Based Self-Similar Least-Action Human Walk |
| Betweenness Centrality | |
| Intra-Centrality | |
| Inter-Centrality | |
| Bridging Centrality | |
| C-A HN | Community-Aware Highest Betweenness Intra-Centrality Neighbor |
| C-A HN | Community-Aware Highest Betweenness Centrality Neighbor |
| 2HN | 2 Highest Betweenness Centrality Neighbors |
| BC | Bridging Coefficient |
| MR | Mesh Router |
| MC | Mesh Client |
| PDR | Packet Delivery Ratio |
| UDP | User Datagram Protocol |
| SUMO | Simulation of Urban Mobility |
References
- Duarte, F. Number of IoT Devices, 2023.
- Aloi, G.; Di Felice, M.; Loscrì, V.; Pace, P.; Ruggeri, G. Spontaneous smartphone networks as a user-centric solution for the future internet. IEEE Communications Magazine 2014, 52, 26–33. [Google Scholar] [CrossRef]
- Khan, W.Z.; Xiang, Y.; Aalsalem, M.Y.; Arshad, Q. Mobile phone sensing systems: A survey. IEEE Communications Surveys & Tutorials 2013, 15, 402–427. [Google Scholar]
- Wang, X.; Lim, A.O. IEEE 802.11 s wireless mesh networks: Framework and challenges. Ad Hoc Networks 2008, 6, 970–984. [Google Scholar] [CrossRef]
- Henry, J.; Burton, M. 802.11 s mesh networking. certified wireless network professional 2011. [Google Scholar]
- Singh, S.P.; Sharma, S. A Survey on Cluster Based Routing Protocols in Wireless Sensor Networks. Procedia Computer Science 2015, 45, 687–695. [Google Scholar] [CrossRef]
- Johnson, D.B.; Maltz, D.A. Dynamic source routing in ad hoc wireless networks. Mobile computing, 1996; 153–181. [Google Scholar]
- Mei, A.; Stefa, J. SWIM: A simple model to generate small mobile worlds. In Proceedings of the INFOCOM 2009, IEEE. IEEE; 2009; pp. 2106–2113. [Google Scholar]
- Lee, K.; Hong, S.; Kim, S.J.; Rhee, I.; Chong, S. Slaw: A new mobility model for human walks. In Proceedings of the INFOCOM 2009, IEEE. IEEE; 2009; pp. 855–863. [Google Scholar]
- Munjal, A.; Camp, T.; Navidi, W.C. SMOOTH: a simple way to model human walks. ACM SIGMOBILE Mobile Computing and Communications Review 2011, 14, 34–36. [Google Scholar] [CrossRef]
- Aschenbruck, N.; Gerhards-Padilla, E.; Martini, P. Modeling mobility in disaster area scenarios. Performance Evaluation 2009, 66, 773–790. [Google Scholar] [CrossRef]
- Radicchi, F.; Castellano, C.; Cecconi, F.; Loreto, V.; Parisi, D. Defining and identifying communities in networks. Proceedings of the National Academy of Sciences of the United States of America 2004, 101, 2658–2663. [Google Scholar] [CrossRef] [PubMed]
- Dhillon, I.S.; Guan, Y.; Kulis, B. Weighted graph cuts without eigenvectors a multilevel approach. IEEE transactions on pattern analysis and machine intelligence 2007, 29. [Google Scholar] [CrossRef] [PubMed]
- Rajita, B.; Panda, S. Community Detection Techniques for Evolving Social Networks. In Proceedings of the 2019 9th International Conference on Cloud Computing, Data Science & Engineering (Confluence); 2019; pp. 681–686. [Google Scholar] [CrossRef]
- Jiang, W.; Zhang, X. Dynamic Community Detection Algorithm based on Allocating and Splitting. In Proceedings of the 2022 IEEE 34th International Conference on Tools with Artificial Intelligence (ICTAI); 2022; pp. 1132–1137. [Google Scholar] [CrossRef]
- Lu, H.; Halappanavar, M.; Chavarria-Miranda, D.; Gebremedhin, A.H.; Panyala, A.; Kalyanaraman, A. Algorithms for Balanced Graph Colorings with Applications in Parallel Computing. IEEE Transactions on Parallel and Distributed Systems 2017, 28, 1240–1256. [Google Scholar] [CrossRef]
- Newman, M.E.; Girvan, M. Finding and evaluating community structure in networks. Physical review E 2004, 69, 026113. [Google Scholar] [CrossRef] [PubMed]
- Zhou, H.; Chen, G. A multiobjective optimization whale optimization based community detection algorithm. In Proceedings of the 2022 3rd International Conference on Computer Vision, Image and Deep Learning & International Conference on Computer Engineering and Applications (CVIDL & ICCEA); 2022; pp. 1–4. [Google Scholar] [CrossRef]
- Liu, S.; Li, Z. A biogeography-based optimization algorithm for community detection in complex networks. In Proceedings of the 2017 International Conference on Algorithms, Methodology, 2017, Models and Applications in Emerging Technologies (ICAMMAET); pp. 1–3. [CrossRef]
- Girvan, M.; Newman, M.E. Community structure in social and biological networks. Proceedings of the national academy of sciences 2002, 99, 7821–7826. [Google Scholar] [CrossRef] [PubMed]
- RafieeFard, J.; Teimourpour, B.; Shaghouzi, M.; Jami, M. A Comparison of Centrality Measures for Community Evolution Discovery. In Proceedings of the 2022 8th International Conference on Web Research (ICWR); 2022; pp. 183–188. [Google Scholar] [CrossRef]
- Baltsou, G.; Christopoulos, K.; Tsichlas, K. Local Community Detection: A Survey. IEEE Access 2022, 10, 110701–110726. [Google Scholar] [CrossRef]
- Fortunato, S.; Hric, D. Community detection in networks: A user guide. Physics Reports 2016, 659, 1–44. [Google Scholar] [CrossRef]
- Chen, Q.; Wei, L. Overlapping Community Detection of Complex Network: A Survey. In Proceedings of the 2019 20th International Conference on Parallel and Distributed Computing, Applications and Technologies (PDCAT); 2019; pp. 513–516. [Google Scholar] [CrossRef]
- Qiu, T.; Chen, B.; Sangaiah, A.K.; Ma, J.; Huang, R. A Survey of Mobile Social Networks: Applications, Social Characteristics, and Challenges. IEEE Systems Journal 2017. [Google Scholar] [CrossRef]
- Pourbemany, J.; Zhu, Y.; Bettati, R. A Survey of Wearable Devices Pairing Based on Biometric Signals. IEEE Access 2023, 11, 26070–26085. [Google Scholar] [CrossRef]
- Ghadi, Y.Y.; Mazhar, T.; Al Shloul, T.; Shahzad, T.; Salaria, U.A.; Ahmed, A.; Hamam, H. Machine learning solutions for the security of wireless sensor networks: A review. IEEE Access 2024, 12, 12699–12719. [Google Scholar] [CrossRef]
- Priyadarshi, R. Energy-efficient routing in wireless sensor networks: a meta-heuristic and artificial intelligence-based approach: a comprehensive review. Archives of Computational Methods in Engineering 2024, 31, 2109–2137. [Google Scholar] [CrossRef]
- Zhu, R.; Boukerche, A.; Long, L.; Yang, Q. Design guidelines on trust management for underwater wireless sensor networks. In IEEE Communications Surveys & Tutorials; 2024. [Google Scholar]
- Salamea, P.U.; Siguencia, J.V.; Astudillo-Salinas, F.; Belesaca, J.D.; Tello-Oquendo, L.; Alvear, O. An Application Layer Protocol for the Transmission of Hydrometeorological Data over LoRaWAN. In Proceedings of the 2024 IEEE Eighth Ecuador Technical Chapters Meeting (ETCM). IEEE; 2024; pp. 1–6. [Google Scholar]
- Saavedra, M.B.; Merchan, F.T.; Astudillo-Salinas, F.; Belesaca, J.D.; Barreto, J. Development of an IoT system prototype for the acquisition of biomechanical data of a speed skater. In Proceedings of the 2024 IEEE Eighth Ecuador Technical Chapters Meeting (ETCM). IEEE; 2024; pp. 1–6. [Google Scholar]
- Wei, W.J.; Jovian, L.H.S.; How, B.L.C.; Richie, W.R.; Yuan, P.X.; Abhishek, N.V.; Abbas, M.F.B. Multi-Protocol Wireless Mesh Sensor Network. In Proceedings of the 2024 IEEE VTS Asia Pacific Wireless Communications Symposium (APWCS). IEEE; 2024; pp. 1–6. [Google Scholar]
- Vázquez Rodas, A.M. Contribution to the improvement of the performance of wireless mesh networks providing real time services. PhD thesis, Universitat Politècnica de Catalunya, 2015.
- Akyildiz, I.F.; Wang, X.; Wang, W. Wireless mesh networks: a survey. Computer networks 2005, 47, 445–487. [Google Scholar] [CrossRef]
- Mane, M.A.; Deshmukh, A. Secure and Efficient Routing Approach for Airborne Mesh Network with Adaptive Channel Mechanism. In Proceedings of the International Journal of Innovative Research in Science, Engineering and Technology; 2017. [Google Scholar]
- Bari, S.; Anwar, F.; Masud, M. Performance study of hybrid Wireless Mesh Protocol (HWMP) for IEEE 802. In 11 s WLAN mesh networks. In Proceedings of the 2012 international conference on computer and communication engineering (ICCCE). IEEE; 2012; pp. 712–716. [Google Scholar]
- Majumder, A.; Roy, S. Performance Comparison of Adaptive Mobility Management Scheme with IEEE. IoT and Analytics for Sensor Networks: Proceedings of ICWSNUCA 2021 2021, 244, 83. [Google Scholar]
- Ren, S.; Liu, J.; Ge, S.S.; Li, D. HWMP-based secure communication of multi-agent systems. Ad Hoc Networks 2024, 157, 103456. [Google Scholar] [CrossRef]
- Aziz, A.A.; Sekercioglu, Y.A.; Fitzpatrick, P.; Ivanovich, M. A survey on distributed topology control techniques for extending the lifetime of battery powered wireless sensor networks. IEEE communications surveys & tutorials 2013, 15, 121–144. [Google Scholar]
- Santi, P. Topology control in wireless ad hoc and sensor networks. ACM computing surveys (CSUR) 2005, 37, 164–194. [Google Scholar] [CrossRef]
- Rashid, S.; Khan, M.A.; Saeed, A.; Hamza, C.M. A Survey on Prediction based Routing for Vehicular Ad-hoc Networks. In Proceedings of the 2021 International Congress of Advanced Technology and Engineering (ICOTEN); 2021; pp. 1–8. [Google Scholar] [CrossRef]
- Li, N.; Hou, J.C.; Sha, L. Design and analysis of an MST-based topology control algorithm. IEEE Transactions on Wireless Communications 2005, 4, 1195–1206. [Google Scholar] [CrossRef]
- Wattenhofer, R.; Li, L.; Bahl, P.; Wang, Y.M. Distributed topology control for power efficient operation in multihop wireless ad hoc networks. In Proceedings of the INFOCOM 2001. Twentieth annual joint conference of the IEEE computer and communications societies. Proceedings. IEEE. IEEE, Vol. 3; 2001; pp. 1388–1397. [Google Scholar]
- Qi, X.; Yuan, P.; Zhang, Q.; Yang, Z. CDS-Based Topology Control in FANETs via Power and Position Optimization. IEEE Wireless Communications Letters 2020, 9, 2015–2019. [Google Scholar] [CrossRef]
- Farooq, M.U.; Zeeshan, M. Connected Dominating Set Enabled On-Demand Routing (CDS-OR) for Wireless Mesh Networks. IEEE Wireless Communications Letters 2021, 10, 2393–2397. [Google Scholar] [CrossRef]
- Wang, B.; Sun, Y.; Do-Duy, T.; Garcia-Palacios, E.; Q. Duong, T. Adaptive D-Hop Connected Dominating Set in Highly Dynamic Flying Ad-Hoc Networks. IEEE Transactions on Network Science and Engineering 2021, 8, 2651–2664. [Google Scholar] [CrossRef]
- Rajaraman, R. Topology control and routing in ad hoc networks: A survey. ACM SIGACT News 2002, 33, 60–73. [Google Scholar] [CrossRef]
- Vazquez-Rodas, A.; Aviles-Parra, P.; Pinto-Nieto, J.; Belesaca, J.D.; Astudillo-Salinas, F. Topological Evaluation of Realistic Mobility Models for Spontaneous Wireless Networks Using Graph Theory Metrics. In Proceedings of the Proceedings of the Int’l ACM Symposium on Performance Evaluation of Wireless Ad Hoc, Sensor, &.
- Rhee, I.; Shin, M.; Hong, S.; Lee, K.; Kim, S.J.; Chong, S. On the levy-walk nature of human mobility. IEEE/ACM transactions on networking (TON) 2011, 19, 630–643. [Google Scholar] [CrossRef]
- Schwamborn, M.; Aschenbruck, N. Introducing geographic restrictions to the slaw human mobility model. In Proceedings of the Modeling, Analysis & Simulation of Computer and Telecommunication Systems (MASCOTS), 2013, 2013 IEEE 21st International Symposium on. IEEE; pp. 264–272. [Google Scholar]
- Shlesinger, M.; West, B.; Klafter, J. Lévy dynamics of enhanced diffusion: Application to turbulence. Physical Review Letters 1987, 58, 1100. [Google Scholar] [CrossRef] [PubMed]
- Benhamou, S. How many animals really do the Levy walk? Ecology 2007, 88, 1962–1969. [Google Scholar] [CrossRef] [PubMed]
- Edwards, A.M.; Phillips, R.A.; Watkins, N.W.; Freeman, M.P.; Murphy, E.J.; Afanasyev, V.; Buldyrev, S.V.; da Luz, M.G.; Raposo, E.P.; Stanley, H.E.; et al. Revisiting Lévy flight search patterns of wandering albatrosses, bumblebees and deer. Nature 2007, 449, 1044–1048. [Google Scholar] [CrossRef] [PubMed]
- Gonzalez, M.C.; Hidalgo, C.A.; Barabasi, A.L. Understanding individual human mobility patterns. Nature 2008, 453, 779–782. [Google Scholar] [CrossRef] [PubMed]
- Chaintreau, A.; Hui, P.; Crowcroft, J.; Diot, C.; Gass, R.; Scott, J. Impact of human mobility on opportunistic forwarding algorithms. IEEE Transactions on Mobile Computing 2007, 6. [Google Scholar] [CrossRef]
- Munjal, A.; Camp, T.; Navidi, W.C. Constructing rigorous MANET simulation scenarios with realistic mobility. In Proceedings of the Wireless Conference (EW), 2010, 2010 European. IEEE; pp. 817–824. [Google Scholar]
- Lu, Z.; Sun, X.; Wen, Y.; Cao, G.; La Porta, T. Algorithms and applications for community detection in weighted networks. IEEE Transactions on Parallel and Distributed Systems 2015, 26, 2916–2926. [Google Scholar] [CrossRef]
- Freeman, L.C. Centrality in social networks conceptual clarification. Social networks 1978, 1, 215–239. [Google Scholar] [CrossRef]
- Ramanathan, M.; Zhang, A.; Cho, Y.r.; Hwang, W. Bridging centrality: identifying bridging nodes in scale-free networks 2006.
- Gengzhong, Z.; Qiumei, L. A Survey on Topology Control in Wireless Sensor Networks. In Proceedings of the 2010 Second International Conference on Future Networks; 2010; pp. 376–380. [Google Scholar] [CrossRef]
- Li, M.; Li, Z.; Vasilakos, A.V. A Survey on Topology Control in Wireless Sensor Networks: Taxonomy, Comparative Study, and Open Issues. Proceedings of the IEEE 2013, 101, 2538–2557. [Google Scholar] [CrossRef]
- Huang, J.; Duan, Q.; Xing, C.C.; Wang, H. Topology control for building a large-scale and energy-efficient internet of things. IEEE Wireless Communications 2017, 24, 67–73. [Google Scholar] [CrossRef]
- Zhou, T.; Li, X.; Mao, S.; Cai, B.; He, J.; Zhao, M. Discrete Markov-Based Topology Control of Star-Wireless Sensor Network for Lifetime Maximization. In Proceedings of the 2023 35th Chinese Control and Decision Conference (CCDC). IEEE; 2023; pp. 4453–4459. [Google Scholar]
- Thammawichai, M.; Luangwilai, T. An energy-optimization topology control for three-dimensional wireless sensor networks. Journal of Communications and Networks 2023, 25, 778–788. [Google Scholar] [CrossRef]
- He, A.; Li, S.; Bai, Y. Game theory based wsn clustering topology control algorithm for high-speed railway monitoring. In Proceedings of the 2023 IEEE International Conference on Image Processing and Computer Applications (ICIPCA). IEEE; 2023; pp. 38–41. [Google Scholar]
- Han, L.; Chen, X.; Leng, M.; Deng, Y.; Hao, T.; Yang, H. Research on energy consumption and identifying critical nodes of weighted scale-free topology in wireless sensor network. IEEE Access 2024. [Google Scholar] [CrossRef]
- Qirtas, M.M.; Faheem, Y.; Rehmani, M.H. Throwboxes in delay tolerant networks: A survey of placement strategies, buffering capacity, and mobility models. Journal of Network and Computer Applications 2017, 91, 89–103. [Google Scholar] [CrossRef]
- Genda, K. Topology control method adopting optimal topology with minimum cumulative energy consumption over update interval in MANETs. In Proceedings of the 2020 IEEE 17th Annual Consumer Communications &, 2020, Networking Conference (CCNC); pp. 1–6. [CrossRef]
- Van Khoa, V.; Shigeru, T. Topology Control for Wireless Sensor Network in Landslide Monitoring. In Proceedings of the 2019 58th Annual Conference of the Society of Instrument and Control Engineers of Japan (SICE); 2019; pp. 394–399. [Google Scholar] [CrossRef]
- Kas, M.; Appala, S.; Wang, C.; Carley, K.M.; Carley, L.R.; Tonguz, O.K. What if wireless routers were social? approaching wireless mesh networks from a social networks perspective. IEEE Wireless Communications 2012, 19. [Google Scholar] [CrossRef]
- Meghanathan, N. Use of Centrality Metrics to Determine Connected Dominating Sets for Real-World Network Graphs. In Proceedings of the Information Technology-New Generations (ITNG), 2015, 2015 12th International Conference on. IEEE; pp. 243–248. [Google Scholar]
- Vázquez-Rodas, A.; Luis, J. A centrality-based topology control protocol for wireless mesh networks. Ad Hoc Networks 2015, 24, 34–54. [Google Scholar] [CrossRef]
- Shifani, S.A.; Korde, V.; Vijay, S.; Shalout, I.; Indhumathi, V.; Revathi, R. Experimental Analysis of an IoT Based Secured Data Communication between Social Communities Over Wireless Sensor Network Environment. In Proceedings of the 2024 International Conference on Innovative Computing, Intelligent Communication and Smart Electrical Systems (ICSES). IEEE; 2024; pp. 1–7. [Google Scholar]
- Hui, P.; Crowcroft, J.; Yoneki, E. Bubble rap: Social-based forwarding in delay-tolerant networks. IEEE Transactions on Mobile Computing 2011, 10, 1576–1589. [Google Scholar] [CrossRef]
- Aschenbruck, N.; Ernst, R.; Gerhards-Padilla, E.; Schwamborn, M. BonnMotion: a mobility scenario generation and analysis tool. ICST, 2010. [CrossRef]
- Sattar, N.S.; Arifuzzaman, S. Parallelizing Louvain Algorithm: Distributed Memory Challenges. In Proceedings of the 2018 IEEE 16th Intl Conf on Dependable, Autonomic and Secure Computing, 16th Intl Conf on Pervasive Intelligence and Computing, 4th Intl Conf on Big Data Intelligence and Computing and Cyber Science and Technology Congress(DASC/PiCom/DataCom/CyberSciTech); 2018; pp. 695–701. [Google Scholar] [CrossRef]
- Blondel, V.D.; Guillaume, J.L.; Lambiotte, R.; Lefebvre, E. Fast unfolding of communities in large networks. Journal of statistical mechanics: theory and experiment 2008, 2008, P10008. [Google Scholar] [CrossRef]
- Lu, H.; Halappanavar, M.; Kalyanaraman, A. Parallel heuristics for scalable community detection. Parallel Computing 2015, 47, 19–37. [Google Scholar] [CrossRef]
- IEEE 802.11-2016 - IEEE Standard for Information technology—Telecommunications and information exchange between systems Local and metropolitan area networks—Specific requirements - Part 11: Wireless LAN Medium Access Control (MAC) and Physical Layer (PHY) Specifications.
- Borgatti, S.P. Identifying sets of key players in a social network. Computational & Mathematical Organization Theory 2006, 12, 21–34. [Google Scholar]
- Heinzelman, W.R.; Chandrakasan, A.; Balakrishnan, H. Energy-efficient communication protocol for wireless microsensor networks. In Proceedings of the System sciences, 2000. Proceedings of the 33rd annual Hawaii international conference on.
Figure 1.
Reduced Topology and Backbone generated with k most central nodes in each community method selecting 25% most bridging nodes in SWIM model at sec. (a) Reduced Topology with . (b) Backbone with . (c) Reduced Topology with . (d) Backbone with .
Figure 1.
Reduced Topology and Backbone generated with k most central nodes in each community method selecting 25% most bridging nodes in SWIM model at sec. (a) Reduced Topology with . (b) Backbone with . (c) Reduced Topology with . (d) Backbone with .
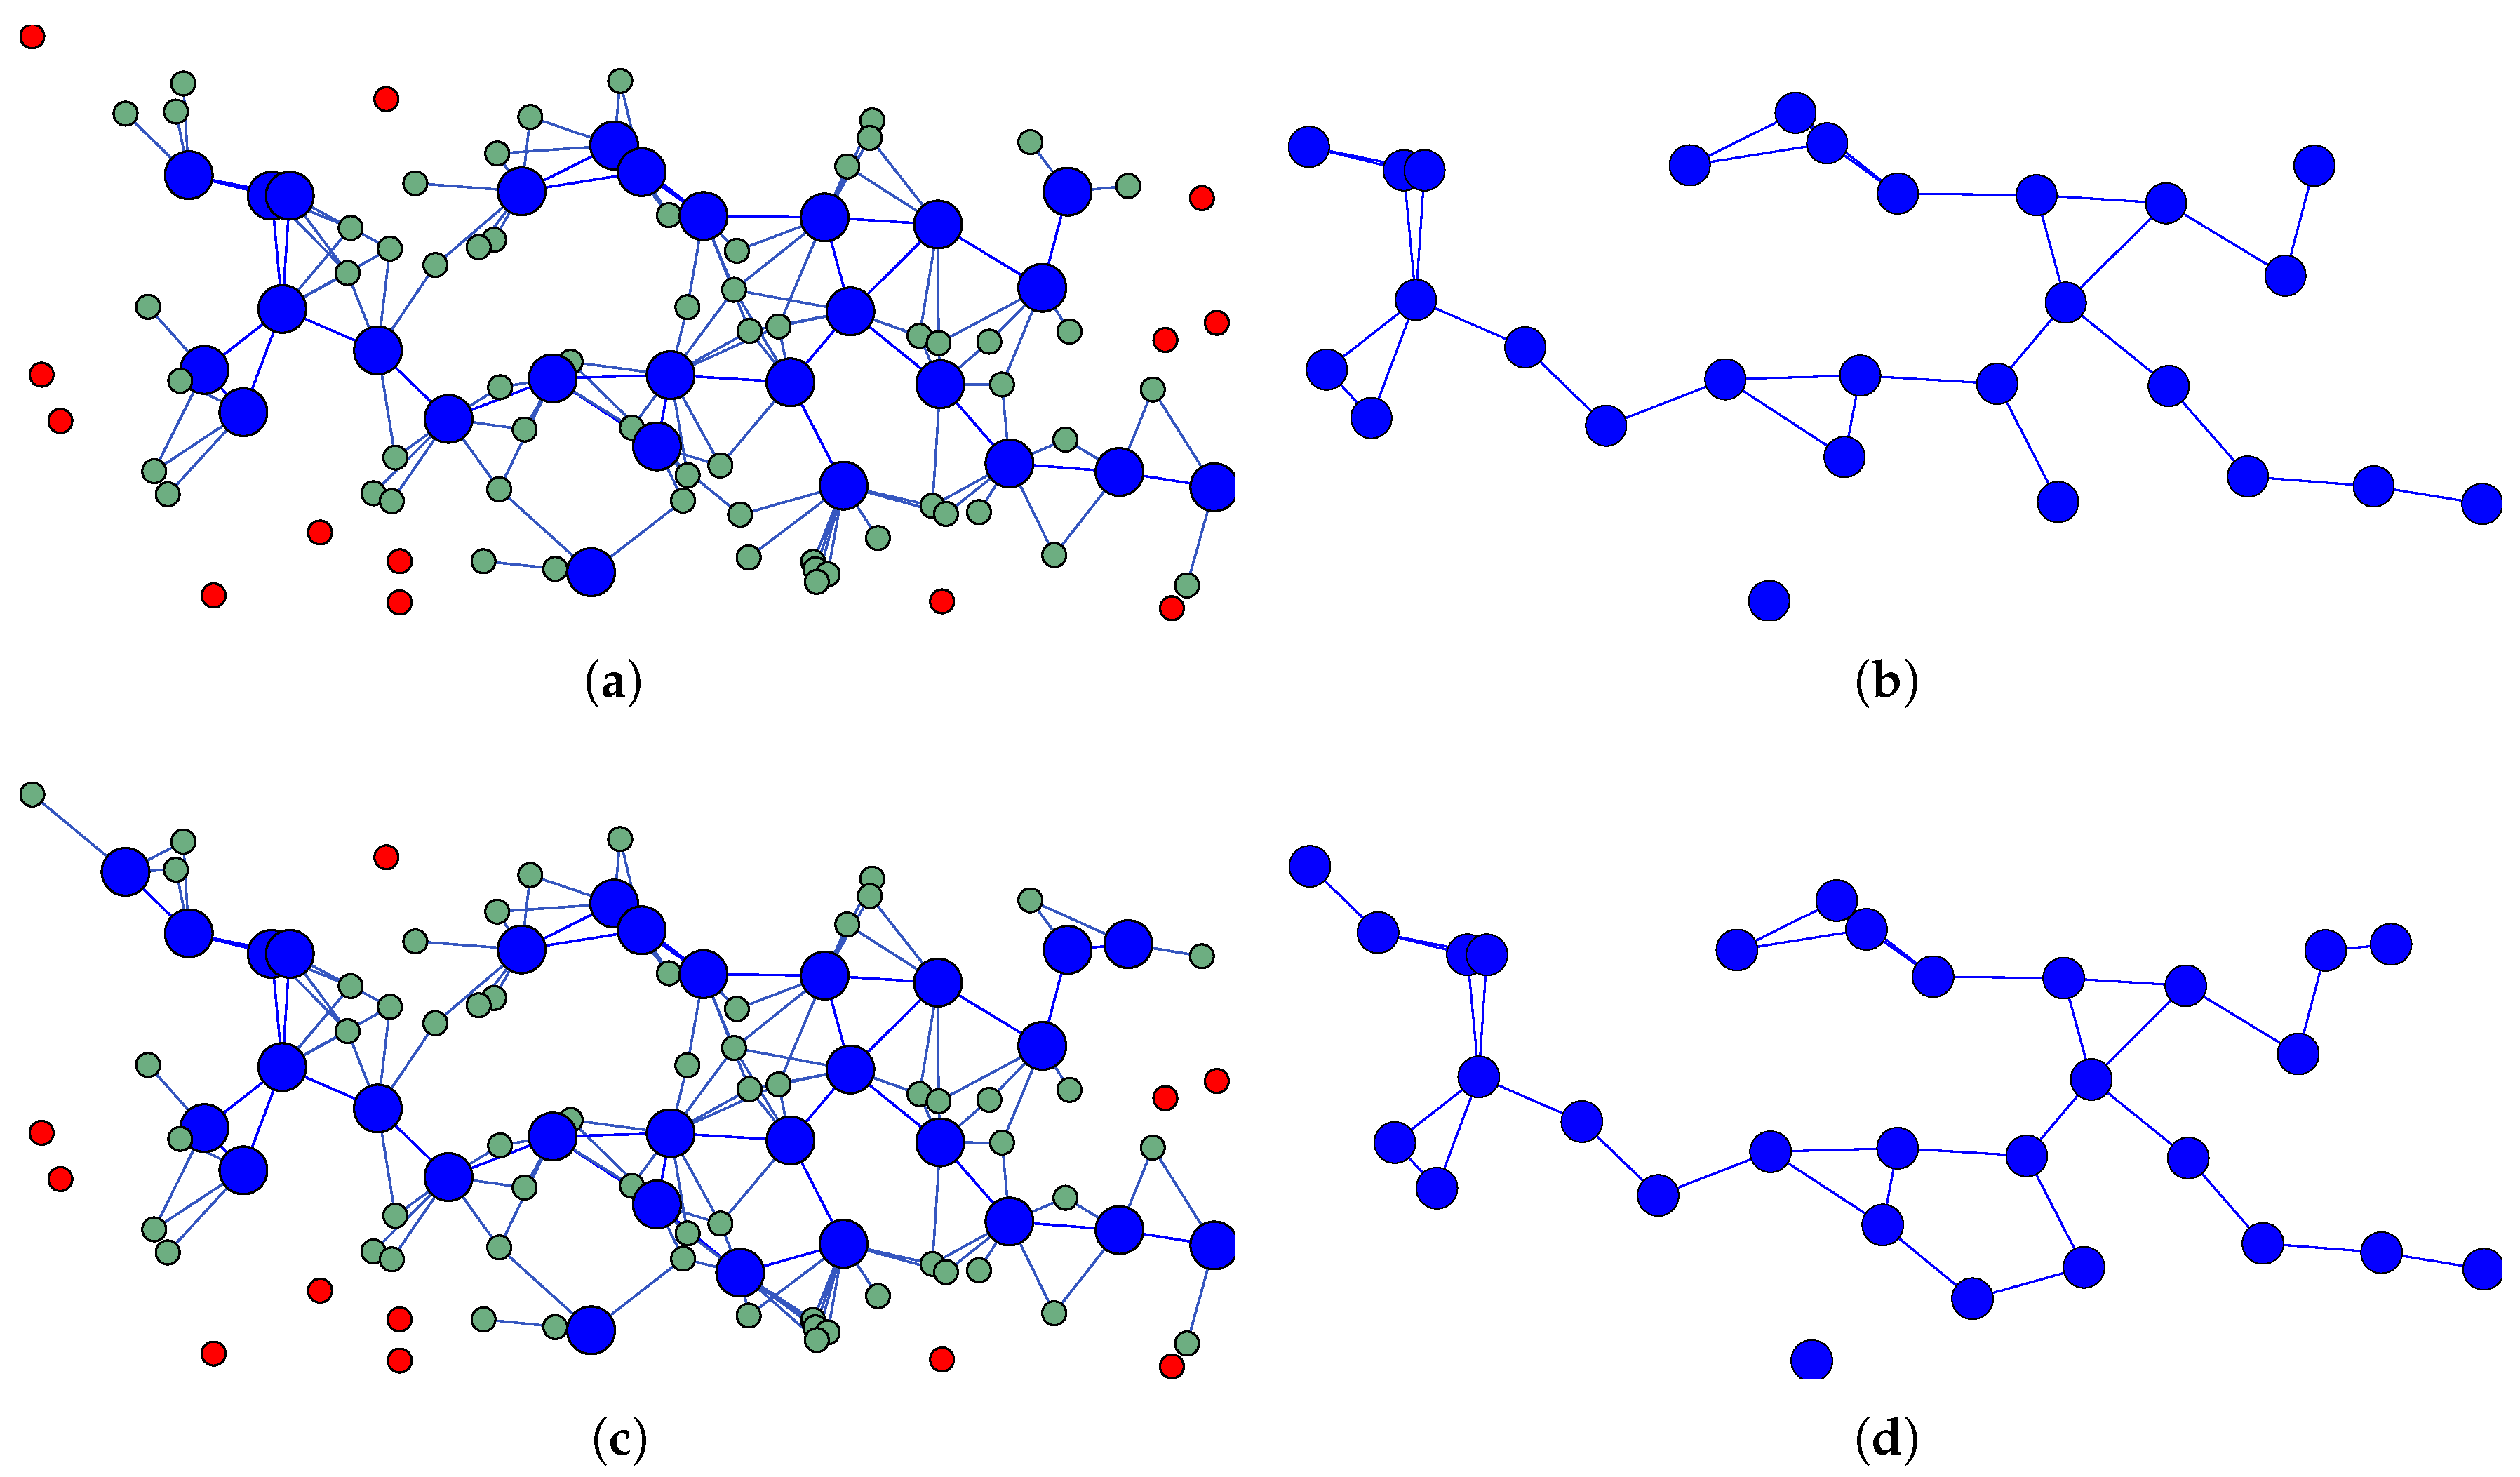
Figure 2.
Reduced Topology and Backbone generated with C-A HN method selecting 25% most bridging nodes in SWIM model at sec. (a) Reduced Topology. (b) Backbone.
Figure 2.
Reduced Topology and Backbone generated with C-A HN method selecting 25% most bridging nodes in SWIM model at sec. (a) Reduced Topology. (b) Backbone.
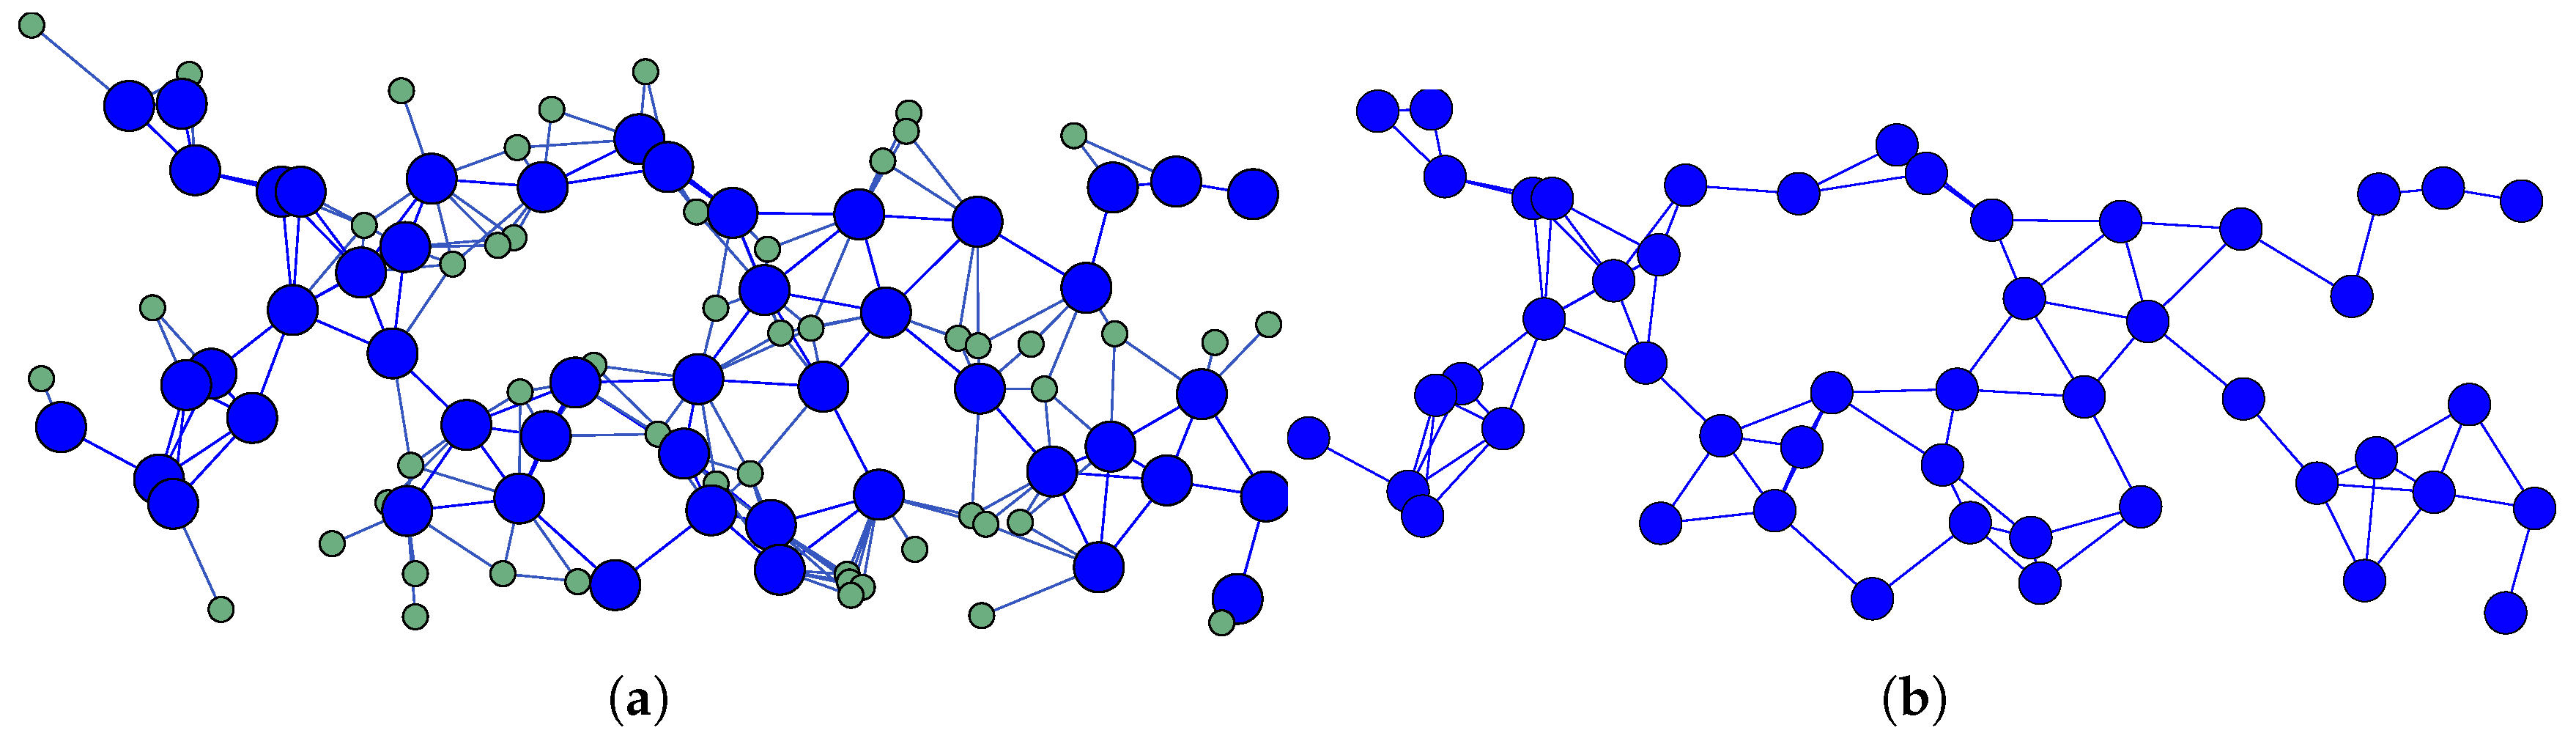
Figure 3.
Reduced Topology and Backbone generated with C-A HN method selecting 25% most bridging nodes in SWIM model at sec. (a) Reduced Topology. (b) Backbone.
Figure 3.
Reduced Topology and Backbone generated with C-A HN method selecting 25% most bridging nodes in SWIM model at sec. (a) Reduced Topology. (b) Backbone.
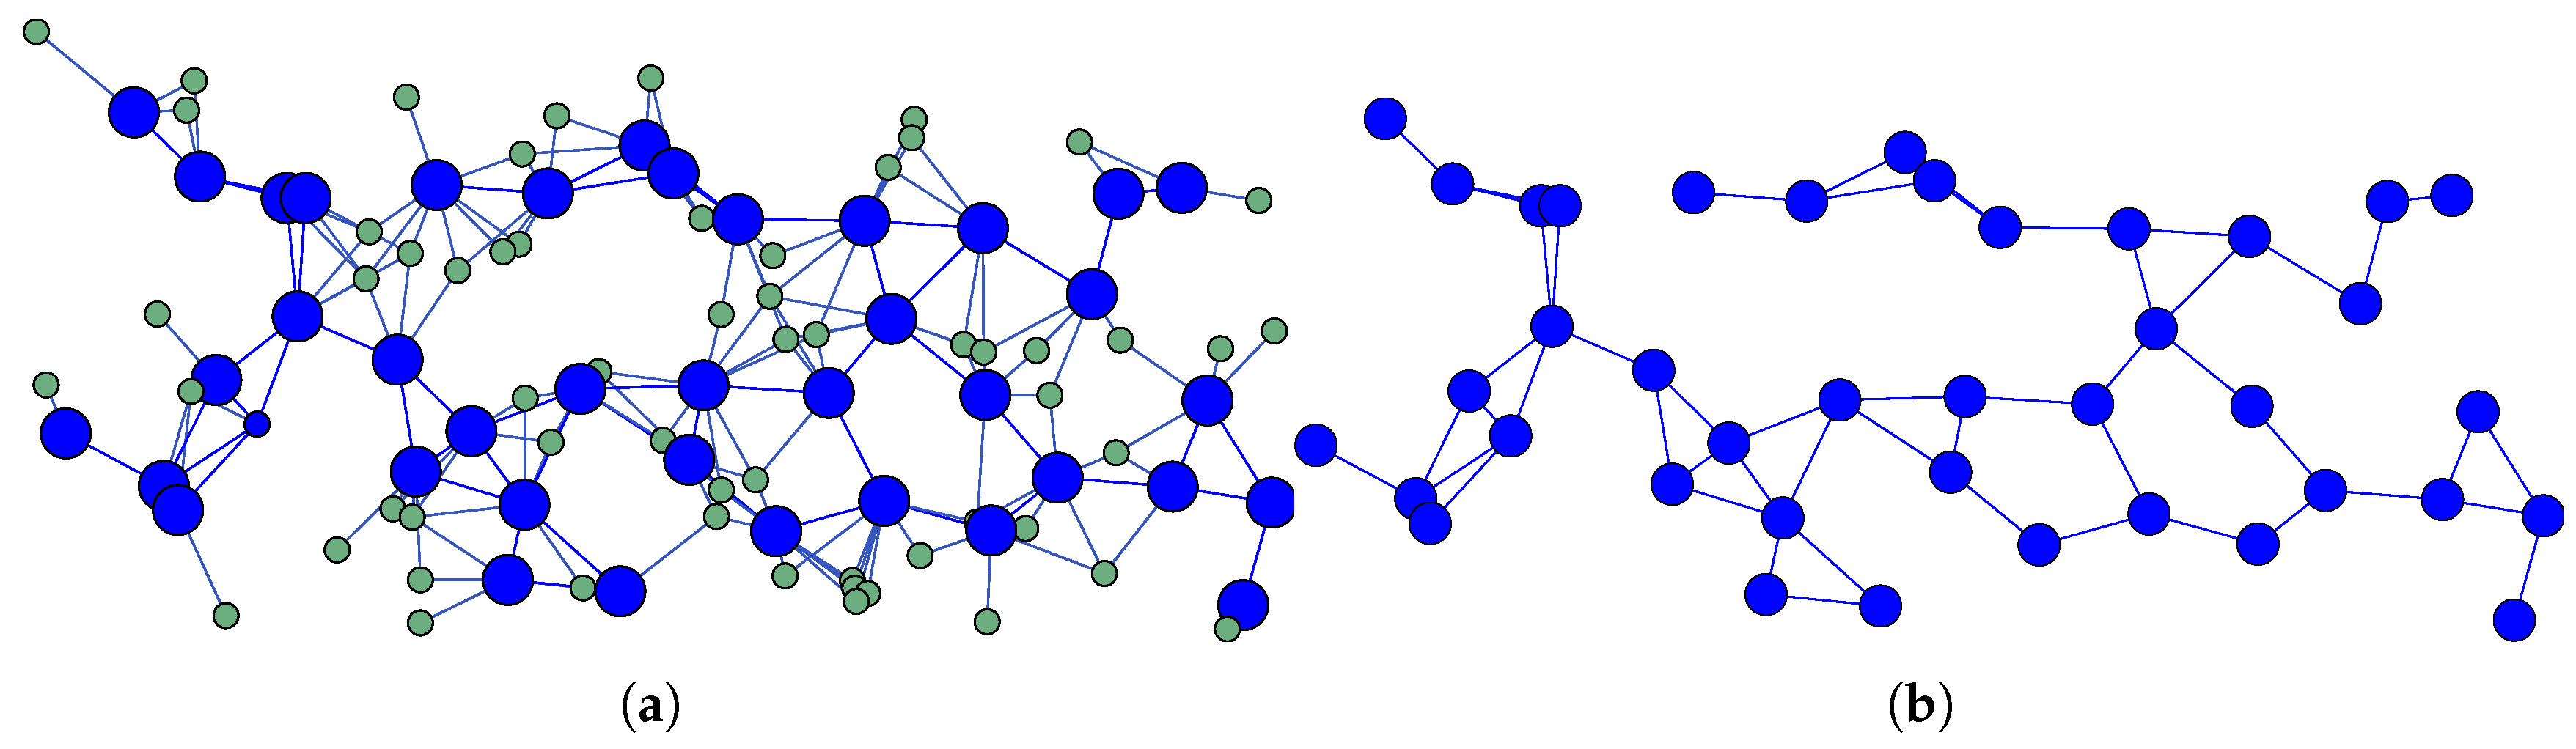
Figure 4.
Results for all routers, and for 2HN and C-A HN topology control mechanisms for SWIM scenario. (a) Rate of routing management messages. (b) Total data forwardings. (c) Total number of successfully received packets. (d) Total data forwardings per successfully received packet. (e) Network efficiency in terms of PDR. (f) Nodes energy consumption CDF for 20 active flows.
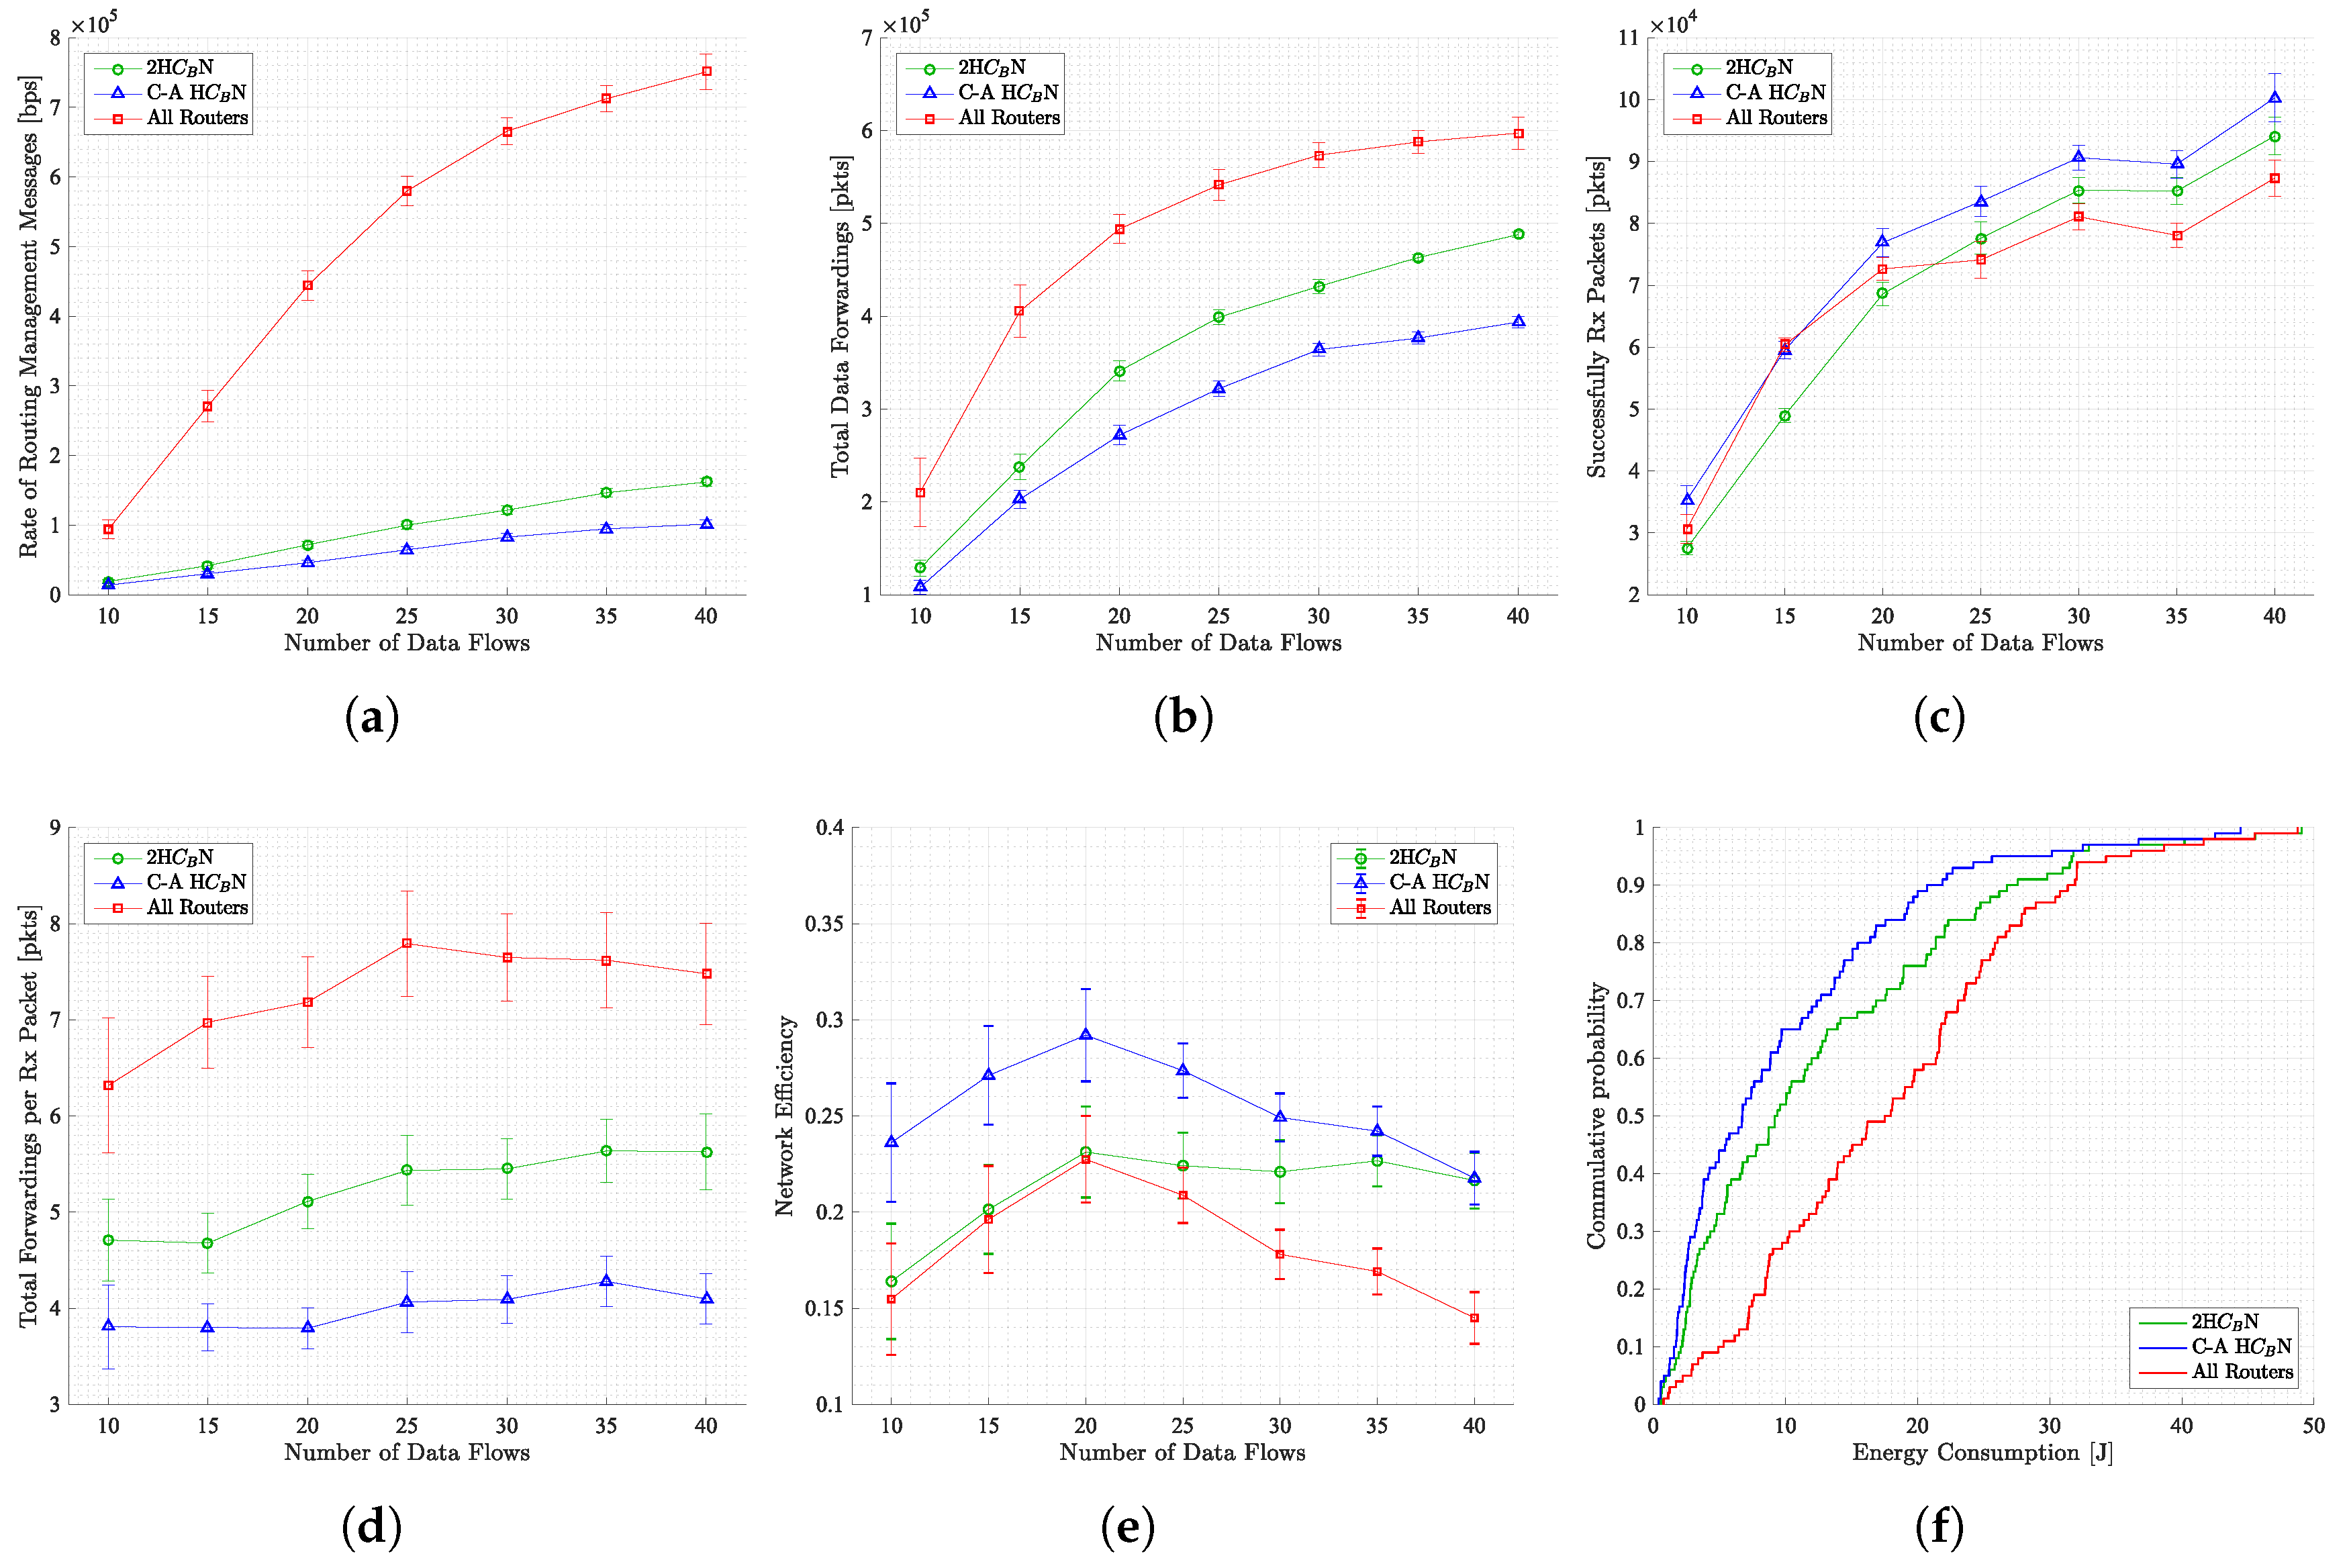
Figure 5.
Average rate of routing management messages as a function of traffic load, for all scenarios considered. (a) SWIM scenario. (b) SLAW scenario. (c) SMOOTH scenario. (d) Disaster Area scenario. (e) Map-based scenario. (f) RWM scenario.
Figure 5.
Average rate of routing management messages as a function of traffic load, for all scenarios considered. (a) SWIM scenario. (b) SLAW scenario. (c) SMOOTH scenario. (d) Disaster Area scenario. (e) Map-based scenario. (f) RWM scenario.
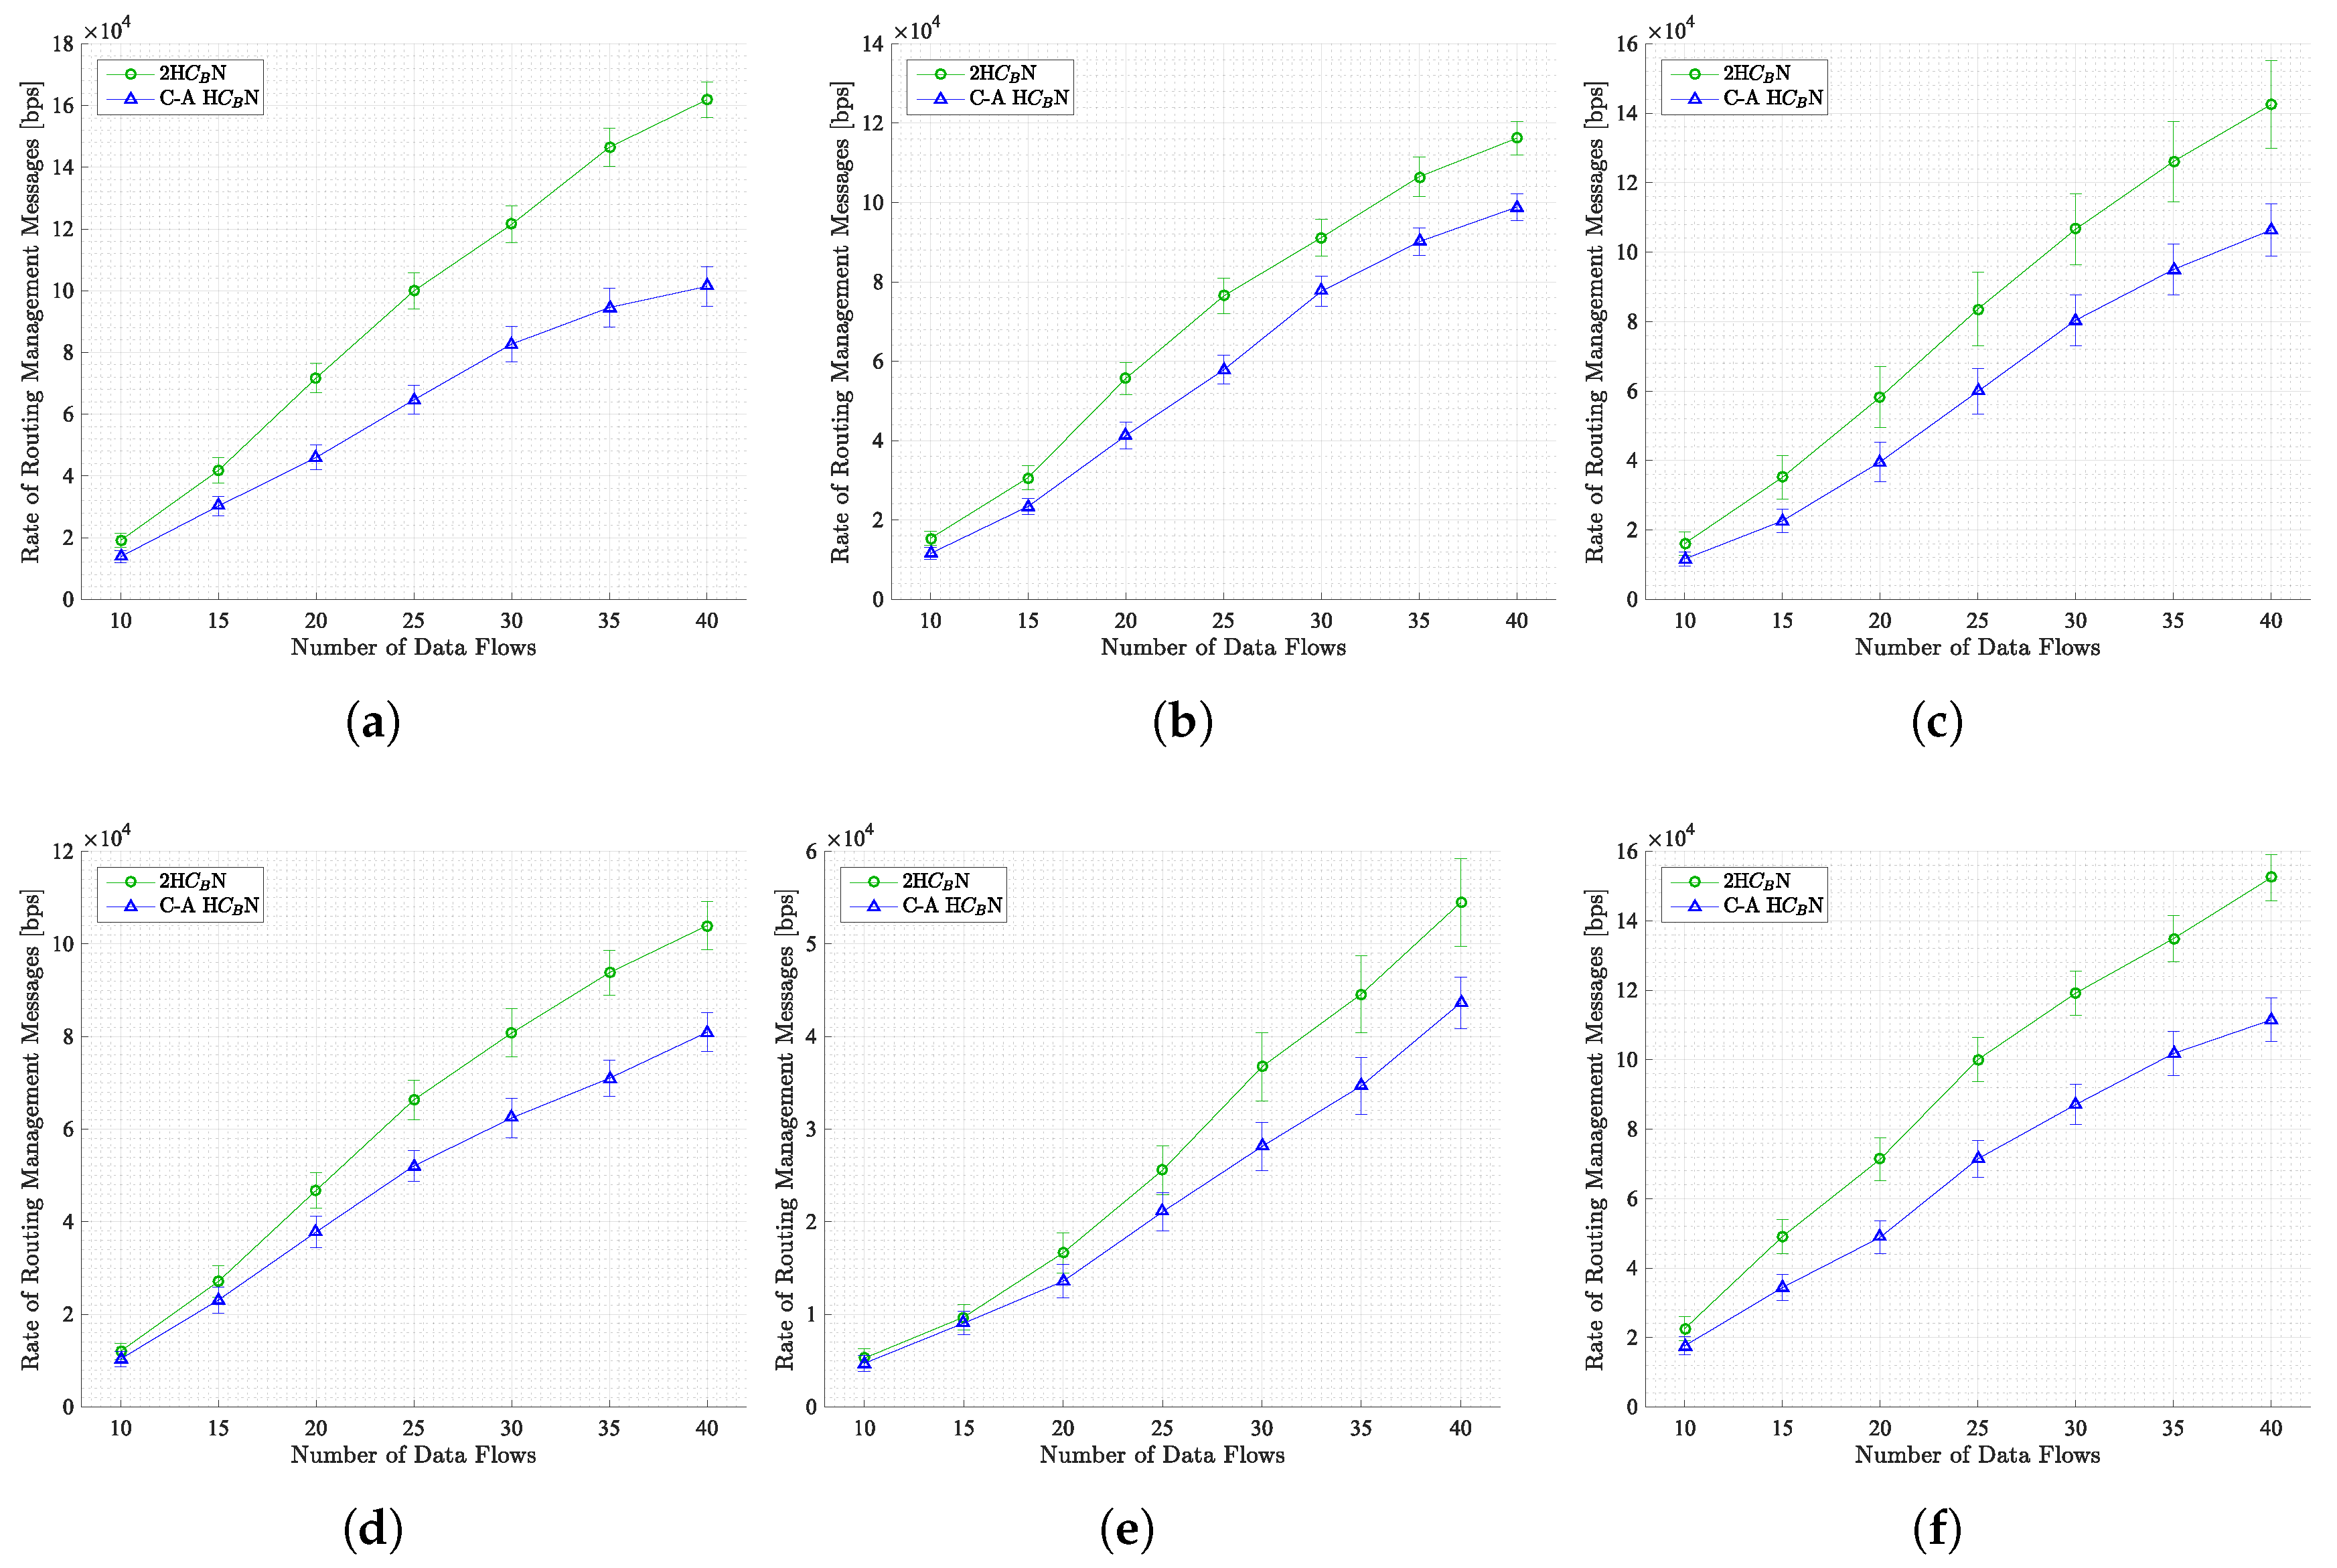
Figure 6.
Total data forwardings as a function of traffic load, for all scenarios considered. (a) SWIM scenario. (b) SLAW scenario. (c) SMOOTH scenario. (d) Disaster Area scenario. (e) Map-based scenario. (f) RWM scenario.
Figure 6.
Total data forwardings as a function of traffic load, for all scenarios considered. (a) SWIM scenario. (b) SLAW scenario. (c) SMOOTH scenario. (d) Disaster Area scenario. (e) Map-based scenario. (f) RWM scenario.
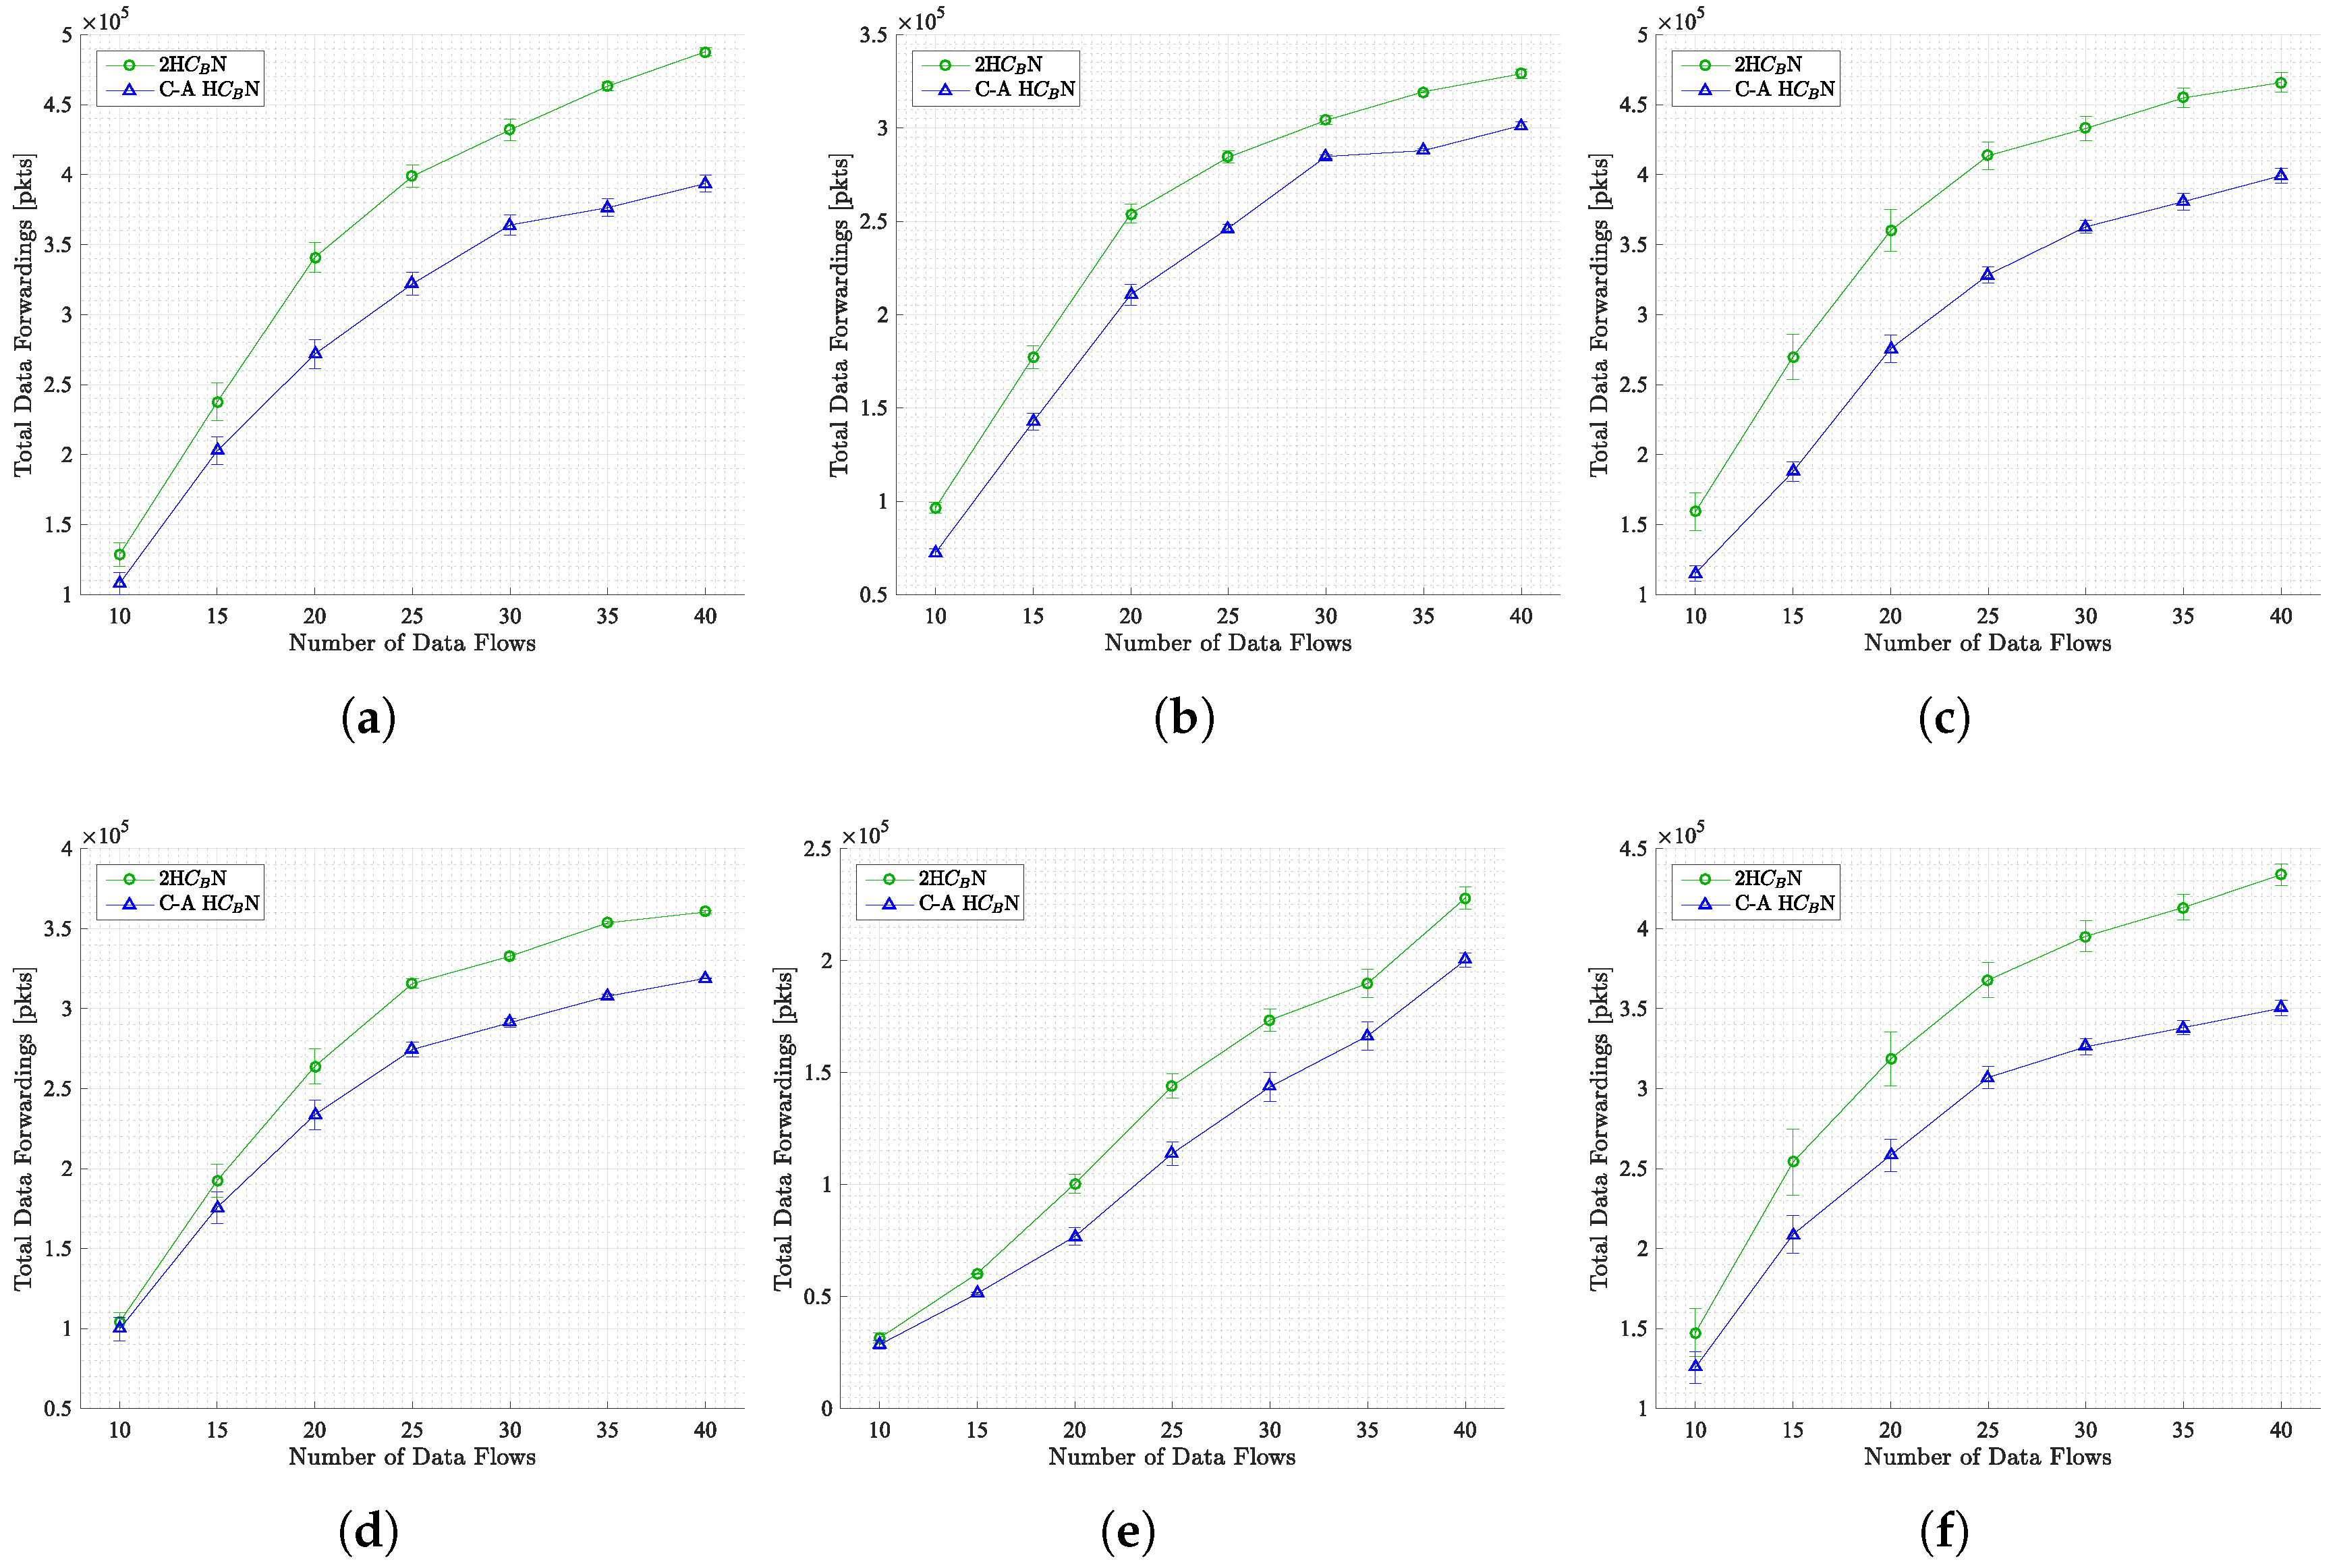
Figure 7.
Total number of successfully received data packets as a function of traffic load, for all scenarios considered. (a) SWIM scenario. (b) SLAW scenario. (c) SMOOTH scenario. (d) Disaster Area scenario. (e) Map-based scenario. (f) RWM scenario.
Figure 7.
Total number of successfully received data packets as a function of traffic load, for all scenarios considered. (a) SWIM scenario. (b) SLAW scenario. (c) SMOOTH scenario. (d) Disaster Area scenario. (e) Map-based scenario. (f) RWM scenario.
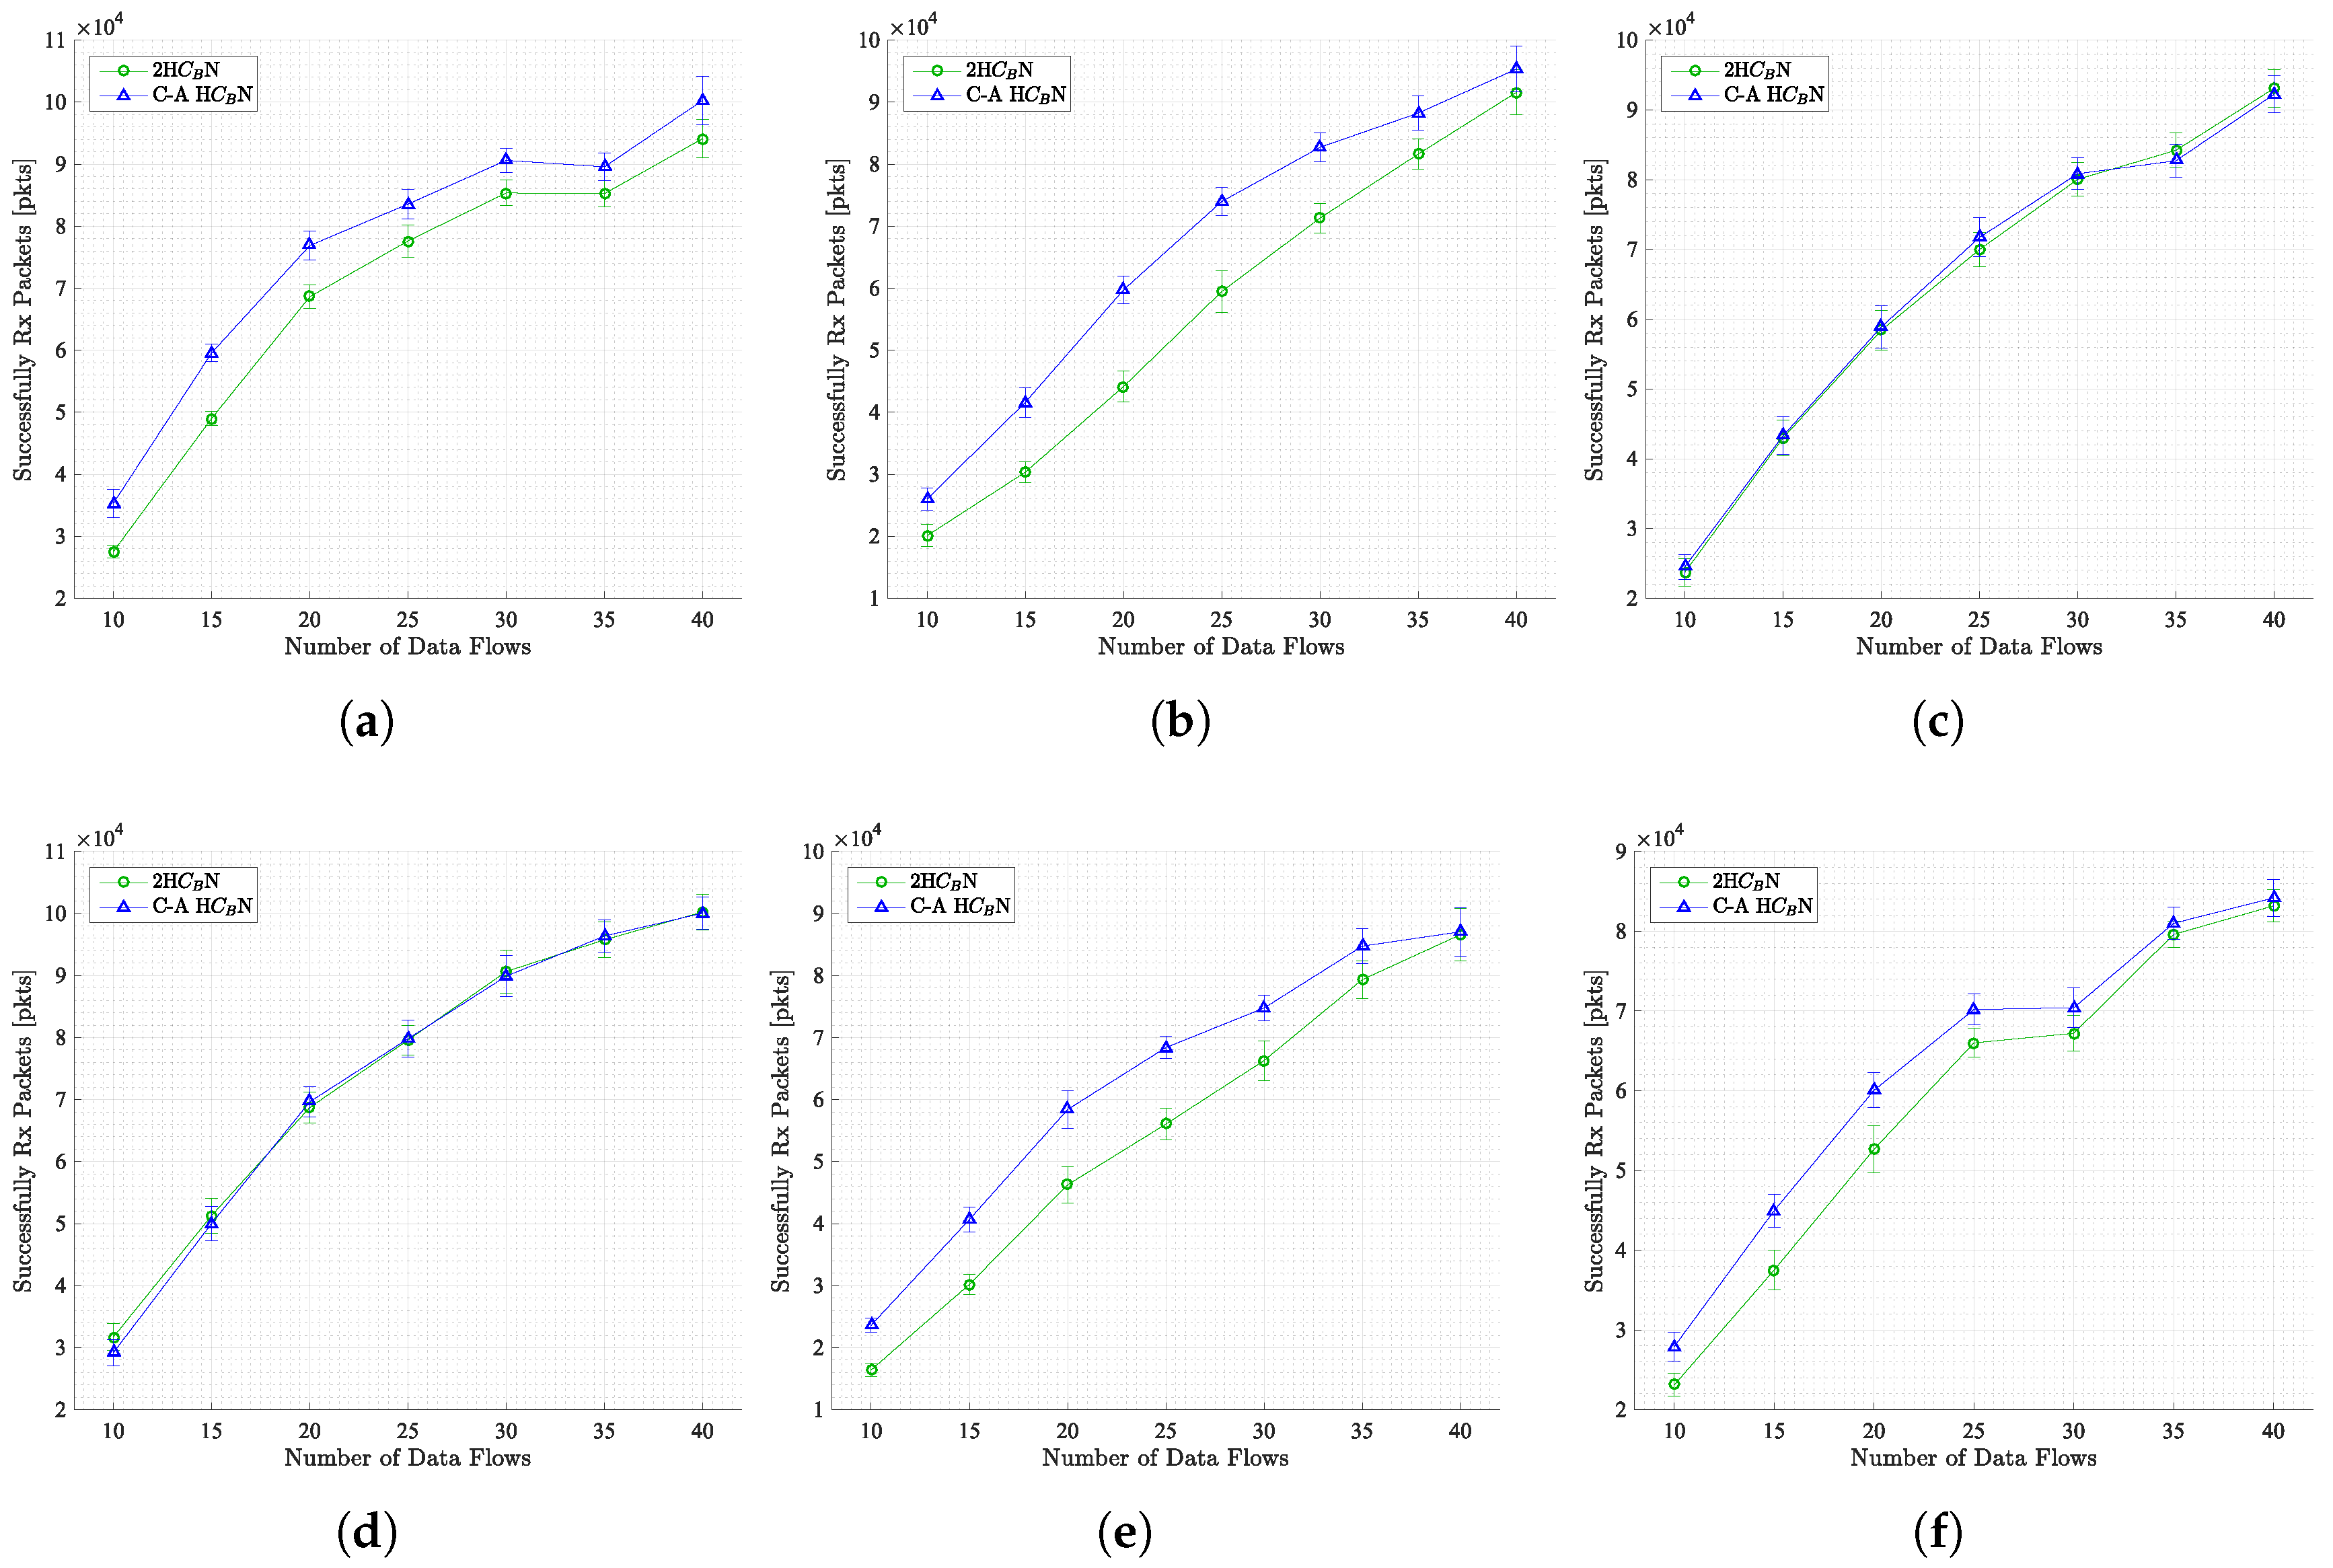
Figure 8.
Total data forwardings per successfully received packets as a function of traffic load, for all scenarios considered. (a) SWIM scenario. (b) SLAW scenario. (c) SMOOTH scenario. (d) Disaster Area scenario. (e) Map-based scenario. (f) RWM scenario.
Figure 8.
Total data forwardings per successfully received packets as a function of traffic load, for all scenarios considered. (a) SWIM scenario. (b) SLAW scenario. (c) SMOOTH scenario. (d) Disaster Area scenario. (e) Map-based scenario. (f) RWM scenario.
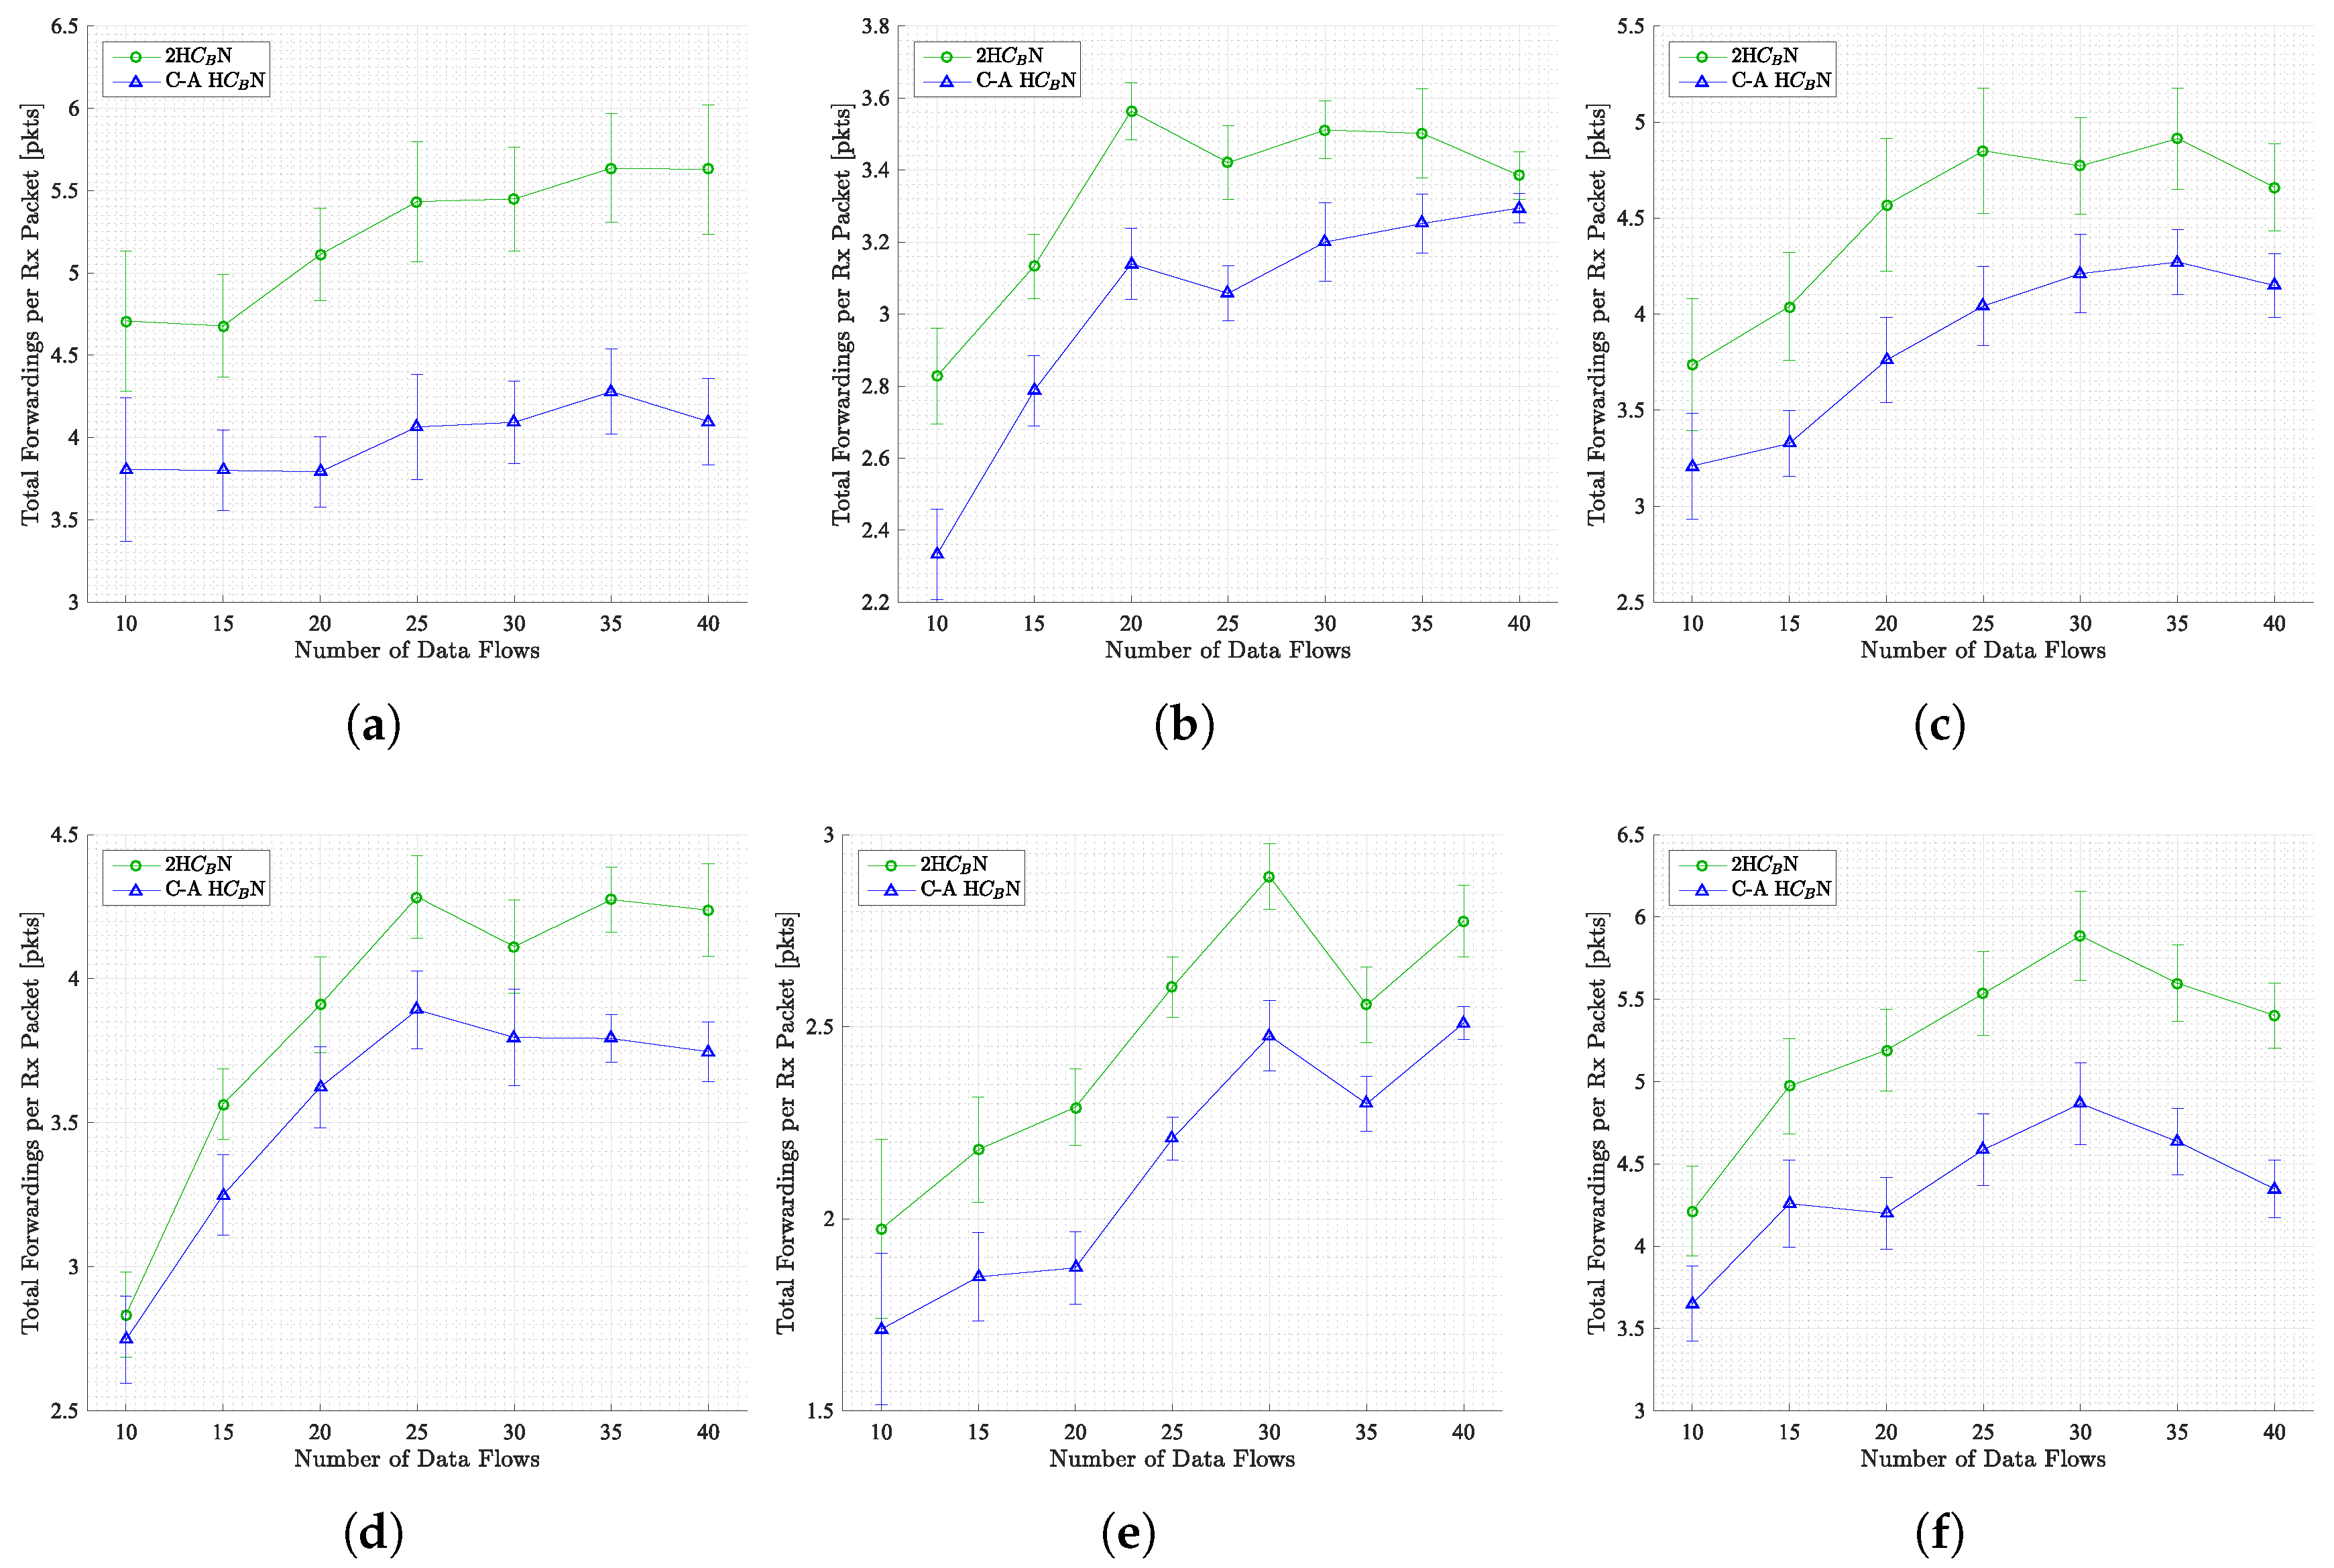
Figure 9.
Network efficiency in terms of PDR as a function of the traffic load, for all scenarios considered. (a) SWIM scenario. (b) SLAW scenario. (c) SMOOTH scenario. (d) Disaster Area scenario. (e) Map-based scenario. (f) RWM scenario.
Figure 9.
Network efficiency in terms of PDR as a function of the traffic load, for all scenarios considered. (a) SWIM scenario. (b) SLAW scenario. (c) SMOOTH scenario. (d) Disaster Area scenario. (e) Map-based scenario. (f) RWM scenario.
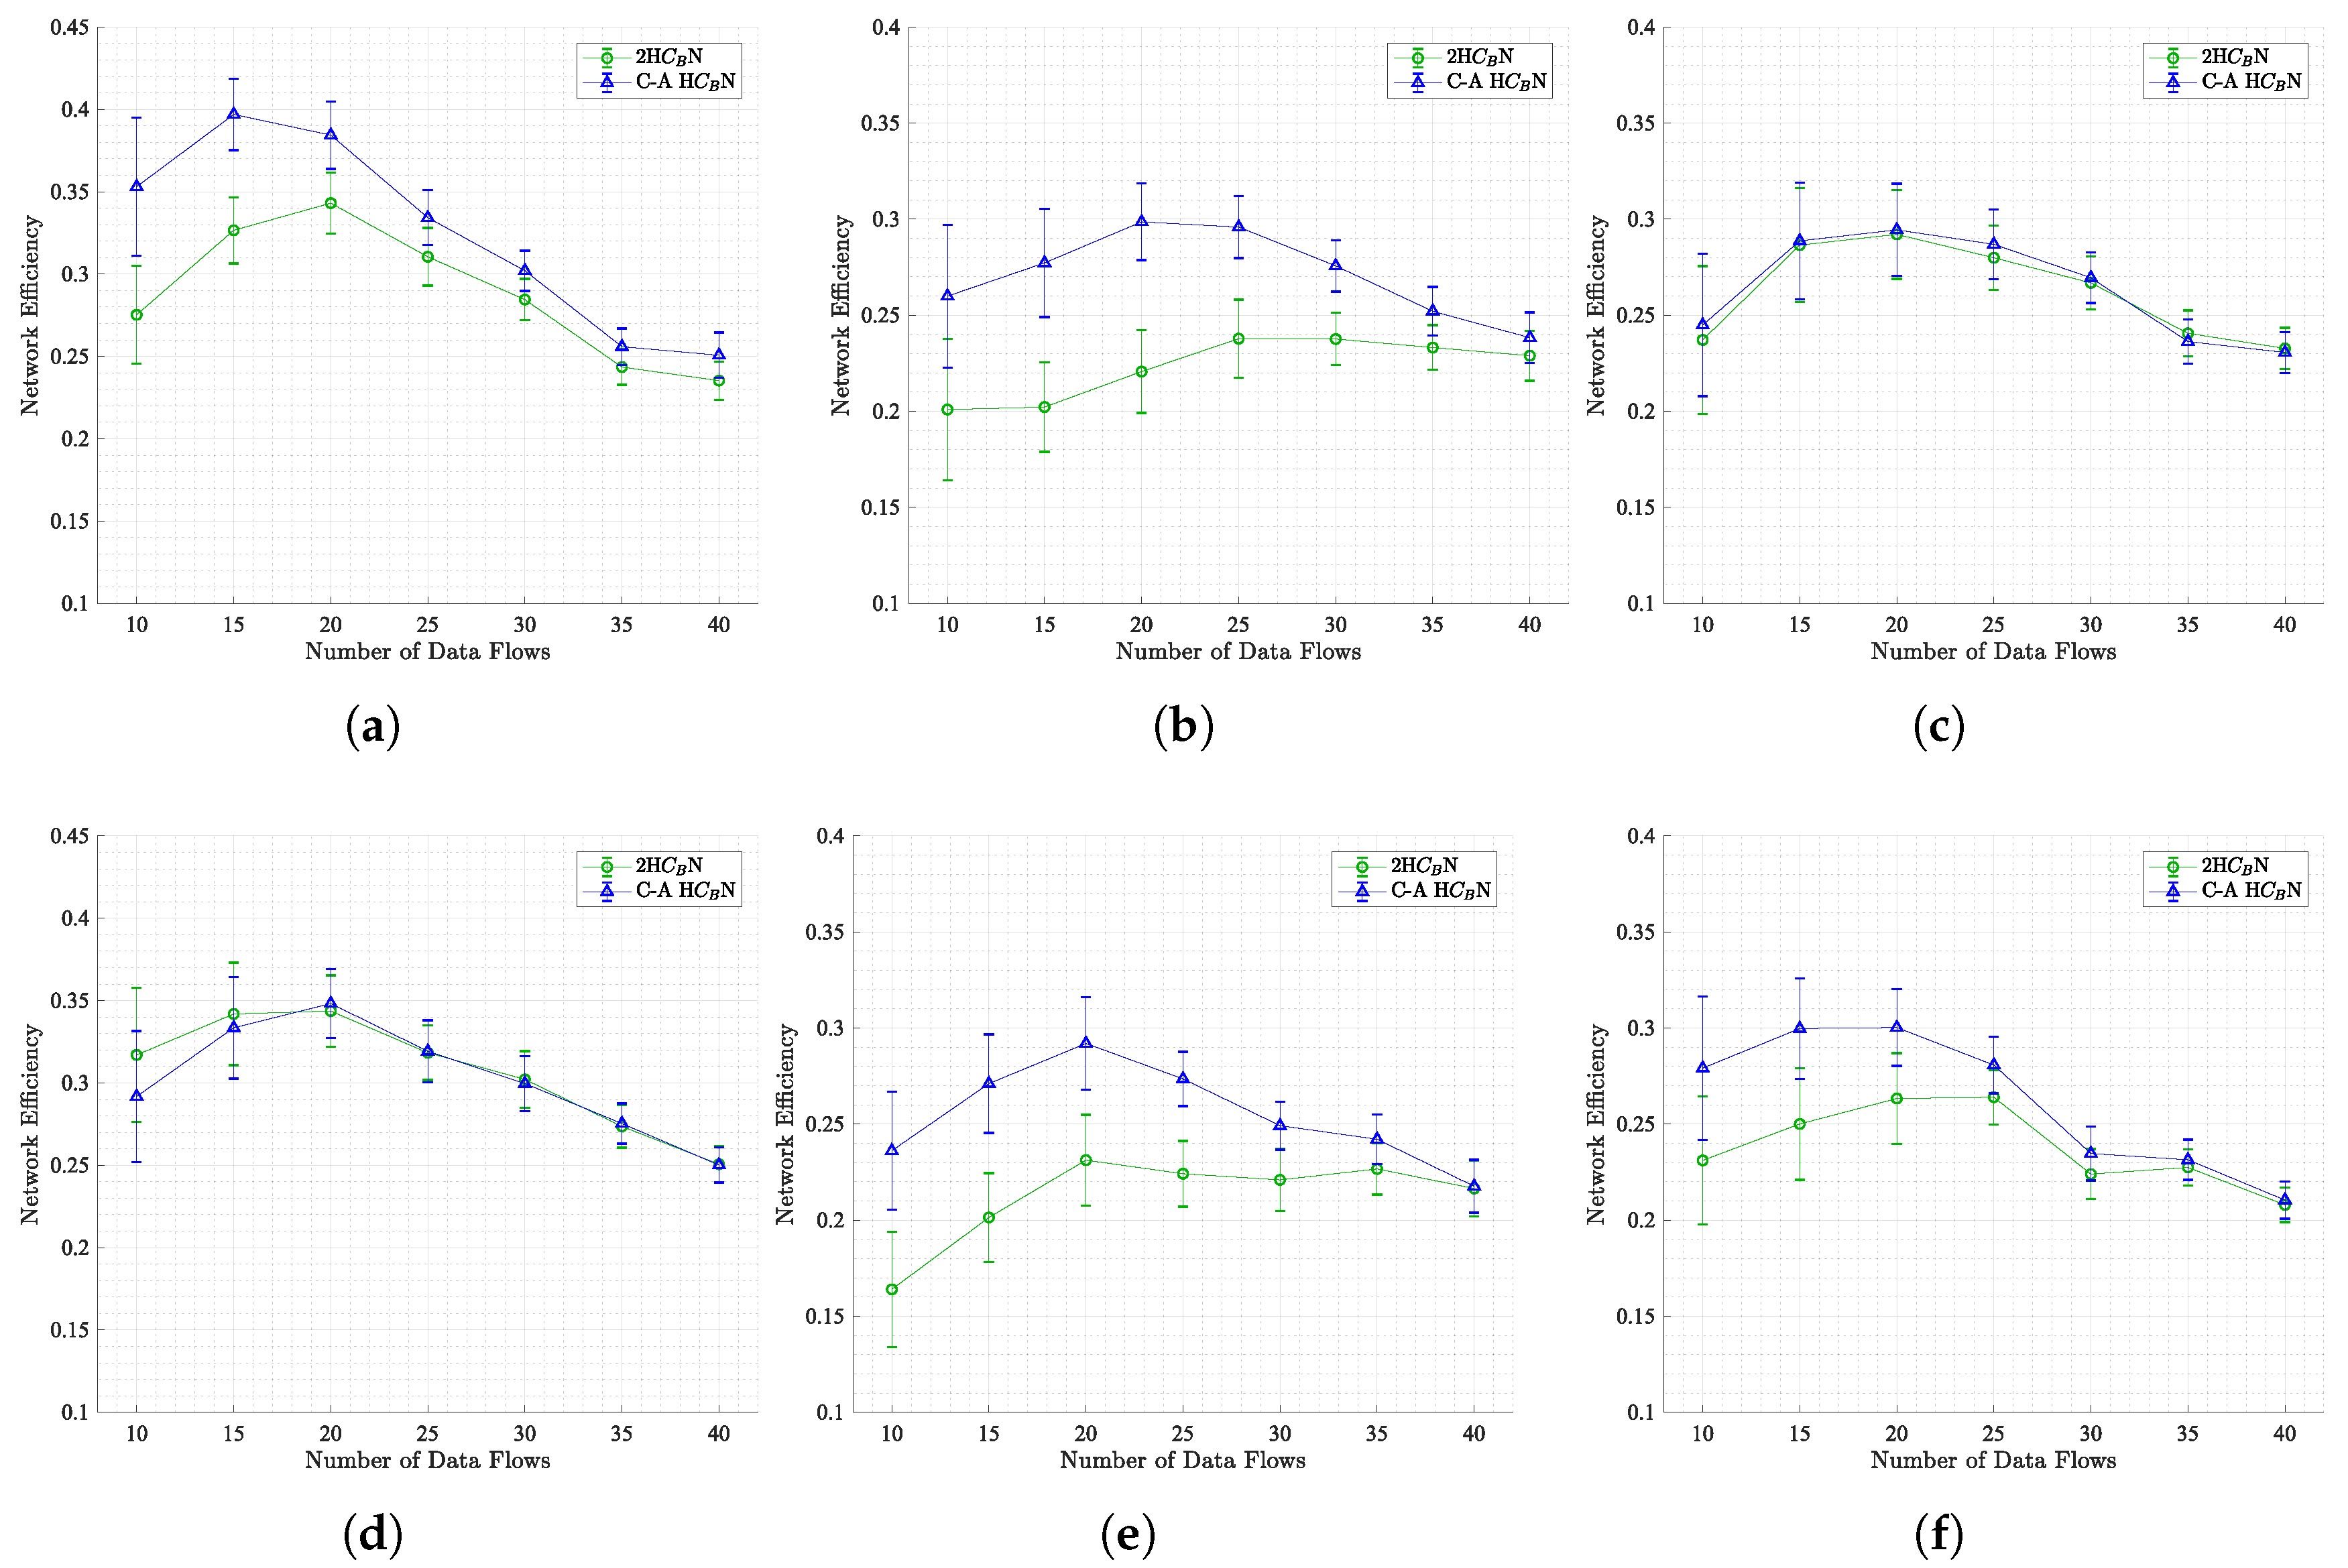
Figure 10.
Average rate of routing management messages as a function of the number of root stations, for all scenarios considered.
Figure 10.
Average rate of routing management messages as a function of the number of root stations, for all scenarios considered.
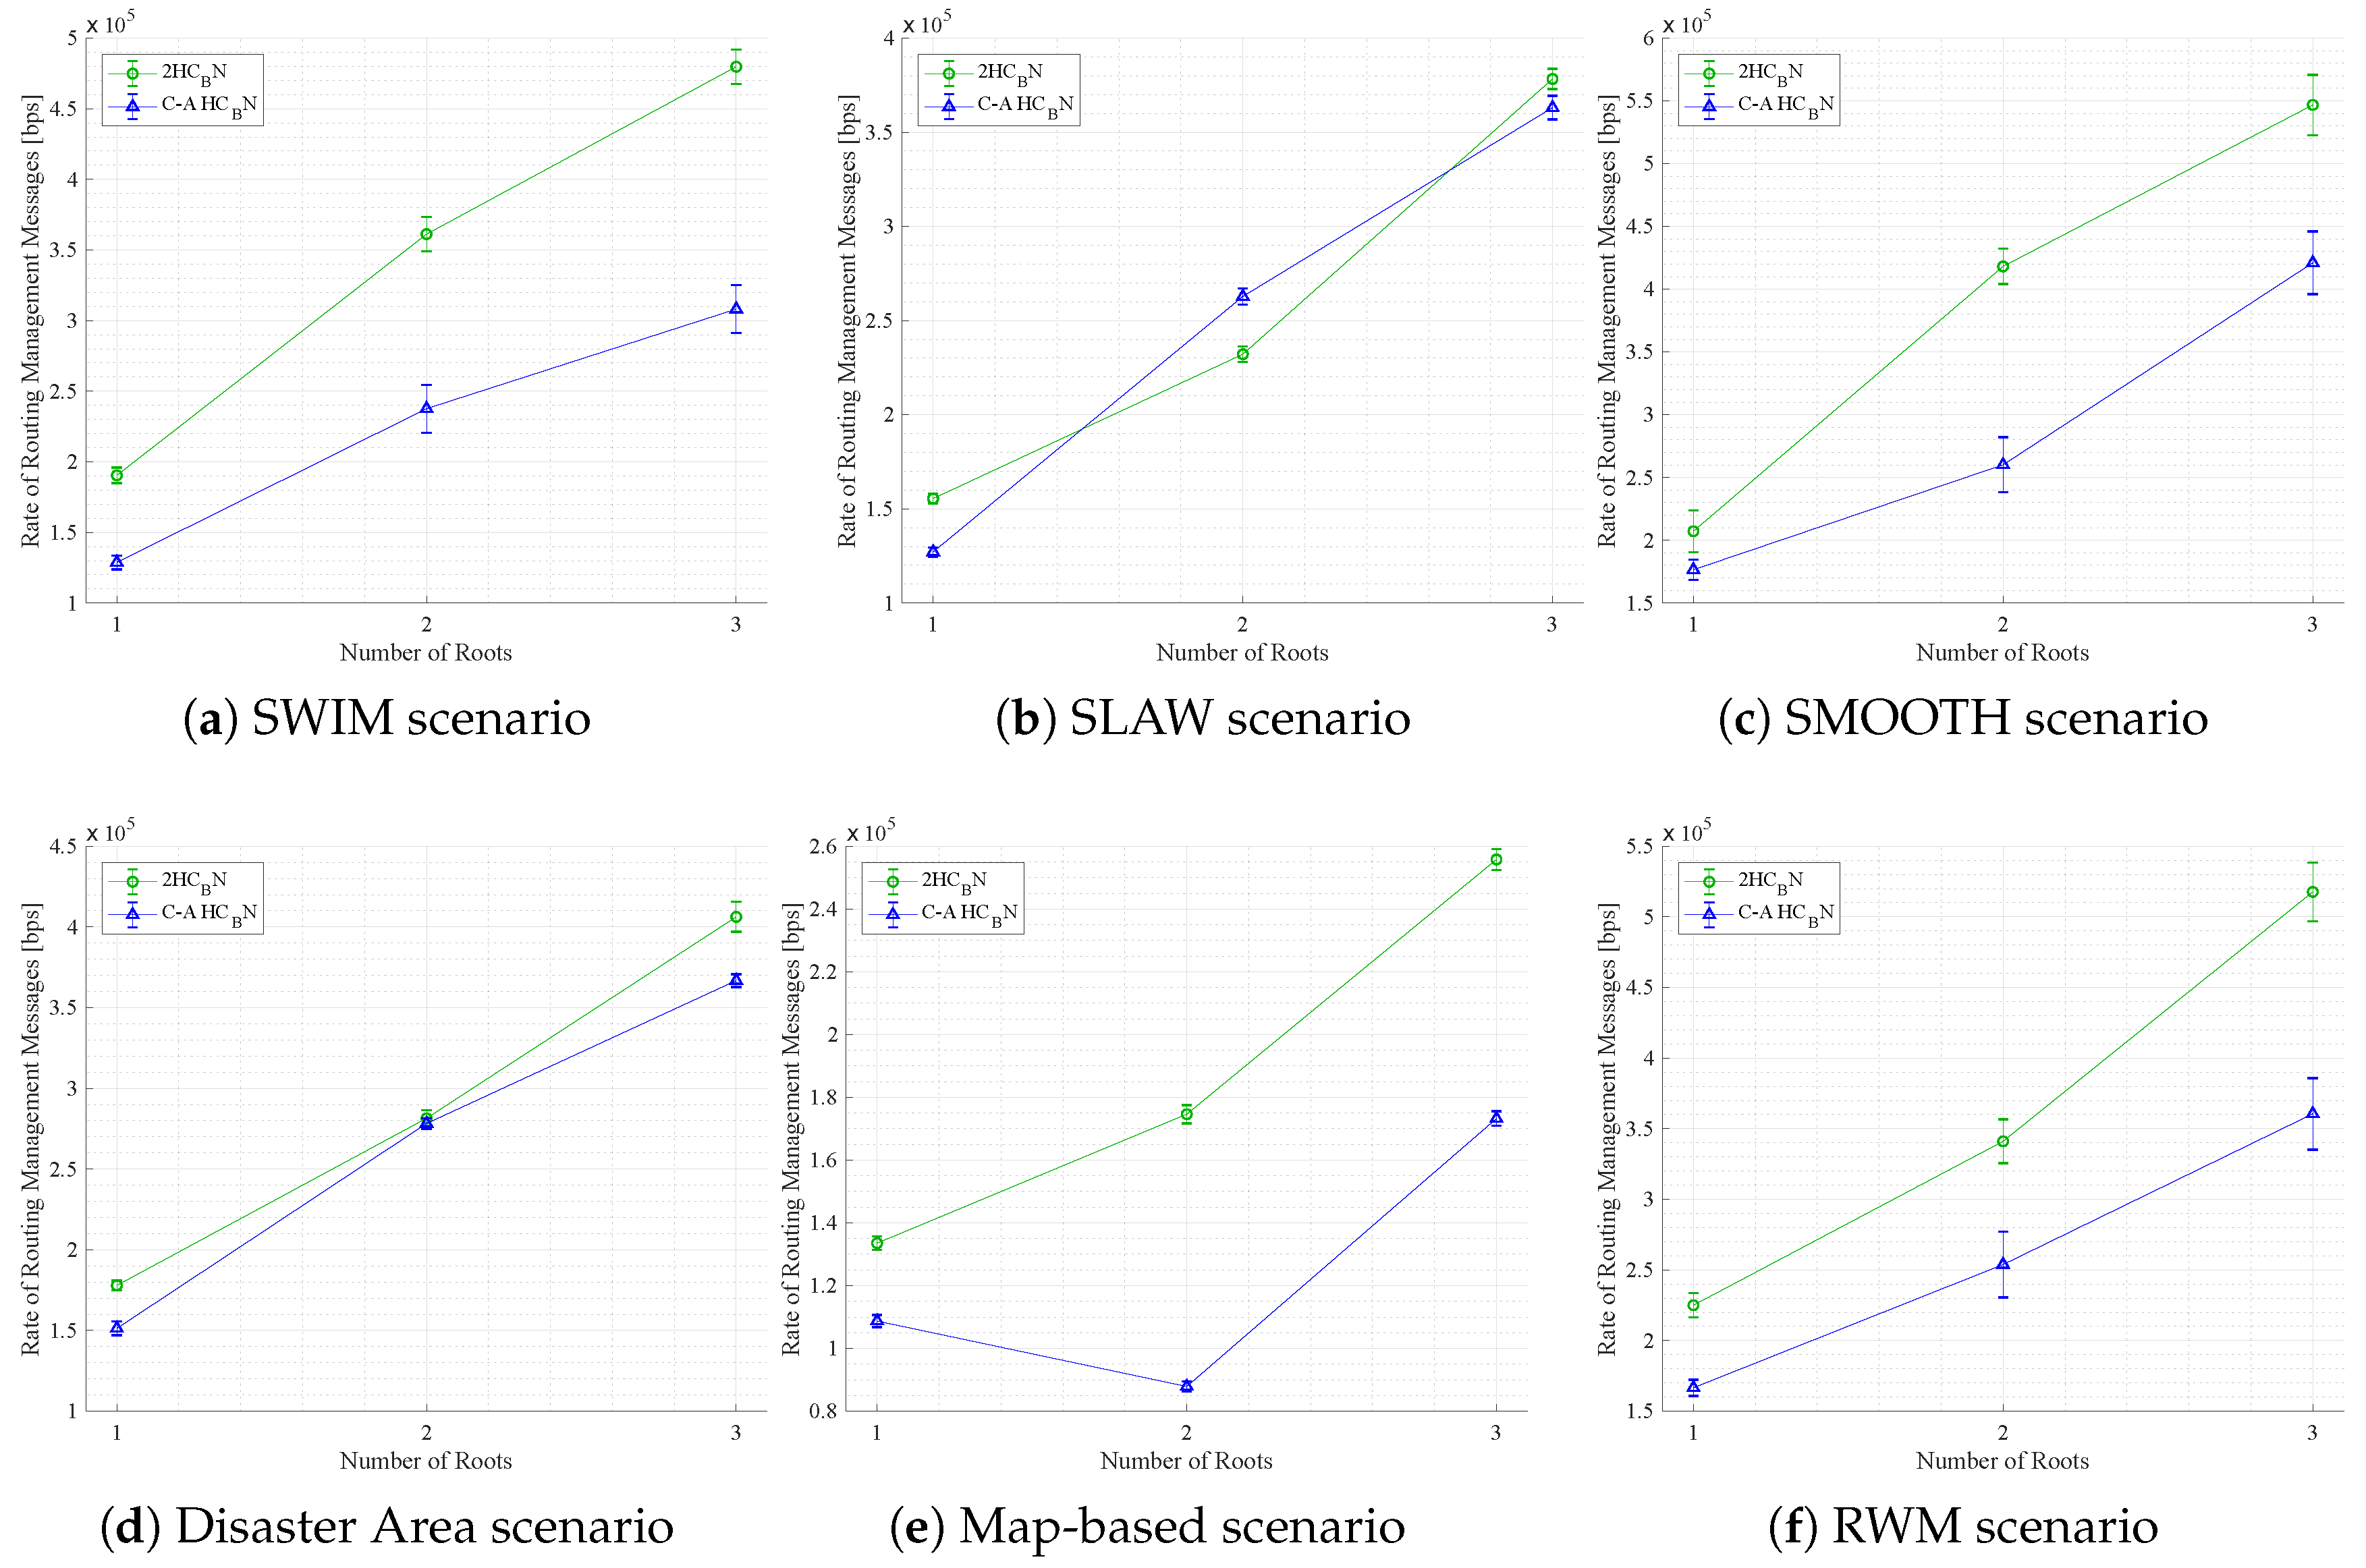
Figure 11.
Network efficiency in terms of PDR as a function of the number of root stations, for all scenarios considered.
Figure 11.
Network efficiency in terms of PDR as a function of the number of root stations, for all scenarios considered.
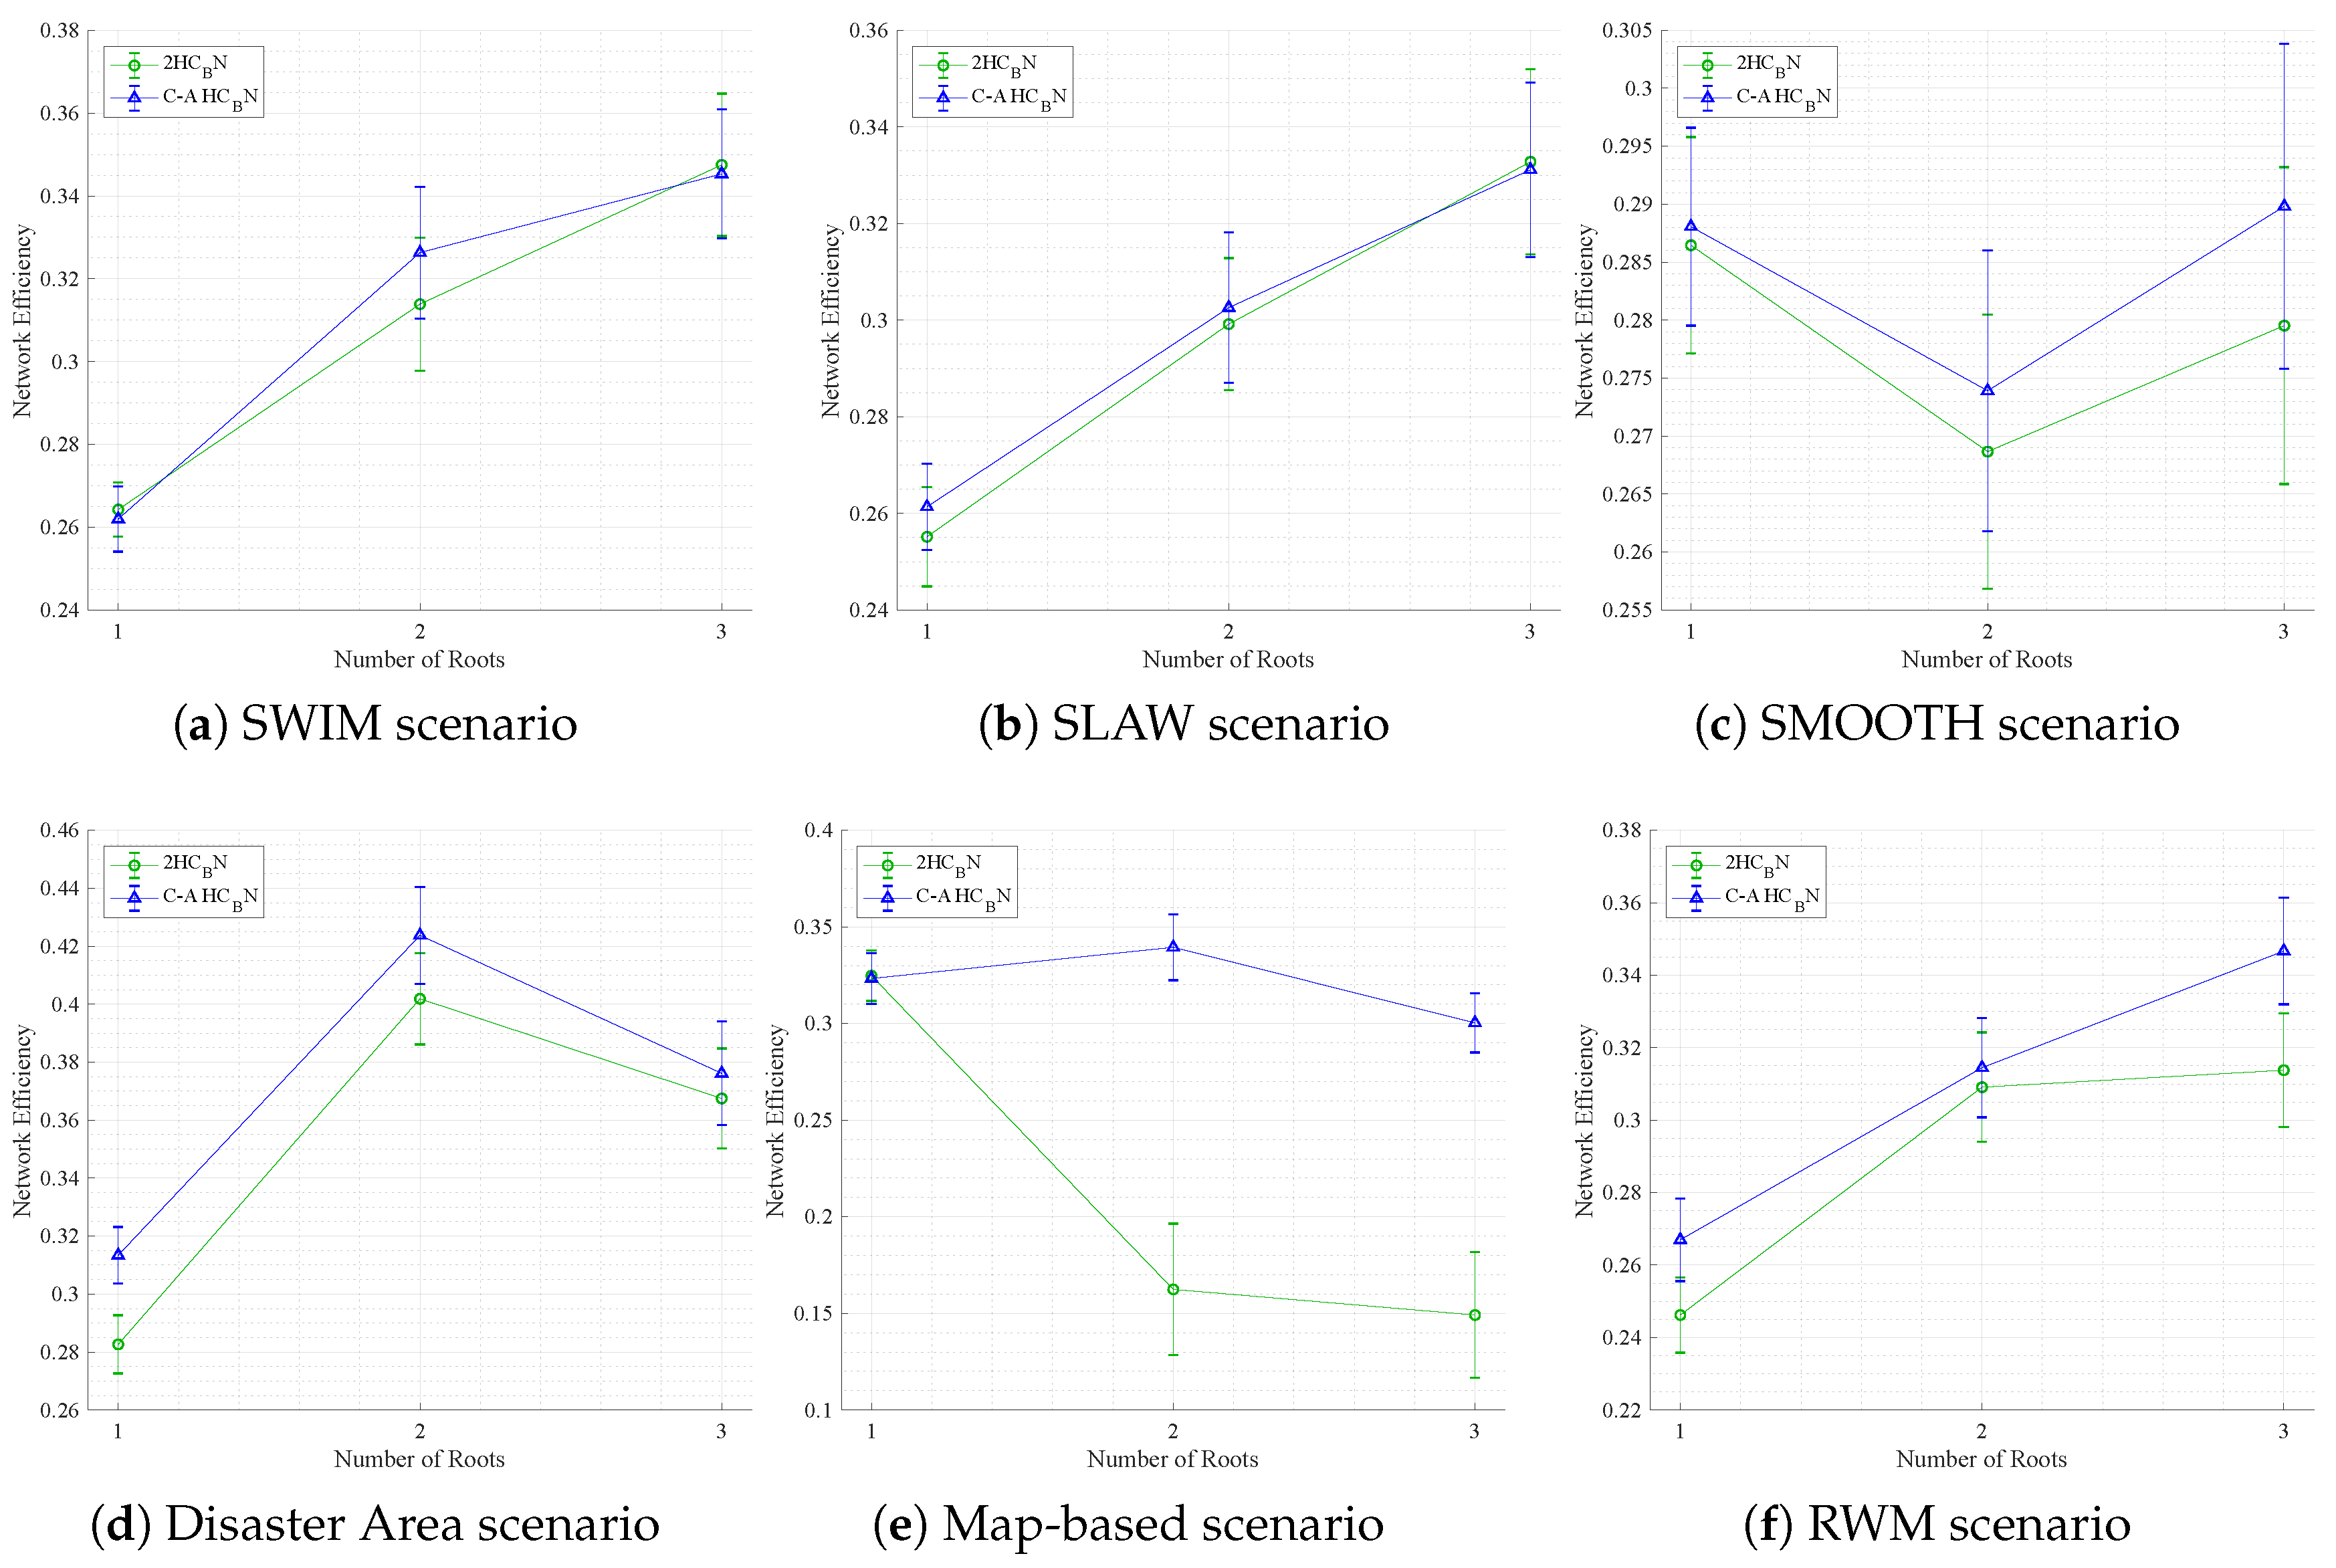

Table 1.
Comparison of human mobility models relevant to WSN/WMN simulations.
| Mobility Model | Complexity | Realism Level | Key Features | Application Scenarios |
|---|---|---|---|---|
| Lévy Walk / TLW [49] | Low | Moderate | Power-law distributed movement steps; truncated variation simulates purposeful walks | Wildlife modeling, general-purpose random mobility |
| SWIM [8] | Low | High | Proximity to home and popular spots; cell-based simulation | Urban mobility, social interaction modeling |
| SLAW [9] | High | Very High | Self-similarity; mobility zones; fractal waypoints | Campus, malls, theme parks, routine/irregular users |
| SMOOTH [10] | Medium | High | Popularity-based clusters; simplified SLAW behavior | Office environments, clustered mobility |
| Disaster Area Model [11] | Medium | High | Role-specific movements; simulated emergency zones | Emergency response, disaster simulations |
| Map-Based SLAW [50] | High | Very High | Geographical constraints; building-aware navigation | Realistic urban topologies, signal propagation studies |
Table 2.
Results of network connectivity achieved for every proposed method in the SWIM scenario at seg.
Table 2.
Results of network connectivity achieved for every proposed method in the SWIM scenario at seg.
| Method | Backbone | Isolated | Routers |
|---|---|---|---|
| fragmentation | nodes | selected | |
| most central nodes in each community | 0.0741 | 13 | 27% |
| most central nodes in each community | 0.0667 | 11 | 30% |
| C-A HN | 0 | 0 | 49% |
| C-A HN | 0 | 0 | 40% |
| 2HN | 0 | 0 | 47% |
Table 3.
Results of reduce topology backbone for the proposed C-A HN method for all scenarios.
| Mobility | Number of routers | Number of state changes | Average number of edges | ||||||||||
|---|---|---|---|---|---|---|---|---|---|---|---|---|---|
| Model | Min. | Max. | Mean | Min. | Max. | Mean | All nodes as MR | C-A HN | Difference | ||||
| SWIM | 34 | 48 | 40.28 | 2.93 | 8 | 35 | 23.36 | 6.14 | 356.54 | 232.65 | 34.58% | ||
| SLAW | 31 | 44 | 36.34 | 3.36 | 5 | 28 | 15.96 | 5.79 | 541.14 | 320.31 | 40.77% | ||
| SMOOTH | 34 | 49 | 41.43 | 2.86 | 0 | 32 | 12.2 | 6.65 | 356.09 | 245.93 | 30.52% | ||
| Disaster Area | 31 | 44 | 36.33 | 2.73 | 6 | 40 | 22.77 | 7.52 | 486.65 | 284.31 | 41.47% | ||
| Map-based | 33 | 46 | 37.66 | 3.15 | 2 | 26 | 13.35 | 5.34 | 480.03 | 267.76 | 43.97% | ||
| RWM | 38 | 49 | 42.19 | 2.51 | 0 | 32 | 15.78 | 7.61 | 336.03 | 224.11 | 33.26% | ||
Table 4.
Average number of edges in topologies for 500 second simulation.
| Scenario | All Routers | C-A HN |
|---|---|---|
| SWIM | 356.54 | 232.65 |
| SLAW | 541.14 | 320.31 |
| SMOOTH | 356.09 | 245.93 |
| Disaster A. | 486.65 | 284.31 |
| Map-based | 480.03 | 267.76 |
| RWM | 336.03 | 224.11 |
Table 5.
Average improvements with the C-A HN method compared to 2HN, for reactive mode.
| Mobility Model | Reduction of routing messages | Reduction of data forwardings | Increase in received packets | Reduction of forwardings per successfully received packet | Increase in network efficiency in terms of PDR | Reduction of network energy consumption (20 data flows) |
|---|---|---|---|---|---|---|
| SWIM | 38.29% | 17.73% | 10.63% | 23.58% | 10.63% | 22.54% |
| SLAW | 20.55% | 14.23% | 17.25% | 9.96% | 17.25% | 13.93% |
| SMOOTH | 28.35% | 21.26% | 0.78% | 14.56% | 0.78% | 17.19% |
| Disaster A. | 19.81% | 10.64% | -1.43% | 8.42% | -1.43% | 14.69% |
| Map-based | 17.00% | 15.77% | 16.19% | 13.68% | 16.19% | 35.40% |
| RWM | 27.19% | 17.56% | 8.50% | 16.85% | 8.50% | 24.99% |
Table 6.
Average improvements with the C-A HN method compared to 2HN, for proactive mode.
| [0.25cm]Mobility Model | [0.25cm]Reduction of routing messages |
[0.25cm]Increase in network efficiency in terms of PDR |
Reduction of energy consumption with 3 root stations and 75 active flows |
|
|---|---|---|---|---|
| All nodes | non-root station only | |||
| SWIM | 34.11% | 0.77% | 15.26% | 6.92% |
| SLAW | 3.01% | 1.00% | 2.12% | 1.42% |
| SMOOTH | 25.20% | 2.01% | 7.16% | 3.64% |
| Disaster A. | 8.61% | 5.76% | 9.16% | 8.66% |
| Map-based | 33.52% | 34.02% | 12.54% | 6.86% |
| RWM | 27.31% | 6.32% | 14.34% | 11.40% |
Disclaimer/Publisher’s Note: The statements, opinions and data contained in all publications are solely those of the individual author(s) and contributor(s) and not of MDPI and/or the editor(s). MDPI and/or the editor(s) disclaim responsibility for any injury to people or property resulting from any ideas, methods, instructions or products referred to in the content. |
© 2025 by the authors. Licensee MDPI, Basel, Switzerland. This article is an open access article distributed under the terms and conditions of the Creative Commons Attribution (CC BY) license (http://creativecommons.org/licenses/by/4.0/).
Copyright: This open access article is published under a Creative Commons CC BY 4.0 license, which permit the free download, distribution, and reuse, provided that the author and preprint are cited in any reuse.


