
Submitted:
08 July 2025
Posted:
09 July 2025
You are already at the latest version
Abstract
Parking space shortages are attributed to an increased density of vehicle presence in the urban context, necessitating the implementation of effective parking management strategies, especially in areas where facility expansion is constrained by limited land availability. Many parking facilities remain operationally inefficient and underutilized due to manual vehicle profiling methods and having little access to parking resource utilization data. This study develops a digital twin-based smart parking management system integrating machine vision, data modeling, and digital twin technology to automate facility management operations. The system uses YOLOv7 for vehicle and license plate detection, and Deep Text Recognition-Scene Text Recognition (DTR-STR) for license plate recognition (LPR). Findings indicate an 89.89% accuracy for vehicle profiling and LPR-based occupancy tracking tasks, and 94.86% for vehicle detection-based occupancy tracking. The system in the built environment comprises of three features: (1) automated vehicle profiling at parking entry and exit points, (2) occupancy monitoring through LPR, and (3) object detection for occupancy tracking. The 3D BIM digital twin model in Autodesk Revit processes inference data from machine vision models to visualize parking activity. Smart parking automation offers a viable solution for business stakeholders interested in operations optimization through manual labor reduction, improving efficiency, and minimizing congestion.
Keywords:
3D LiDAR
; 3D modeling
; building information management
; data modeling
; deep text recognition
; digital twins
; machine learning
; object detection
; scene text recognition
; urban planning
1. Introduction
The United Nations' Sustainable Development Goals (SDGs) for 2030 emphasize the importance of efficient mobility and transportation in pursuing long-term sustainable global development. Urban infrastructure development plans must align to this initiative as the global population is forecasted to surpass 9 billion by 2040 [1]. Traffic congestion in urban areas has worsened significantly due to increasing rates of private vehicle ownership brought about by population growth, urbanization, industrialization, and economic progression [2,3]. Increased urbanization and traffic challenges must be addressed by relevant local community and national stakeholders. Governments must promptly implement novel and advanced technologies that aim to optimize logistical efficiency, manage traffic, and promote sustainable transportation alternatives [4] by integrating solutions mainly designed for sustainable urban mobility of drivers, passengers, and pedestrians [5,6]. Making these tools accessible to the public is crucial for reducing congestion and improving overall mobility efficiency [7]. The effective integration of technology-based systems to transportation and mobility is commonly referred to as ITS or intelligent transportation systems [8,9]. Many stakeholders are continually integrating different emerging technologies in information and communications technology (ICT) [10], Internet of Things (IoT) [11,12], and artificial intelligence (AI) [1,13] to address problems in the ITS field.
An abundant body of ITS literature remains heavily concentrated on traffic control and management applications. Studies concentrate on using smart applications to solve traffic in public roads. Fewer studies are available that use smart applications to solve parking facility management problems [2,14]. This research effort imbalance translates to an exacerbation of prevailing parking-related challenges, notably the scarcity of available parking spaces in urban areas, significantly contributing to traffic congestion [15,16]. Recent research indicates that non-optimal cruising while searching for vacant parking spaces significantly exacerbates urban congestion. This is because restricted facility entry, especially during peak hours, frequently necessitates vehicles queueing on public roads, further exacerbating traffic congestion. Furthermore, the average cruising distance during peak hours is 2.7 times longer than the optimal distance, increasing CO2 emissions [17]. These inefficiencies underscore the need for more intelligent parking solutions to address operational and environmental challenges [18]. These oversights can be resolved by systematically implementing smart parking management systems (SPMS) capable of real-time vehicle profiling and activity monitoring within parking facilities [2,19]. Although existing research has investigated various aspects of smart parking management, there is still a gap in the transition of these practices to emergent trends, particularly the integration of smart cyber-physical systems (CPS). Developments are further stalled due to evolving data privacy laws that increasingly require explicit consent for the collection and processing of personal information, thus further complicating the integration of new technologies and legal matters.
SPMS implementations present substantial ethical and legal obstacles, particularly in user consent and data privacy. AI-driven surveillance, license plate recognition, and video footage collection present significant concerns over data collection [20,21]. In contrast to traditional implied data collection consent in retail, which assumes a user's presence signifies agreement [22], modern data protection regulations such as the General Data Protection Regulation (GDPR) and the California Consumer Privacy Act (CCPA) mandate explicit consent for collecting and processing personal data [20,21]. Users should be explicitly informed regarding the data collected and its intended purposes and must give clear, affirmative consent [22]. Despite emerging data privacy concerns in the face of needing to introduce new technologies for system efficiency, security, and ethical considerations, smart parking technology development initiatives continue to persist through struct adherence to transparent data policies, anonymization techniques, and stringent access controls [23]. Data privacy regulations have not impeded innovation. Rather, they have necessitated the development of more secure and privacy-conscious novel solutions that comply with industry standards. SPMS are advancing to incorporate more frameworks that improve operational efficiency and ensure compliance with data privacy laws [24,25].
Most CPS research leans towards developing digital twin (DT) models through a Building Information Models (BIM) framework for parking facilities. Current SPMS-BIM implementations face challenges in delivering an intuitive and encompassing visualization platform that effectively reflects the real-time status of the facility [26]. Conventional monitoring systems depend on surveillance camera networks to provide comprehensive coverage throughout the facility. While camera networks allow managers to monitor vehicle parking activities remotely, it requires manual switching between various camera feeds, rendering the process laborious and inefficient, especially in facilities with extensive camera networks. DT models address this challenge by integrating real-time data into a cohesive visualization platform to help improve decision-making capabilities [27].
DT models come in two forms: 2D and 3D. Although 2D models offer an organized framework of understanding, they often oversimplify geometric features. The level of detail is lesser, necessitating relevant personnel to mentally interpret flat and simplified 2D representations [28]. In parking facility management contexts, this poses a challenge in effectively evaluating real-time occupancy, vehicle flow, and congestion points, thereby slowing down monitoring operations and reducing work efficiency. In contrast, 3D DT models closely represent the actual facility layout and provide a more user-friendly and immersive depiction. 3D models can optimize facility management by combining real-time data streams from smart applications such as machine vision and sensor data. Such configuration improves the situational awareness and lowers cognitive burden [29,30].
This study focuses on developing a framework for SPMS development integrated with a 3D BIM interface for 3D spatial understanding of the built environment. The system is a dynamic and interactive 3D BIM model integrated with video data streams, enabling precise monitoring and decision-making for parking facilities. This can streamline and improve the workflows of facility managers, thereby decreasing the chances of errors and inefficiencies and increasing facility productivity and resource turnover.
The primary contribution of this study is creating a dynamic DT interface to demonstrate a proof-of-concept remote parking occupancy monitoring system through a 3D BIM visualization interface. The developed SPMS combines object detection, scene text recognition, and data processing algorithms to profile vehicles and analyze occupancy statistics from surveillance video footage. A LiDAR-based point cloud model was used to create a 3D Revit model, ensuring an accurate geometric depiction of the parking facility environment. The Dynamo plugin in Autodesk Revit dynamically updates the model by attaching it to the system's backend, allowing recorded occupancy changes to be visually represented. This study demonstrates how several smart applications can be used to improve facility management operations. The findings create a scalable framework for smart infrastructure applications to help urban planners and engineers optimize resource usage, improve commuter experiences, and advance sustainability goals.
2. Smart Parking Management Systems
The design and implementation of an SPMS attempts to resolve vehicle congestion issues caused by the inefficiencies of manually operated parking facilities [31]. By integrating advanced technologies, parking processes are optimized to ensure that the timely service of providing parking spaces to vehicles is made more efficient and straightforward [32]. Smart parking facilities provide occupancy statistics on mobile applications, online digital viewing platforms, or public displays. These features improve the user experience of drivers browsing for parking spaces. The commuting public can access the data, navigate the parking area or nearby facilities, and seek available slots using their devices [33,34]. The information provision service will simplify locating vacant parking spaces by providing vehicles with information regarding the number of available spaces and their location [2,3]. The framework for developing smart parking facilities adheres to a generic framework, as shown in Figure 1. Typically, facilities equipped with an SPMS infrastructure is comprised of hardware and software components. Examples of hardware components are low-cost or advanced sensor technologies that aid in the data collection process of parking activity data. The software infrastructure is often manifested in frontend and backend platforms. Frontend examples include a graphical user interface that provides a simplified or complex representation of the parking space in a client device-accessible graphical user interface (GUI). The backend component is the platform that contains data from which the information from the GUI is sourced. Data can be housed either locally or through a cloud web-based server [31].
There are several approaches to developing SPMSs. Incorporating AI through machine learning and machine vision is one of the most common methods. Vision-driven systems acquire a scene understanding of vehicle parking activity events that are occurring by utilizing real-time or recorded video streams. This procedure may be referred to as automated parking facility activity monitoring [35,36]. Computer vision techniques, such as vehicle detection [37,38], vehicle tracking [33,39], and LPR [36,40], are used to automate the monitoring procedures. Research literature on integrating and applying these techniques is exceedingly saturated [39,41]. Computer vision tools can expedite facility monitoring and management processes. This is possible, provided that the built environment is equipped with the appropriate hardware. Else, these systems may be hindered by non-conducive external conditions, ranging from include insufficient illumination, unoptimized camera positioning, to communication latencies brought by signal disruptions [40,42]. The digital infrastructure of the parking facility processes the inference data acquired from these computer vision systems [16]. A common method is using object detection architectures to detect and classify objects in images are widely applied in parking management systems. Vehicle detection is a common technique integrated into parking management systems [33,37,39]. Through vehicle detection, video feed obtained from surveillance cameras can be used by the system to detect vehicle presence [6,43]. Vision system inference data can assist facility managers in making decisions that will optimize operations and more effectively manage demand [31,44].
Several object detection architectures are available. They are clustered into two types: single-stage and two-stage detectors [45]. Single-stage detector architecture include EfficientDet, RetinaNet [45], and the YOLO architectures [46]. Two-stage detectors include Faster R-CNN [47], Mask R-CNN [38], and SSD Mobilenet [48]. There are primary differences in how these object detectors perform inferences. Single-stage detectors process an entire image in a single phase. By generating anchor boxes of varying sizes and dimensions, they divide the image into a grid, score them for object presence, and localize their identified location in superimposed bounding boxes, directly predicting and classifying objects. This approach is more efficient than two-stage detectors, as the latter requires a distinct region proposal phase. Two-stage detectors must first provide proposals of regions where objects are possibly located in an image. After determining which regions are highly likely to contain objects of interest, these objects are then classified, and the bounding frames are refined by a second neural network that performs detection and classification in these regions [6,36,45]. While two-stage detectors are more precise, the performance of single-stage detections are sufficient enough for real time contexts. The inference speed of single-stage detectors is highly effective for real-time use. Various studies reported that in system deployments, their minor precision deficiencies are outweighed by their speed, rendering them suitable for real-time applications [45,46].
There are two object detection-based methods for determining parking occupancy. One approach is to develop a model capable of distinguishing between occupied and vacant parking spaces. Automated occupancy determination is facilitated by this method, eliminating the need for predefined parking spaces. Another method is to first predefine the regions in an image frame where parking spaces are located. Vehicle detection models will be used to detect vehicles, which are then passed to an algorithm to validate if the detected vehicle is located within the tolerance bounds of the predefined parking spaces. Figure 2 below shows a sample implementation of object detection [49].
System designers find the first method highly convenient, eliminating the need to predefine parking spaces. However, this approach is highly restrictive if scaling intentions were to be pursued by the parking facility’s management body [50]. The first approach is two-step process where parking spaces are detected, and their occupancy state is then classified as either vacant or occupied. While functional, at times, performing vehicle profiling on parked vehicles is imperative. Facility managers may need more information on the vehicle as it aligns with the operational and management requirements of parking facilities [51]. An example would be specific fee differentials based on the type of vehicle, such as motorcycles, public utility vehicles, and private vehicles [52]. The second approach solves this limitation by using vehicle detection and classification in conjunction with algorithms that account for known parking space regions to accommodate potential future features. These systems are three-fold: contextual memory retention of specified parking space regions or regional ground truths, then comparing these ground truths with object detection bounding box inferences, and finally, having an algorithm to classify occupancy spaces based on bounding box region overlaps or intersections. A sample implementation of this three-step process is shown in Figure 3 [50].
The YOLOv7 Object Detection architecture has become widely used in ITS solutions. The YOLO model architecture line has undergone developments, resulting in 11 major releases [53]. Each version has sub-releases that are specifically designed to meet the requirements of various hardware and computing systems [54]. In real-time applications, such as vehicle detection and classification in parking management systems, YOLOv7 is preferable due to its highly regarded validated performance in object detection [55]. The input, backbone, and head network comprise its architecture, as shown in Figure 4 [56].
The input network divides an image into a 7x7 grid, generating multiple bounding boxes per grid cell. This grid-based method eliminates the necessity for region proposals, which are necessary for two-stage detectors such as Faster R-CNN. Additionally, it preprocesses images to guarantee consistent data management throughout the model by maintaining uniform dimensions. The CBS composite module, the Effective Layer Aggregation Network module and the MP module are the three primary modules that the backbone network employs to perform feature extraction. By halving the spatial dimensions of the feature map and doubling the number of channels, these modules enhance the network's capacity to represent intricate features. The backbone effectively scales these features to optimize precision without sacrificing efficiency. Output from the backbone is then used as the input of the head network. The head constructs three feature maps of varying proportions. It employs 1x1 convolutions for objects, class prediction, and bounding box prediction tasks. The expanded E-ELAN module and cardinality operations are integrated to improve features' accuracy and representation while optimizing parameter efficiency throughout the model [46,54].
3. Vehicle Profiling for Intelligent Systems
The capability to recognize alphanumeric characters and symbols on license plates is essential to profiling vehicles. For parking management systems, this enables the facility's smart infrastructure to obtain distinctive vehicle identifiers, which are crucial for security, invoicing, and tracking purposes [8,36]. In ITS research, License Plate Recognition is a critical and prominent implementation of machine vision and machine learning [40]. The standard architecture of LPR systems, as referred to in Figure 5, comprises four critical stages: (1) the detection of the license plate, (2) digital isolation of the detected license plate, (3) character recognition, and (4) generating the output string [36].
LPR's initial phase is to direct the system to detect license plates using a variety of machine vision techniques such as object detection and instance segmentation. Aside from object classification, these model architectures generate bounding boxes inferences around detected vehicle license plates. The next phase is to use license plate detection (LPD) inferences to determine which region in the image must be cropped out and which area is retained. The retained region is the license plate where the character recognition task must be performed on [36,40]. During text recognition, characters and symbols within the cropped license plate first undergoes character segmentation. This procedure allows for letters and characters to be seen as individual character objects. This ensures that the system will attempt to perform character recognition on each segmented character within the license plate. Once character recognition has been performed, the expected output of an LPR system is a collection of character texts and symbols that are put together as a string. This data is the resulting profiled vehicle information of the LPR system [36,40]. The variation in license plate designs across different countries is a significant factor in developing LPR systems. This necessitates the training of localized models to manage a variety of formats, symbols, and character types [57,58].
Image and video materials fed to LPR systems must be of high quality to ensure clear and accurate inferences for SPMS [59]. LPR systems must be tailored to the contextual requirements of the country where the system is being implemented or deployed in. For instance, Philippine license plates are visually distinct from other countries based on their design, as shown in Figure 6 [57]. There are four major license plate types in the Philippines, the 1981 series, the 2003 series, the 2014 series, and placeholder license plates that are based on the conduction stickers of vehicles upon purchase. Image datasets for training these models must include Philippine-specific license plate images, with precise annotation and labeling, to guarantee the accuracy and reliability of LPR systems [57,60].
In commercial environments such as parking facilities, distorted images of vehicle license plates are often captured. These plates may be curved, tilted, and warped. Using conventional OCR systems will not suffice as they only perform well on undistorted images. In parking facilities, captured plates are often affected by occlusions, sunlight, weather conditions, and other external factors. These challenges present substantial challenges for machine vision and machine learning models, leading to inaccurate character recognition inferences [59]. Noise distortions are frequently the result of suboptimal conditions that occur when acquiring images or videos [42,61]. Alternative methods, such as Scene Text Recognition, have been devised to circumvent these limitations. STR provides a more resilient approach to text recognition by integrating together sequence prediction and object detection architectures. STR models can accurately read text under noise-filled conditions by using CNN and recurrent neural networks. Deep Text Recognition, an STR architecture, extracts alphanumeric characters from objects found in noise-filled environments [62,63]. DTR uses sequentially ordered techniques: transformation, feature extraction, sequential modeling, and prediction, to guarantee precise measurements in low-quality, high-noise scenarios, as shown in Figure 7 [62].
The transformation stage employs a thin-plate spline, a type of spatial transformation network, to normalize the input image through fiducial point-based alignment. This procedure ensures uniformity in character regions, irrespective of distortions or irregularities in the input. This process improves the precision of subsequent phases by converting the image to a standardized format. A CNN extracts essential character-specific features from the image during the feature extraction stage while suppressing irrelevant features such as font, color, and background. This stage generates a feature map in which each column corresponds to a horizontal section of the image, enabling the precise identification of text features. The extracted features are subsequently reorganized into a sequential format during the sequence modeling stage, preserving contextual relationships between characters. This is accomplished by utilizing bidirectional long short-term memory (BiLSTM) networks, improving the model's capacity to comprehend the sequence's order and relationship between characters. The result is produced in the prediction stage by employing Attention-based Sequence Prediction and Connectionist Temporal Classification (CTC). The attention mechanism dynamically concentrates on specific segments of the sequence to generate a more refined character output, whereas CTC predicts characters based on each feature column, thereby eradicating blanks [62,63].
4. Assessment of Global and Local (Philippines) ITS Research
Traffic control and parking management are the two primary ITS applications [64]. The aim of traffic control research is to reduce congestion through the development and integration of intelligent systems that seek to optimize signal timing and regulate vehicle traffic flow [8,57]. In contrast, SPMS applications differ in system design and implementation. SPMS help optimize space utilization, monitor occupancy, and enable automated vehicle profiling during entry and exit in a parking facility [16,30]. Table 1 provides a comprehensive summary of relevant ITS literature. The ratio of traffic control studies to SPMS studies suggests skewed research efforts towards traffic control topics. In high impact journals, traffic control topics were more abundant. In contrast, parking management studies were predominantly more accessible in conference proceedings, potentially indicating that researchers prioritize traffic control topics for high-impact publications.
The Philippines is a late adopter of emergent technologies, frequently incorporating advancements only after they have matured in more developed countries. This delay is attributed to a lacking readiness to adopt new technologies due to insufficient people and material resources. Technology adoption challenges is evident in the research outputs, which indicate a nation's readiness to implement, develop, and innovate new technologies [73]. The Philippines' current ITS research landscape is characterized by an imbalance, with a substantially more significant emphasis on traffic control than optimizing parking facilities [16,74]. Notably, there are significantly fewer studies that address parking management. Like other countries, there is a preference on developing novel technologies traffic control monitoring applications. While this pursuit is not incorrect, the consequences of neglecting parking management can become pronounced, as inefficient parking strategies in parking facilities directly contribute to traffic congestion in public roads [3,37]. Optimizing vehicle flow and improving parking administration are both necessary for successfully mitigating traffic. Transport planners can potentially lessen the number of vehicles that may add to traffic by creating facilities and spaces able to efficiently service them when drivers wish to park their vehicles. Choosing to only increase parking spaces is regarded as an unviable and non-sustainable solution [3].
The literature review highlights a key finding: most ITS research is conducted outside the Philippines. Although developing ITS solutions is a global endeavor, not all international implementations can be implemented in various countries. Effective ITS implementation necessitates localized adaptations, which is achieved by fine-tuning model architectures using country-specific datasets. To optimize intelligent applications for local conditions, datasets must accurately reflect the unique road infrastructure, vehicle classifications, and license plate formats [71,75]. While it is possible to use pre-trained public models trained using international datasets, their ability to identify country-specific vehicle and plate characteristics remains uncertain. The scarcity of Philippine-based studies in comparison to global research further emphasizes the necessity of specialized, localized research, particularly in smart parking management systems [57,76].
5. Building Information Management and Digital Twins
DT research has been an emerging trend in recent years. CPS-based technology has gained prominence in various fields, especially in computer science and engineering applications that model built environments. Across several studies, DT models exhibit varying features and modeling complexities [77,78]. However, there are common baselines. Figure 8 shows a framework for designing and developing digital twins [78].
Figure 4.
Digital twin design and development framework. DT serves as a virtual replica of a real-world system, with the physical and digital models synchronized through a continuous data flow. A "twinning mechanism" ensures that real-time updates are reflected between the digital model and the physical system [78].
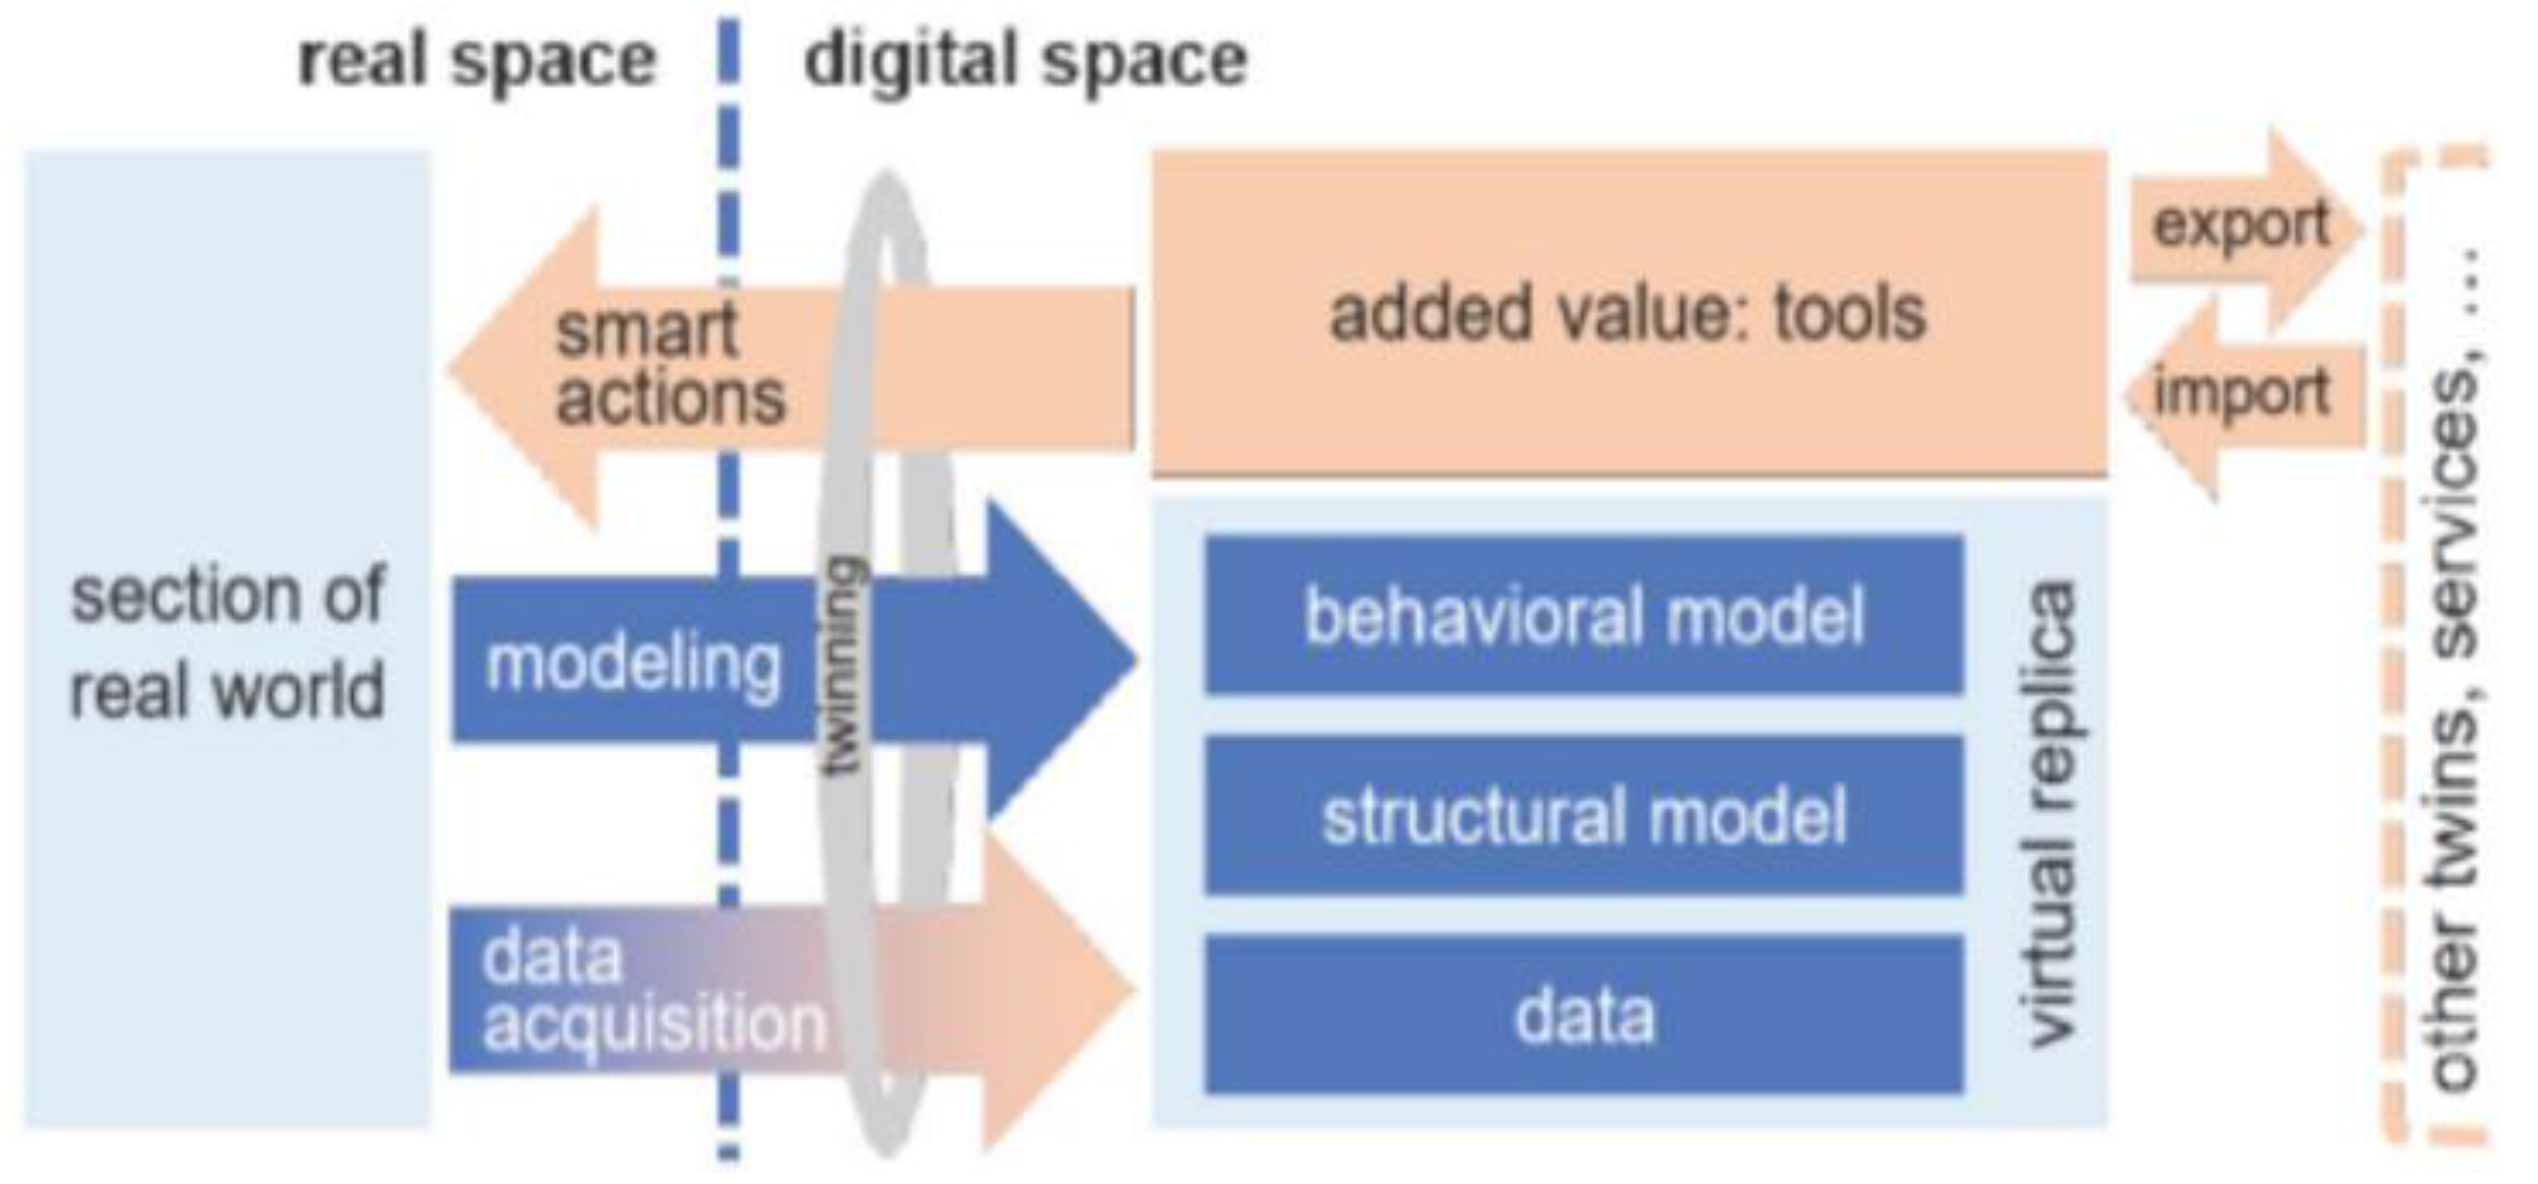
A DT is a model system representation located in the digital space. It reflects the real-world section or the physical system of interest. To produce a dynamic model of the physical system in the digital space, a twinning mechanism is needed to keep both spaces in sync with one another. The virtual twin commonly includes behavioral and structural dynamic CAD models. Analysis, forecasting, and optimization are made possible by constantly updating these models’ using information from the real world [78,79].
The four DT categories are as follows: (1) Component Digital Twins (C-DT), which model individual machine parts or sensors to improve their performance and maintenance; (2) Asset or Machine Digital Twins (AM-DT), which offer a digital representation of entire machines or equipment, allowing for improvements in operational efficiency and predictive maintenance; (3) System or Plant Digital Twins (SP-DT), which simulate a network of interconnected assets that are not limited to a factory production line; and (4) Enterprise-wide Digital Twins (EW-DT), which are high-level organizational models intended to provide end-to-end visibility into operational metrics, resource allocation, and overall business performance. EW-DTs combine many digital and physical processes, offering a thorough business intelligence framework for data-driven decision-making [80].
A 3D BIM-based SPMS is an EW-DT based on functional design behavior. The BIM unifies several process metrics into a single, interactive platform, including vehicle movement analysis, occupancy tracking, and facility-wide performance indicators. The solution provides facility managers with a comprehensive operational picture through integrating data analytics with a 3D model. This enables managers to formulate and enforce policy compliance, simulate alternative management techniques, and maximize parking space use. Parking management practices have shifted from a passive monitoring approach to a more proactive decision-making framework due to this end-to-end visibility, thereby guaranteeing improved facility operations through efficient remote monitoring [30,79].
Designing, developing, and integrating EW-DT technology into SPMSs have been the subject of numerous research endeavors to resolve the inefficiencies of conventional parking strategies. Despite numerous parking facilities already relying on a variety of equipment hardware to report the availability of parking spaces, these systems often provide shallow data analytics [2,81]. DT technology facilitates better understanding collected data. DT models reflect real-time events in parking facilities and provide the avenue of simulating a specific set of proposed actions based on calculated facility metrics. Comprehensive insights into optimizing traffic flow, demand forecasting, and optimizing space utilization can be acquired. Facility managers can exploit the advantages of automated data pipelines that provide a more comprehensive understanding of parking activity patterns to facilitate strategic decision-making and predictive analysis [44,82].
DT models have the potential to enhance the user experience for drivers by customizing data presentations, enabling them to locate available spaces through displays swiftly. The operational efficiency of parking facilities and users' convenience are improved by integrating advanced analytics and smart infrastructure [29,30]. The visual representation of a digital parking facility twin model is a critical design factor to consider. The intuitive clarity that visual models may offer is absent from KPI or key performance indicator-based DT data dashboard [78]. Facilities managers may encounter difficulty interpreting data dashboards, particularly in high-pressure situations where prompt decision-making is essential to resolve problems and issues. The likelihood of misinterpretation is elevated when only a single form of data representation is employed [81]. Fortunately, risk minimization stemming from misinterpretation can be achieved by pursuing a balanced approach of creating DT models that incorporate visual representations and data analytics. Data dashboards can be coupled with either a 2D or 3D model of the parking facility showing parking occupancy and the location of cruising vehicles in no-park zones. Such a representation method provides a more exhaustive comprehension of the parking facility's status. Facility managers can make more informed decisions and better contextualize the data by associating critical metrics with a visual 2D or 3D model [30,79].
A clear and concise overview of available parking spaces is provided by 2D digital twin models with representation of parking occupancy and facility layout. This prevents users or facility administrators from being overwhelmed by excessive detail. For less complex parking systems, this clarity is especially advantageous [29,33]. In contrast, more intricate facilities necessitate a more extensive modeling approach. A 3D BIM approach circumvents around 2D modeling constraints, which is the tendency to oversimplify geometrical and contextual features of an environment or space [30]. During the modeling process, these 3D models accurately replicate the structure and environment of the parking facility by capturing intricate details using scanning technologies, such as laser scanning, LiDAR, and point cloud data [30,83]. The BIM workflow employs these generated 3D models stored within BIM software that utilizes a programmable twinning mechanism [84]. This mechanism integrates information with the data processed within the SPMS's backend data warehouse. It updates the model regularly to account for any new developments [30,85]. Facility administrators can improve their comprehension of operations and devise more effective management strategies by visualizing the layout, real-time parking events, and traffic patterns of key performance indicators in their supplementary data dashboards through a dynamic 3D digital twin [79].
6. System Design Architecture
This study demonstrated the design, development, and testing of a smart parking management system. The system is developed in a nonreal-time setting and serves as a proof-of-concept for integrating DT technology into smart parking management systems. The primary system design components included the construction of three critical modules: (1) the intelligent inference module (I2M), (2) the storage module (SM), and (3) the digital twin module (DTM). The system's machine learning and inference processing are managed by the I2M. The SM oversees data transmission, primarily consisting of raw and processed data outputs of the I2M Module. Lastly, the DTM retrieves data from the SM and transmits it to a 3D digital twin model through Autodesk Revit, a BIM modeling software. The parking facility's condition is characterized by quantitative metrics, supplemented by chart diagrams for data visualization in a separate software platform.
6.1. The Intelligent Inference Module
The I2M, shown in Figure 9, facilitates two primary tasks: parking occupancy determination (POD) and vehicle profiling. The YOLOv7 object detection architecture was used for vehicle object detection, whereas for license plate recognition, YOLOv7 and deep text recognition were used for license plate detection and character recognition subtasks, respectively. The POD algorithm uses object detection to automate the determination of parking occupancy changes across different video frames. This algorithm involves two Coordinates of Interest (COI): the predefined center coordinate of each parking slot (, ) and the center of the bounding box of each detected vehicle (, ). Equation (1) defines the Euclidean Pixel Distance or EPD between these coordinates. The primary metric for evaluating parking occupancy is through the system calculation of distance, which determines the detected vehicle’s proximity to a predefined parking slot center. After the EPD for all detected vehicles is computed, the results are organized into a . Here, represents the total number of parking spaces (seven in this instance), and represents the number of detected vehicles. Denoted as , each element in this matrix represents the pixel distance between the center of a specific parking slot and a detected vehicle, as formally defined in Equation (3).
The system employs the Python NumPy module to implement a thresholding process to the , thereby determining whether a detected vehicle (indexed as ) occupies a specific parking slot (indexed as ). A threshold value, , is created and set to 1, indicating occupancy if the pixel distance is 80 pixels or less. Otherwise, it remains zero, as defined in the piecewise function in Equation (4). The is subsequently defined in Equation (5), which is composed of multiple values. This matrix filters out vehicles too far from a parking slot to be considered occupants. After thresholding, the is flattened into a one-dimensional Occupancy or . Each element , as defined in Equation (6), represents the occupancy status of a parking slot: a Boolean value of 1 if occupied, and 0 if vacant. This array provides a direct, simplified representation of the parking lot's real-time status.
The system maintains a to monitor changes over time. The is initialized as an exact copy of the if the current frame is the first processed frame. The system updates the for all subsequent frames by subtracting the from the previous frame's CS Checker values, as shown in Equation (7). The array values, Equation (8), can assume three states: 0 if the parking slot's status remains unchanged, -1 if a previously occupied slot is now unoccupied, and one if an empty slot has recently been occupied. The system proceeds to evaluate the values of the to determine which parking locations have undergone state changes after it has been updated. The system updates the parking occupancy records by communicating with the database if any modifications are detected. No data transmission occurs if no changes are observed. This algorithm is repeated on a loop, dynamically iterating through each phase and returning to vehicle detection in the subsequent frame. The algorithm guarantees precise, real-time monitoring of parking availability by consistently monitoring changes in occupancy states across video frames. The vehicle detection-based POD algorithm is summarized in Table 2. This algorithm accounts for seven parking spaces, from parking spaces #1 to #7.
For the algorithm for determining the state of parking occupancy based on LPR inferences, modifications to the previous algorithm, particularly the classification of detected objects and the number of parking spaces constrained to two slots: parking spaces #8 and #9, were adopted. The algorithm is shown in Table 3.
6.2. The Storage Module
The storage module operates on a SQL-based relational database framework. The module uses SQLite3 Studio to manage the database and establishes connections with different SPMS modules through the SQLite3 Python Module. The first database records parking activity using vehicle detection-based POD, the second database manages LPR-based POD with vehicle profiling, and the third database monitors vehicle entry and exit at access points through LPR. These databases support distinct system features. The first database, whose data schema is provided in Figure 10-(a), organizes live occupancy data in the pklot_overview table by automating value assignments using SQLite3's generated expressions. Whether a space is 'occupied' (1) or 'vacant' (0) is determined by a Boolean occupancy_state attribute. Supplementary tables (pklot_1 to pklot_7) record the timestamps of each parking event, with park_start being recorded upon entry and park_end being amended upon exit. The park_duration in hours is calculated using integer-converted timestamps and stored as a float with two decimal places, with a unique occurrence_index serving as the primary key (PK). The Python library of SQLite3 enables database interactions by executing SQL queries within Python programs.
The next database, similar in structure with the previous database, incorporates occupancy data with LPR-based vehicle profiling data through an added LPR_reading attribute. In the pklot_overview table, primary keys represent designated parking slots, ensuring each row displays the latest occupancy state and profiling information. Figure 10-(b), shows pklot_overview and pklot_n tables automatically using the built-in function feature of SQLite3 Studio for Generated Values (GV) to refresh the occupancy_text and parking_duration attributes based on the occupancy status attribute’s value. The Mirroring Value (MV) mechanism copies the most recent LPR readings from pklot_8 and pklot_9 into pklot_overview, thus maintaining synchronization of occupancy and profiling data. When a slot is vacant, the license_plate is assigned a null value, and the occupancy_state is reset to 0.
The third database, Figure 11, has three tables that house vehicle entry and exit data: the vehicle_flow_timestamp_log table documents entry and exit times, parking duration, and billing information. To ensure data organization, the tables 进_car_record (table for entry records) and 出_car_record (table for exit records) contain LPR readings, timestamps, reading scores, and image file paths linked to the main table through foreign keys (FKs).
The database management process relies on the outputs of the LPR feature of the smart parking management system. Upon entry, the system captures an LPR reading and creates a record in 进_car_record, with the timestamp stored as an MV in the vehicle_flow_timestamp_log table. Upon exit, a new record is added to 出_car_record, and the system correlates it with the latest entry in 进_car_record. The exit timestamp is subsequently reflected in vehicle_flow_timestamp_log, establishing a connection between both records through foreign keys, denoting a complete vehicle entry-exit cycle. SQLite3's GV feature automates the calculation of parking duration and billing through timestamps. Integrating MV and GV enhances data management by removing the necessity for manual record searches in bill generation. Table 4 presents the sequential algorithm for LPR and database updates within the third system feature.
6.3. The Digital Twin Module
Two design phases are involved in developing the DTM as shwon in Figure 12. The initial phase consists of preparing and collecting the materials required to construct a 3D model for the first and second system features. The next phase starts after the static 3D model in Autodesk Revit. The primary objective of the second phase is to integrate the twinning mechanism feature of Autodesk Revit with components from the I2M and the Storage Module. The model will become dynamic upon the completion of this integration, allowing it to reflect changes in parking occupancy and serve as a digital counterpart of the parking facility. A data dashboard is created better to understand the parking facility's resource utilization condition.
In phase 1 of developing the DTM, a 3D LiDAR scan of a parking facility was conducted utilizing Polycam on an iPhone 14 Pro device. The point cloud data, shown in Figure 13, illustrates the facility's vehicular flow, encompassing entry and exit roadways, a two-way driveway, and designated loading and unloading areas. The facility can accommodate 30 four-wheeled vehicles.
The scanned data was exported as a .pts file, processed in Autodesk Recap Pro, and converted to .rcp format for import into Autodesk Revit. In Revit, 3D toposolid components, including walls, columns, parking curbs, and spaces, were aligned with the geometries of the point cloud (Figure 14-(a)). Parking spaces were modeled as Revit family objects, which were then placed onto the toposolid ground surface of the model to facilitate enhanced attribute appearance flexibility for the Revit object (Figure 14-(b)).
A 3D Revit object of a Land Rover SUV from [86] was placed into each parking space. The parked_car graphic attribute controls vehicle visibility. The vehicle is displayed when assigned a True value, indicating an occupied slot. Conversely, the car is concealed when set to False, signifying a vacant slot. Figure 15-(a) demonstrates the toggling of this attribute, whereas Figure 15-(b) presents a detailed view of the imported Revit SUV objects.
In the final phase of DTM development, Autodesk Revit Dynamo was used to bridge together the I2M and DTM. An Excel File, managed through the Python openpyxl library, toggles cell AI between a True and False to reflect POD algorithm occupancy updates. Revit Dynamo receives the toggle state changes and processes it through block functions. Figure 16 shows the overview process of processing vehicle data for the first seven slots.
Figure 17 delineates the method for processing LPR-based POD data for parking slots #8 and #9 through Revit Dynamo. The pink node group filters out non-parking elements, obtains occupancy data from the Excel file and the pklot_overview table from the database, and uses an IronPython script to extract Boolean updates from cell A1. The output comprises two arrays: the first array includes occupancy states ("occupied" or "vacant"), and the second array contains Revit object IDs corresponding to each parking space. The green node groups denote distinct parking spaces and are provided with two inputs: the Revit object ID and the occupancy state. The Element.SetParameterByName node modifies the parked_car parameter of the parking space Revit family object according to the occupancy status. When a space is occupied, the parameter is assigned a value of True, resulting in the visibility of the Land Rover SUV object within the parking space. Conversely, if the space is unoccupied, the vehicle remains concealed. This configuration enables the digital twin to represent changes in parking occupancy within the facility.
Various system metrics are used to gauge the state of the parking facility at a given period. Data was pulled from the SQLite Database using Microsoft Excel’s built-in ODBC API. Metrics are computed using custom-built excel functions, and certain metrics were supplemented with visual charts. Below are a list of metrics used describing the state of parking occupancy for the DTM’s data dashboard component.
6.3.1. Individual and Gross Revenue from Parking Fare Matrix
The parking fee applies a minimum charge of PHP 50.00, with an hourly charge of PHP 20.00. Hourly fees are will start to be applied for parking durations exceeding three hours (10,800 seconds) as shown in Equation (9), where represents the parking time duration of a vehicle in seconds.
The system generates gross profit reports for specified periods, summarizing all collected parking fees. The total revenue is calculated using Equation (10).
6.3.2. Parking Occupancy Duration of Each Parking Space
Equation (11), the parking occupancy duration, measures the time between a vehicle’s entry and exit. The average duration, which is the mean of all occupancy durations across different cars occupying a parking space, is determined by Equation (12). A box plot can visually represent the average parking duration per space, emphasizing both typical durations and any unusually lengthy stays as outliers.
6.3.3. Parking Occupancy Rate
The parking occupancy rate is used to evaluate the facility efficiency through parking space utilization, which, as defined in Equation (13), is the ratio of the parking duration available for a single space to the total occupancy duration of parked vehicles. In this context, denotes the occupancy duration for parking lot index h, while is a binary variable that indicates whether parking lot h is occupied. In Equation (14), the variable can accept only two values. The observed duration for slot h is denoted by the variable . Equation (15), the facility's overall occupancy rate, is the ratio of the cumulative parking duration to the total occupancy duration of all parking spaces.
6.3.4. Parking Turnover Rate
The Parking Turnover Rate quantifies the frequency with which parking spaces transition from occupied to vacant states within a predetermined time frame. It may or may not be desirable to have parking spaces left vacant for protracted periods, depending on the purpose of the facility. In an ideal scenario, a vehicle should promptly occupy the space that a vehicle has vacated. Effective space utilization, reduced congestion, and improved parking management efficiency may be indicative of a high turnover rate. Nevertheless, it may also indicate an excessive demand for parking, which can result in heightened traffic congestion as vehicles attempt to locate available spaces. In contrast, a low turnover rate may be more advantageous in long-term parking scenarios, as it can indicate reduced congestion and stability for vehicle owners, who are guaranteed a parking space without the need to conduct an exhaustive search. The individual turnover rate is the ratio of the frequency of vehicle turnover to the total observation time, as delineated in Equation (16). The sum of all individual turnover rates is the overall turnover rate, as defined in Equation (17). Lastly, Equation (18) determines the average turnover rate by dividing the overall turnover rate by the total number of observed parking spaces.
6.3.5. Peak Occupancy Periods
Peak occupancy period graphs offer a visually intuitive method of interpreting parking trends over time. A high y-value at a given timestamp indicates a higher occupancy rates, while lower values suggest greater availability. The graph’s peak corresponds to the time of highest occupancy, indicative of periods of peak demand for facility resources.
6.3.6. Dwell Time Distributions
Parking dwell time distributions provide insights into vehicle occupancy patterns within a parking facility. In this type of graph, the x-axis depicts specific parking durations, while the height of each column denotes the frequency or quantity of vehicles parked within those time frames. This distribution emphasizes typical parking durations, enabling the identification of peak usage periods and the overall utilization of parking spaces. Parking managers can acquire valuable insights into user behavior by examining dwell time distributions. This information can inform strategies for optimizing space allocation and enhancing the efficiency of parking facility management operations.
7. Materials, Methods, and the Study Environment
This section is dedicated to discussing the physical implementation of hardware components of the developed smart parking management system. The hardware configuration of the system, with a particular focus on camera positioning and setup, and the methods employed for dataset acquisition to facilitate model training are among the most significant topics of discussion. Furthermore, the section explores the methodology for dataset processing, model training, and selecting the best models for integration into the previously discussed intelligent inference module. A summary of expenses incurred for the implementation of this study is outlined in Table 5. The study amounted to PHP 200,000.93 or 3341.84 USD (1.00 USD=58.10 PHP as of February 2025).
7.1. Hardware Design Considerations
Security cameras are installed at critical points throughout the building complex to facilitate various system functions. As shown in Figure 18, each of the four cameras is represented through a color-coded node, with each color being a cluster of a specific system feature of the I2M. A green node indicates a ceiling-mounted fish-eyed-lens CCTV camera responsible for monitoring the parking spaces, supporting the first system feature. The blue node is for a fixed bullet turret CCTV camera positioned at a height of 1.2 meters from the ground. The camera's field of view is restricted to two parking spaces, angled to capture the license plate of parked vehicles for the second system feature. The PTZ cameras, for the third system feature, are installed at entry and exit points at a height of 1.7m from the ground to record vehicle movement.
7.2. Dataset Collection and Processing
A trained object detection model was created for vehicle detection as a requirement of the I2M's vehicle detection-based POD algorithm. The dataset was retrieved from fisheye camera footage in the parking facility, extracting one frame every 60 seconds from 44 hours of 1080p video, resulting in 2,326 images. Roboflow, a web-based annotation platform, was used to annotate all four-wheeled motor vehicles and label them as “cars”. Table 6 outlines the Roboflow image augmentations used to enhance dataset quality and increase its size to 4998. The dataset followed an 80-10-10 train-validation-test split partitioning for model training purposes.
Two datasets were used to train this study's LPD model, which is used to enable LPR-based POD monitoring of the system. The De La Salle University’s Intelligent Systems Laboratory (DLSU ISL) Research Unit provided the annotated CATCH-ALL dataset, containing 3,212 images [57]. Figure 21 shows a sample dataset image.
A second dataset was generated from the sampled frames captured by security cameras near the building's entrance and exit driveways. To capture a variety of illumination conditions, frames were selected from 12 hours of 1080p footage, which included daytime, afternoon, nighttime, and post-midnight images. A custom dataset of 676 images was generated by capturing fifteen frames for each vehicle that entered and exited. To increase variability, Roboflow was used to perform image augmentations on both the CATCH-ALL and the custom LPD datasets, expanding the datasets to 6,886 and 1,448 images, respectively. Single-class labeling was implemented in the custom dataset, with all license plate annotations being tagged as 'license_plate.' Training, validation, and testing were conducted using an 80-10-10 split. The image augmentations used are shown in Table 7. Additionally, the DTR model was trained using the CATCH-ALL dataset in CVAT [36].
7.3. Model Training and Evaluation Methods
A Windows 11 OS-based local machine device was used to train inference models for vehicle detection, license plate detection, and deep text recognition. In Table 8, the hardware specifications of the machine are specified in detail.
To select the optimal vehicle detection model for integration into the parking management system’s I2M, several YOLOv7 architecture variants were trained, each with different performance trade-offs. Certain architectures prioritize high precision, providing exceptional detection accuracy but with slower inference speeds. In contrast, others offer faster inference at the expense of some accuracy suited for real-time processing needs [54]. The training involved both a base training and fine-tuning process. The base training process refers to a transfer learning approach where the publicly available YOLOv7 pretrained weights (trained using MS COCO) were used as initial weights and trained using the locally procured image datasets. Finetuning is then applied using a different set of training hyperparameters on the same dataset. Decreasing both the learning rate and the number of epochs was observed during the finetuning process. Each YOLOv7 model architecture variant employed specific training hyperparameter sets, as outline in Table 9.
Model fitness, defined in Equation (19), was used to evaluate the trained models suing the mean Average Precision at an IOU threshold of 50% () and from 50% to 95% (). The model with the highest score was selected for system integration to enable the vehicle detection-based POD. is regarded as the primary evaluation metric.
LPD model training was performed in two phases. In phase 1, the CATCH-ALL dataset was used to train a base model through YOLOv7 transfer learning using publicly available YOLOv7 pre-trained weights. Phase 2 refines the base model by using a custom dataset from the parking facility’s surveillance cameras, training on footage exhibiting site-specific factors such as lighting, glare, distance, and resolution in another transfer learning process. The training hyperparameters used in each phase of the LPD model training procedure are listed in Table 10. Similar to the vehicle detection models, the metric was used to assess the LPD model performance.
The training hyperparameters for DTR model training are listed in Table 11. The publicly available DTR pre-trained models (trained from MJSynth and SynthText datasets) were used as initial training weights for transfer learning-based model training. The final model was refined from this base. The main evaluation metric, which is the Character Error Rate (CER), measures character-level errors in substitution, deletion, and insertion. A 0% CER suggests that the recognition is highly accurate.
The training script does not explicitly provide a CER score; instead, it outputs the Euclidean Distance (ED) to assess the performance of newly trained text recognition models [62]. ED measures the geometric distance between the ground truth labels in the test set and predicted text sequences, serving as the accuracy metric. A lower ED score indicates higher accuracy [36,87]. CER, defined in Equation (20), is derived from the CER.
A unified metric is required to quantify the extent to which individual model metrics contribute to the performance and reliability of each I2M feature. The combined overall feature performance of each I2M system feature, as defined in Equation (21), is the product of the primary assessment metrics of each trained model.
8. Results and Discussion
Model performance and the calculated feature performance metric for each I2M feature are presented in this section. The 3D BIM, designed and developed in Autodesk Revit and Dynamo, and the system database contents, and structure are used to analyze the output data extracted from the vehicle detection and LPR-based POD algorithms. The DTM data dashboard component is also presented based on sample processed data from collected footage. Strengths and weakness of each system feature is then assessed.
8.1. Model and System Feature Performances
8.1.1. Vehicle Detection-based POD Feature
The initial system feature uses vehicle detection inference to determine the occupancy state changes of parking spaces. The and metrics, inference speed, and fitness score for each trained YOLOv7 model are presented in Table 12. The YOLOv7-x base vehicle detection model was chosen for system integration as it obtained the highest fitness score of 75.94%, as calculated using Equation (19).
Only one model was used for this system feature. Its performance, evaluated using , reached 94.86%. Sample vehicle detection inferences are provided in Figure 22. These inferences operate under a 50% minimum IOU and confidence threshold.
8.1.2. LPR-based POD Feature
Two LPD and two DTR models were trained. Assessment on the performance metric of LPD models showed that there was significant improvement on training the base model with the custom dataset. Conversely, for the DTR-STR models, the finetuned model showed slightly better accuracy. The metrics are listed in Table 13 below.
The custom-trained LPD model was integrated with the fine-tuned DTR model. Integrating the LPD and STR models into a single inferencing pipeline resulted in a feature performance score of 95.24%. Sample LPD inferences are provided in Figure 23.
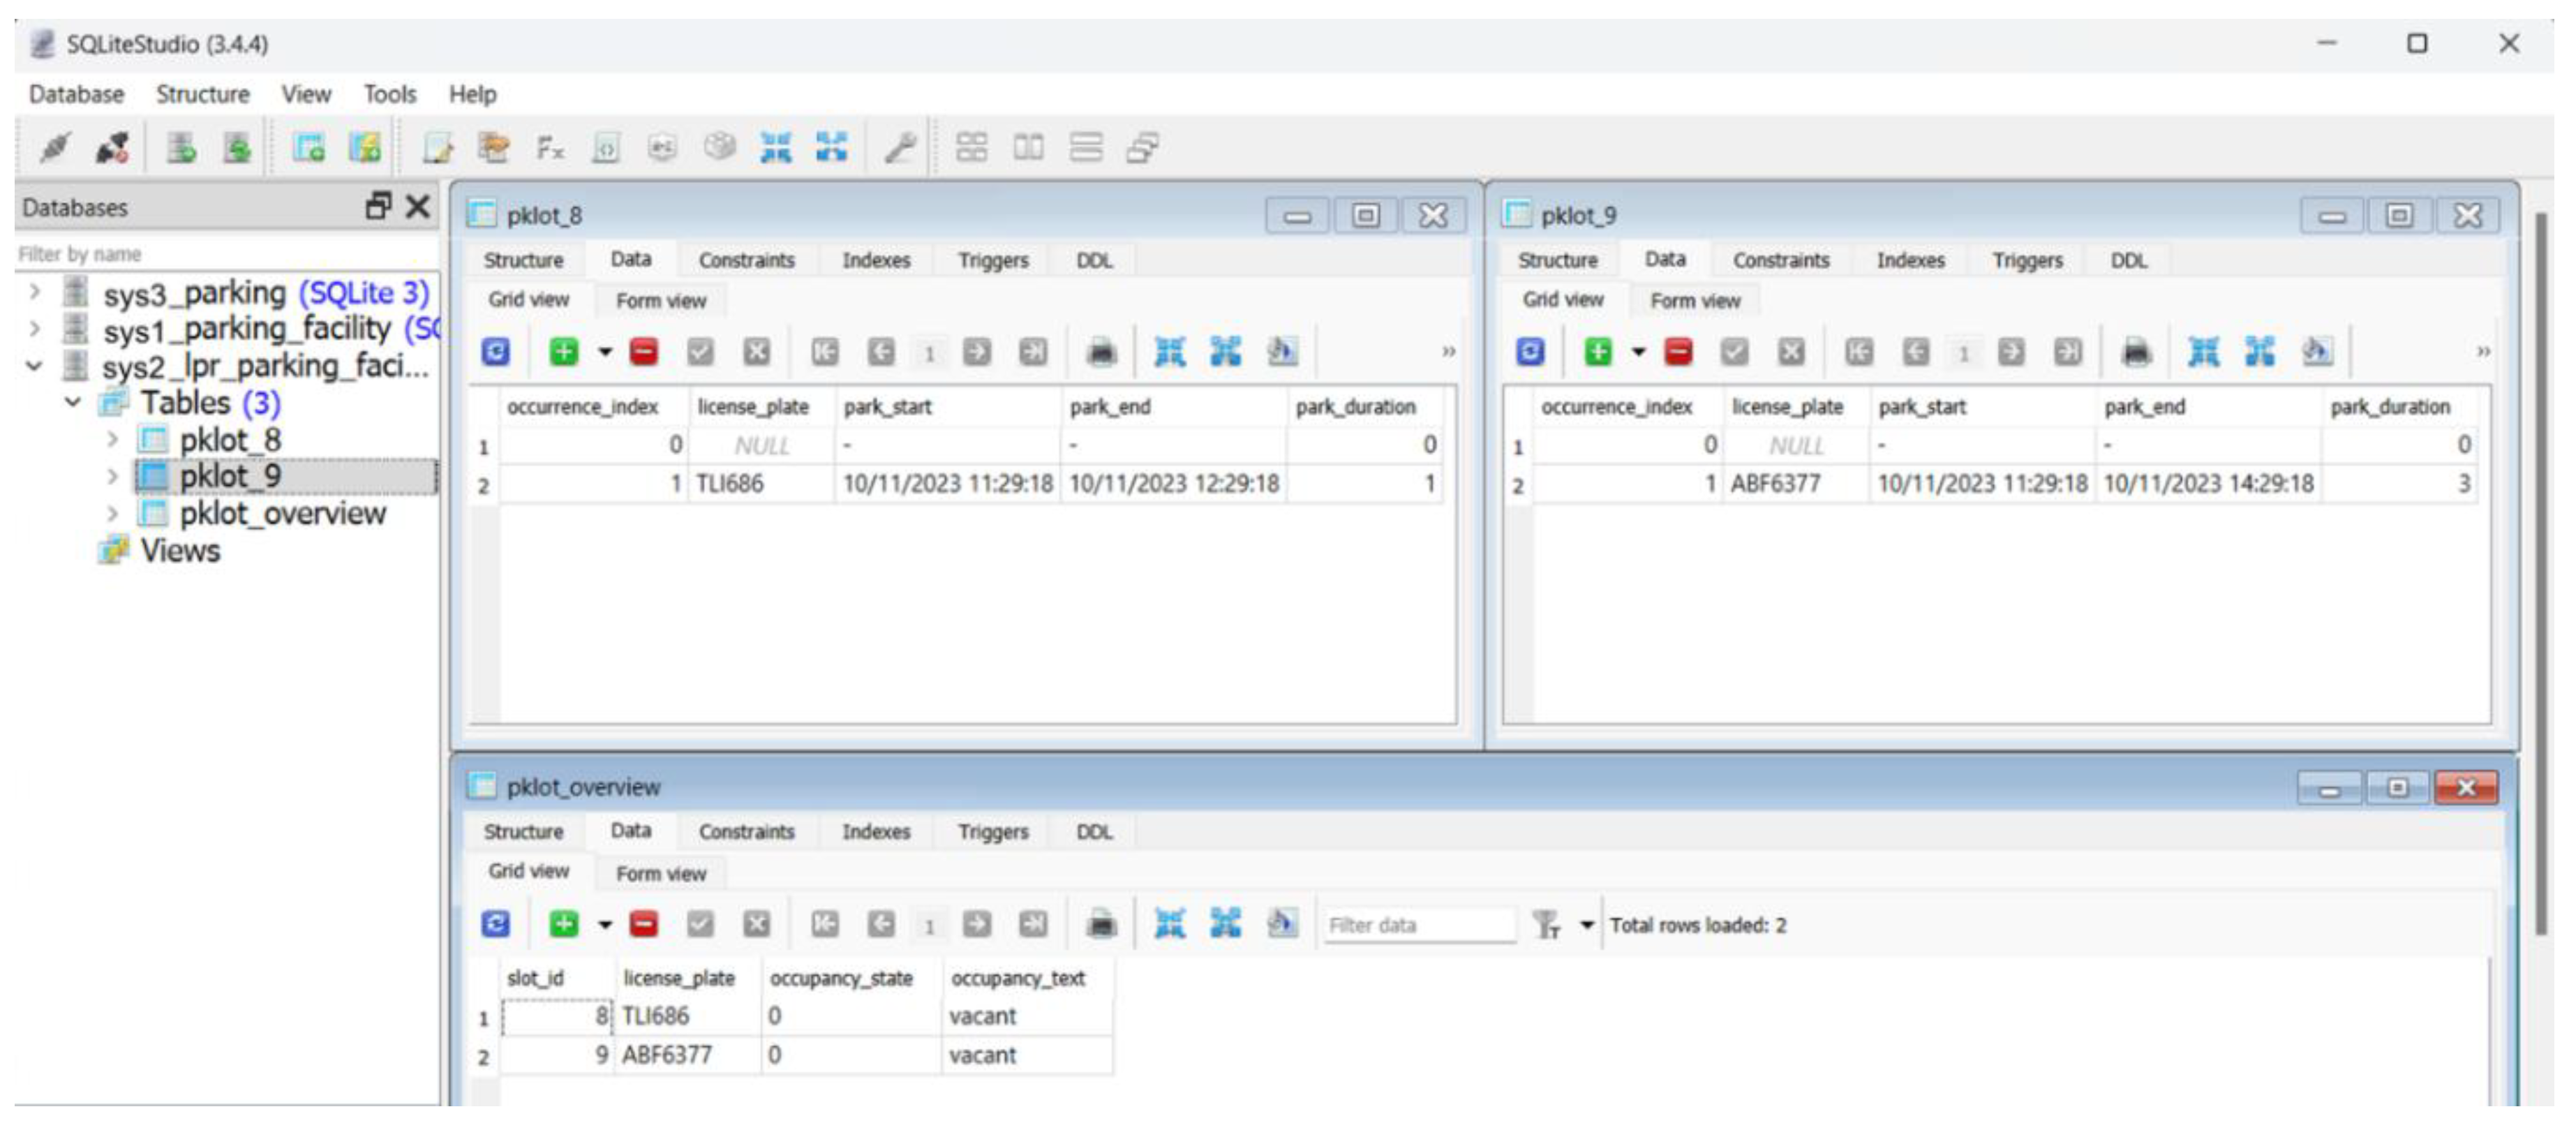
The system shows bounding boxes on detected plates without overlaying predicted text on the image. Instead, results are published into the database, as shown in Figure 24.
8.1.3. LPR-based Facility Entry/Exit Feature
The models used for the second system feature are also implemented in the third system feature. LPD is essential for the localization of license plates of entering and exiting vehicles. Simultaneously, the database stores all LPR inferences. As the models used are the same as the previous system feature, it follows that this system's feature performance metric is also 95.24%. Figure 25 shows sample inferences under different lighting conditions at different times of the day. The model shows consistent performance, effectively detecting license plates in standard and low-light conditions at both driveways.
8.2.3. D BIM Digital Twin Implementation
The POD algorithms from the I2M and connected to the SM comply with a standardized parking space numbering system. Subscribing to this numbering system allows facility managers to refer to the parking slot numbering in the database, obtain information on the occupancy state of parking space resources relative to the slot number, and cross-validate it with the 3D digital twin BIM. Figure 26 provides the standardized parking occupancy designation convention for select parking spaces that this study's developed smart parking management system accounted for.
8.2.1. Vehicle Detection-Based POD Digital Twin
The Revit model is modified constantly using data from the primary feature system's database file. The occupancy_text column of the pklot_overview table is retrieved by Autodesk Revit Dynamo, which then processes the data to represent vehicles located in spaces monitored by the system. The visualization promptly reflects the database's overview display that all seven parking spaces are occupied, as demonstrated in Figure 27. Figure 29 shows the system's response to varying occupancy levels where other spaces are vacant.
8.2.2. LPR-based POD Digital Twin
Data from the database associated with the second feature can also be used to update the DT model. Similar to the initial system, Dynamo processes data from the occupancy_text column of the pklot_overview table to show the vehicles parked in locations that are monitored and accounted for by the LPR component of the feature system. The digital twin BIM reflects the database's indication that two parking spaces are occupied, as shown in Figure 28. Examples of alternative scenarios are illustrated in Figure 30.
8.3. Database Model Implementation
The pklot_overview table in the database is the sole table that is continuously overwritten to provide the most recent occupancy status of the presently processed video in both POD algorithm-driven system features. New data entries are appended to all other pklot_n tables, and no deletions or overwrites occur. Figure 31 displays snapshots of the database contents for the LPR-based POD algorithm system, as viewed through SQLiteStudio. Across all POD systems, an entry is generated for each vehicle iteration entering and exiting a parking space. This entry includes the index ID, the entries and exits timestamps, the parking duration in hours, and the LPR reading (for the vehicle detection-based POD system, no LPR reading is included in the database). The pklot_overview table summarizes the current occupancy status by reflecting the most recent row entry from each pklot_n table. The parking space is considered occupied if the park_end column of the most recent entry in the pklot_n table contains a NULL value. Otherwise, the parking space is declared vacant if park_end is not null.
Figure 9.
Window Tiled View of Database, 3D BIM Digital Twin Revit Model, and the Video Outputted by the Vehicle Detection-based POD Feature Inferencing System during Program Execution.
Figure 9.
Window Tiled View of Database, 3D BIM Digital Twin Revit Model, and the Video Outputted by the Vehicle Detection-based POD Feature Inferencing System during Program Execution.
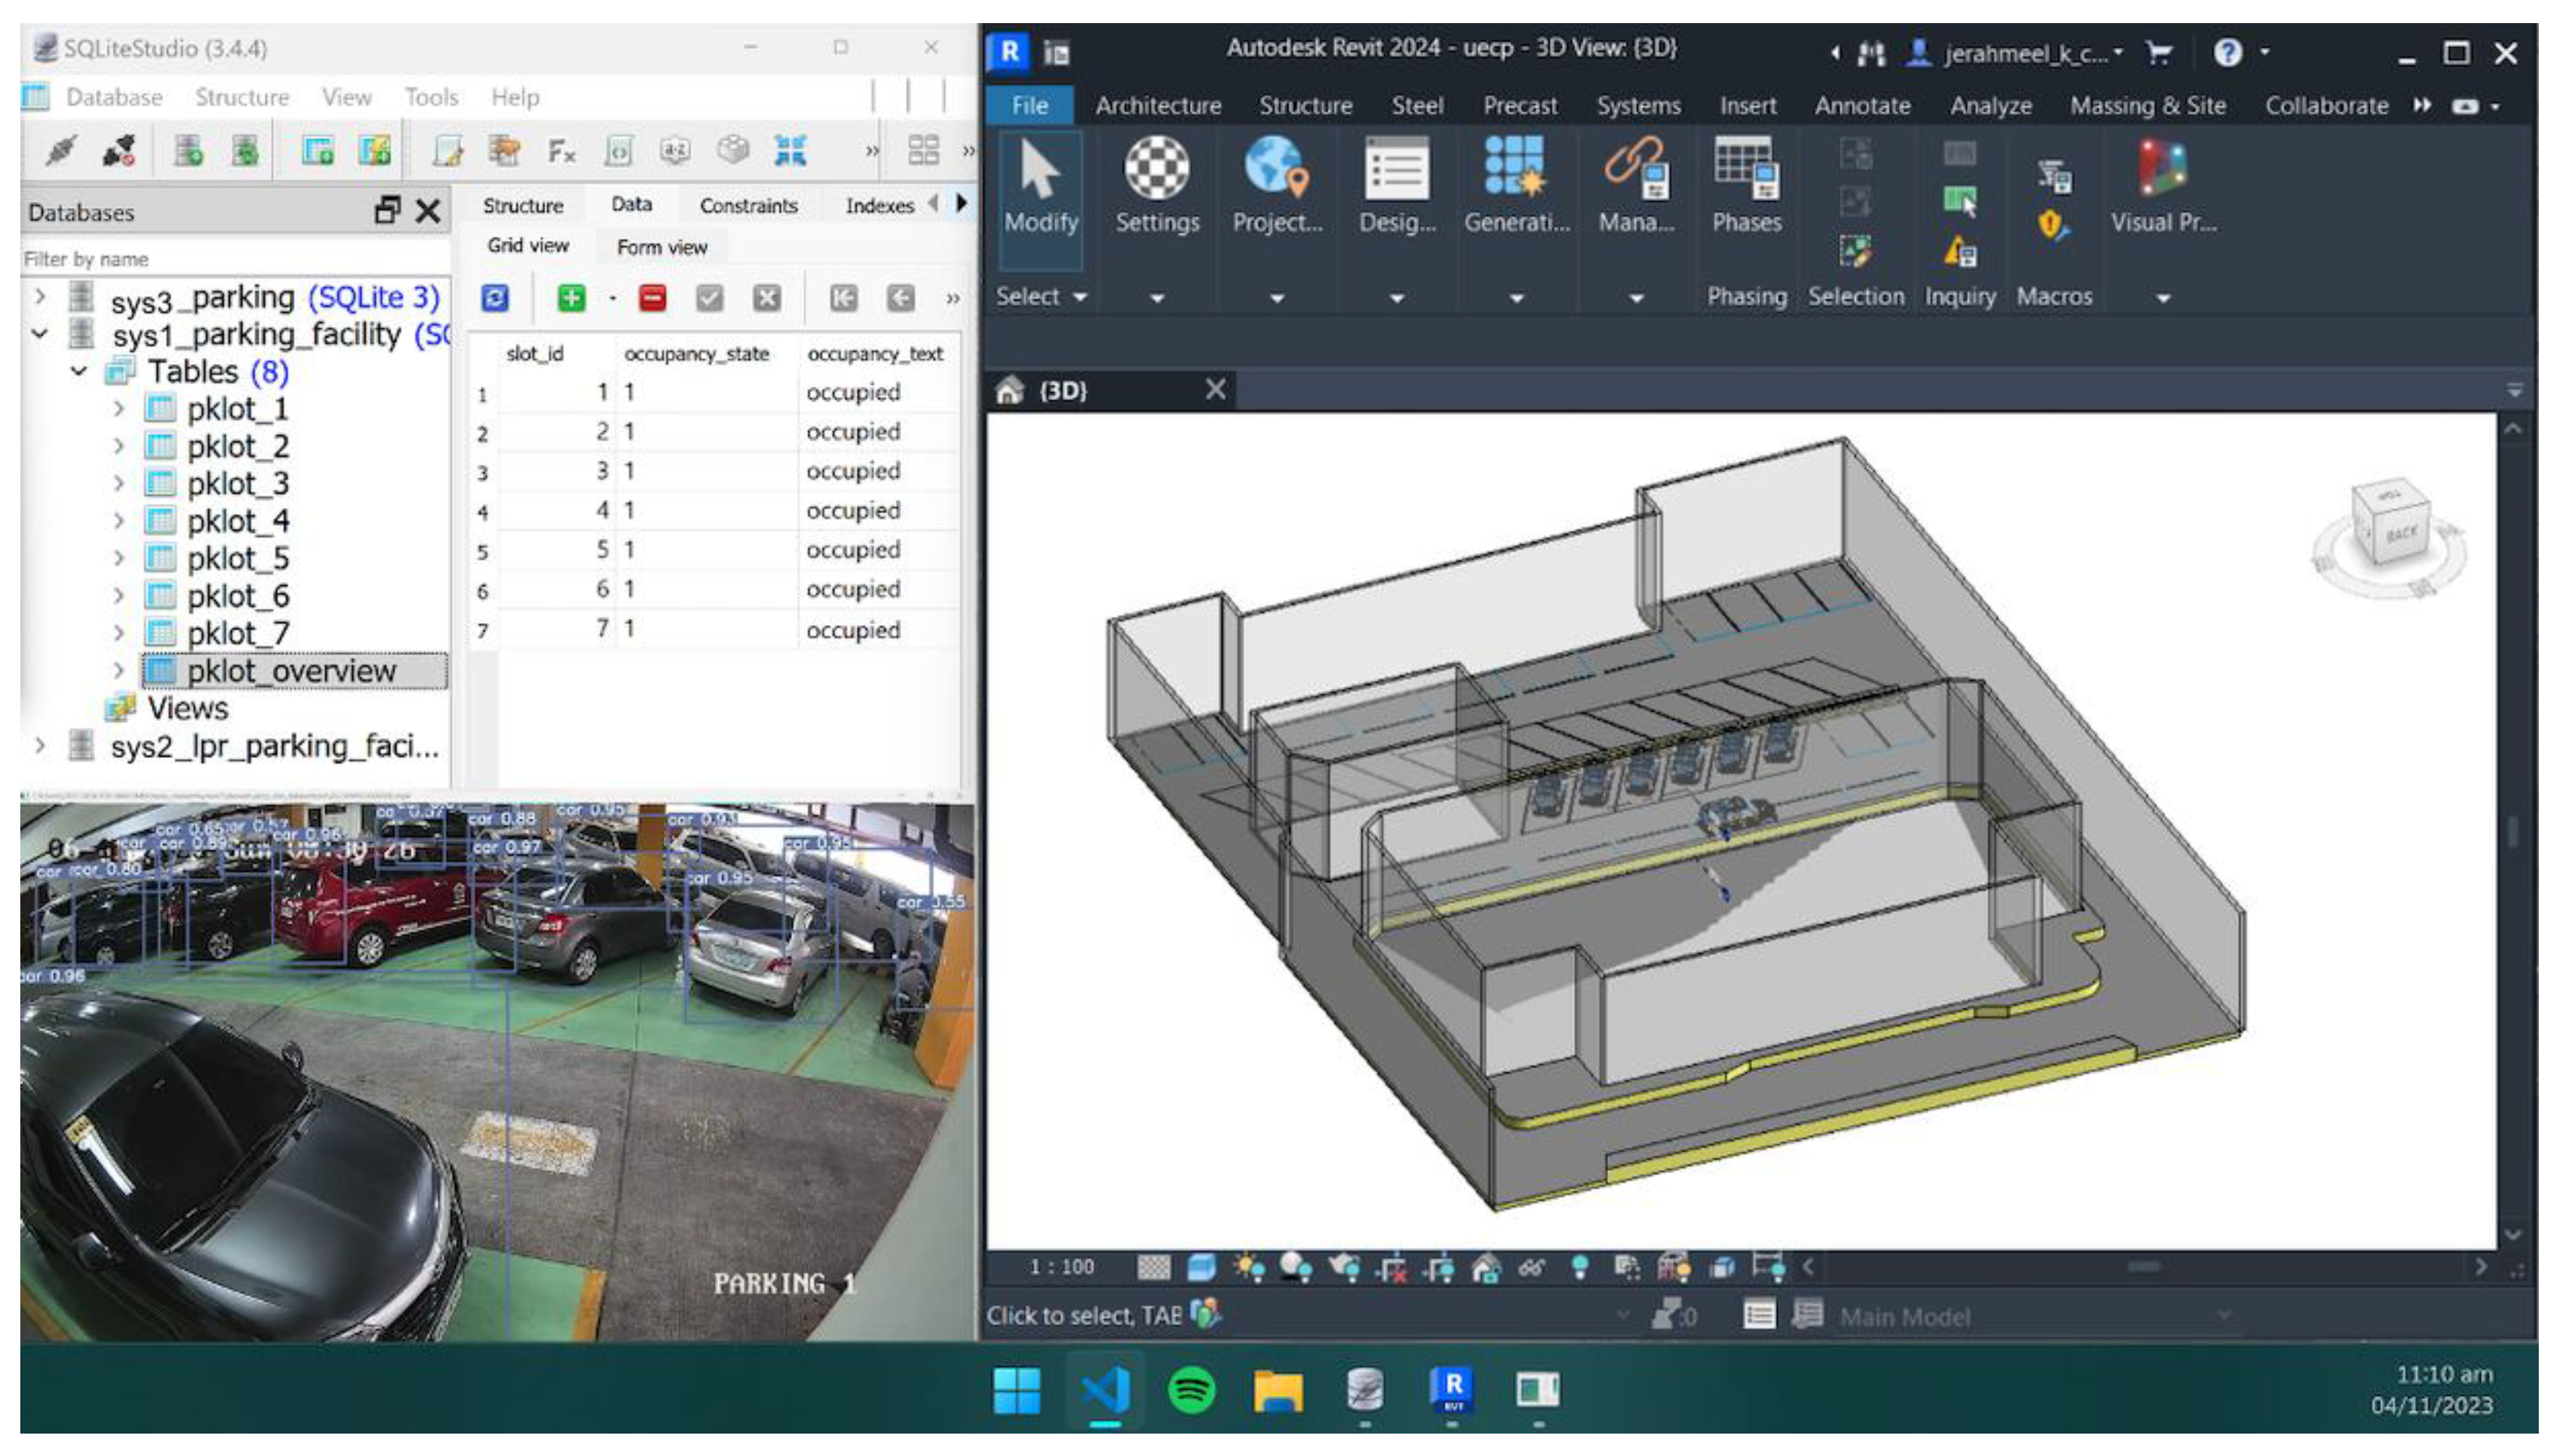
Figure 28.
Tiled View of Database, 3D BIM Digital Twin Revit Model, and the Video Outputted by the LPR-based POD Feature Inferencing System during Program Execution.
Figure 28.
Tiled View of Database, 3D BIM Digital Twin Revit Model, and the Video Outputted by the LPR-based POD Feature Inferencing System during Program Execution.
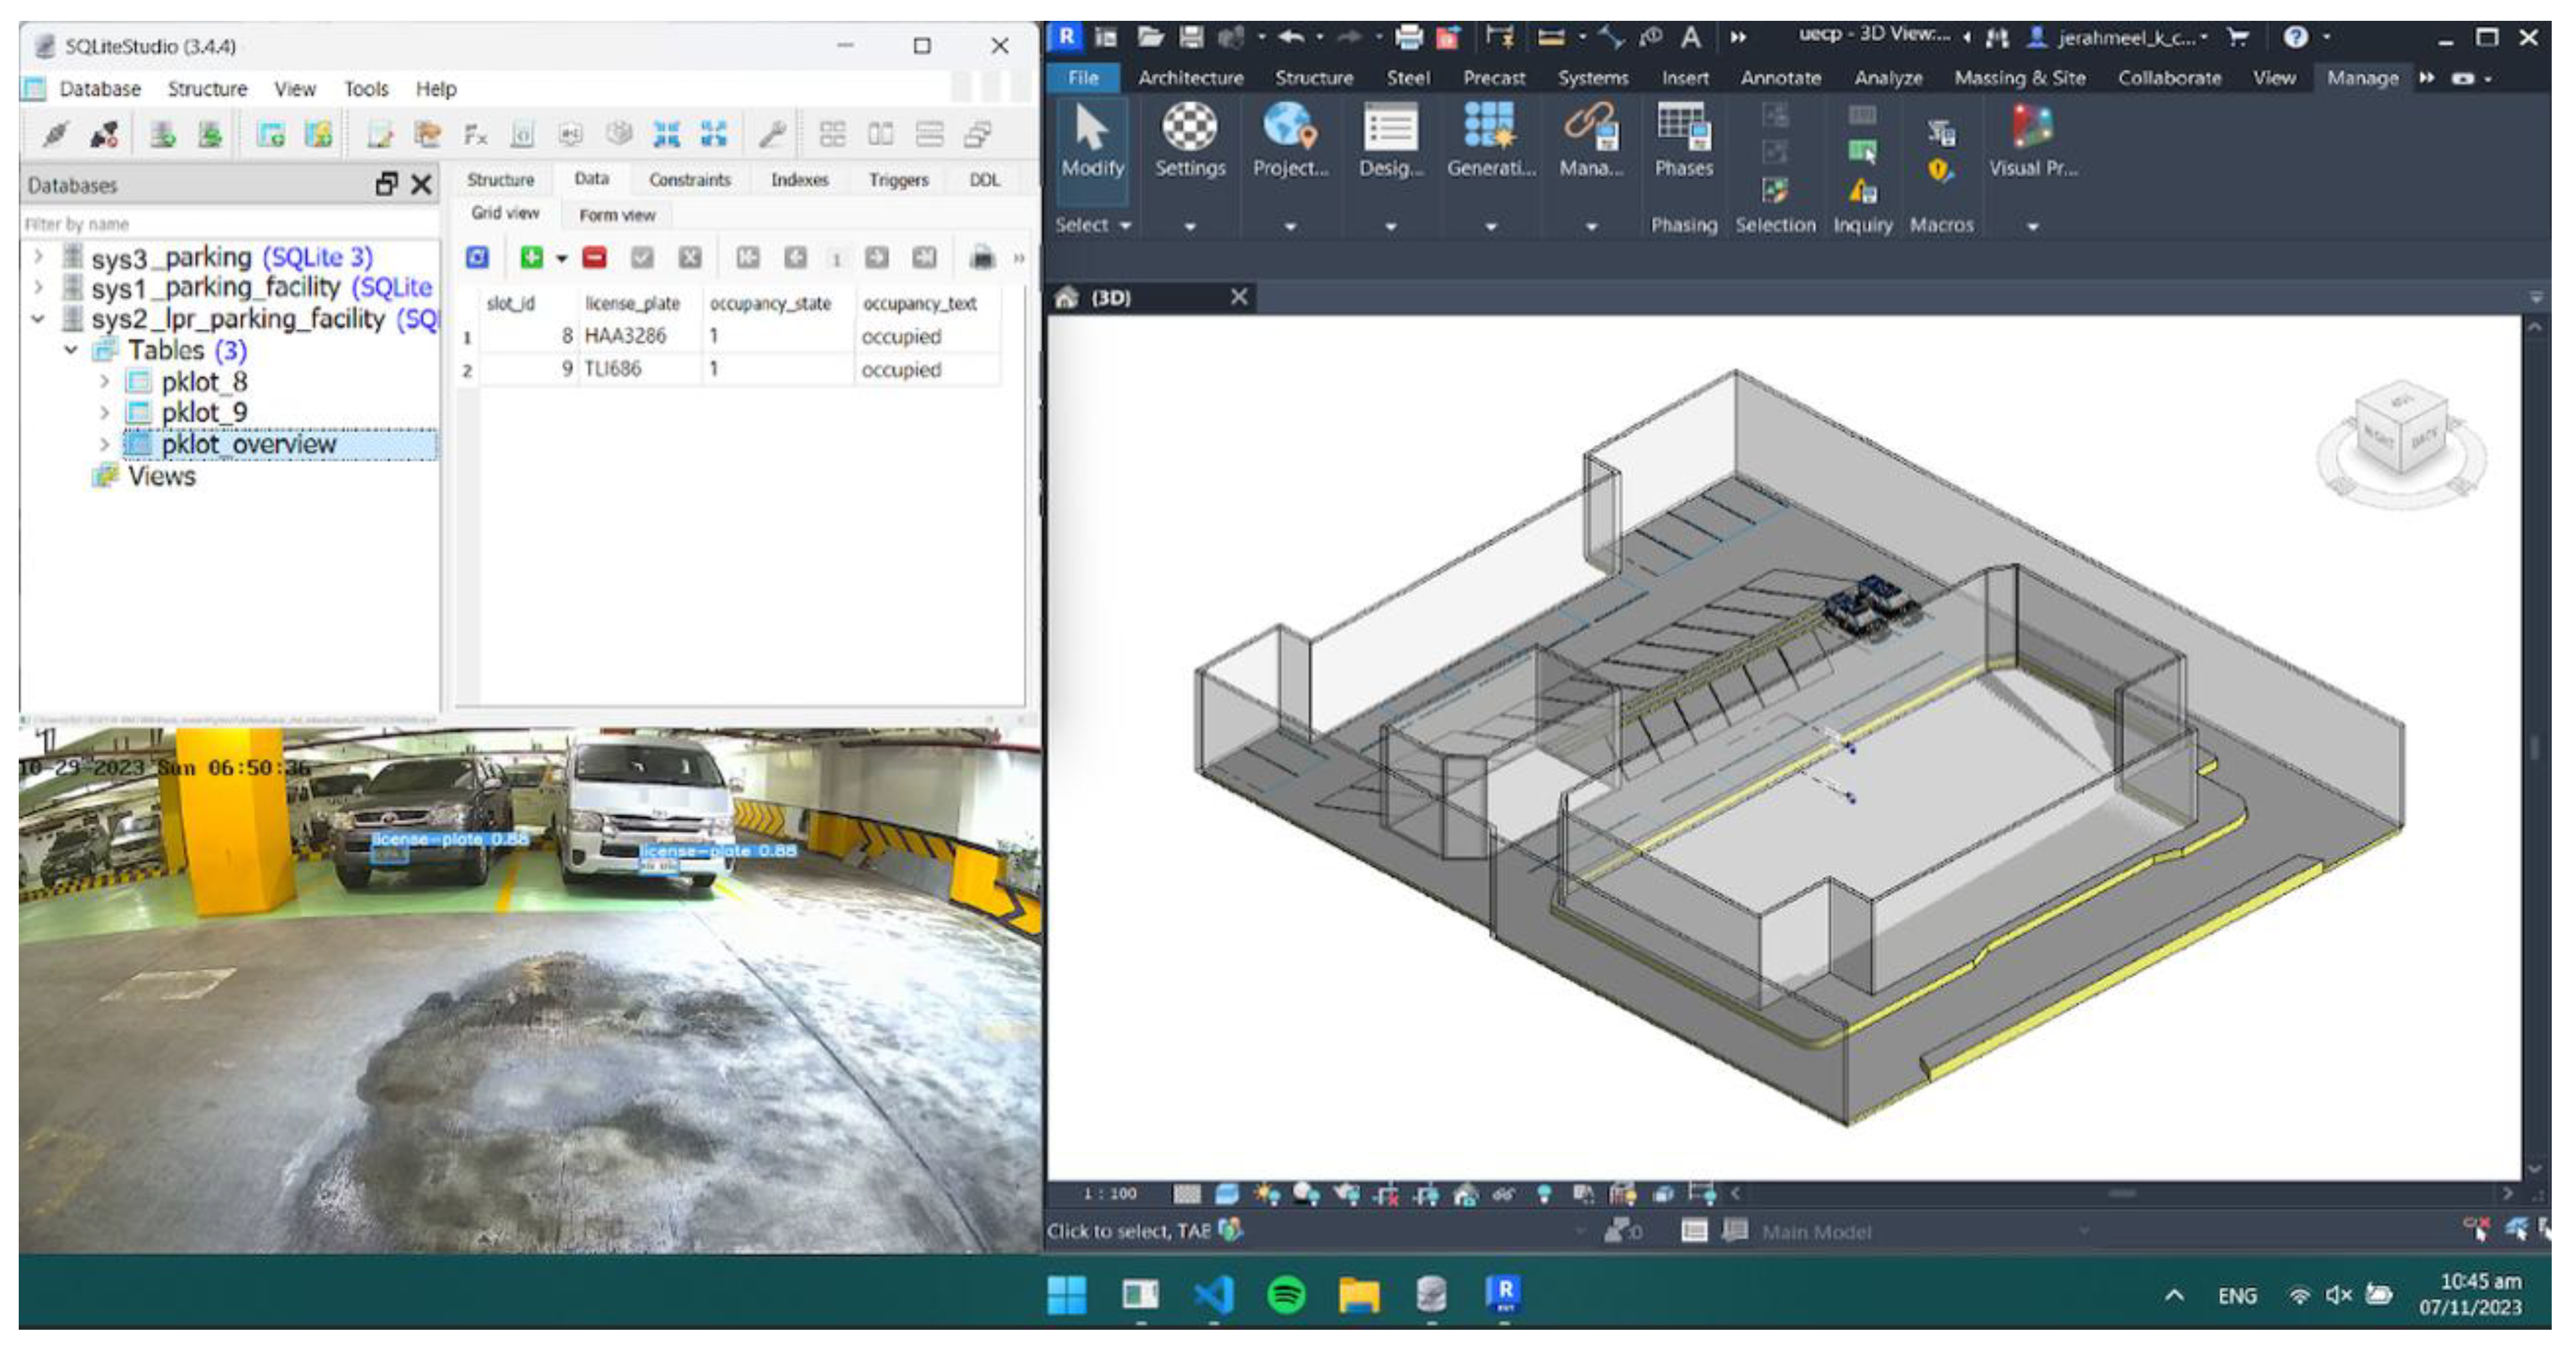
Figure 10.
Tiled view of the database, 3D BIM Digital Twin, and vehicle detection-based POD output during execution, showing (a) Slots #4 and #6 occupied, and (b) Slots #1, #3, and #6 occupied.
Figure 10.
Tiled view of the database, 3D BIM Digital Twin, and vehicle detection-based POD output during execution, showing (a) Slots #4 and #6 occupied, and (b) Slots #1, #3, and #6 occupied.
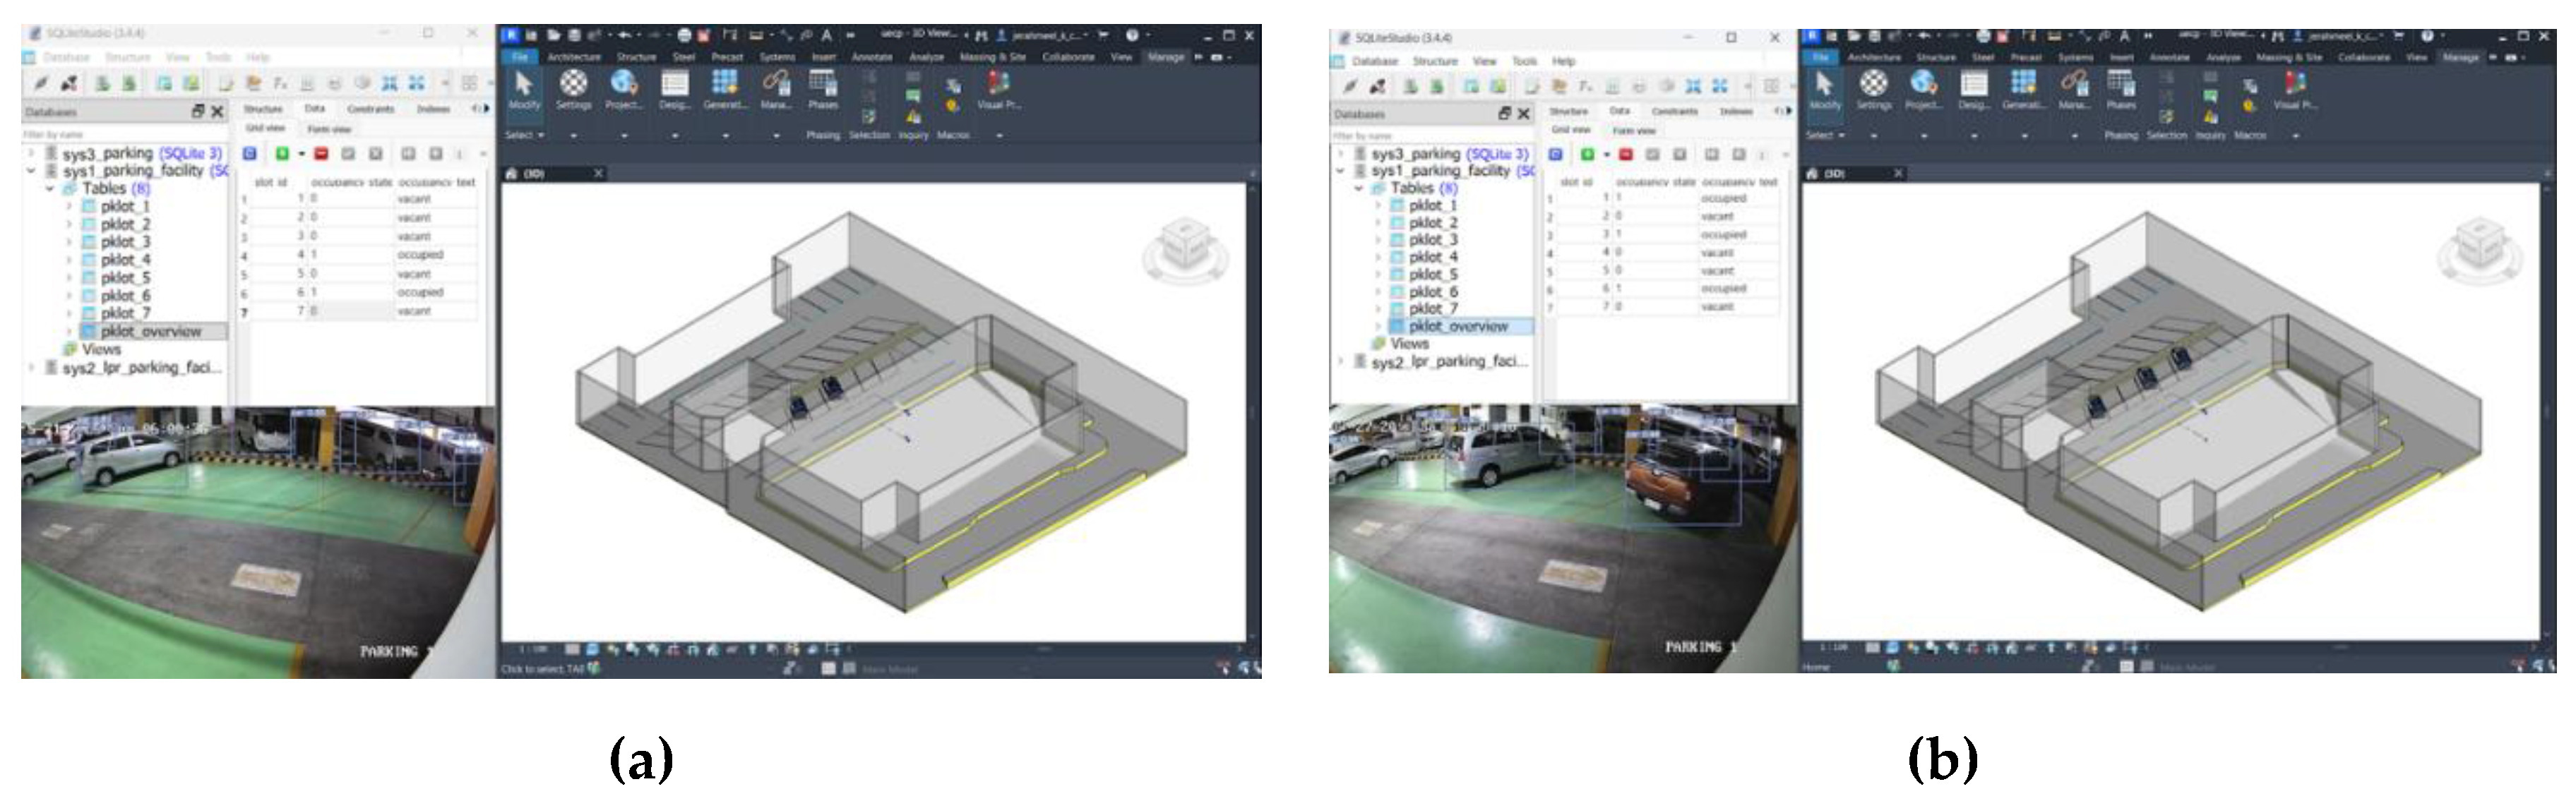
Figure 11.
Tiled View of Database, 3D BIM Digital Twin Revit Model, and the Video Outputted by the LPR-based POD Feature Inferencing System during Program Execution for (a) Slot #8 occupied, and (b) Slots #9 being occupied.
Figure 11.
Tiled View of Database, 3D BIM Digital Twin Revit Model, and the Video Outputted by the LPR-based POD Feature Inferencing System during Program Execution for (a) Slot #8 occupied, and (b) Slots #9 being occupied.
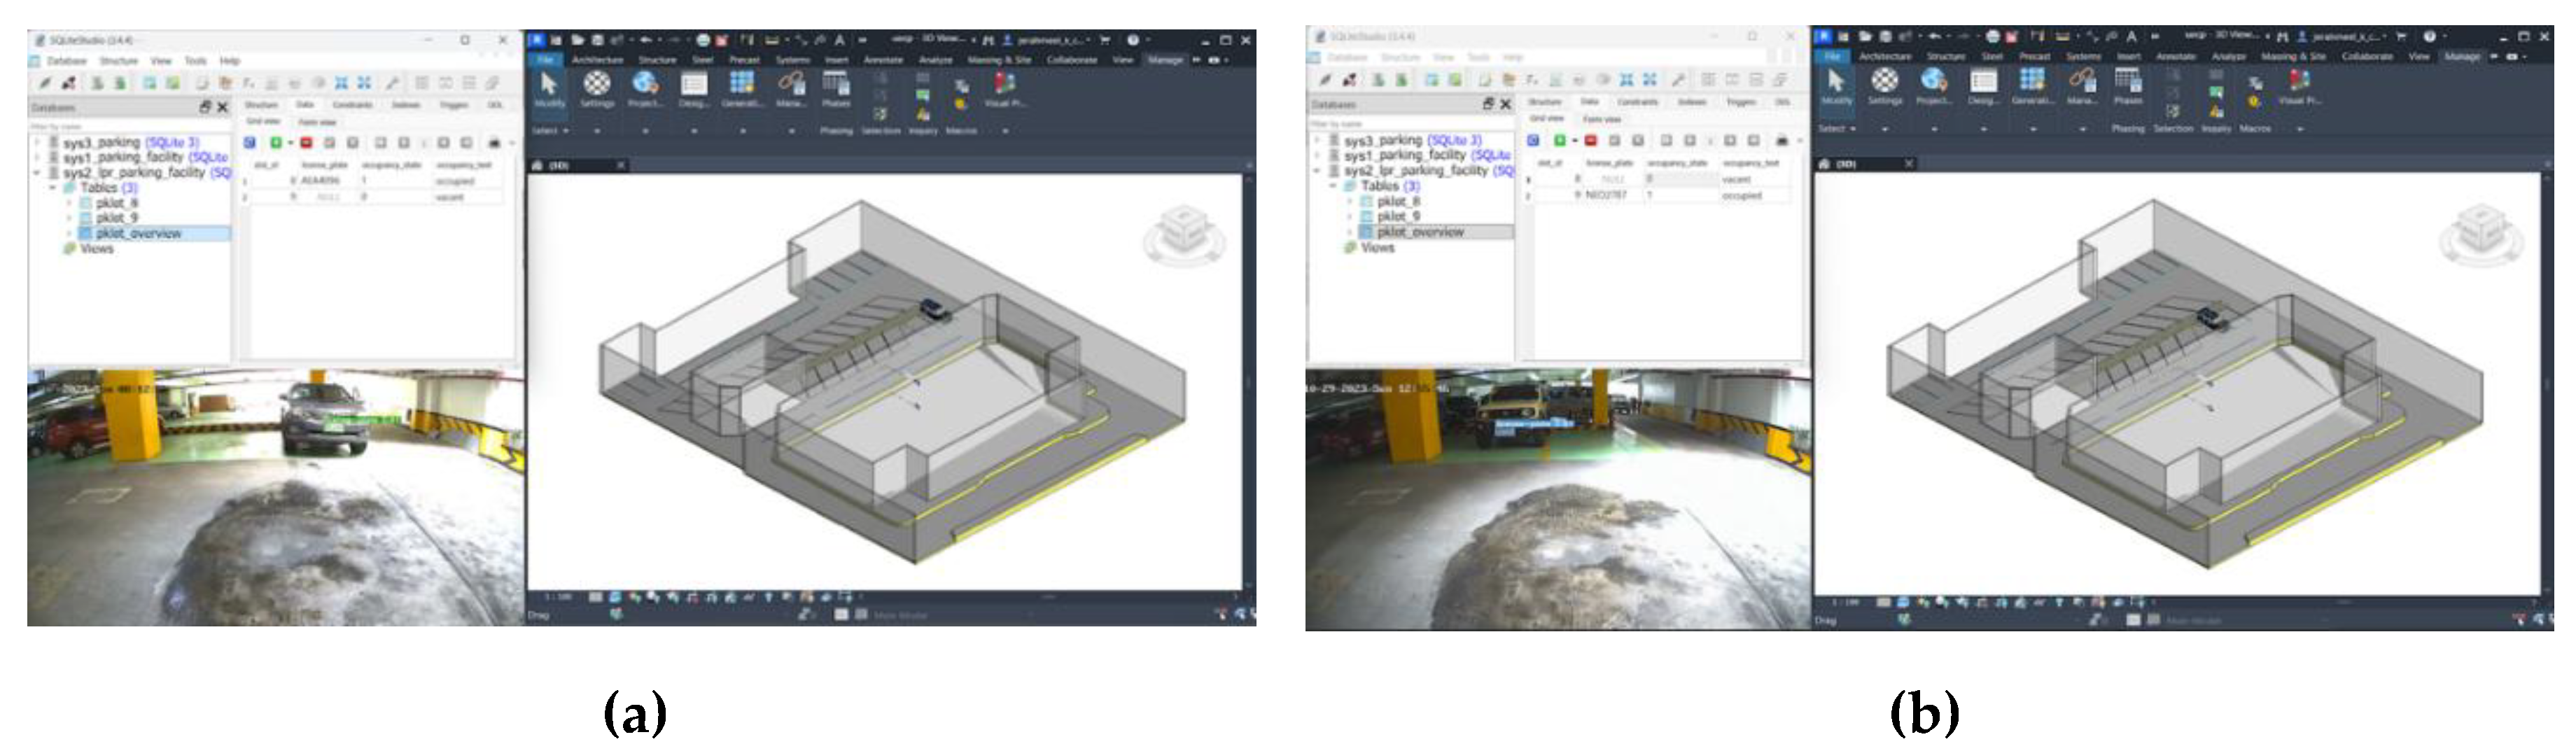
Figure 12.
SQLiteStudo Database Content Snapshot for the pklot_n tables in the LPR_based POD feature system.
Figure 12.
SQLiteStudo Database Content Snapshot for the pklot_n tables in the LPR_based POD feature system.
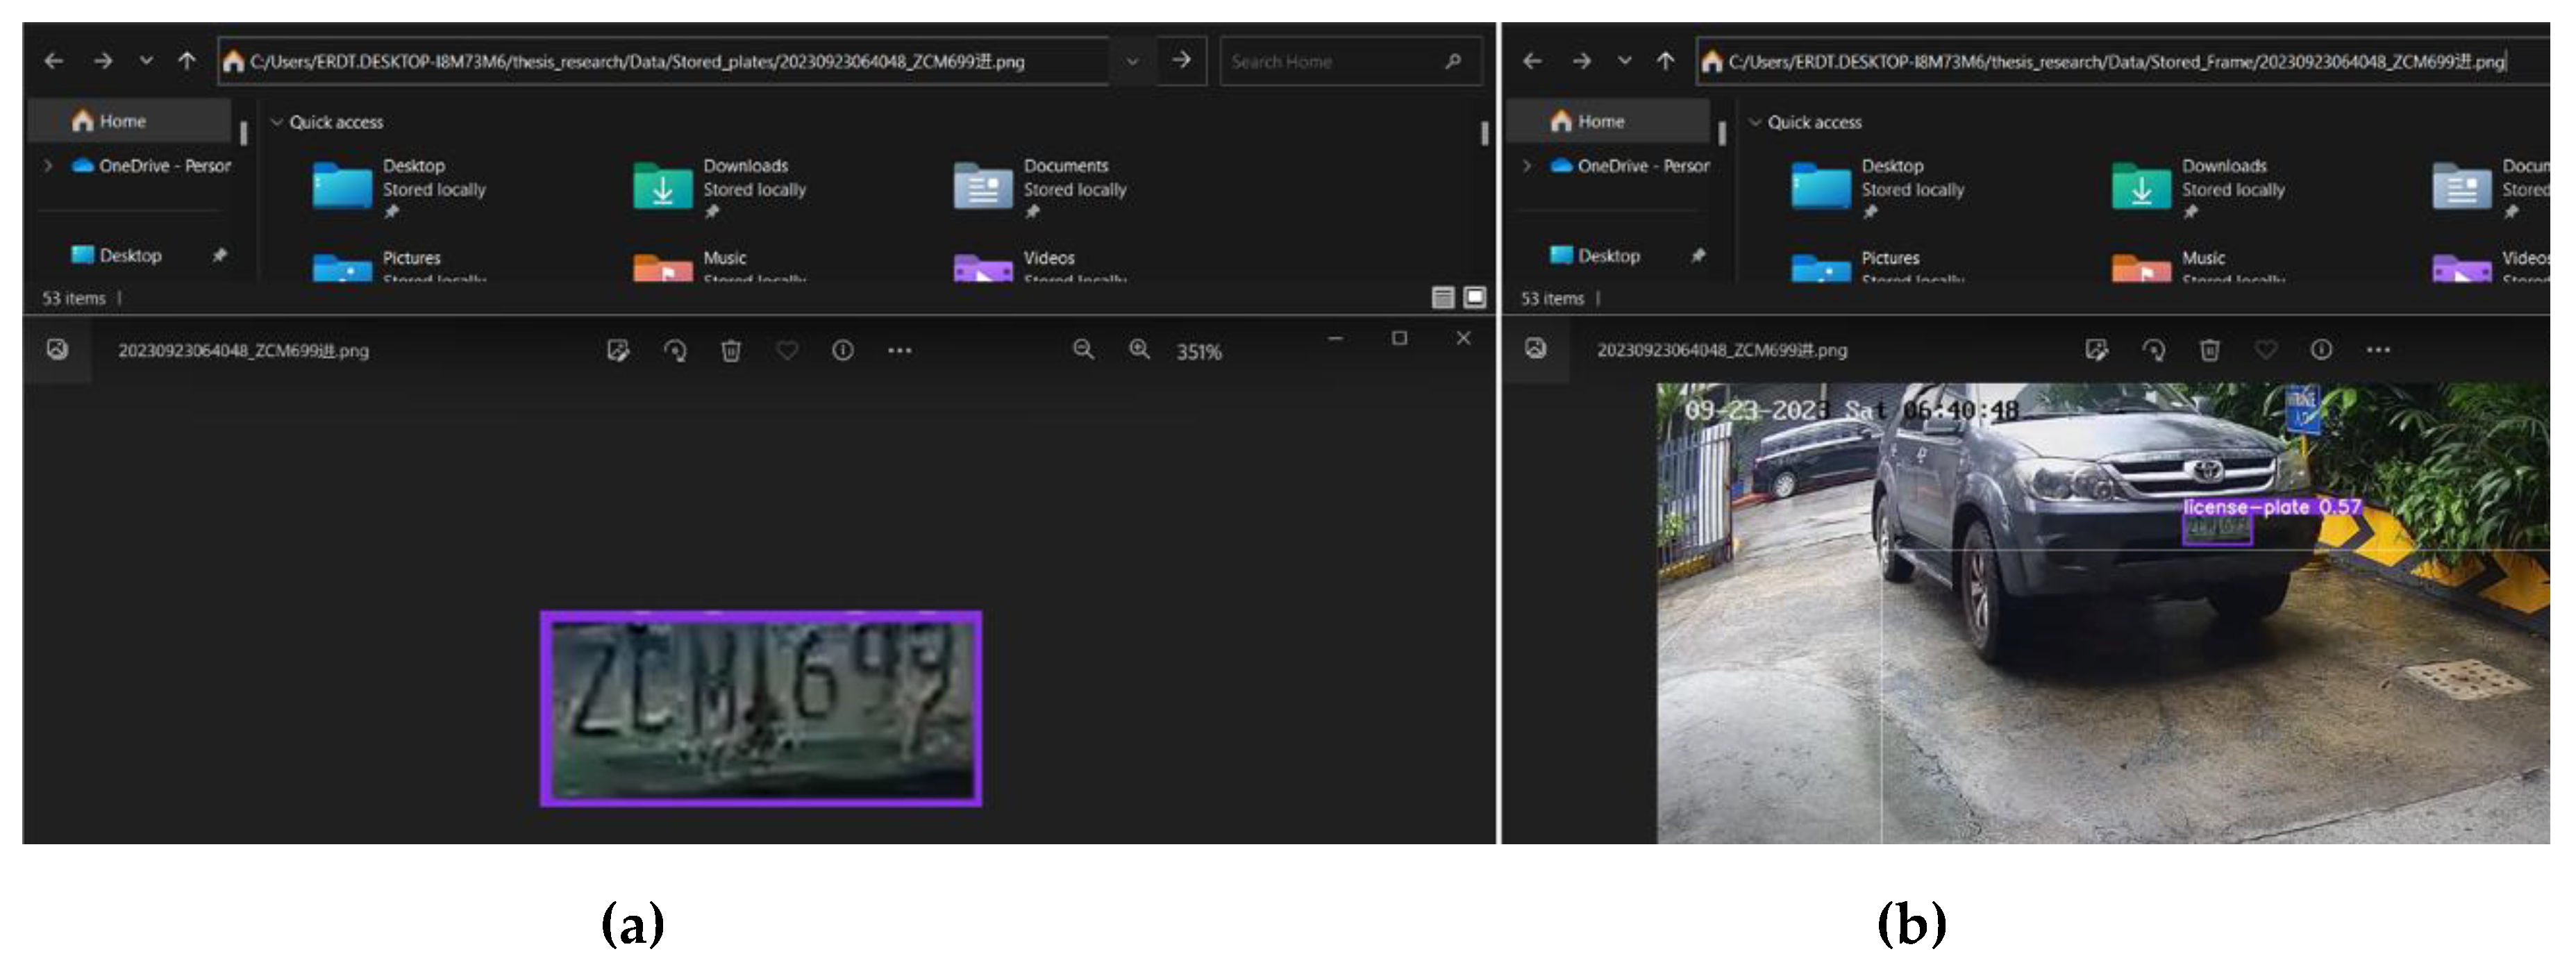
The third system feature is best demonstrated by analyzing the contents of the output database. The 进car_record and 出car_record tables in the third database are where each vehicle entry and exit event is recorded as shown in Figure 32. The id attribute identifies each vehicle's entry and exit in the parking facility. The score attribute stores the inference confidence score associated with the text string produced by the trained DTR model, displayed by the lpr_reading attribute. Additionally, the tables contain two file path columns: lpd_filepath and cropped_lpd_file_path. The string file paths to the cropped license plate image and the full-frame image acquired during each vehicle entry and exit event is stored in these columns. As shown in Figure 33, users can locate and examine the images linked with each vehicle record through pasting these file paths into the Windows File Explorer in the local machine.
Figure 13.
SQLite3 Studio View for the (a) 进car_record Table and the (b) 出car_record Table in the database management system.
Figure 13.
SQLite3 Studio View for the (a) 进car_record Table and the (b) 出car_record Table in the database management system.
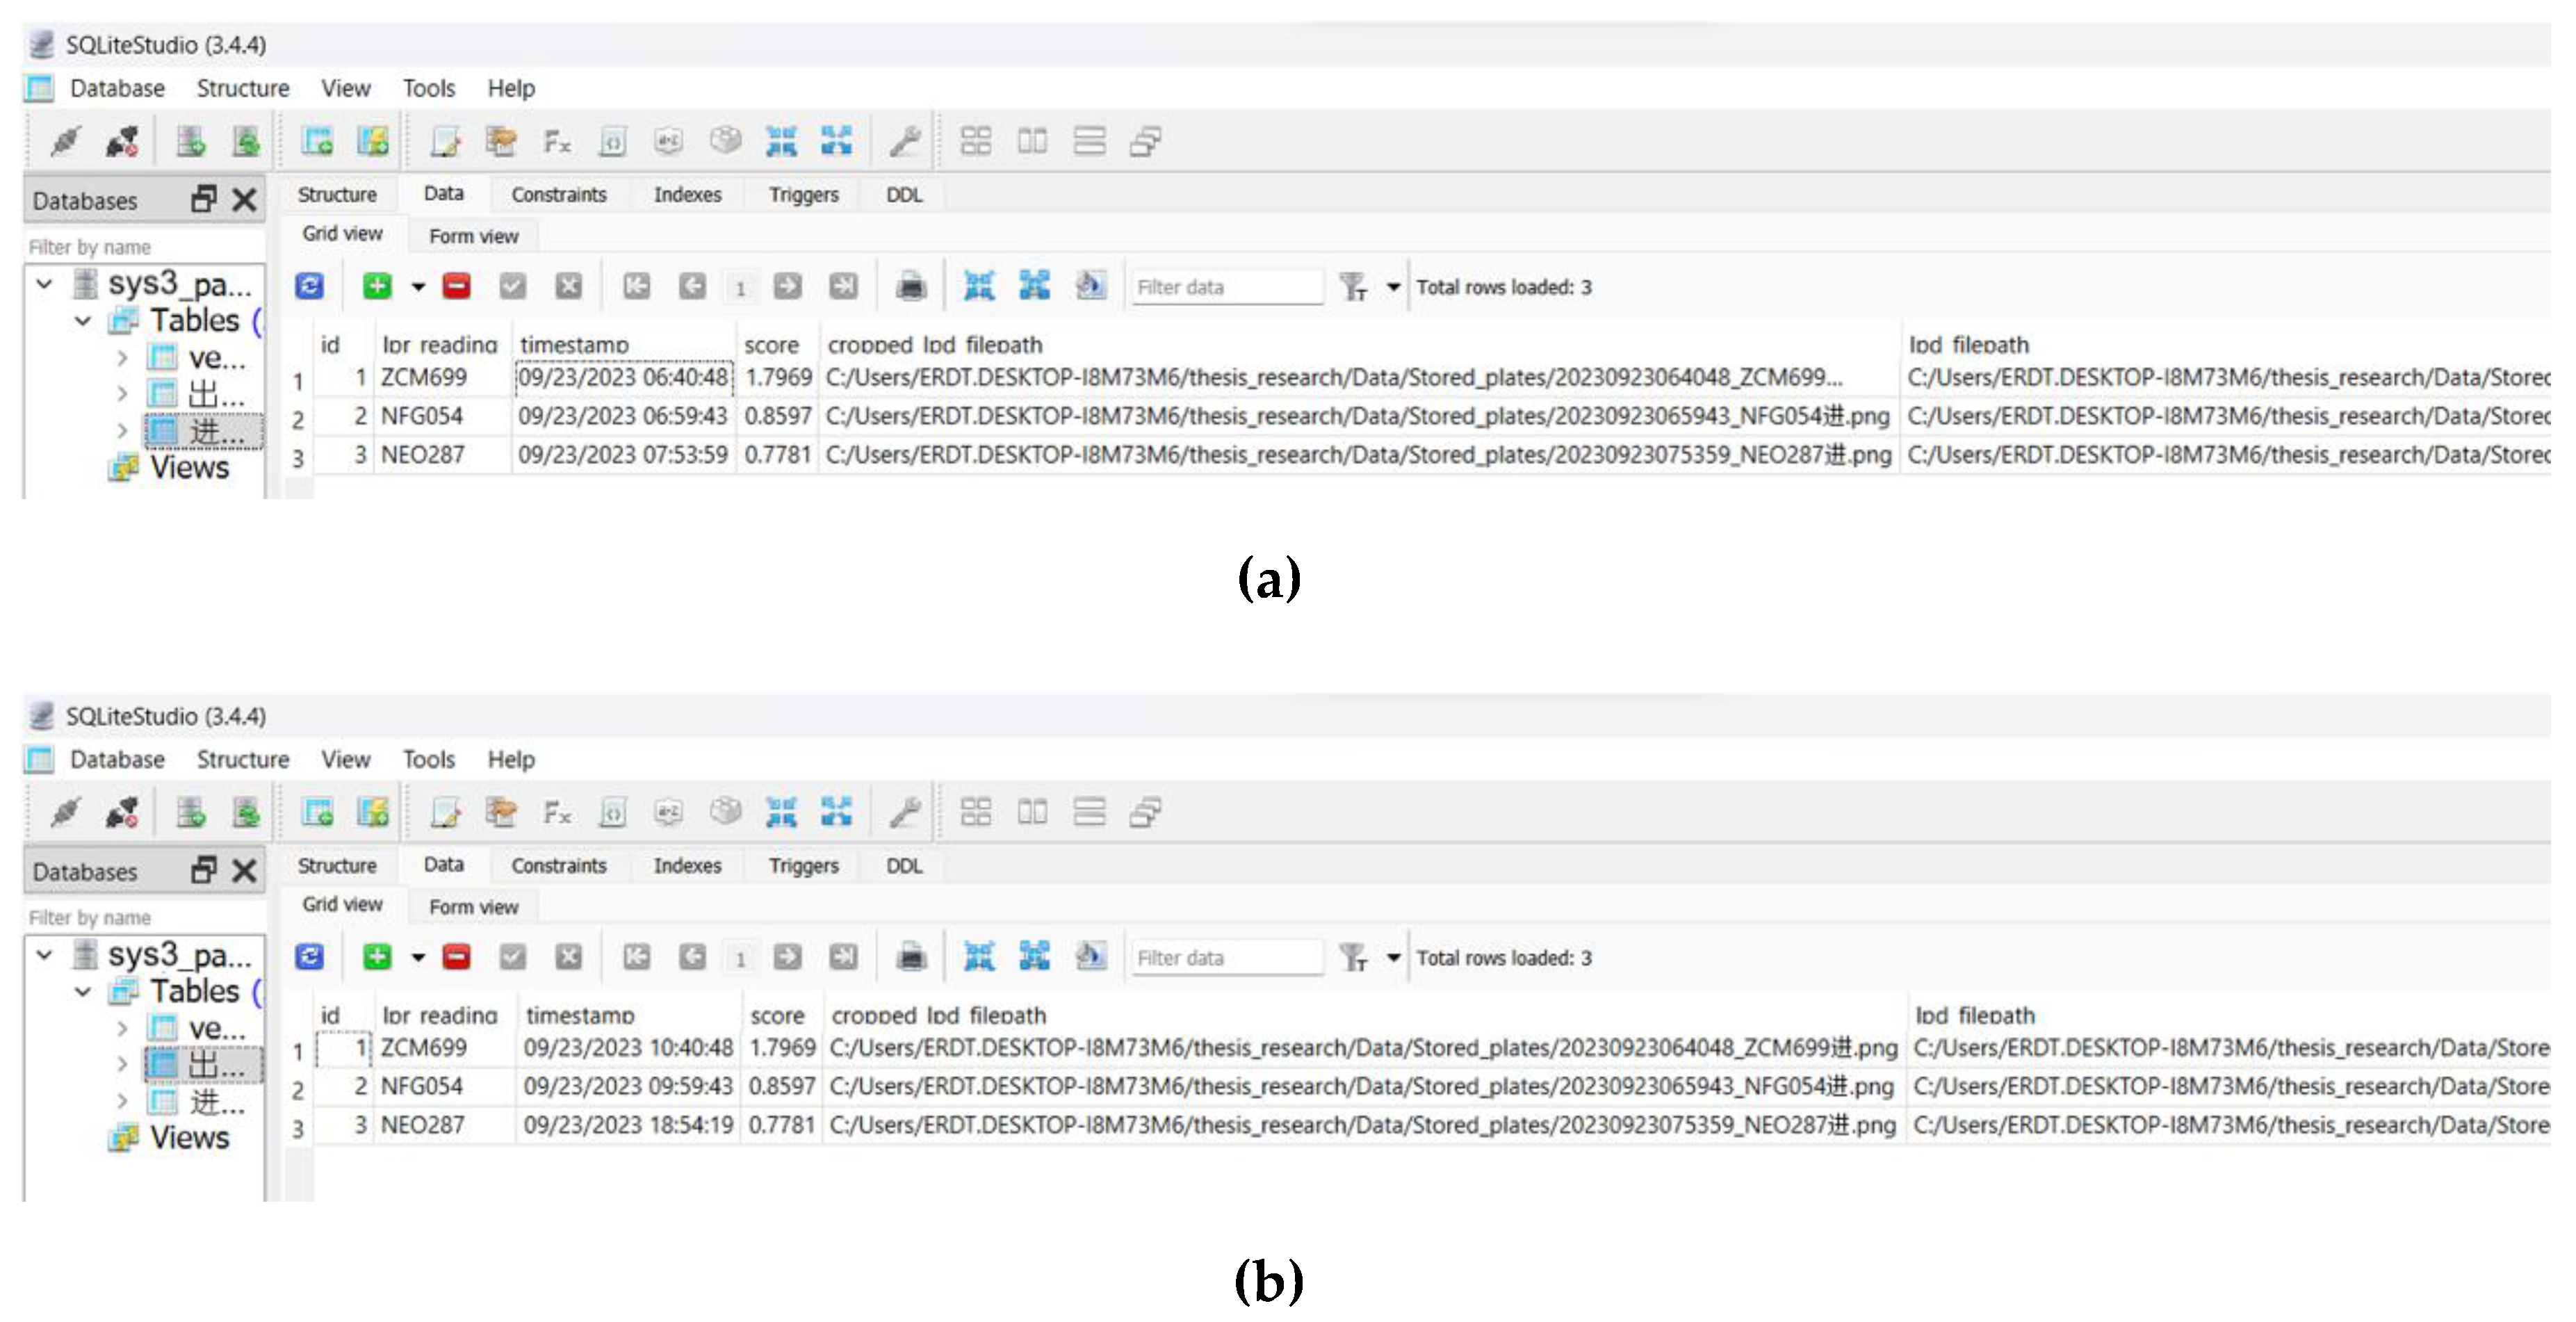
Figure 33.
Windows 11 File Explorer View of Referenced Image Filepaths: (a) Cropped License Plate and (b) Full Frame with LPD Bounding Box SQLiteStudo Database.
Figure 33.
Windows 11 File Explorer View of Referenced Image Filepaths: (a) Cropped License Plate and (b) Full Frame with LPD Bounding Box SQLiteStudo Database.
8.4. DTM Data Dashboard Implementation
Video surveillance feeds were collected on a variety of dates and times, with footage being recorded on Sundays, of which parking management system metrics from the processed vehicle detection and LPR-based POD algorithms and parking monitoring data were derived. The first and second feature systems in the parking facility were analyzed using a total of seven hours of surveillance footage, while the vehicle entry and exit driveways each involved the processing of 7.5 hours of footage. The processed data is extracted from the database management systems associated with each feature system using the Power Query function in Microsoft Excel. The data is then retrieved directly from the SQLite3 local database system into Microsoft Excel using the ODBC API. The graphical charts and a quantitative report summarizing the computed metrics are automatically updated whenever the spreadsheet is refreshed, ensuring that the Microsoft Excel spreadsheet file consistently reflects the most recent documented data. This effectively functions as a dynamic data metrics-based digital twin dashboard that offers valuable insights into parking trends captured by the system's machine learning models and algorithms, facilitating a more transparent comprehension of critical metrics and vehicle parking activity. Moreover, the metrics dashboard lets users specify the starting and ending observation periods in green-highlighted cells, enabling targeted analysis within customized timeframes. This feature also allows flexible data filtering. The data dashboard's usability is improved through a filtering capability, which offers targeted insights that are customized to specific time intervals.
8.4.1. Vehicle Detection-based POD Data Dashboard System
The metrics dashboard provides insights on driver-vehicle activity within the facility and its utilization of parking space resources. The interface is shown in Figure 34 below, which provides a macro-level understanding of the utilization of parking spaces within the specified time frame by providing combined graphs for the occupancy step function, turnover rate, occupancy rate, and parking dwell time distributions.
For example, a rising occupancy rate and step function will indicate an increased demand for a specific time interval. At the same time, rapid turnover cycles at individual spaces are reflected in brief, abrupt shifts in turnover. Throughout the observation period, this graph allows for intuitive monitoring of utilizing the facility's seven parking spaces. In this simulation, the overall occupancy rate refers to the average occupancy rate of only seven parking spaces. This does not refer to the overall occupancy of all 30 parking spaces, as the developed POD algorithm was not applied to all parking spaces within the facility during system testing.
The dwell time distribution is a column chart with box-and-whisker plots that summarize the occupancy lengths of various locations to investigate parking duration further. It is also provided within the same dashboard. These plots assist managers in the rapid identification of spaces with high turnover versus those with extended occupancy by displaying data distribution and outliers. This perspective facilitates a more thorough comprehension of parking dynamics in the facility. The data presented in the overview interface is derived from each parking space's vehicle parking activity data. The dashboard platform also provides each parking slot a sub-dashboard containing four graphical charts. As shown in Figure 35, these graphs capture the occupancy step function, turnover rate, dwell time distribution, and recorded occupancy rate over time for each slot, offering granular insights into parking patterns at the individual space level.
The data from parking space #4 reveals distinct occupancy and turnover patterns that offer deeper insights into parking behavior. The dwell time distribution and step function graphs show three rapid turnovers early in the day, indicating high morning demand likely driven by short visits. By around 08:30 AM, the space became consistently occupied for over four hours, suggesting long-term use by personnel or visitors. This shift from high turnover to extended occupancy highlights how parking demand evolves throughout the day. Initially serving short visits, the space transitions to sustained occupancy, reflecting temporal influences such as the time of day.
8.4.2. LPR-based POD Data Dashboard System
The data dashboard for the LPR-based POD system is structured similarly to the previous system, with an overview dashboard and sub-dashboards for each parking space. As the graph types have not changed, the analytical principles governing such charts' analysis are still applicable. The contents of the tabulated data dashboard generated during system testing using processed surveillance footage are delineated in Table 14.
8.4.3. Facility Entry and Exit Data Dashboard System
Table 15 lists the computed metrics processed by the SM and DTM based on stored database contents for the facility entry and exit monitoring feature system. Figure 36 shows the visual charts that provide the historical progression of recorded metric values throughout the observation period. The charts display the facility's vehicle parking activity, including the Overall Occupancy Rate, Turnover Rate, Occupancy Step Function, and Dwell Time Distribution. It was presumed that vehicles would occupy a parking space from the 30 available positions within the facility upon entry into this system.
The occupancy step function graph and occupancy rate reported by the developed system exceeded their anticipated resource utilization limits. The step function reported more than 30 parked vehicles, while the occupancy utilization rate exceeded 100%. This discrepancy may result from two potential scenarios: 1) a continuous flow of vehicles moving through the facility in search of available parking spaces, and 2) inaccurate reporting of vehicle exits. Hardware limitations prevent the system's inability to profile departing vehicles accurately. Having a low FPS capture capability brings forth motion distortion caused by high-speed vehicles during departure and exit, as shown in Figure 37.
Consequently, the system incorrectly assumes that the vehicles are still present for cars successfully profiled during entry but not during exit. As a result, the feature system encounters difficulty capturing the corresponding departures despite the high volume of vehicle entries. The dwell time distribution suggests that approximately 25 vehicles remained in the facility for 5 to 6 hours. This indicates that many of these vehicles likely exited without being profiled, potentially impacting the integrity of the system's reported metrics, such as the revenue, average parking duration, and turnover rate.
9. Design and Implementation Challenges for the System
The feature systems developed in this study are entirely functional and effectively achieve their intended functional design. In conjunction with the SM and DTM, the digital twinning mechanism effectively replicates dynamic changes from the video broadcast on the 3D BIM DT model and the data dashboard. Nevertheless, errors in the data still persist even though the I2M system effectively executes the relevant algorithms and conducts its intended intercommunication tasks with other modules. Two primary factors are responsible for these system discrepancies: the hardware limitations and the misalignment between the current facility operations and the optimal conditions necessary for AI-driven operational automation. During the design, development, and testing of the proposed smart parking management system, the following factors were encountered, resulting in three primary issues: (1) low FPS hardware combined with barrierless vehicle profiling, which prevented the cameras from capturing clear license plate images by allowing vehicles to pass without obstruction; (2) camera placement that exposed the system to intense sunlight glare, making license plates unreadable; and (3) the inaccuracy of LPR inference due to people movement obstructing vehicle license plates, which impacted the POD algorithms. All of these contribute to the performance and reliability of the system along with the challenges the system faces in potential scalability and commercialization.
9.1. Low Campera FPS and Barrierless Vehicle Profiling at Entrance and Exit Driveways
A data disparity was revealed by the facility's occupancy measurements, which showed that over 30 vehicles were using a parking lot that could only accommodate 30 vehicles. The natural consequence of this was that parking occupancy rates soared over 100%. As previously mentioned in previous sections, reasons for the erroneous presentation of data in the DTM data dashboard are influenced by limitations in the system’s current hardware configuration, along with the absence of dedicated infrastructure equipment designed to maximize the added value brought forth by the newly designed LPR parking entry and exit monitoring feature of the smart parking management system. The camera’s 30-fps framerate capture specification restricts its ability to capture sharp images of fast-moving vehicles, resulting in motion blur that renders consistent LPR-based vehicle profiling nearly impossible, especially when vehicles continue to enter and exit the parking facility in high-speeds (Figure 39). Such limitation poses challenges for the system, which relies on precise LPR readings to accurately log vehicle entries and exits.
The system could overcome some hardware constraints by adding gate barriers that compel vehicles to pause momentarily. For instance, setting gate barriers at entry and exit points would minimize motion distortion and enable more accurate vehicle profiling regardless of the camera's frame rate. There are currently no gate barriers in the facility, so vehicles leave without stopping for a clear capture, resulting in incomplete or unsuccessful LPR readings. This can inflate occupancy statistics and increase errors in real-time occupancy data. Alternatively, purchasing cameras with a higher frame rate could improve the quality of the images captured by fast-moving vehicles. However, the system design and continuing maintenance costs would rise if cameras with better technical specifications were upgraded. Installing barriers and speed bumps may present a better economic advantage. They are generally cheaper and are a practical solution that will compel drivers to slow down during entry and exit, enabling the system to capture clear, unblurred license plates and get precise LPR readings.
9.2. Sunlight Glare and Campera Placement for LPR-based POD Algorithm Feature
On the ground floor of the building complex, the parking facility under monitoring for the LPR-based POD system is exposed to natural sunlight. The surface of the license plates, which is frequently quite bright during the daytime and in fair weather conditions, reflects the extreme sunlight glare caused by light exposure. Because of the optical occlusions induced by such glare, the I2M's trained DTR model has trouble in performing LPR readings reliably. Examples of situations where the system's performance is impacted by severe sunlight are shown in Figure 38.
9.3. Inaccuracy of Output LPR-Based POD Data due to License Plate Occlusions
There are instances in the data dashboard where parking occupancy data suggest several parking space turnovers have occurred in between short periods. This is partly characterized by rapid consequential turnovers in the turnover graph and short-lived occupancy duration in the step function graph for individual parking slots. This is especially true when analyzing processed data from the LPR-based POD data feature system. When the system designers cross-checked the raw video footage, it was discovered that despite only one vehicle occupying the parking space for an extended period, it was recorded that the exact vehicle had entered and exited the parking space in multiple successions. An account of the events is shown in Figure 39.
Figure 39.
Visual Representation of Events with Accompanying Database View for Parking Spaces exhibiting Rapid Turnover with Short-lived Parking Occupancy Durations.
Figure 39.
Visual Representation of Events with Accompanying Database View for Parking Spaces exhibiting Rapid Turnover with Short-lived Parking Occupancy Durations.
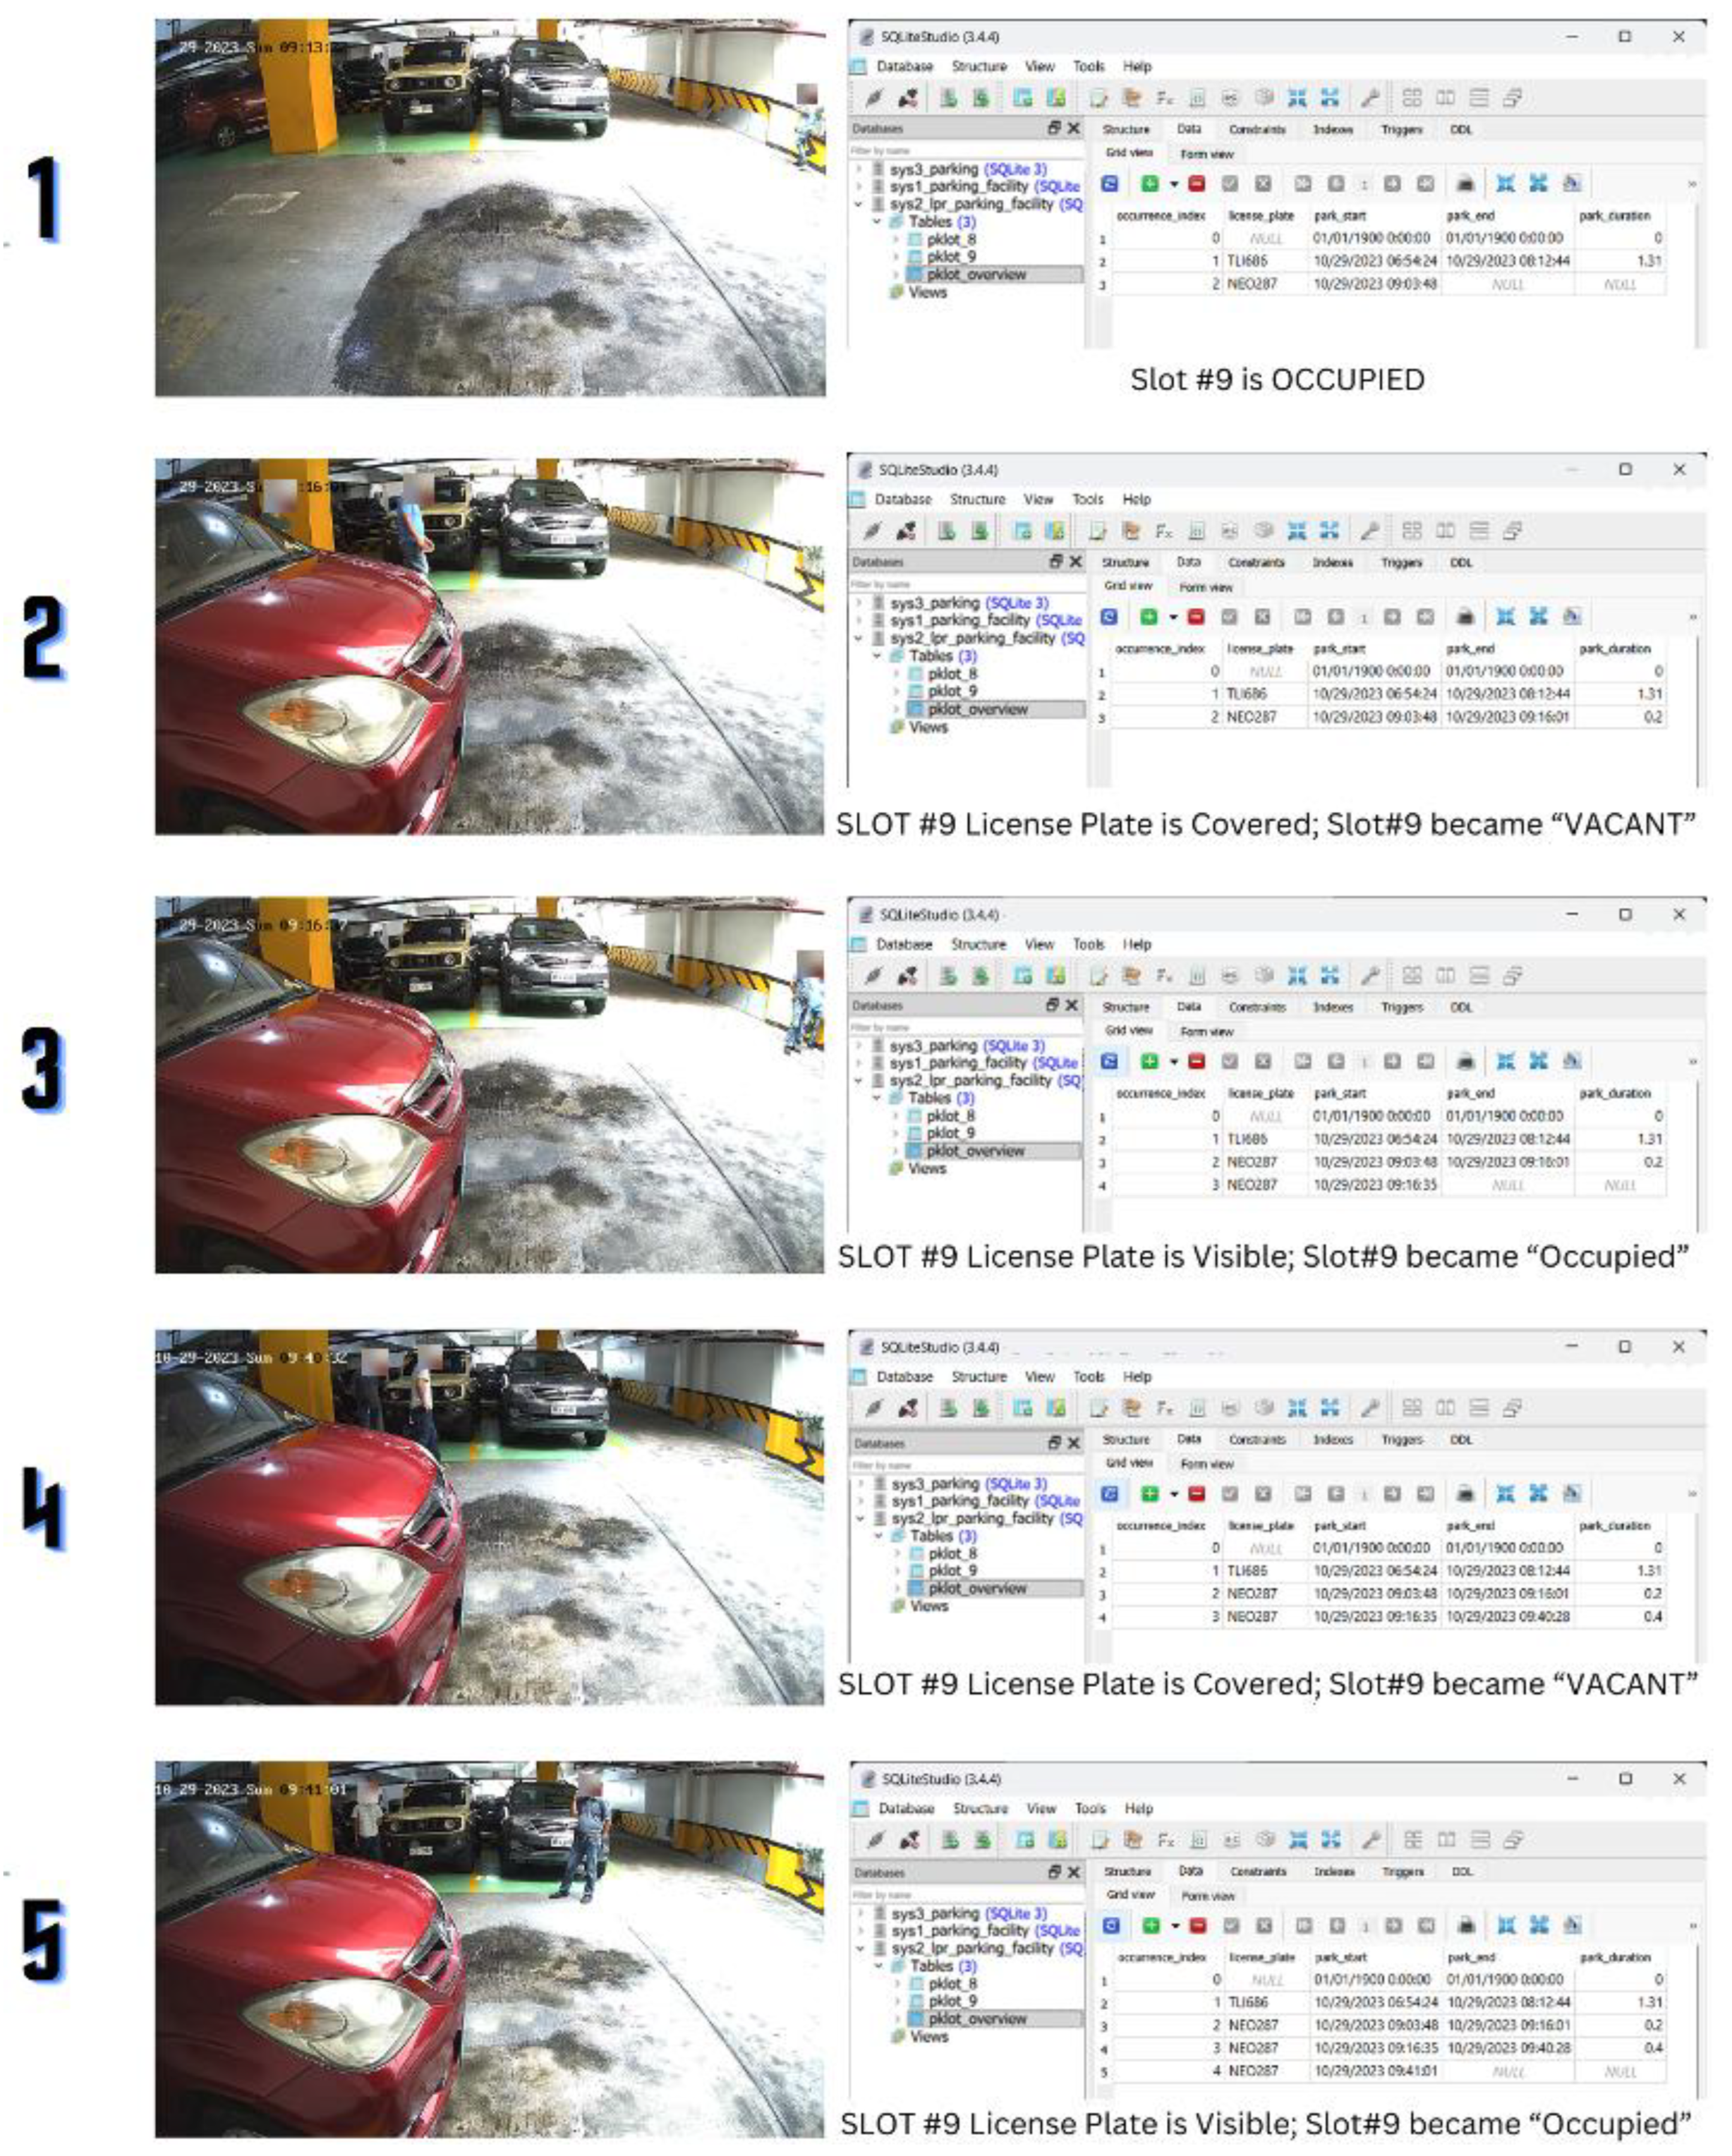
The investigation revealed that pedestrians briefly block license plates while walking past cars, leading to flawed recorded turnovers. The LPR-based POD system incorrectly perceives a pedestrian passing by as the vehicle leaving when this action momentarily obscures the license plate. The system records the exact vehicle as reentering the space once the person moves, making the license plate visible again.
A more reliable way to address this problem would be to switch from an occupancy model that relies on LPR to one based on vehicle detection. More reliable occupancy detection is ensured since, unlike license plates, the vehicle chassis is always visible, even when a person is walking in front of it. In this alternative method, vehicle detection would verify that a parking space is occupied. License plate recognition would be a conditional process that is only utilized to profile a parked vehicle when it is initially detected in a new parking space. This system adjustment could preserve the LPR function for precise vehicle profiling while removing mistakes caused by fleeting license plate occlusions.
The placement of the camera is another problem associated with occlusion. Due to the low camera positioning, the system may lose track of occupancy if pedestrians or passing cars block the view of parked cars. The passing people and vehicles would still cause errors anytime the view of the parked car is obscured, even if the system were to switch to a vehicle detection-based POD algorithm. Hence, the best camera placement is necessary to minimize these mistakes. To guarantee an unhindered field of view and reduce the possibility of visual access being blocked by passing objects or people, cameras should be installed at higher elevations near the ceiling. A common situation where low camera placement results in object occlusion and a parked car either partially or fully vanishes from the camera’s field of view is seen in Figure 40 below.
9.4. System Scalability Challenges
The 3D BIM model cannot comprehensively monitor all vehicle activity and parking occupancy changes due to the limited camera coverage and insufficient high-performance computational resources. This study has presented a framework for integrating a BIM model into a smart parking management system, demonstrating the feasibility of incorporating digital twinning technology in smart parking facilities through a proof-of-concept prototype. As observed, its performance and reliability are limited to regulated settings where the actions of vehicles, drivers, and pedestrians are predictable. In practical deployment settings, uncontrolled variables introduce noise into the system's data stream, diminishing accuracy and complicating scalability intentions. Commercial parking facilities introduce additional complexities that necessitate specific design considerations beyond those applicable to controlled environments. Addressing scalability challenges is imperative and crucial, as such systems aim to increase business value.
Commercial parking facilities differ from controlled environments due to their design and complicated management operations, including but not limited to multiple entry and exit points, varied parking orientations, and multi-level structures. The variability in foot traffic, inconsistent vehicle movements, facility-specific operational policies, and diverse customer behaviors complicate understanding how the system should work. Moreover, technical challenges such as variable vehicle flows, physical obstructions, inconsistent lighting conditions, and regulatory constraints impede the accuracy of system modeling. Improving monitoring capabilities necessitates a comprehensive camera network throughout the facility and a strategic placement method to enhance visibility and inference accuracy in the presence of pedestrian and vehicle occlusion interferences. Optimal camera placement is crucial for achieving high-quality visual inputs in machine vision models that facilitate object detection and tracking. In addition to hardware factors, computational optimizations significantly enhance system responsiveness and reliability.
Integrating multiprocessing techniques in intelligent systems improves real-time inference by allowing simultaneous processing of multiple camera streams and image-based occupancy detection tasks. Conventional sequential processing techniques frequently result in latency during vehicle movement analysis, causing delays in decision-making. Multiprocessing enhances computational efficiency by distributing tasks across multiple CPU cores, significantly decreasing processing time for vehicle detection, license plate recognition, and space occupancy assessment. This is advantageous in commercial parking settings, where extensive monitoring requires ongoing data collection from various sources. Multiprocessing enhances load balancing across different image-processing tasks, ensuring optimal computational resource utilization. The system achieves real-time responsiveness under high-demand conditions by concurrently executing occupancy detection, vehicle tracking, and anomaly identification. Process synchronization and data-sharing protocols mitigate errors in concurrent execution while ensuring consistency in identified occupancy states. Multiprocessing offers practical advantages such as enhanced system scalability, accommodating growing data volumes through additional processing cores, and improved operational efficiency by reducing inference delays [88].
In addition to computational optimizations, system reliability is contingent upon addressing environmental factors that influence model performance. Lighting inconsistencies can be mitigated through the installation of supplementary lighting to achieve uniform illumination, the augmentation of datasets with diverse lighting conditions, and the application of image processing techniques to improve visibility before inferencing [35]. The optimizations enhance the DT's capacity for accurate occupancy monitoring, facilitate informed decision-making, and management operations in practical applications.
10. Cost Benefit Analysis
The feasibility of adopting smart parking management systems must be evaluated beyond its development expenses. For potential adopters, this involves assessing whether its deployment in commercial environments would function as a revenue-generating asset or a financial liability. A cost-benefit analysis can offer significant insight by comparing the advantages and disadvantages of the developed system with a conventional, non-technological option.
The upfront investment cost for system development, as Table 5 has previously outlined, amounts to PHP 202,058.93 (USD 3,477.78). Furthermore, in 2024, Meralco, which is the largest private electric distribution utility in the Philippines, imposed an average fee of PHP 11.4377 per kWh (USD 0.20 per kWh) for electric consumption cost [89]. Table 16 delineates the monthly operational expenses incurred in the system's operation.
The investment cost for a traditional setup lacking smart parking management hardware upgrades is reduced by eliminating two monitors, as dedicated displays for the 3D digital twin and data dashboard are not required. A single monitor suffices for the observation of surveillance footage. Furthermore, expenses associated with an external hard drive, a laptop, a high-end smartphone equipped with LiDAR scanning capabilities, and a subscription for a LiDAR scanning application are removed, as these devices are solely necessary for integrating smart technology. Essential hardware components, including security cameras, an NVR, and lighting fixtures, are required for surveillance, irrespective of machine vision implementation. Table 17 presents the alternative investment costs for a traditional system, amounting to only PHP 30,545.90 (USD 525.73).
Foregoing a smart parking management infrastructure leads to reduced electricity consumption costs, as fewer monitors are necessary for operation. Without automated tools for vehicle entry and exit management, station cashiers are required to facilitate driver interactions and process payments. A smart parking system facilitates self-payment kiosks or cashless transactions, resulting in a fully autonomous and contactless experience. The employment of cashiers incurs supplementary labor expenses, with the average monthly salary for a cashier in the Philippines estimated at PHP 18,122.42 (USD 311.92), as the Economic Research Institute reported [90]. Table 18 presents a detailed analysis of monthly expenses, considering the employment of two cashiers.
Simulations of the smart parking management system during operational hours over a day reveal a total gross profit of PHP 1,550.00 (see Table XVI). With an assumption of 30 business days per month, the monthly profit totals PHP 46,500.00, resulting in an annual profit of PHP 558,000. The return on investment (ROI) is defined by the breakeven point, indicating the duration necessary for the system to recover its initial investment through accumulated profits. The breakeven period is determined using Equation (22).
Upon computation, a SPMS-equipped parking facility’s expected breakeven period is in 4.73 months, while a facility with none of these upgrades has a 4.55 breakeven period. Such indicates a breakeven period of almost 5 months for both options. Although having almost the same breakeven period, the caveat in this is that the SPMS leads to significantly lower monthly expenses. Its financial impact is greatly appreciated and evident in the long run as it can deliver cost savings. The monthly cost savings can be computed for using Equation (23). Equation (24) on the other hand details the yearly cost savings.
Analysis indicates that implementing smart parking management system reduces manual labor expenses, leading to significant financial advantages. The monthly and annual costs savings are detailed in Table 19 and Table 20, respectively. Calculations show that a monthly cost of ₱35,997.7 (USD 619.58) can be reduced, resulting in an annual cost savings of ₱431,973.36 (USD 7,435.00).
The initial investment of ₱202,058.93 can be recovered in approximately 5.6 months. This is obtained through ratio between the total investment cost and the monthly cost savings. Exceeding the breakeven point results in sustained cost reductions, improved profitability, and potentially better operational system efficiency. The findings highlight the compelling financial rationale for potential adopters to pursue building smart parking systems, which facilitates ongoing savings and enhanced service quality over time.
11. Conclusion and Recommendations
This study presented a smart parking management system development framework that used machine vision, machine learning, and digital twinning to dynamically model vehicle parking activity within a parking facility. Using YOLOv7 for vehicle and LPD, and DTR for LPR, the system was able to demonstrate reliable modeling performance under varying situations, demonstrating the promise of digital twins in merging facility surveillance with modern data analytics. The developed enterprise-wide 3D digital twin BIM model in Autodesk Revit offers a visually intuitive data-driven viewing interface that informs users of parking activity in each parking facility. As the developed model was in 3D, viewers of the model need not mentally interpret and correlate 2D style information into a 3D spatial understanding. The DT model is built geometrically similar to the built environment, thus allowing for information to be intuitively understood, potentially improving the parking management decision-making processes for parking facility managers and serving as a baseline model for comparable deployments in future smart city initiatives involving intelligent systems and parking management. A summary of key performance metrics of the developed system and its capabilities are provided in Table 21.
A critical insight for deploying new technologies in operational settings is the need for reciprocal flexibility between the technology introduced and its operating environment. Integrating new technologies should not disrupt existing workflows or compromise the current level of operational stability and efficiency. Rather, facilities should be flexible by adjusting their processes to allow for the optimal functioning of newly integrated technologies. To optimize the added value of SPMSs, it is critical to create conditions conducive to guaranteed reliable outputs, such as fair and ambient lighting conditions for LPR and optimal camera location for occlusion problems. Adjustments, such as building speed bumps or installing gate barriers to facilitate vehicle stops and clear license plate capture, improve the precision of calculated system metrics and enable a smooth integration without jeopardizing present operations.
Alternative digital twinning systems such as Unity, which provide more flexibility and long-term system support, should be investigated in future studies. Unity is a preferred alternative platform for 3D environment BIM models because of its backward compatibility offering. Unlike Autodesk software, which will eventually drop developer support for old software versions, Unity Engine will continue to enjoy continuous developer support from Unity. Thus, BIM developers need not worry about backward compatibility issues that may arise in the future. Furthermore, expanding 3D BIM modeling beyond parking management to other facility and infrastructure domains, such as building energy management, manufacturing process optimization, centralized airflow systems, and predictive maintenance, could demonstrate BIM technology's versatility and scalability in various applications. Integrating BIM into these areas increases the ability to maintain optimum conditions for facility operations, giving meaningful insights and improving decision-making in various settings. To increase system robustness in various settings, better object detection and scene text recognition models can be explored. Incorporating powerful computing tools, such as edge computing devices and cloud computing, can also guarantee system health and avoid performance throttling, guaranteeing that the parking management system will continue to be dependable and expandable as it develops.
Author Contributions
For research articles with several authors, a short paragraph specifying their individual contributions must be provided. The following statements should be used “Conceptualization, J.C.K. and R.K.C.B.; methodology, J.C.K., R.K.C.B. and A.K.M.B.; software, J.C.K. and A.K.M.B.; validation, R.K.C.B., S.Y., V.A.P. and R.S.; formal analysis, J.C.K. and A.K.M.B.; investigation, J.C.K. and A.K.M.B.; resources, J.C.K. and R.K.C.B.; data curation, J.C.K. and A.K.M.B.; writing—original draft preparation, J.C.K., R.K.C.B. and A.K.M.B.; writing—review and editing, J.C.K., R.K.C.B., A.K.M.B., S.Y., V.A.P. and R.S.; visualization, J.C.K. and A.K.M.B.; supervision, R.K.C.B.; project administration, R.K.C.B. and A.K.M.B.; funding acquisition, J.C.K. and R.K.C.B. All authors have read and agreed to the published version of the manuscript.” Please turn to the CRediT taxonomy for the term explanation. Authorship must be limited to those who have contributed substantially to the work reported.
Funding
The authors would like to thank De La Salle University’s Office of the Vice President for Research and Innovation (DLSU OVPRI), DLSU Intelligent Systems Laboratory Research Unit (DLSU ISL), Department of Science and Technology – Science Education Institute (DOST-SEI) through the Engineering Research and Development for Technology (ERDT) program for all the granted support.
Conflicts of Interest
The authors declare no conflicts of interest.
Abbreviations
The following abbreviations are used in this manuscript:
| AI | Artificial Intelligence |
| AM-DT | Asset or Machine Digital Twin |
| Bbox | Bounding Box |
| BiLSTM | Bidirectional Long Short-Term Memory |
| BIM | Building Information Model |
| C-DT | Component Digital Twins |
| CCPA | California Consumer Privacy Act |
| CCTV | Closed-Circuit Television |
| CER | Character Error Rate |
| CNN | Convolutional Neural Network |
| CPS | Cyber-Physical System |
| CTC | Connectionist Temporal Classification |
| DB | Database |
| DLSU ISL | De La Salle University – Intelligent Systems Laboratory |
| DT | Digital Twin |
| DTM | Digital Twin Module |
| DTR | Deep Text Recognition |
| EPD | Euclidean Pixel Distance |
| EW-DT | Enterprise-Wide Digital twin |
| FK | Foreign Key |
| GDPR | General Data 98 Protection Regulation |
| GUI | Graphical User Interface |
| GV | Generated Value |
| I2M | Intelligent Inference Module |
| ICT | Information and Communications Technology |
| IoT | Internet of Things |
| IoU | Intersection over Union |
| ITS | Intelligent Transportation Systems |
| kWh | Kilowatt-hour |
| LiDAR | Light Detection and Ranging |
| LPD | License Plate Detection |
| LPR | License Plate Recognition |
| mAP | Mean Average Precision |
| MV | Mirrored Value |
| NVR | Network Video Recorder |
| OCR | Optical Character Recognition |
| PHP | Philippine Peso |
| PK | Primary Key |
| POD | Parking Occupancy Determination |
| PTZ | Pan-Tilt-Zoom |
| ROI | Return of Investment |
| SDG | Sustainable Development Goal |
| SM | Storage Module |
| SP-DT | System or Plat Digital Twin |
| SPMS | Smart Parking Management System |
| SQL | Structured Querry Language |
| STR | Scene Text Recognition |
| YOLO | You Only Look Once |
| YOLOV7 | You Only Look Once Version 7 |
References
- Montino, P.; Pau, D. Environmental Intelligence for Embedded Real-Time Traffic Sound Classification.; 2019; pp. 45–50.
- Chen, M. Urban Parking Scheme in Hangzhou Based on Reinforcement Learning. IOP Conf. Ser. Earth Environ. Sci. 2021, 638, 012002. [CrossRef]
- Parmar, J.; Das, P.; Dave, S.M. Study on Demand and Characteristics of Parking System in Urban Areas: A Review. J. Traffic Transp. Eng. Engl. Ed. 2020, 7, 111–124. [CrossRef]
- Billones, R.K.C.; Bandala, A.A.; Lim, L.A.G.; Sybingco, E.; Fillone, A.M.; Dadios, E.P. Microscopic Road Traffic Scene Analysis Using Computer Vision and Traffic Flow Modelling. J. Adv. Comput. Intell. Intell. Inform. 2018, 22, 704–710. [CrossRef]
- Paiva, S.; Ahad, M.A.; Tripathi, G.; Feroz, N.; Casalino, G. Enabling Technologies for Urban Smart Mobility: Recent Trends, Opportunities and Challenges. Sensors 2021, 21, 1–45. [CrossRef]
- Coching, J.K.; Pe, A.J.L.; Yeung, S.G.D.; Ang, C.M.L.; Concepcion, R.S.; Billones, R.K.C. License Plate Recognition System for Improved Logistics Delivery in a Supply Chain with Solution Validation through Digital Twin Modeling. In Proceedings of the 2023 IEEE 15th International Conference on Humanoid, Nanotechnology, Information Technology, Communication and Control, Environment, and Management (HNICEM); November 2023; pp. 1–6.
- Gouveia, J.P.; Seixas, J.; Giannakidis, G. Smart City Energy Planning: Integrating Data and Tools.; 2016; pp. 345–350.
- Billones, R.K.C.; Bandala, A.A.; Sybingco, E.; Lim, L.A.G.; Dadios, E.P. Intelligent System Architecture for a Vision-Based Contactless Apprehension of Traffic Violations.; 2017; pp. 1871–1874.
- Billones, R.K.C.; Guillermo, M.A.; Lucas, K.C.; Era, M.D.; Dadios, E.P.; Fillone, A.M. Smart Region Mobility Framework. Sustain. Switz. 2021, 13. [CrossRef]
- Ismagilova, E.; Hughes, L.; Dwivedi, Y.K.; Raman, K.R. Smart Cities: Advances in Research—An Information Systems Perspective. Int. J. Inf. Manag. 2019, 47, 88–100. [CrossRef]
- Bodum, L.; Moreno, D. UNIVERSITIES AS SMART CITY DRIVERS in SMALL and MEDIUM-SIZED CITIES.; 2019; Vol. 4, pp. 11–18.
- Ibrahim, A.S.; Youssef, K.Y.; Eldeeb, A.H.; Abouelatta, M.; Kamel, H. Adaptive Aggregation Based IoT Traffic Patterns for Optimizing Smart City Network Performance. Alex. Eng. J. 2022, 61, 9553–9568. [CrossRef]
- Chen, G.; Zhang, J. Applying Artificial Intelligence and Deep Belief Network to Predict Traffic Congestion Evacuation Performance in Smart Cities. Appl. Soft Comput. 2022, 121. [CrossRef]
- Bibri, S.E.; Krogstie, J. Smart Sustainable Cities of the Future: An Extensive Interdisciplinary Literature Review. Sustain. Cities Soc. 2017, 31, 183–212. [CrossRef]
- Austria, Y.D.; Acerado, J.K.A.; Butac, A.A.L.; Cariño, C.F.M.; Marquez, C.M.T.; Mirabueno, M.C.A. Spotsecure: Parking Reservation System with Plate Number Recognition through Image Processing. In Proceedings of the Sixth International Conference on Image, Video Processing, and Artificial Intelligence (IVPAI 2024); SPIE, 2024; Vol. 13225, pp. 133–138.
- Coching, J.K.; Yeung, S.G.D.; Valencia, I.J.C.; Fillone, A.M.; Concepcion II, R.S.; Billones, R.K.C.; Dadios, E.P. Data Modeling and Integration for a Parking Management System with License Plate Recognition. In Proceedings of the International Conference on Intelligent Computing & Optimization; Springer, 2023; pp. 351–360.
- Paidi, V.; Håkansson, J.; Fleyeh, H.; Nyberg, R.G. CO2 Emissions Induced by Vehicles Cruising for Empty Parking Spaces in an Open Parking Lot. Sustainability 2022, 14, 3742.
- Puspitasari, D.; Noprianto; Hendrawan, M.A.; Asmara, R.A. Development of Smart Parking System Using Internet of Things Concept. Indones. J. Electr. Eng. Comput. Sci. 2021, 24, 611–620. [CrossRef]
- Cai, B.Y.; Alvarez, R.; Sit, M.; Duarte, F.; Ratti, C. Deep Learning-Based Video System for Accurate and Real-Time Parking Measurement. IEEE Internet Things J. 2019, 6, 7693–7701. [CrossRef]
- Sneha Channamallu, S.; Kermanshachi, S.; Michael Rosenberger, J.; Pamidimukkala, A. Enhancing Urban Parking Efficiency Through Machine Learning Model Integration. IEEE Access 2024, 12, 81338–81347. [CrossRef]
- Daoudagh, S.; Marchetti, E.; Savarino, V.; Bernabe, J.B.; García-Rodríguez, J.; Moreno, R.T.; Martinez, J.A.; Skarmeta, A.F. Data Protection by Design in the Context of Smart Cities: A Consent and Access Control Proposal. Sensors 2021, 21, 7154.
- Hoofnagle, C.J.; Van Der Sloot, B.; Borgesius, F.Z. The European Union General Data Protection Regulation: What It Is and What It Means. Inf. Commun. Technol. Law 2019, 28, 65–98.
- Martin, K.D.; Palmatier, R.W. Data Privacy in Retail: Navigating Tensions and Directing Future Research. J. Retail. 2020, 96, 449–457. [CrossRef]
- Syahla, H.D.; Ogi, D. Implementation of Secure Parking Based on Cyber-Physical System Using One-Time Password Gong et al. Scheme to Overcome Replay Attack. In Proceedings of the 2021 International Conference on ICT for Smart Society (ICISS); IEEE, 2021; pp. 1–6.
- Garagad, V.G.; Iyer, N.C.; Wali, H.G. Data Integrity: A Security Threat for Internet of Things and Cyber-Physical Systems. In Proceedings of the 2020 International Conference on Computational Performance Evaluation (ComPE); IEEE, 2020; pp. 244–249.
- Clever, S.; Crago, T.; Polka, A.; Al-Jaroodi, J.; Mohamed, N. Ethical Analyses of Smart City Applications. Urban Sci. 2018, 2, 96. [CrossRef]
- Surette, R. The Thinking Eye: Pros and Cons of Second Generation CCTV Surveillance Systems. Policing 2005, 28, 152–173. [CrossRef]
- Jovanović, D.; Milovanov, S.; Ruskovski, I.; Govedarica, M.; Sladić, D.; Radulović, A.; Pajić, V. Building Virtual 3D City Model for Smart Cities Applications: A Case Study on Campus Area of the University of Novi Sad. ISPRS Int. J. Geo-Inf. 2020, 9, 476.
- Sakurada, L.; Barbosa, J.; Leitão, P.; Alves, G.; Borges, A.P.; Botelho, P. Development of Agent-Based CPS for Smart Parking Systems. In Proceedings of the IECON 2019 - 45th Annual Conference of the IEEE Industrial Electronics Society; October 2019; Vol. 1, pp. 2964–2969.
- Zou, Y.; Ye, F.; Li, A.; Munir, M.; Sujan, S.; Hjelseth, E. A Digital Twin Prototype for Smart Parking Management 2022.
- Alam, M.R.; Saha, S.; Bostami, M.B.; Islam, M.S.; Aadeeb, M.S.; Islam, A.K.M.M. A Survey on IoT Driven Smart Parking Management System: Approaches, Limitations and Future Research Agenda. IEEE Access 2023, 11, 119523–119543. [CrossRef]
- Heimberger, M.; Horgan, J.; Hughes, C.; McDonald, J.; Yogamani, S. Computer Vision in Automated Parking Systems: Design, Implementation and Challenges. Image Vis. Comput. 2017, 68, 88–101. [CrossRef]
- Jung, I.H.; Lee, J.-M.; Hwang, K. Advanced Smart Parking Management System Development Using AI. J. Syst. Manag. Sci. 2022, 12, 53–62. [CrossRef]
- Saeliw, A.; Hualkasin, W.; Puttinaovarat, S.; Khaimook, K. Smart Car Parking Mobile Application Based on RFID and IoT; International Association of Online Engineering, 2019; pp. 4–14;
- Orencia, A.A.B.; Coching, J.K.; Matias, A.P.D.; Dadios, E.P.; Baldovino, R.G.; Billones, R.K.C. A Comparative Study on the Use of Raw and Filtered Images for Multi-Class Image Classification.; 2021.
- Coching, J.K.; Pe, A.J.L.; Yeung, S.G.D.; Akeboshi, W.W.N.; Brillantes, A.K.; Valencia, I.J.C.; Fillone, A.M.; Billones, R.K.C.; Dadios, E.P. Merged Application of YOLOv7 Object Detection and Deep Text Recognition for Four-Wheeled Vehicle License Plate Recognition.; 2023.
- Kumar, K.N.; Pawar, D.S.; Mohan, C.K. Open-Air Off-Street Vehicle Parking Management System Using Deep Neural Networks: A Case Study. In Proceedings of the 2022 14th International Conference on COMmunication Systems & NETworkS (COMSNETS); January 2022; pp. 800–805.
- Song, Y.; Zeng, J.; Wu, T.; Ni, W.; Liu, R.P. Vision-Based Parking Space Detection: A Mask R-CNN Approach.; 2021; pp. 300–305.
- Almeida, P.R.L. de; Alves, J.H.; Parpinelli, R.S.; Barddal, J.P. A Systematic Review on Computer Vision-Based Parking Lot Management Applied on Public Datasets. Expert Syst. Appl. 2022, 198, 116731. [CrossRef]
- Mustafa, H.A.; Hassanin, S.; Al-Yaman, M. Automatic Jordanian License Plate Recognition System Using Multistage Detection. In Proceedings of the 2018 15th International Multi-Conference on Systems, Signals & Devices (SSD); IEEE, 2018; pp. 1228–1233.
- Lee, H.; Chatterjee, I.; Cho, G. A Systematic Review of Computer Vision and AI in Parking Space Allocation in a Seaport. MDPI 2023, 13, 1–17. [CrossRef]
- Chowdhury, D.; Mandal, S.; Das, D.; Banerjee, S.; Shome, S.; Choudhary, D. An Adaptive Technique for Computer Vision Based Vehicles License Plate Detection System.; 2019.
- Lim, D.; Park, D. AI Analysis of Illegal Parking Data at Seocho City. In Data Science and Digital Transformation in the Fourth Industrial Revolution; Kim, J., Lee, R., Eds.; Studies in Computational Intelligence; Springer International Publishing: Cham, 2021; pp. 165–178 ISBN 978-3-030-64769-8.
- Hüsser, O.; Bologna, G.; Menoud, P.; Sadiku, A.; Pfeiffer, L.; Foukia, N.; Rekik, Y.A.; Clément, D. PreGIS: A Platform for Urban Parking Analysis and Management.; 2021; Vol. 3116.
- Karbouj, B.; Topalian-Rivas, G.A.; Krüger, J. Comparative Performance Evaluation of One-Stage and Two-Stage Object Detectors for Screw Head Detection and Classification in Disassembly Processes. Procedia CIRP 2024, 122, 527–532. [CrossRef]
- Hussain, M. YOLO-v1 to YOLO-v8, the Rise of YOLO and Its Complementary Nature toward Digital Manufacturing and Industrial Defect Detection. Machines 2023, 11, 677. [CrossRef]
- Ren, S.; He, K.; Girshick, R.; Sun, J. Faster R-CNN: Towards Real-Time Object Detection with Region Proposal Networks. IEEE Trans. Pattern Anal. Mach. Intell. 2017, 39, 1137–1149. [CrossRef]
- Liu, W.; Anguelov, D.; Erhan, D.; Szegedy, C.; Reed, S.; Fu, C.-Y.; Berg, A.C. SSD: Single Shot Multibox Detector. Lect. Notes Comput. Sci. Subser. Lect. Notes Artif. Intell. Lect. Notes Bioinforma. 2016, 9905 LNCS, 21–37. [CrossRef]
- Yuldashev, Y.; Mukhiddinov, M.; Abdusalomov, A.B.; Nasimov, R.; Cho, J. Parking Lot Occupancy Detection with Improved MobileNetV3. Sensors 2023, 23, 7642. [CrossRef]
- Grbić, R.; Koch, B. Automatic Vision-Based Parking Slot Detection and Occupancy Classification. Expert Syst. Appl. 2023, 225, 120147. [CrossRef]
- Labi, S.; Saneii, M.; Tarighati Tabesh, M.; Pourgholamali, M.; Miralinaghi, M. Parking Infrastructure Location Design and User Pricing in the Prospective Era of Autonomous Vehicle Operations. J. Infrastruct. Syst. 2023, 29, 04023025. [CrossRef]
- Lin, C.-J.; Jeng, S.-Y.; Lioa, H.-W. A Real-Time Vehicle Counting, Speed Estimation, and Classification System Based on Virtual Detection Zone and YOLO. Math. Probl. Eng. 2021, 2021. [CrossRef]
- Awad, A.; Hegazy, M.; Aly, S.A. Early Diagnoses of Acute Lymphoblastic Leukemia Using YOLOv8 and YOLOv11 Deep Learning Models 2024.
- Wang, C.-Y.; Bochkovskiy, A.; Liao, H.-Y.M. YOLOv7: Trainable Bag-of-Freebies Sets New State-of-the-Art for Real-Time Object Detectors 2022.
- Gillani, I.S.; Munawar, M.R.; Talha, M.; Azhar, S.; Mashkoor, Y.; Uddin, M.S.; Zafar, U. Yolov5, Yolo-x, Yolo-r, Yolov7 Performance Comparison: A Survey. Artif. Intell. Fuzzy Log. Syst. 2022, 17–28. [CrossRef]
- Nazir, A.; Wani, Mohd.A. You Only Look Once - Object Detection Models: A Review. In Proceedings of the 2023 10th International Conference on Computing for Sustainable Global Development (INDIACom); March 2023; pp. 1088–1095.
- Jose, J.A.C.; Billones, C.D., Jr.; Brillantes, A.K.M.; Billones, R.K.C.; Sybingco, E.; Dadios, E.P.; Fillone, A.M.; Gan Lim, L.A. Artificial Intelligence Software Application for Contactless Traffic Violation Apprehension in the Philippines. J. Adv. Comput. Intell. Intell. Inform. 2021, 25, 410–415. [CrossRef]
- Rusakov, K.D. Automatic Modular License Plate Recognition System Using Fast Convolutional Neural Networks.; 2020.
- Billones, R.K.C.; Bandala, A.A.; Gan Lim, L.A.; Sybingco, E.; Fillone, A.M.; Dadios, E.P. Visual Percepts Quality Recognition Using Convolutional Neural Networks. In Proceedings of the Advances in Computer Vision: Proceedings of the 2019 Computer Vision Conference (CVC), Volume 2 1; Springer, 2020; pp. 652–665.
- Amon, M.C.E.; Brillantes, A.K.M.; Billones, C.D.; Billones, R.K.C.; Jose, J.A.; Sybingco, E.; Dadios, E.; Fillone, A.; Lim, L.G.; Bandala, A. Philippine License Plate Character Recognition Using Faster R-CNN with InceptionV2. In Proceedings of the 2019 IEEE 11th International Conference on Humanoid, Nanotechnology, Information Technology, Communication and Control, Environment, and Management ( HNICEM ); IEEE, November 2019; pp. 1–4.
- Spanu, M.; Bertolusso, M.; Bingol, G.; Serreli, L.; Castangia, C.G.; Anedda, M.; Fadda, M.; Farina, M.; Giusto, D.D. Smart Cities Mobility Monitoring through Automatic License Plate Recognition and Vehicle Discrimination.; 2021; Vol. 2021-August.
- Baek, J.; Kim, G.; Lee, J.; Park, S.; Han, D.; Yun, S.; Oh, S.J.; Lee, H. What Is Wrong With Scene Text Recognition Model Comparisons? Dataset and Model Analysis. In Proceedings of the 2019 IEEE/CVF International Conference on Computer Vision (ICCV); October 2019; pp. 4714–4722.
- Shi, B.; Bai, X.; Yao, C. An End-to-End Trainable Neural Network for Image-Based Sequence Recognition and Its Application to Scene Text Recognition. IEEE Trans. Pattern Anal. Mach. Intell. 2017, 39, 2298–2304. [CrossRef]
- Kim, J.; Moon, Y.-J.; Suh, I.-S. Smart Mobility Strategy in Korea on Sustainability, Safety and Efficiency Toward 2025. IEEE Intell. Transp. Syst. Mag. 2015, 7, 58–67. [CrossRef]
- Lin, C.-J.; Jhang, J.-Y. Intelligent Traffic-Monitoring System Based on YOLO and Convolutional Fuzzy Neural Networks. IEEE Access 2022, 10, 14120–14133. [CrossRef]
- Billones, R.K.C.; Bandala, A.A.; Sybingco, E.; Gan Lim, L.A.; Fillone, A.D.; Dadios, E.P. Vehicle Detection and Tracking Using Corner Feature Points and Artificial Neural Networks for a Vision-Based Contactless Apprehension System. In Proceedings of the 2017 Computing Conference; July 2017; pp. 688–691.
- Al-Absi, H.R.H.; Devaraj, J.D.D.; Sebastian, P.; Voon, Y.V. Vision-Based Automated Parking System. In Proceedings of the 10th International Conference on Information Science, Signal Processing and their Applications (ISSPA 2010); May 2010; pp. 757–760.
- Phuong, T.V.; Tran, C.; Vo, T.; Nguyen, K.-D.; Vo, N.D. Real-Time Vehicle Detection Using Surveillance Cameras: An Empirical Evaluation in Vietnamese Traffic Scenes. In Proceedings of the 2024 13th International Conference on Control, Automation and Information Sciences (ICCAIS); IEEE, 2024; pp. 1–6.
- Cero, C.D.L.; Sybingco, E.; Brillantes, A.K.M.; Amon, M.C.E.; Puno, J.C.V.; Billones, R.K.C.; Dadios, E.; Bandala, A.A. Optimization of Vehicle Classification Model Using Genetic Algorithm. In Proceedings of the 2019 IEEE 11th international conference on humanoid, nanotechnology, information technology, communication and control, environment, and management (HNICEM); IEEE, 2019; pp. 1–4.
- Jose, J.A.C.; Brillantes, A.K.M.; Dadios, E.P.; Sybingco, E.; Lim, L.A.G.; Fillone, A.M.; Billones, R.K.C. Recognition of Hybrid Graphic-Text License Plates. J. Adv. Comput. Intell. Intell. Inform. 2021, 25, 416–422. [CrossRef]
- Islam, T.; Rasel, R.I. Real-Time Bangla License Plate Recognition System Using Faster R-CNN and SSD: A Deep Learning Application.; 2019; pp. 108–111.
- Awalgaonkar, N.; Bartakke, P.; Chaugule, R. Automatic License Plate Recognition System Using SSD. In Proceedings of the 2021 International Symposium of Asian Control Association on Intelligent Robotics and Industrial Automation (IRIA); September 2021; pp. 394–399.
- Rosales, M.A.; Jo-ann, V.M.; Palconit, M.G.B.; Culaba, A.B.; Dadios, E.P. Artificial Intelligence: The Technology Adoption and Impact in the Philippines. In Proceedings of the 2020 IEEE 12th international conference on humanoid, nanotechnology, information technology, communication and control, environment, and management (HNICEM); IEEE, 2020; pp. 1–6.
- Daliyanto, B.; Pratama, Moh.D.Y.; Hariadi, F.I.; Adjiarto, W. Smart Outdoor Parking System: Case of Institute of Technology Bandung Parking Space. In Proceedings of the 2021 International Symposium on Electronics and Smart Devices (ISESD); June 2021; pp. 1–9.
- Alhaj Mustafa, H.; Hassanin, S.; Al-Yaman, M. Automatic Jordanian License Plate Recognition System Using Multistage Detection.; 2018; pp. 1228–1233.
- Brillantes, A.K.; Billones, C.D.; Amon, M.C.; Cero, C.; Jose, J.A.C.; Billones, R.K.C.; Dadios, E. Philippine License Plate Detection and Classification Using Faster R-CNN and Feature Pyramid Network. In Proceedings of the 2019 IEEE 11th International Conference on Humanoid, Nanotechnology, Information Technology, Communication and Control, Environment, and Management ( HNICEM ); November 2019; pp. 1–5.
- Emmert-Streib, F.; Tripathi, S.; Dehmer, M. Analyzing the Scholarly Literature of Digital Twin Research: Trends, Topics and Structure. IEEE Access 2023, 11, 69649–69666. [CrossRef]
- Brucherseifer, E.; Winter, H.; Mentges, A.; Mühlhäuser, M.; Hellmann, M. Digital Twin Conceptual Framework for Improving Critical Infrastructure Resilience. - Autom. 2021, 69, 1062–1080. [CrossRef]
- Sampaio, R.P.; António, A.C.; Flores-Colen, I. A Systematic Review of Artificial Intelligence Applied to Facility Management in the Building Information Modeling Context and Future Research Directions. Buildings 2022, 12, 1939.
- Mewawalla, C. Thematic Research: Digital Twins; GlobalData, 2020; p. 53;
- He, F.; Ong, S.K.; Nee, A.Y.C. An Integrated Mobile Augmented Reality Digital Twin Monitoring System. Computers 2021, 10, 99. [CrossRef]
- Zhang, C.; Zhu, L.; Xu, C. BSDP: Blockchain-Based Smart Parking for Digital-Twin Empowered Vehicular Sensing Networks With Privacy Protection. IEEE Trans. Ind. Inform. 2022, 1–10. [CrossRef]
- Díaz-Vilariño, L.; Tran, H.; Frías, E.; Balado, J.; Khoshelham, K. 3D MAPPING OF INDOOR AND OUTDOOR ENVIRONMENTS USING APPLE SMART DEVICES.; 2022; Vol. 43, pp. 303–308.
- Ge, S.; Wang, Z.; Lo, Y.; Zhang, J.; Zang, R.; Zhang, C. Evaluation of Point Cloud Processing Software for 3D Reconstruction. In Proceedings of the Proceedings of the 24th International Symposium on Advancement of Construction Management and Real Estate; Ye, G., Yuan, H., Zuo, J., Eds.; Springer: Singapore, 2021; pp. 1267–1279.
- Khoshdelnezamiha, G.; Liew, S.C.; Bong, V.N.S.; Ong, D.E.L. Evaluation of Bim Application for Water Efficiency Assessment. J. Green Build. 2020, 15, 91–115. [CrossRef]
- Land Rover Discovery 4 - Car Automobile Vehicle SUV In Revit Available online: https://libraryrevit.com/rvt/land-rover-discovery-4-car-automobile-vehicle-suv/.
- Al-Nabhi, H.; Krishna, K.L.; Shareef, d A.A.A. Efficient CRNN Recognition Approaches for Defective Characters in Images. Int. J. Comput. Digit. Syst. 2022, 12, 1417–1427. [CrossRef]
- Dhabe, P.; Bhat, S.; Shivankar, I.; Shrivastava, T.; Sonawane, P.; Sutrave, R.; Mattoo, S. Real-Time Driving License Verification System Using Face Recognition. In Proceedings of the 2024 International Conference on Innovations and Challenges in Emerging Technologies (ICICET); IEEE, 2024; pp. 1–6.
- Meralco Rates Archives Available online: https://company.meralco.com.ph/news-and-advisories/rates-archives.
- Economic Research Institute Retail Cashier Salary in Manila, Philippines Available online: https://www.erieri.com/salary/job/retail-cashier/philippines/manila (accessed on 25 February 2025).
Figure 1.
A smart parking management system uses sensors and equipment to collect vehicle activity data, which is processed and stored on a centralized server. This data is then made accessible to client devices, such as mobile apps or display systems [31].
Figure 1.
A smart parking management system uses sensors and equipment to collect vehicle activity data, which is processed and stored on a centralized server. This data is then made accessible to client devices, such as mobile apps or display systems [31].
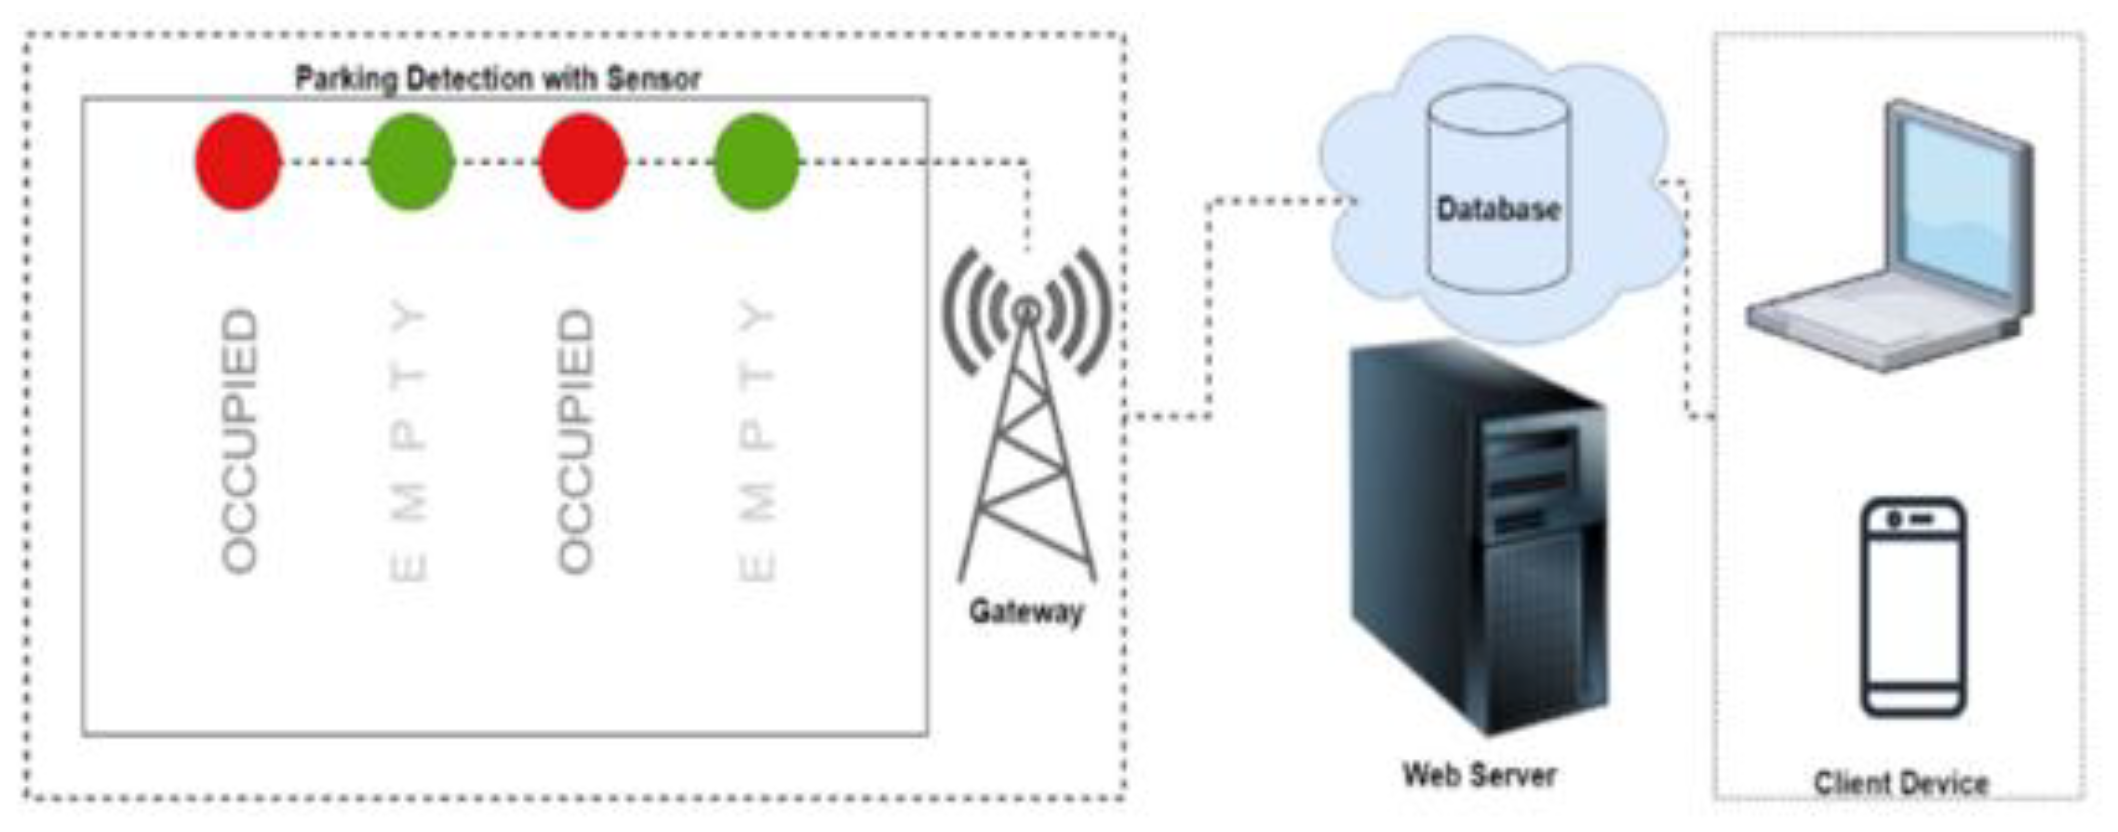
Figure 2.
This method focuses on identifying parking space status rather than detecting individual vehicles. It classifies spaces as either "Occupied" or "Vacant" using images for inference. The dataset utilized for this approach is the PKLot online dataset [49].
Figure 2.
This method focuses on identifying parking space status rather than detecting individual vehicles. It classifies spaces as either "Occupied" or "Vacant" using images for inference. The dataset utilized for this approach is the PKLot online dataset [49].
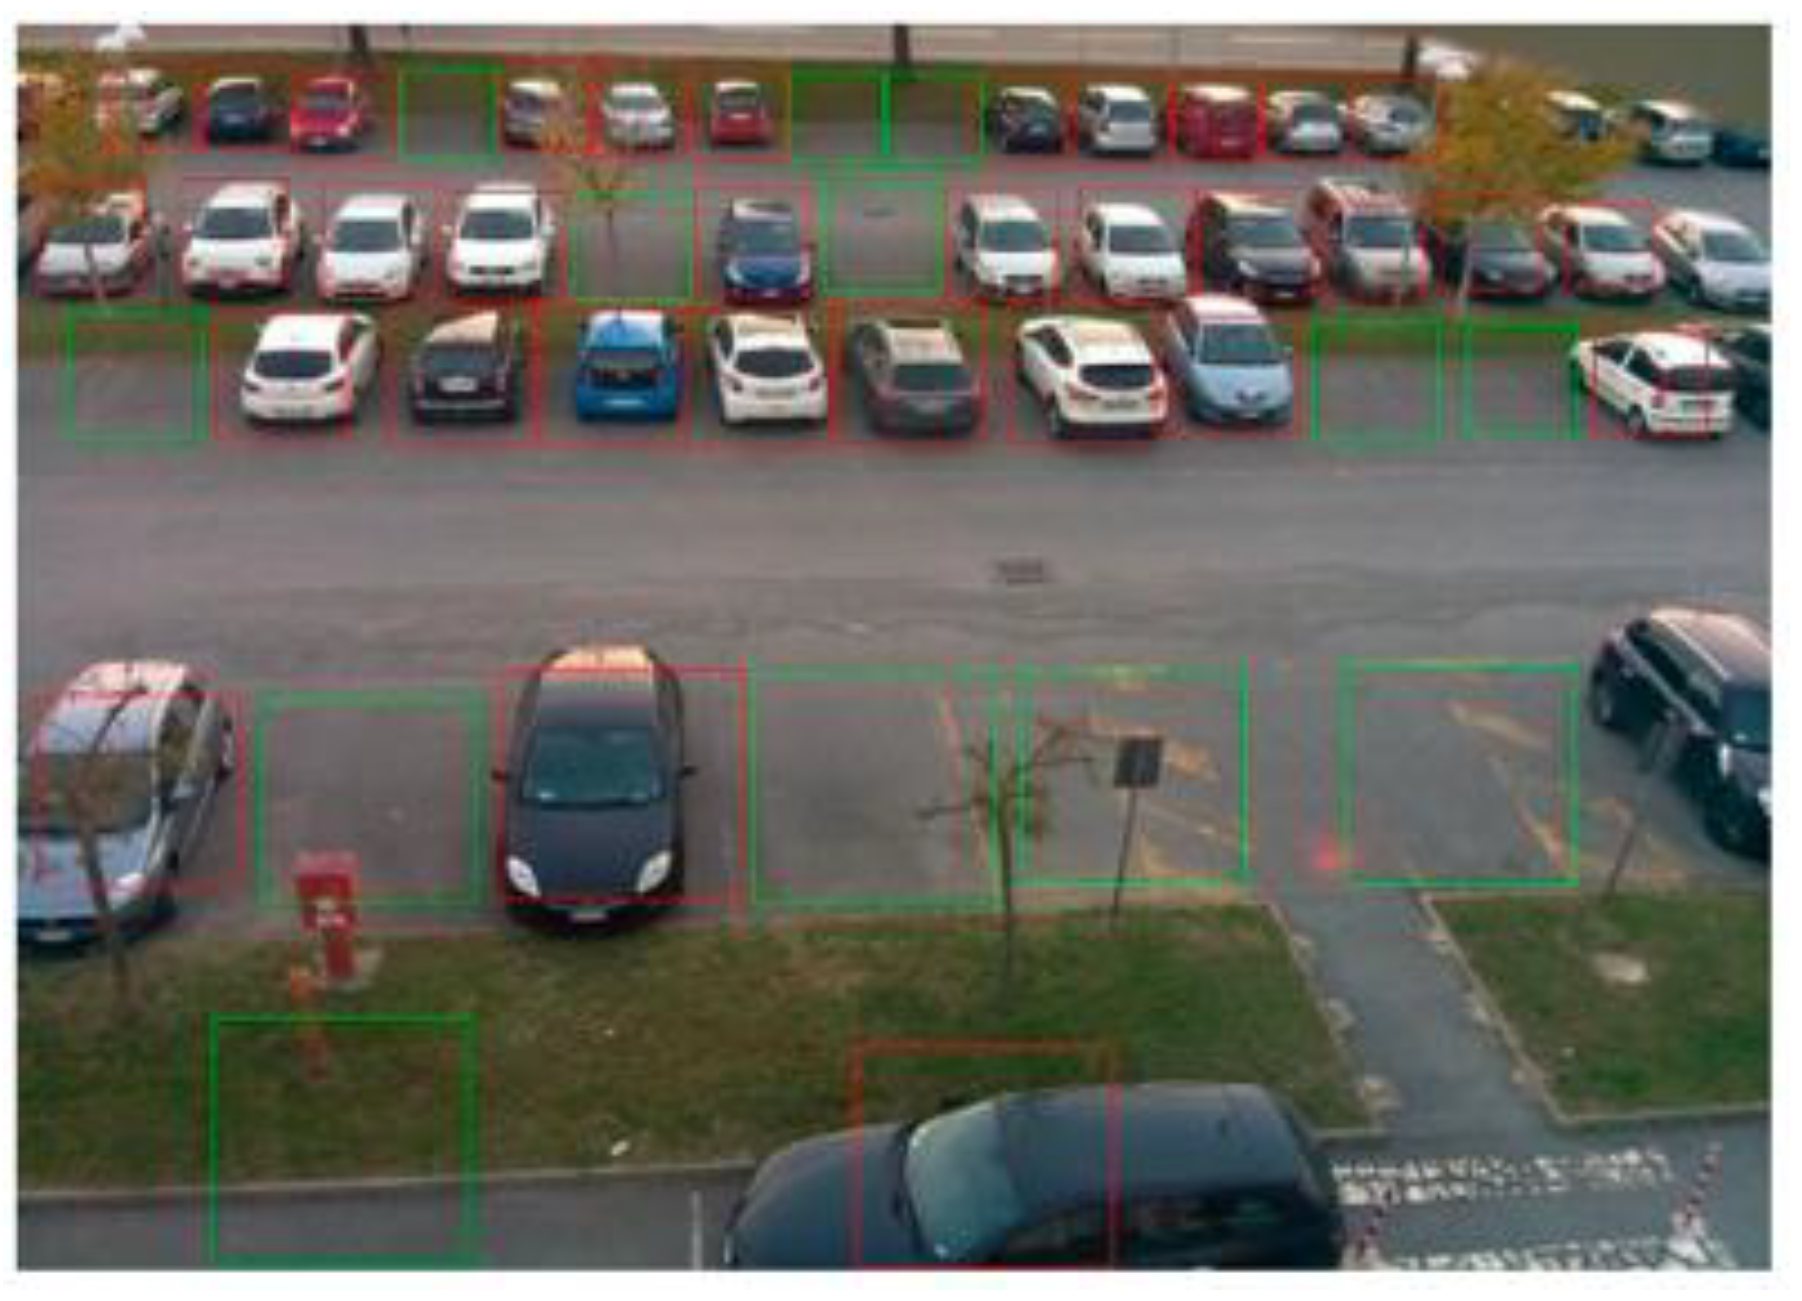
Figure 3.
Dual object detection implementation for parking space occupancy determination. (a) The pixel coordinate locations of parking spaces were determined using parking space object detection. (b) The presence of vehicles was subsequently detected through vehicle detection. (c) The parking space is deemed occupied if the algorithm determines that the detected vehicles are within the parking space. Otherwise, the parking space is deemed occupied [50].
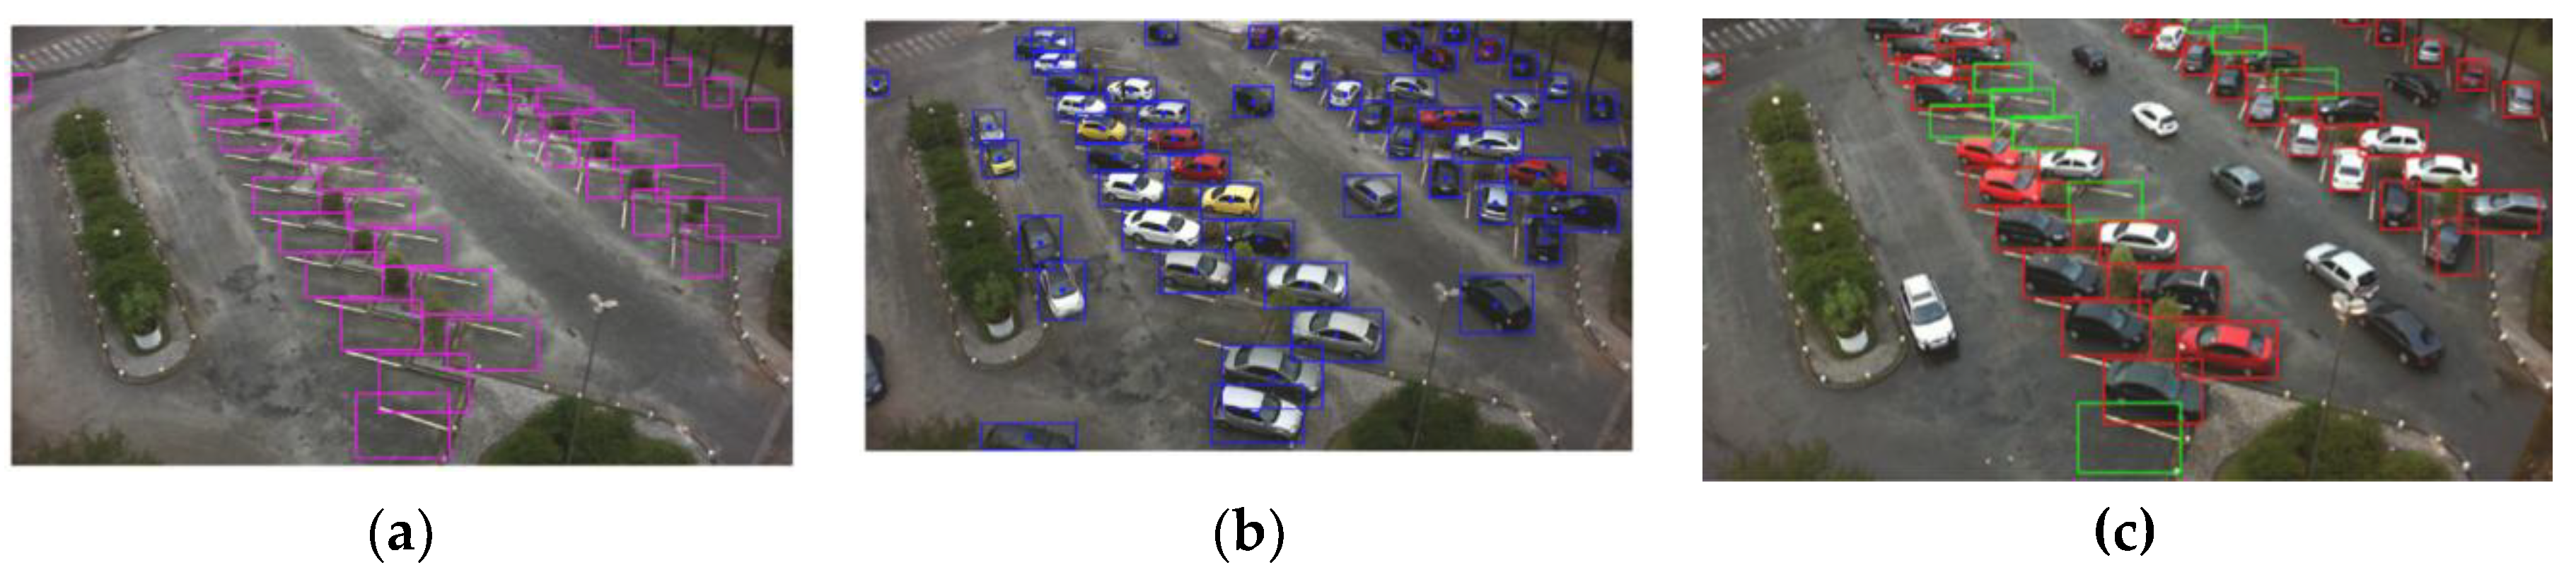
Figure 3.
YOLOv7 Architecture. The architecture has three elements: The Input, the Backbone Network, and the Head Network [56].
Figure 3.
YOLOv7 Architecture. The architecture has three elements: The Input, the Backbone Network, and the Head Network [56].
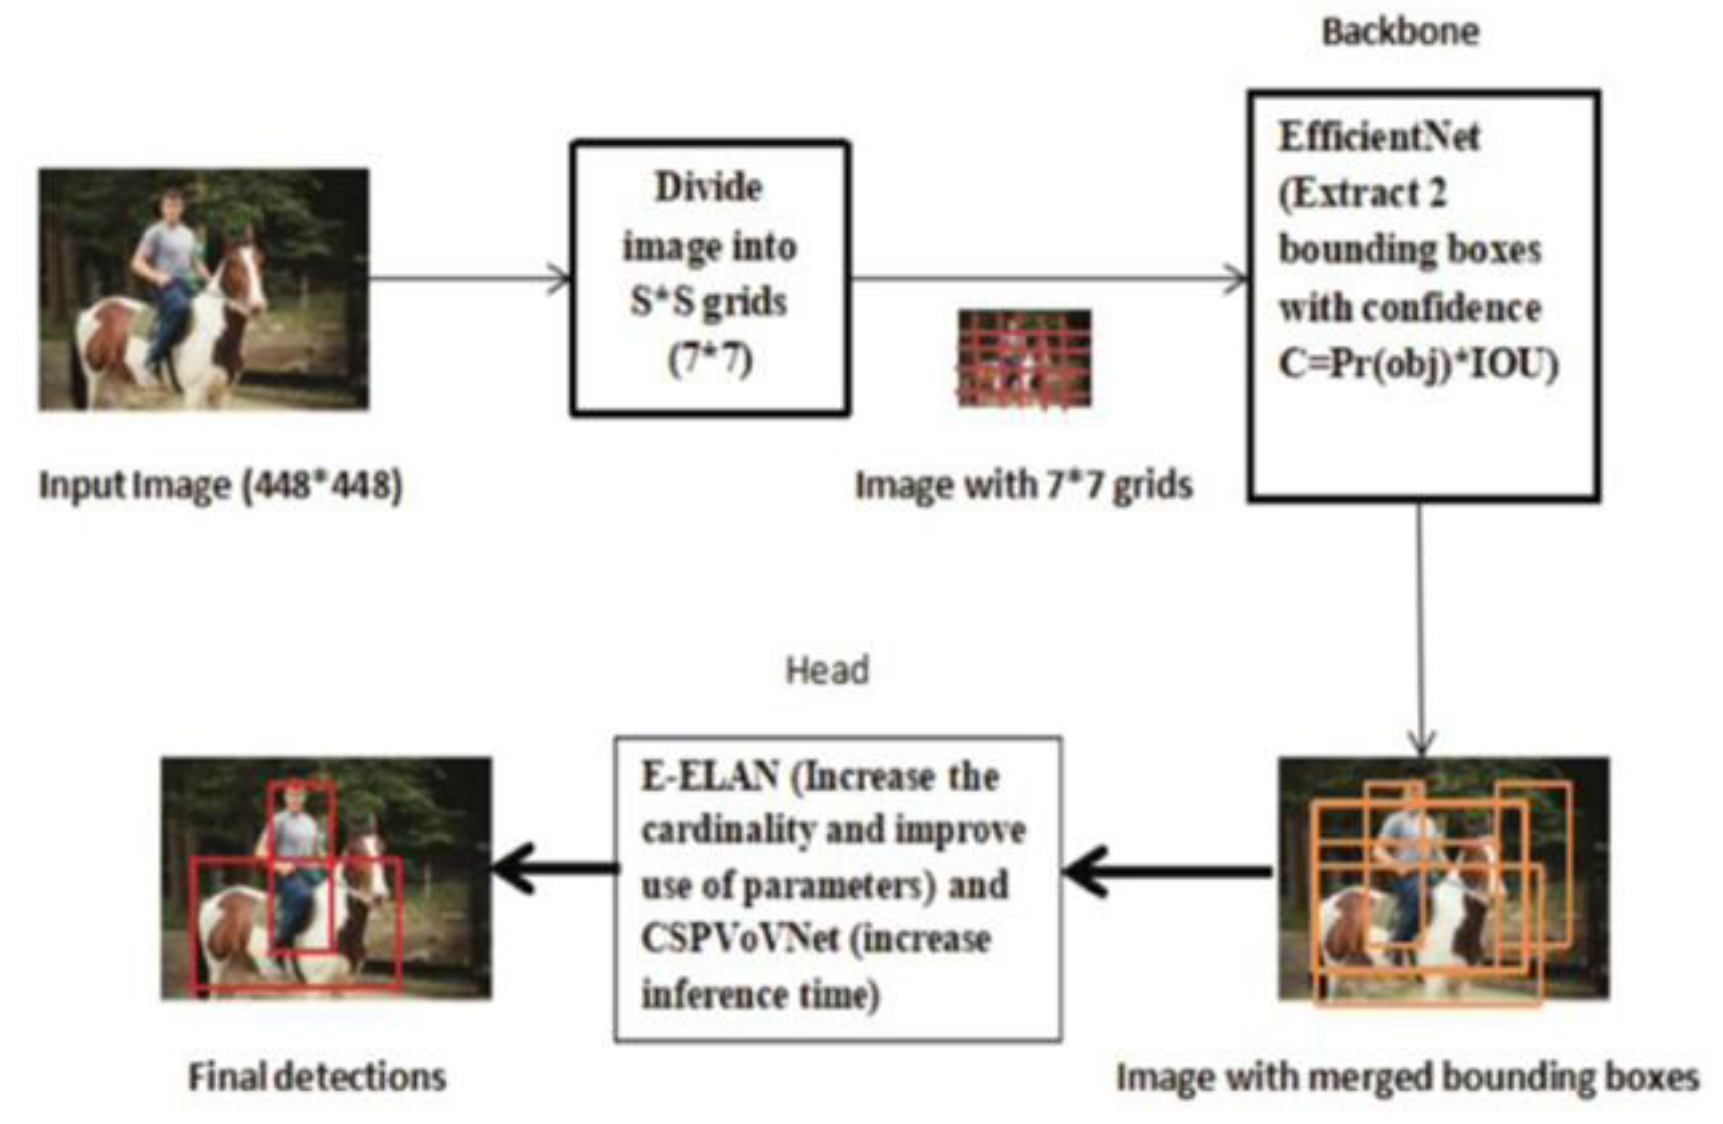
Figure 5.
LPR architecture. There are four phases in an LPR system: (1) license plate detection, (2) the digital cropping and isolation of the license plate, (3) character recognition, and (4) concatenating together extracted alphanumeric text into a string for the LPR reading [36].
Figure 5.
LPR architecture. There are four phases in an LPR system: (1) license plate detection, (2) the digital cropping and isolation of the license plate, (3) character recognition, and (4) concatenating together extracted alphanumeric text into a string for the LPR reading [36].
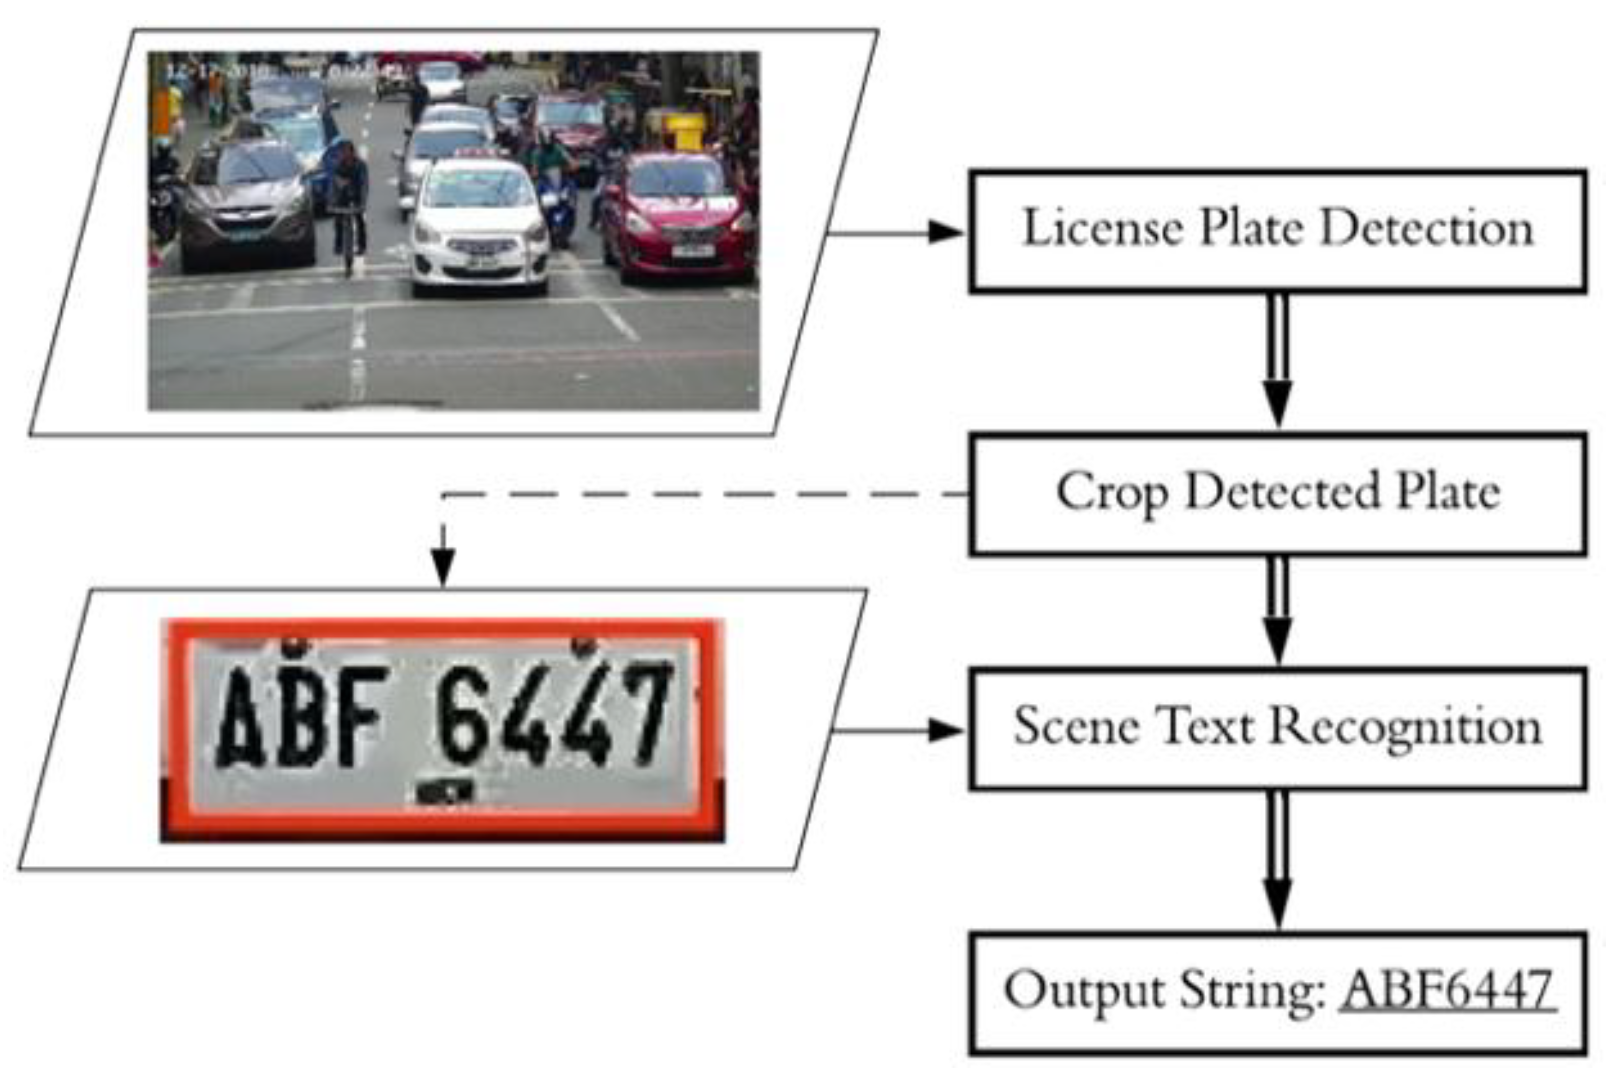
Figure 6.
Philippine License Plates. These are the four variations of Philippine license plates for cars. (a-c) The first three license plates are standard issued-license plates of the Philippine Land Transportation Office (LTO). (d) The last license plate is a temporary license plate based on the vehicle’s conduction sticker [57].
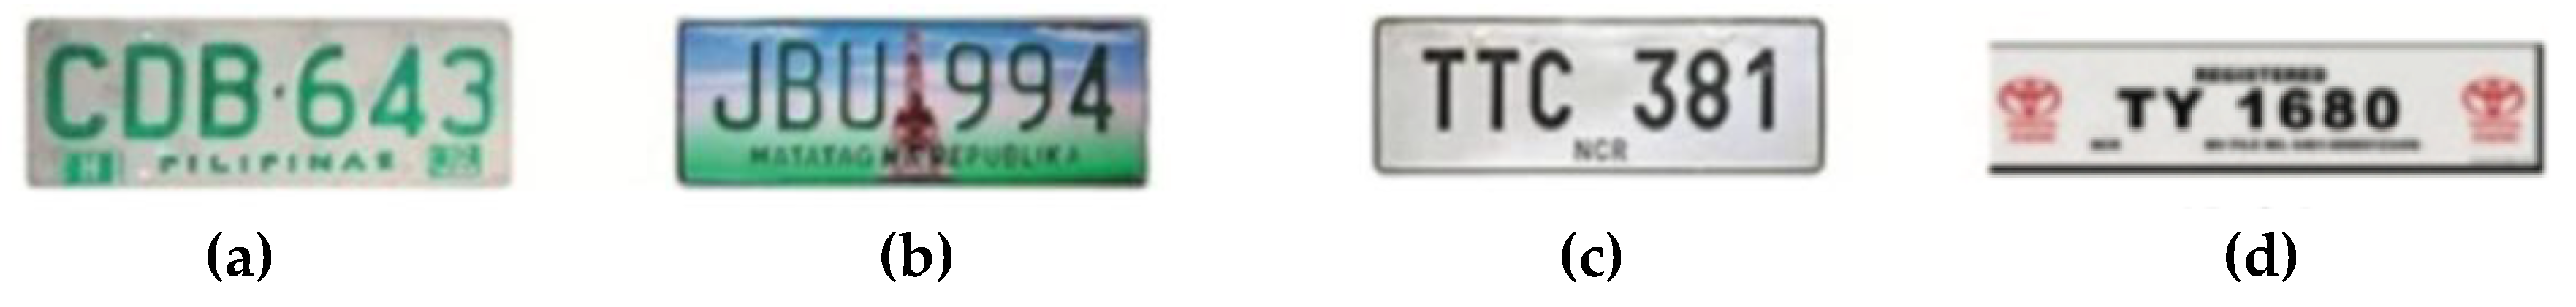
Figure 7.
Deep text recognition architecture. There are four stages that the input image undergoes: Transformation, Feature Extraction, Sequential Modeling, and Prediction [62].
Figure 7.
Deep text recognition architecture. There are four stages that the input image undergoes: Transformation, Feature Extraction, Sequential Modeling, and Prediction [62].
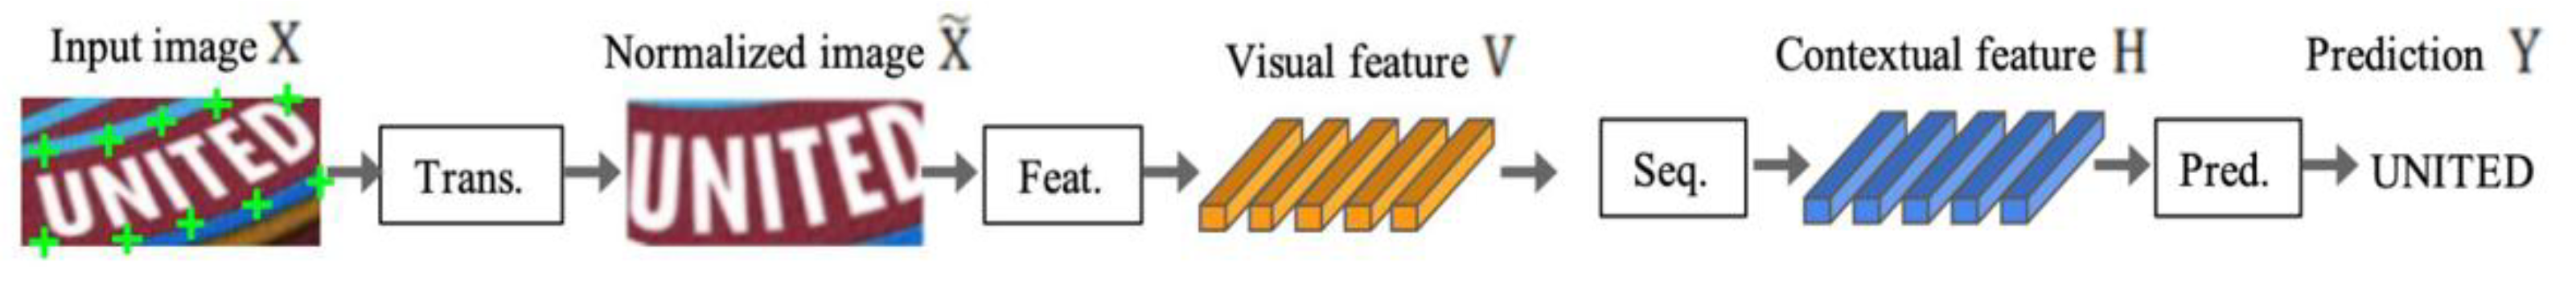
Figure 9.
Intelligent Inference Module of the Smart Parking Management System. The module has two primary functions: (1) parking occupancy determination using vehicle detection or license plate recognition; and (2) vehicle profiling for facility entry and exit monitoring.
Figure 9.
Intelligent Inference Module of the Smart Parking Management System. The module has two primary functions: (1) parking occupancy determination using vehicle detection or license plate recognition; and (2) vehicle profiling for facility entry and exit monitoring.
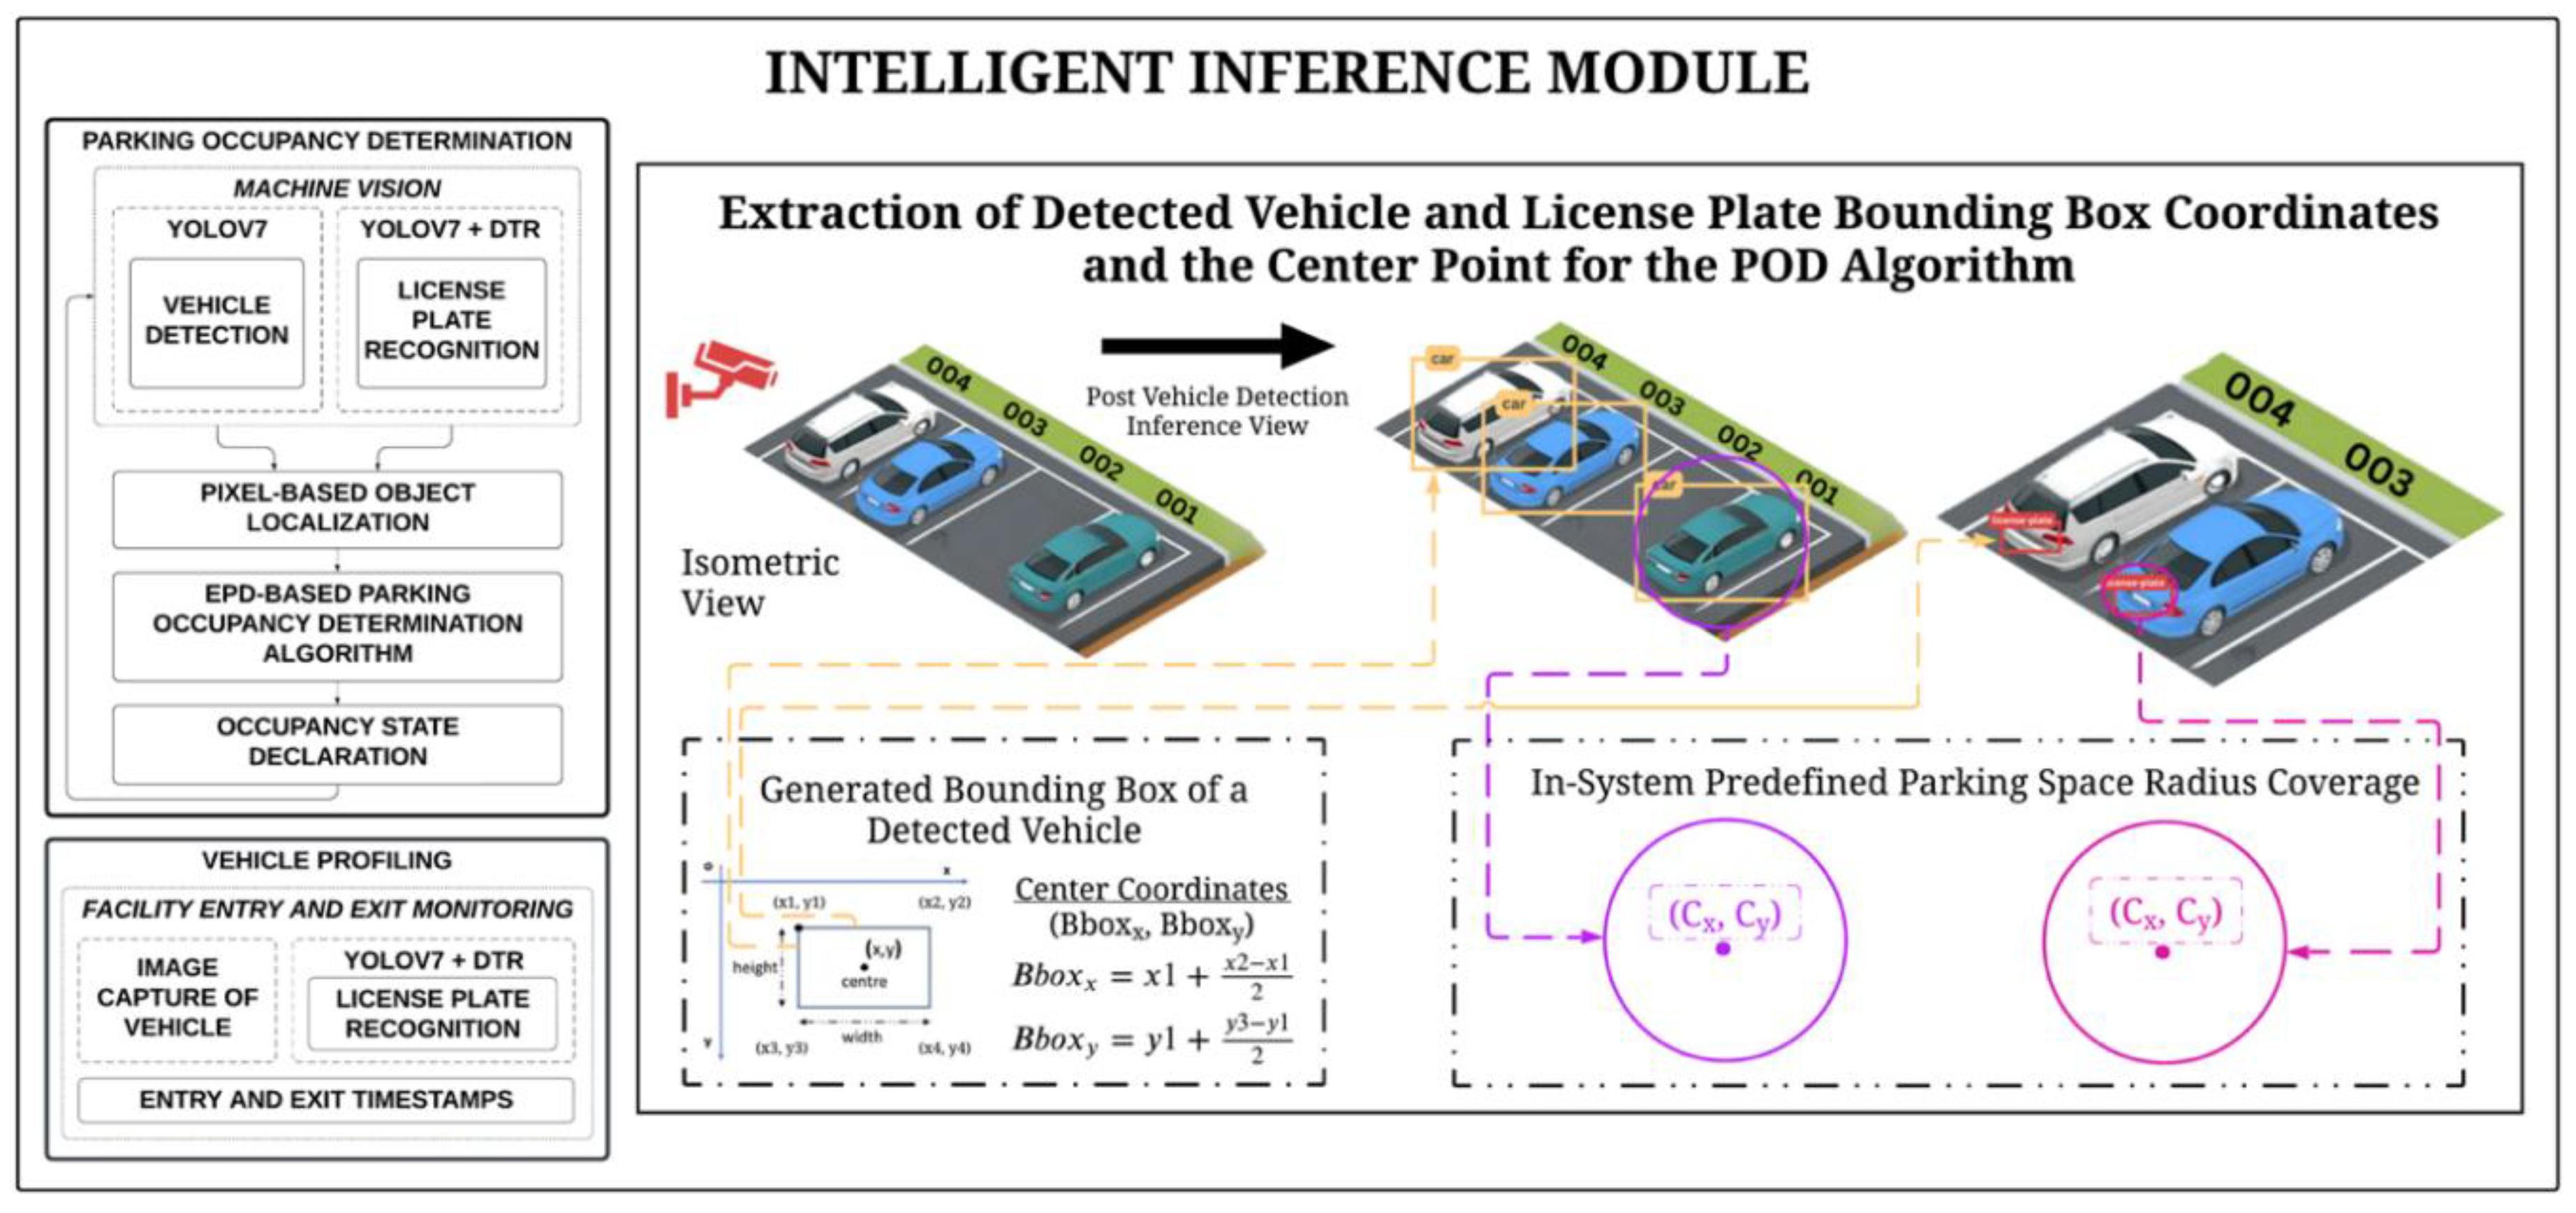
Figure 10.
SQL DB schema for two system features. (a) Tracks occupancy of seven parking spaces with individual tables storing vehicle start/end times and computed duration in hours. (b) Extends (a) with additional LPR_reading and license_plate fields in the pklot_overview and pklot_event tables for LPR.
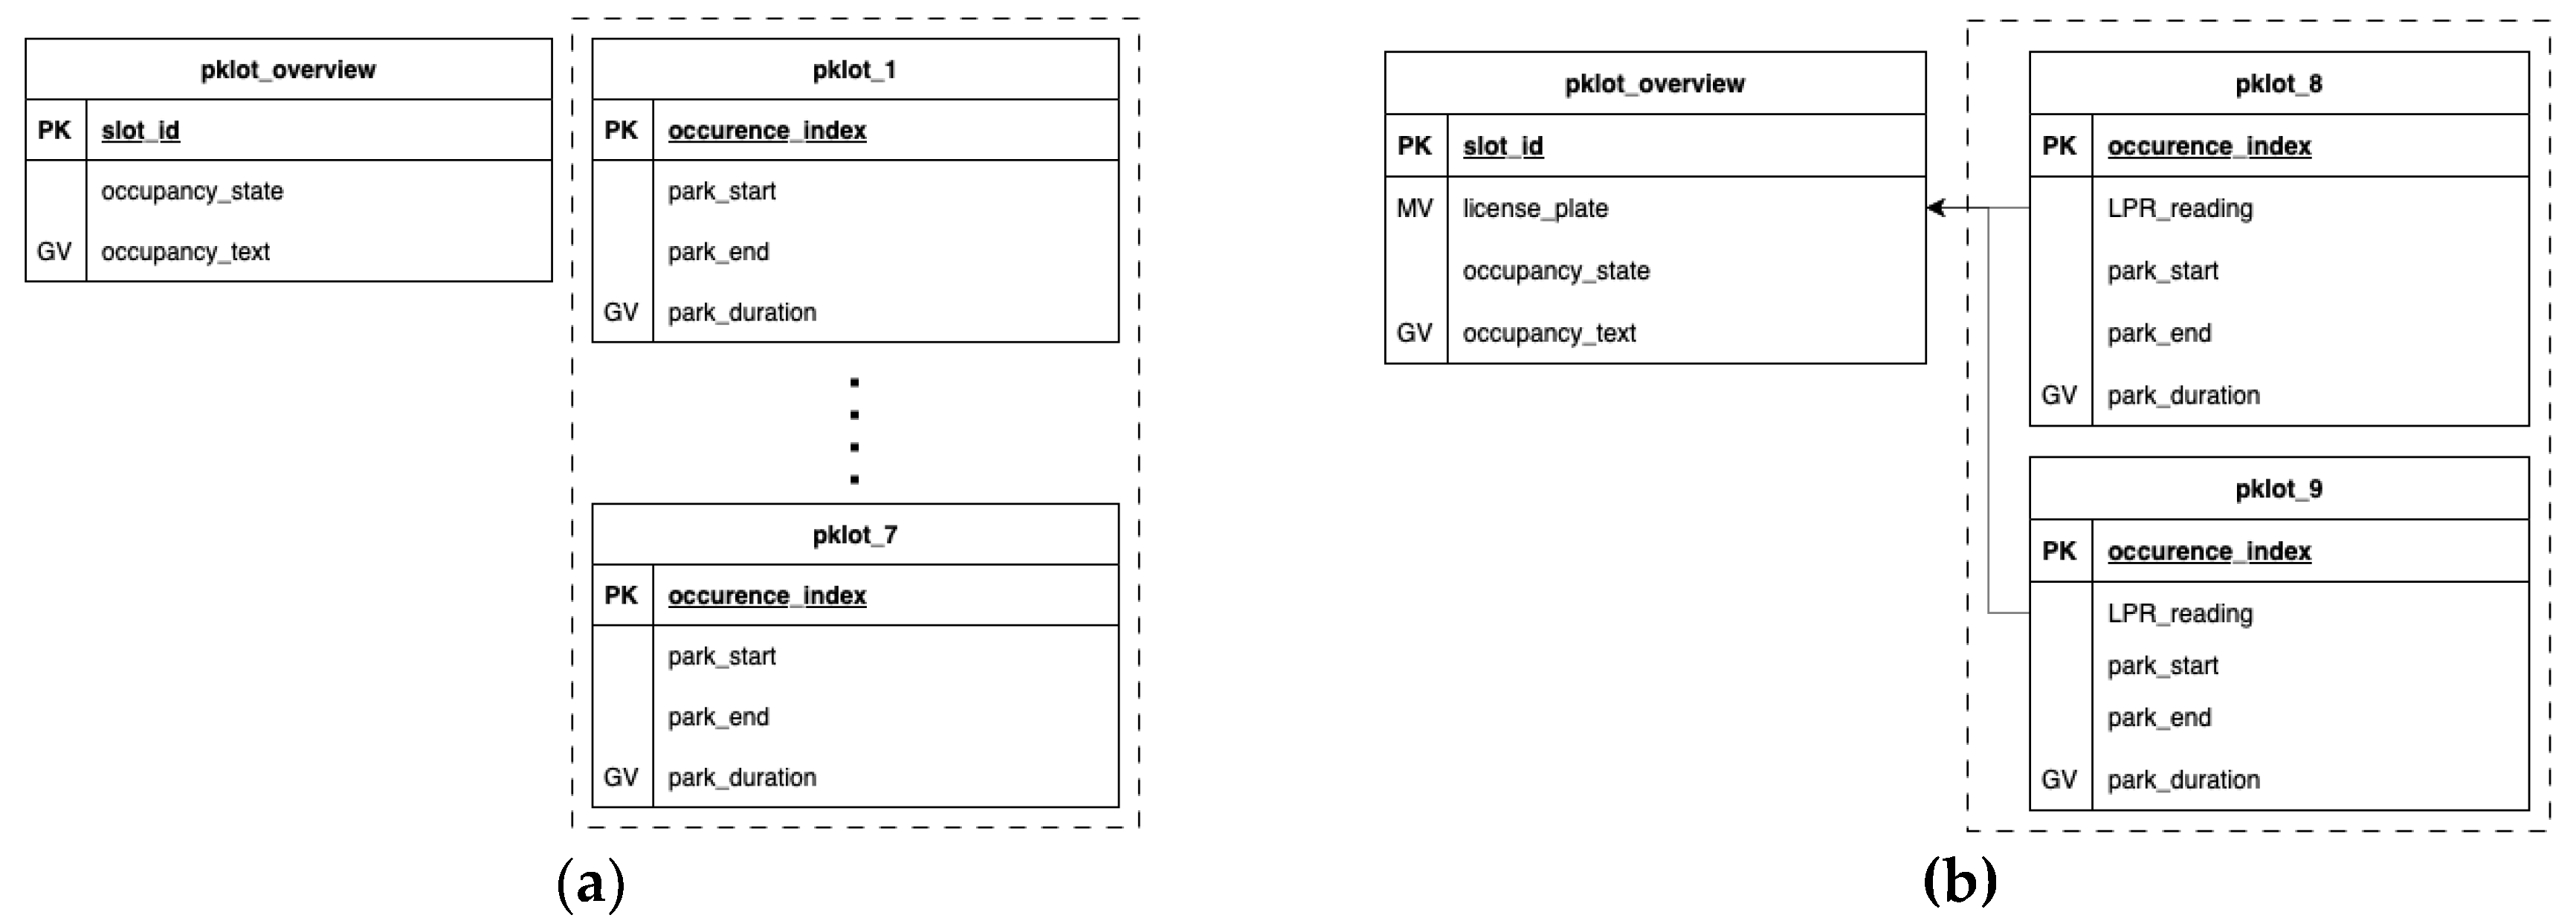
Figure 11.
SQL database schema for the second system feature. The data schema indicates an almost similar database structure to the first database. The difference is the inclusion of the LPR_reading and license_plate data attributes for pklot_overview and pklot event tables.
Figure 11.
SQL database schema for the second system feature. The data schema indicates an almost similar database structure to the first database. The difference is the inclusion of the LPR_reading and license_plate data attributes for pklot_overview and pklot event tables.
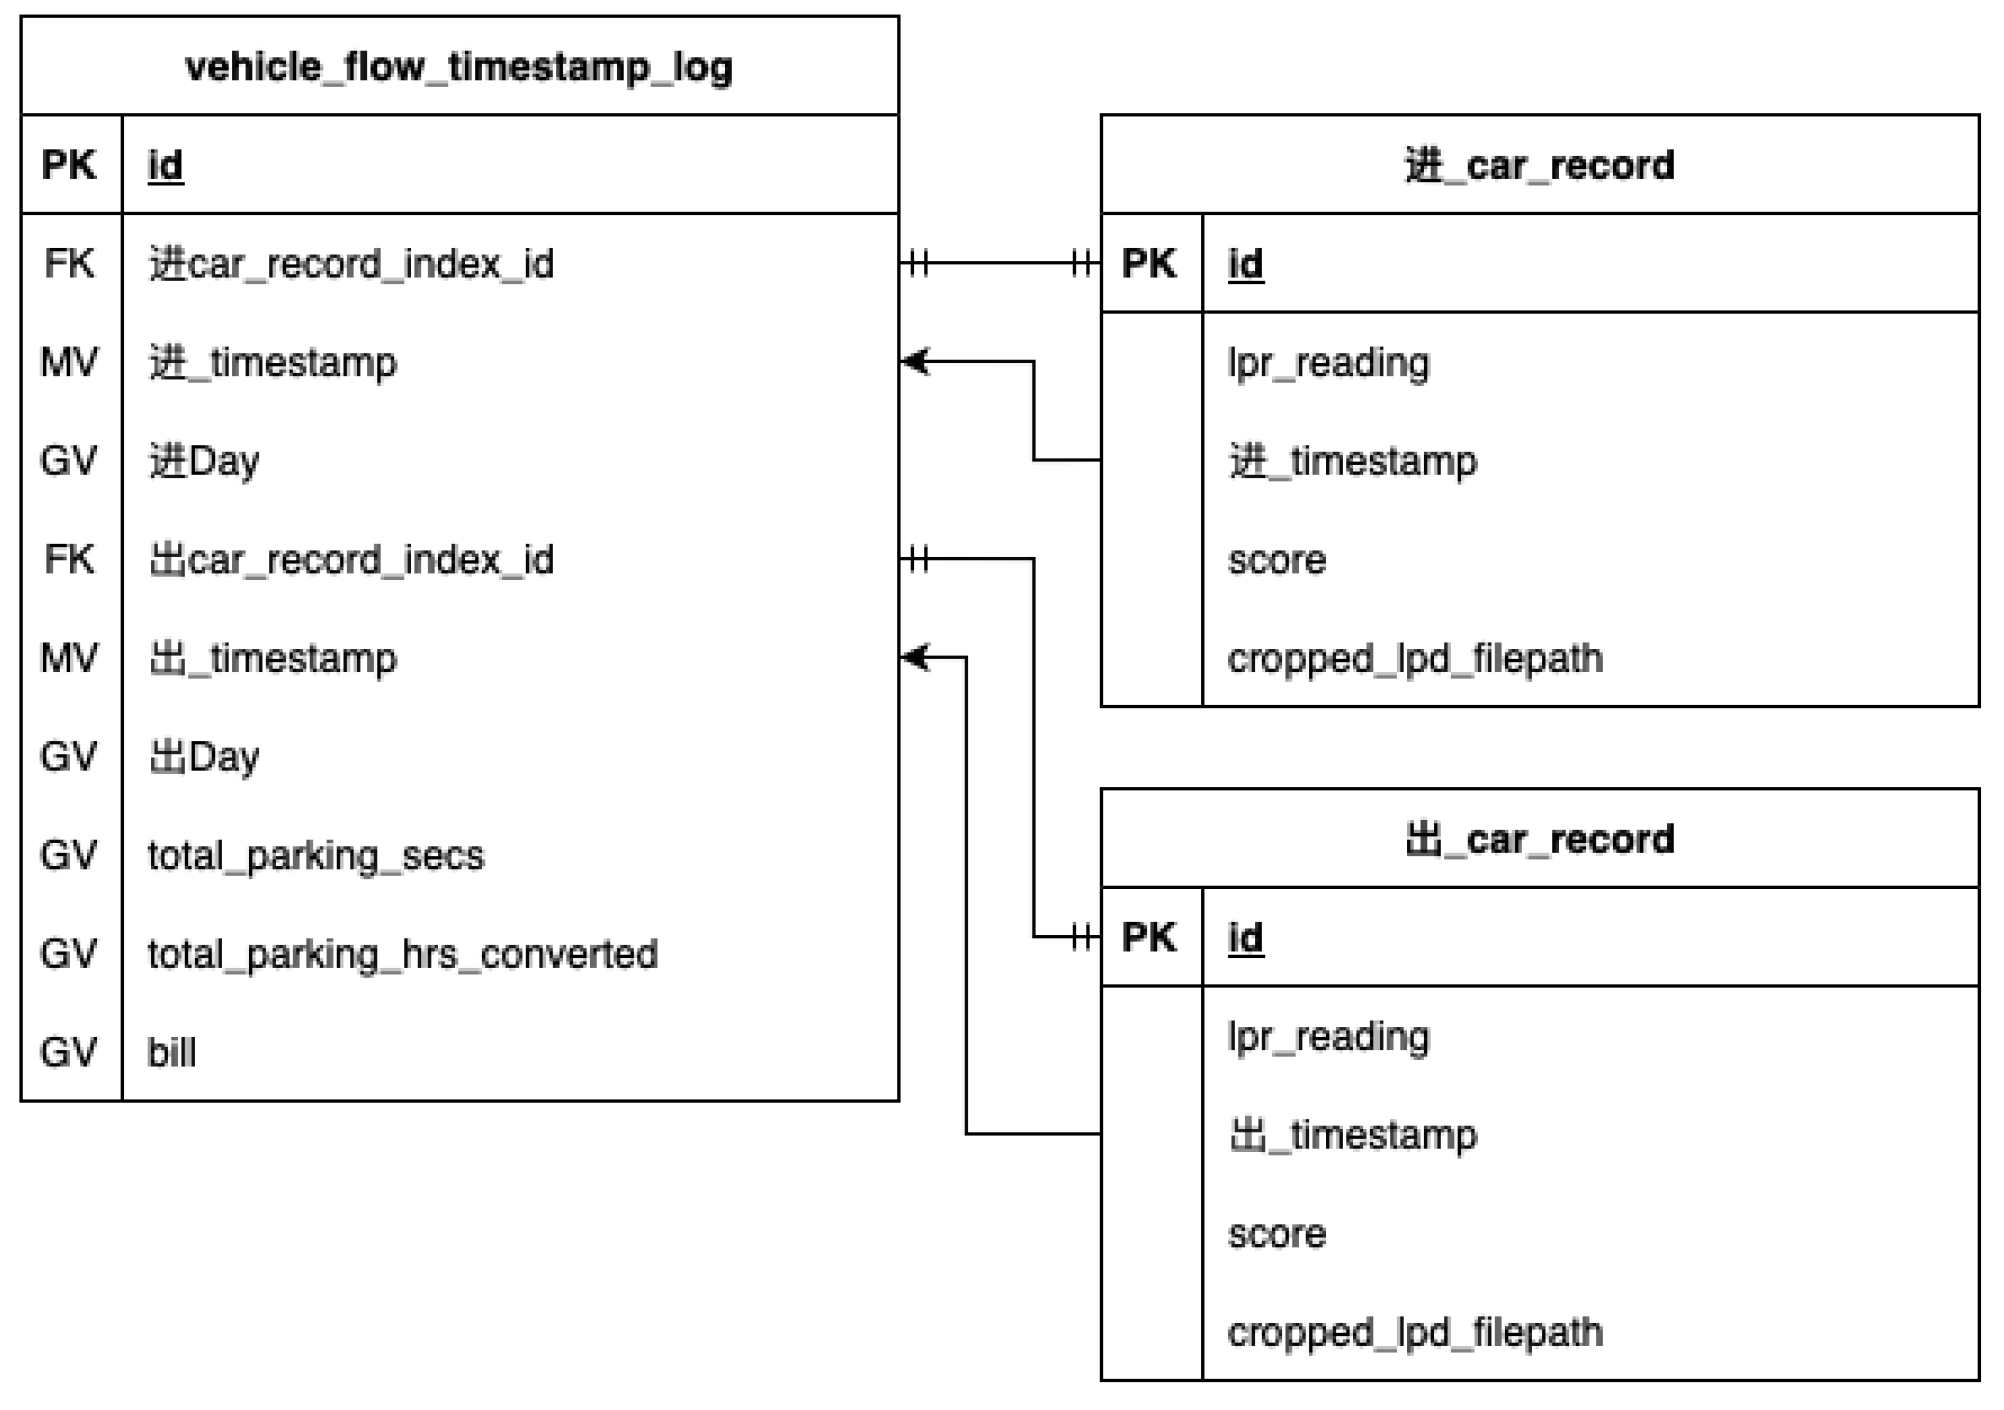
Figure 12.
Digital twin module of the smart parking management system. The development process is divided into two design phases: the initial phase is dedicated to 3D modeling, while the subsequent phase entails the integration of the model with other system module components.
Figure 12.
Digital twin module of the smart parking management system. The development process is divided into two design phases: the initial phase is dedicated to 3D modeling, while the subsequent phase entails the integration of the model with other system module components.
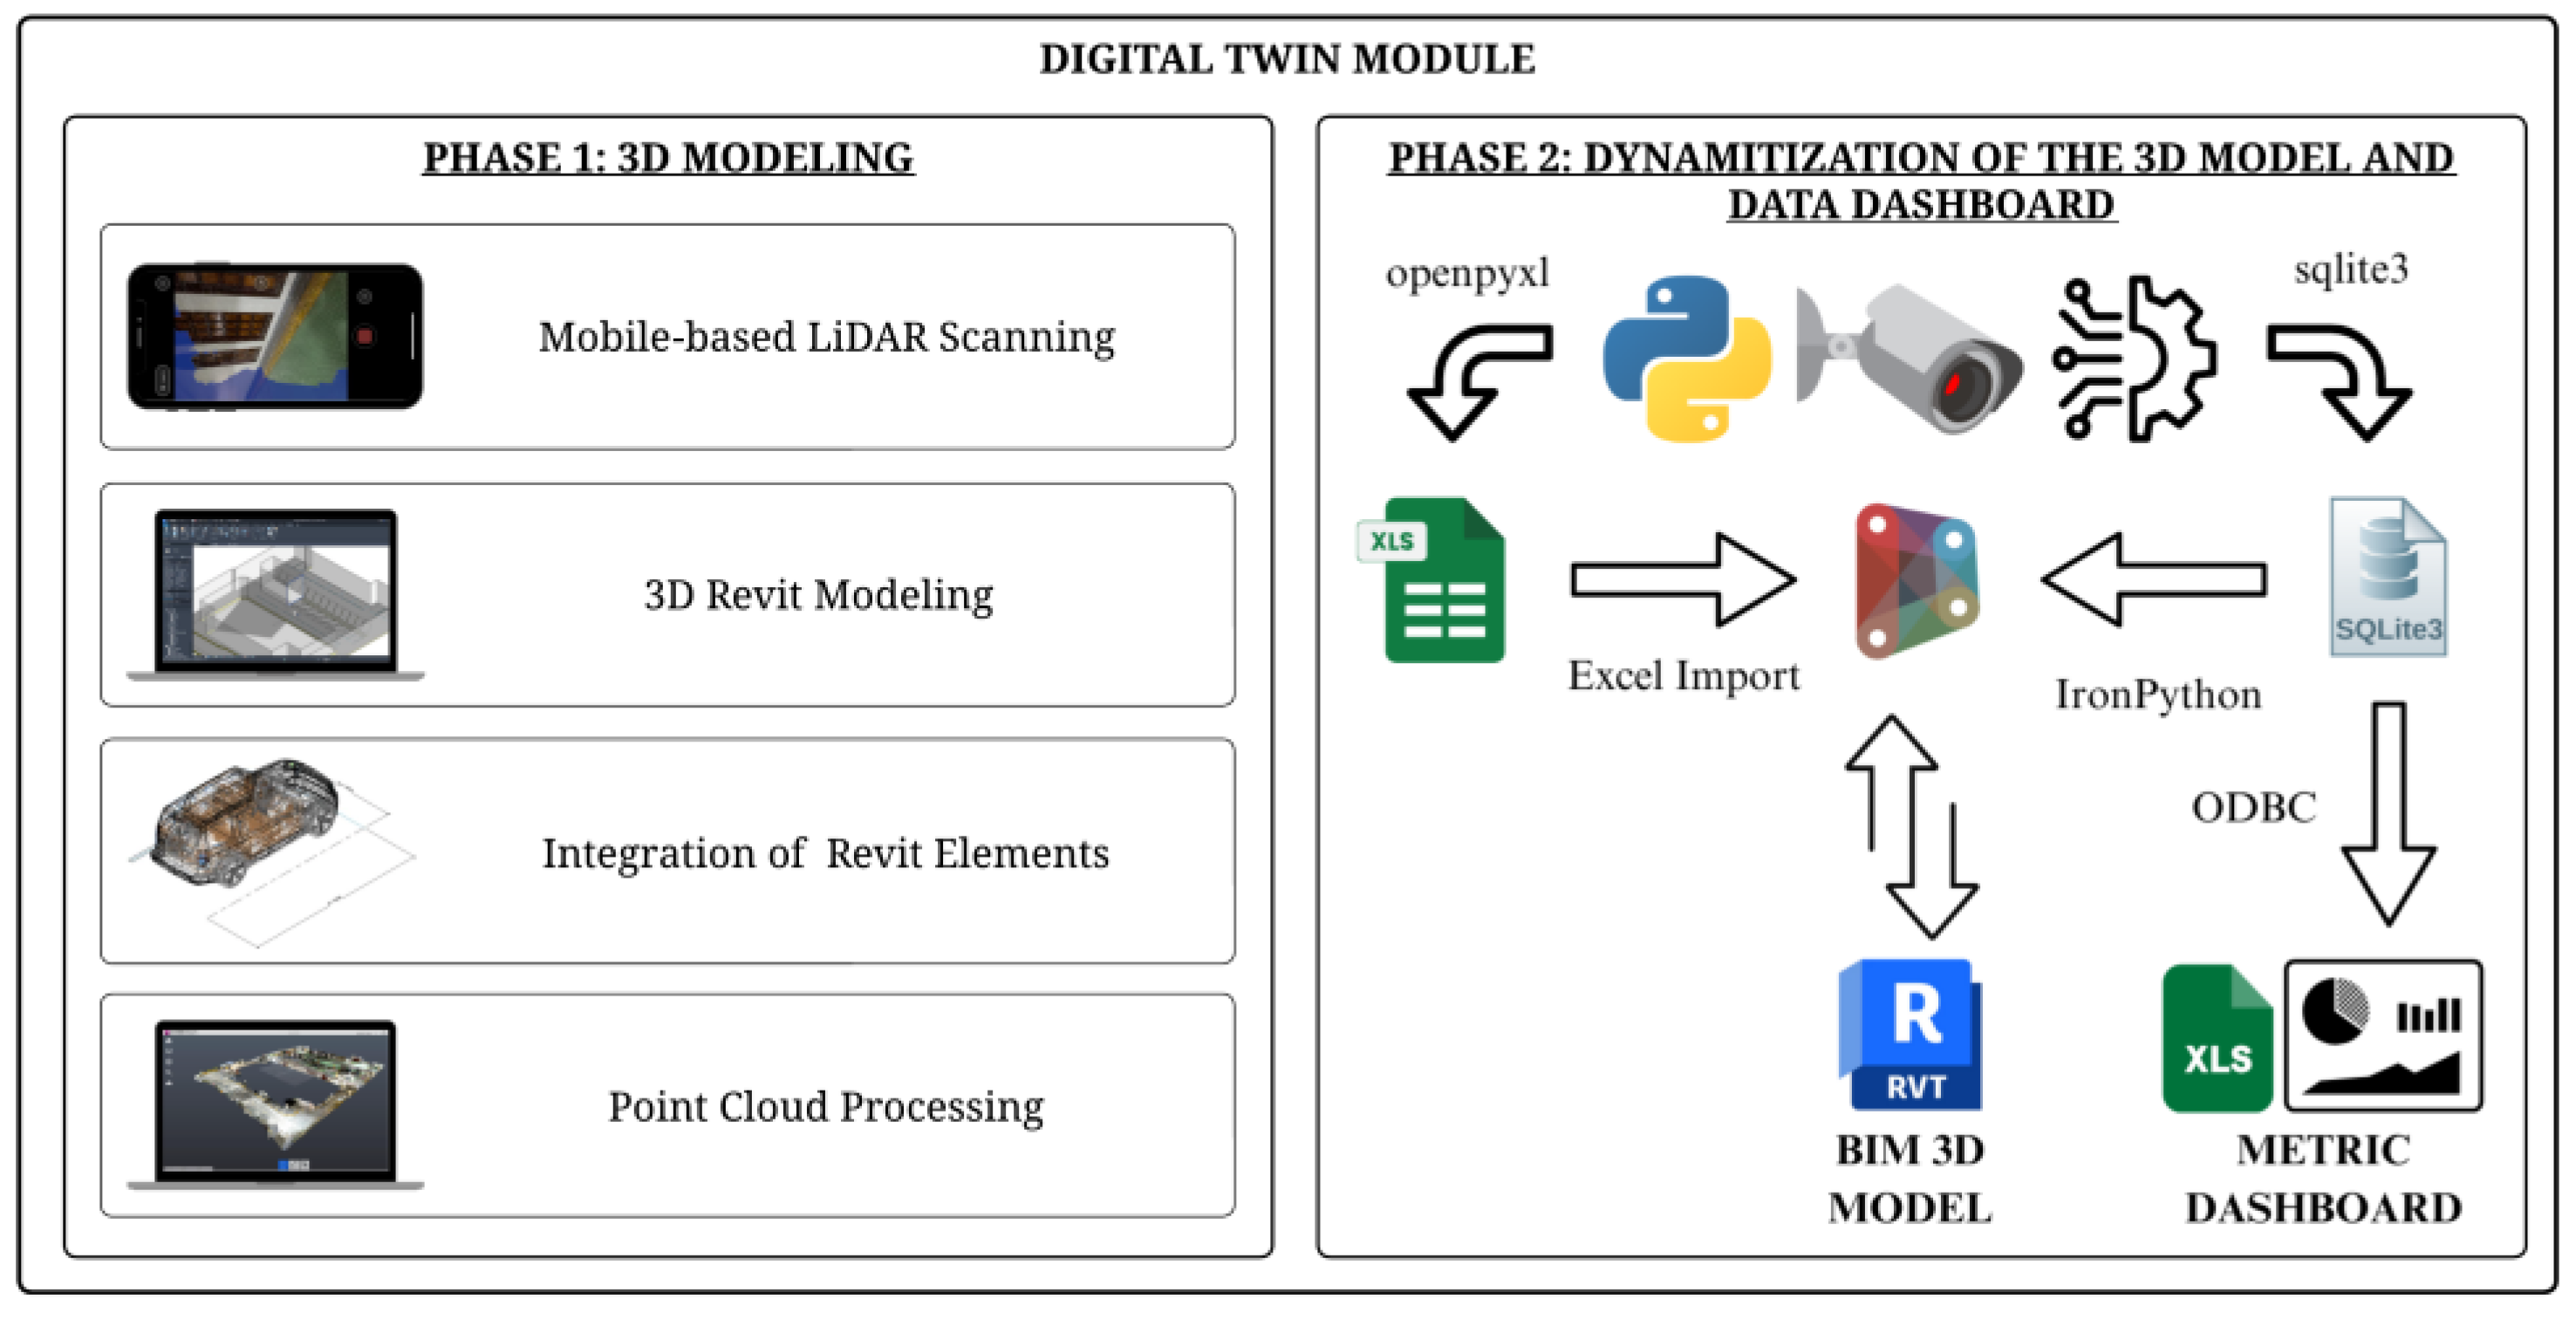
Figure 13.
Processed point cloud data from Autodesk Recap Pro of the Parking Facility Research Built Environment.
Figure 13.
Processed point cloud data from Autodesk Recap Pro of the Parking Facility Research Built Environment.
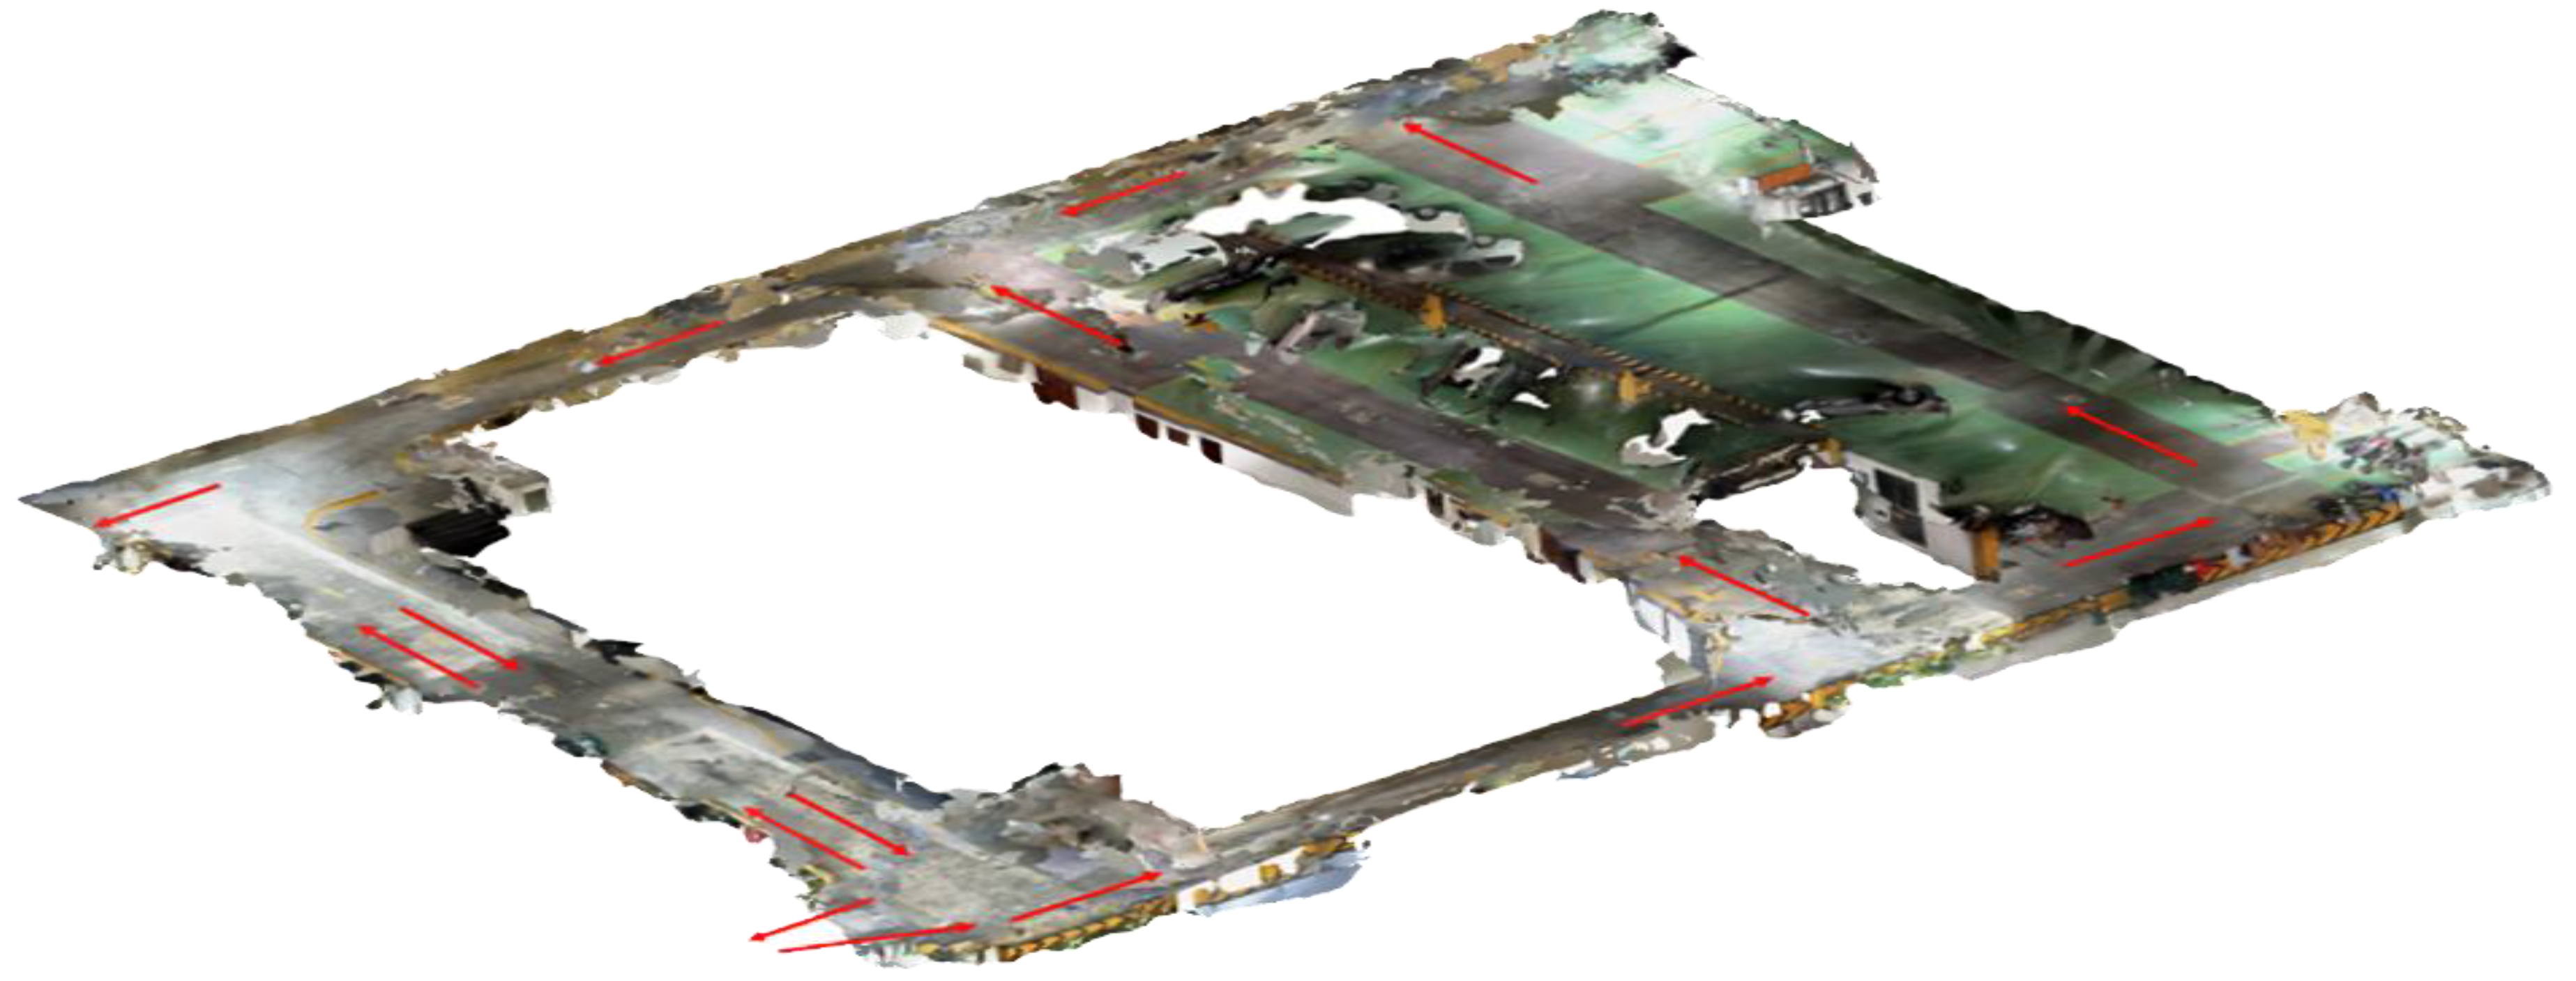
Figure 5.
Digital twin module model. (a) 3D model created in Autodesk Revit. (b) Zoomed-in view of the 3D model showing parking spaces within the parking facility.
Figure 5.
Digital twin module model. (a) 3D model created in Autodesk Revit. (b) Zoomed-in view of the 3D model showing parking spaces within the parking facility.
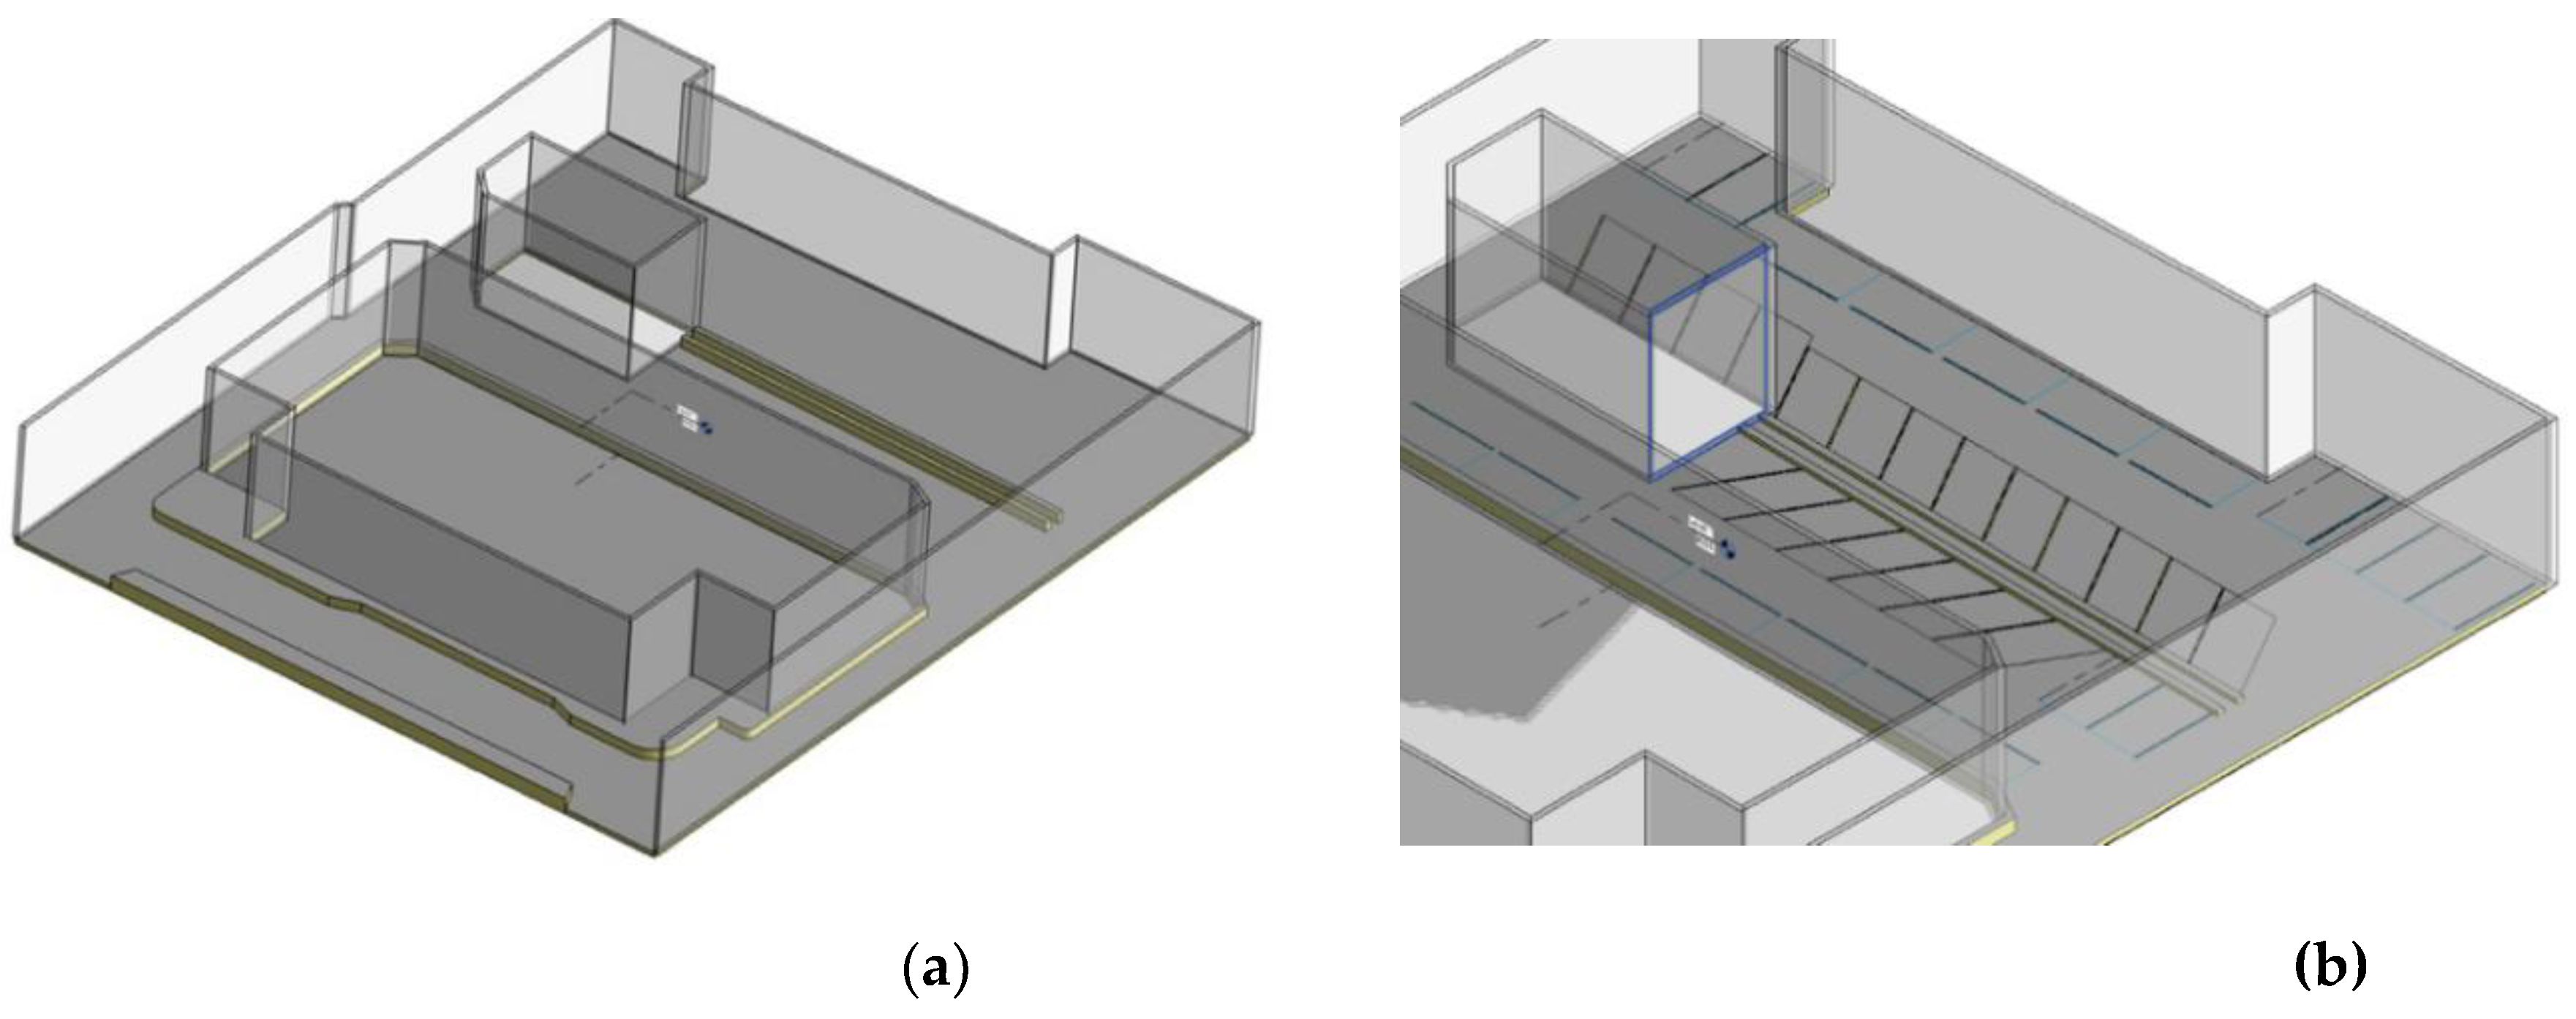
Figure 15.
Snapshots of Revit 3D modeling workspace. (a) Example showing a visible Land Rover SUV with the parked_car attribute set to True in a parking space Revit Family. (b) Close-up of parking spaces: occupied spaces have parked_car = True, while empty ones are set to False.
Figure 15.
Snapshots of Revit 3D modeling workspace. (a) Example showing a visible Land Rover SUV with the parked_car attribute set to True in a parking space Revit Family. (b) Close-up of parking spaces: occupied spaces have parked_car = True, while empty ones are set to False.
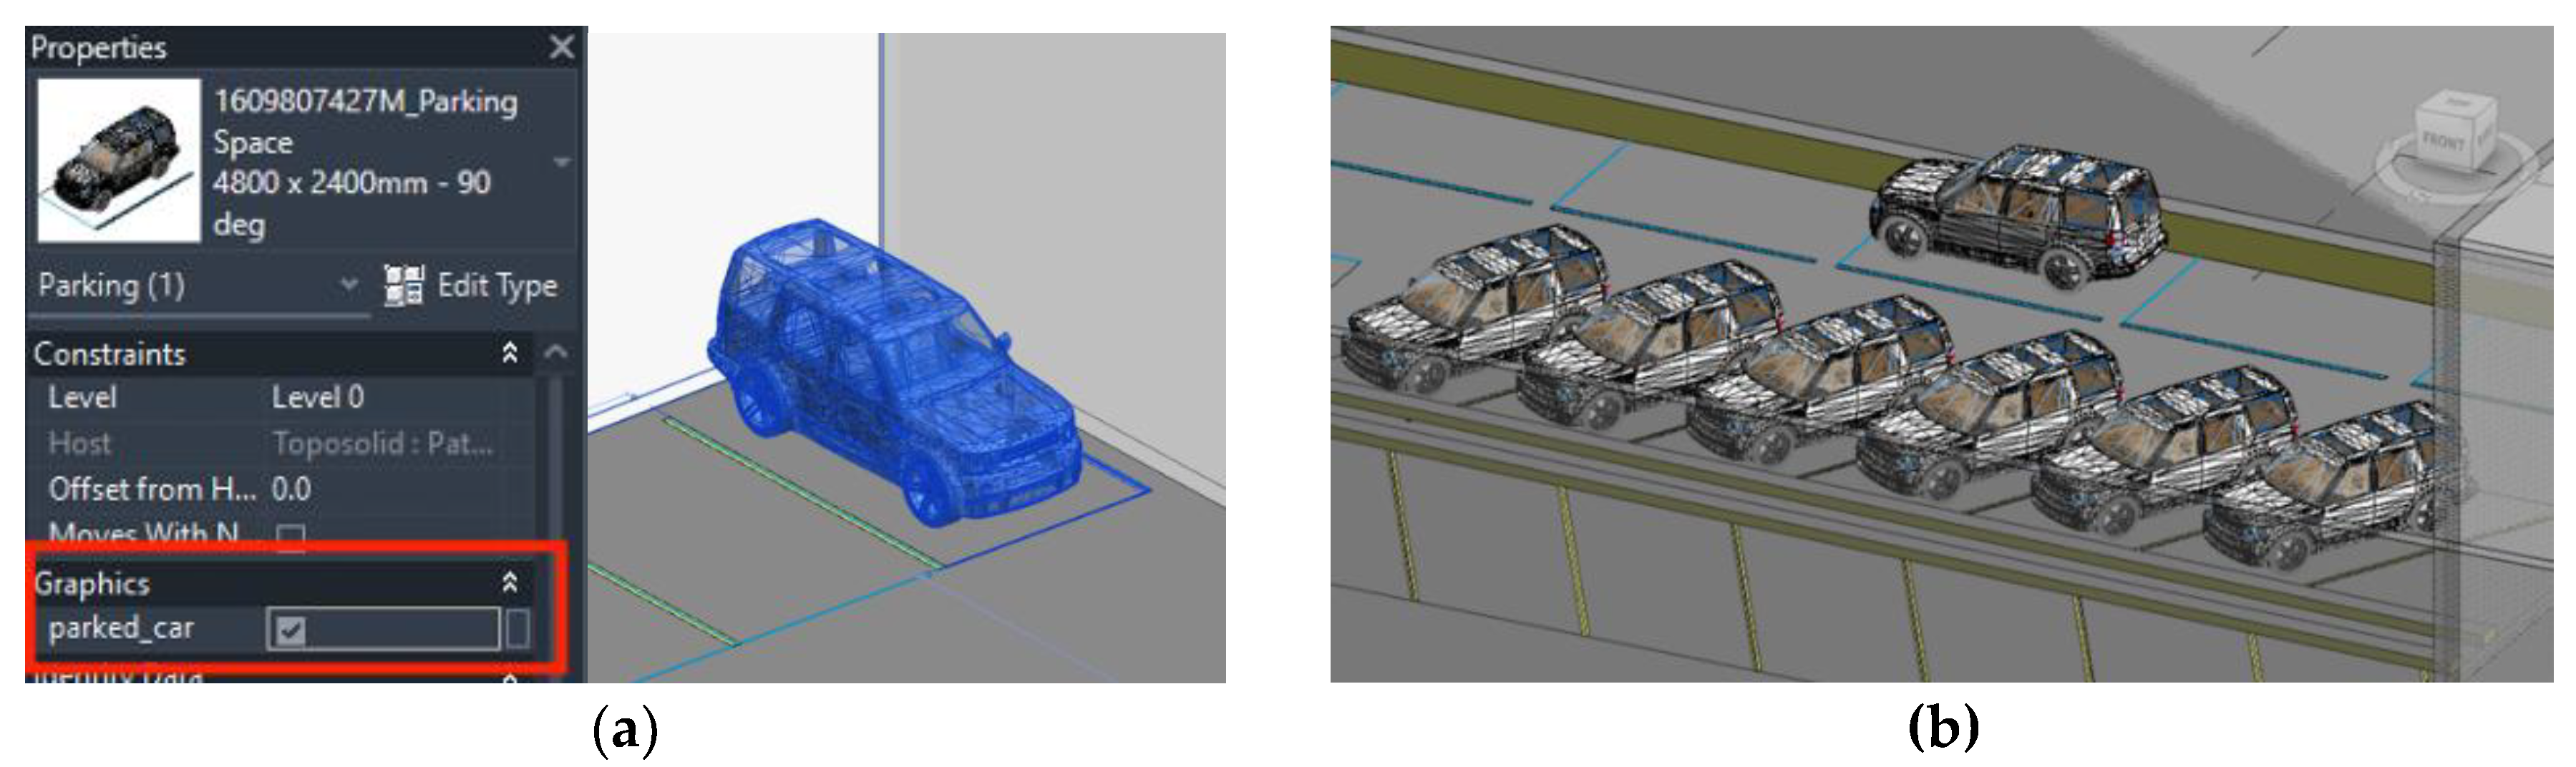
Figure 6.
General structure of the developed Revit Dynamo script for the Digital Twin module. The script supports the first feature system using a vehicle detection-based POD algorithm. For the second feature, only Slots #8 and #9 are considered. Pink node groups handle data processing; green nodes control vehicle visibility in parking spaces.
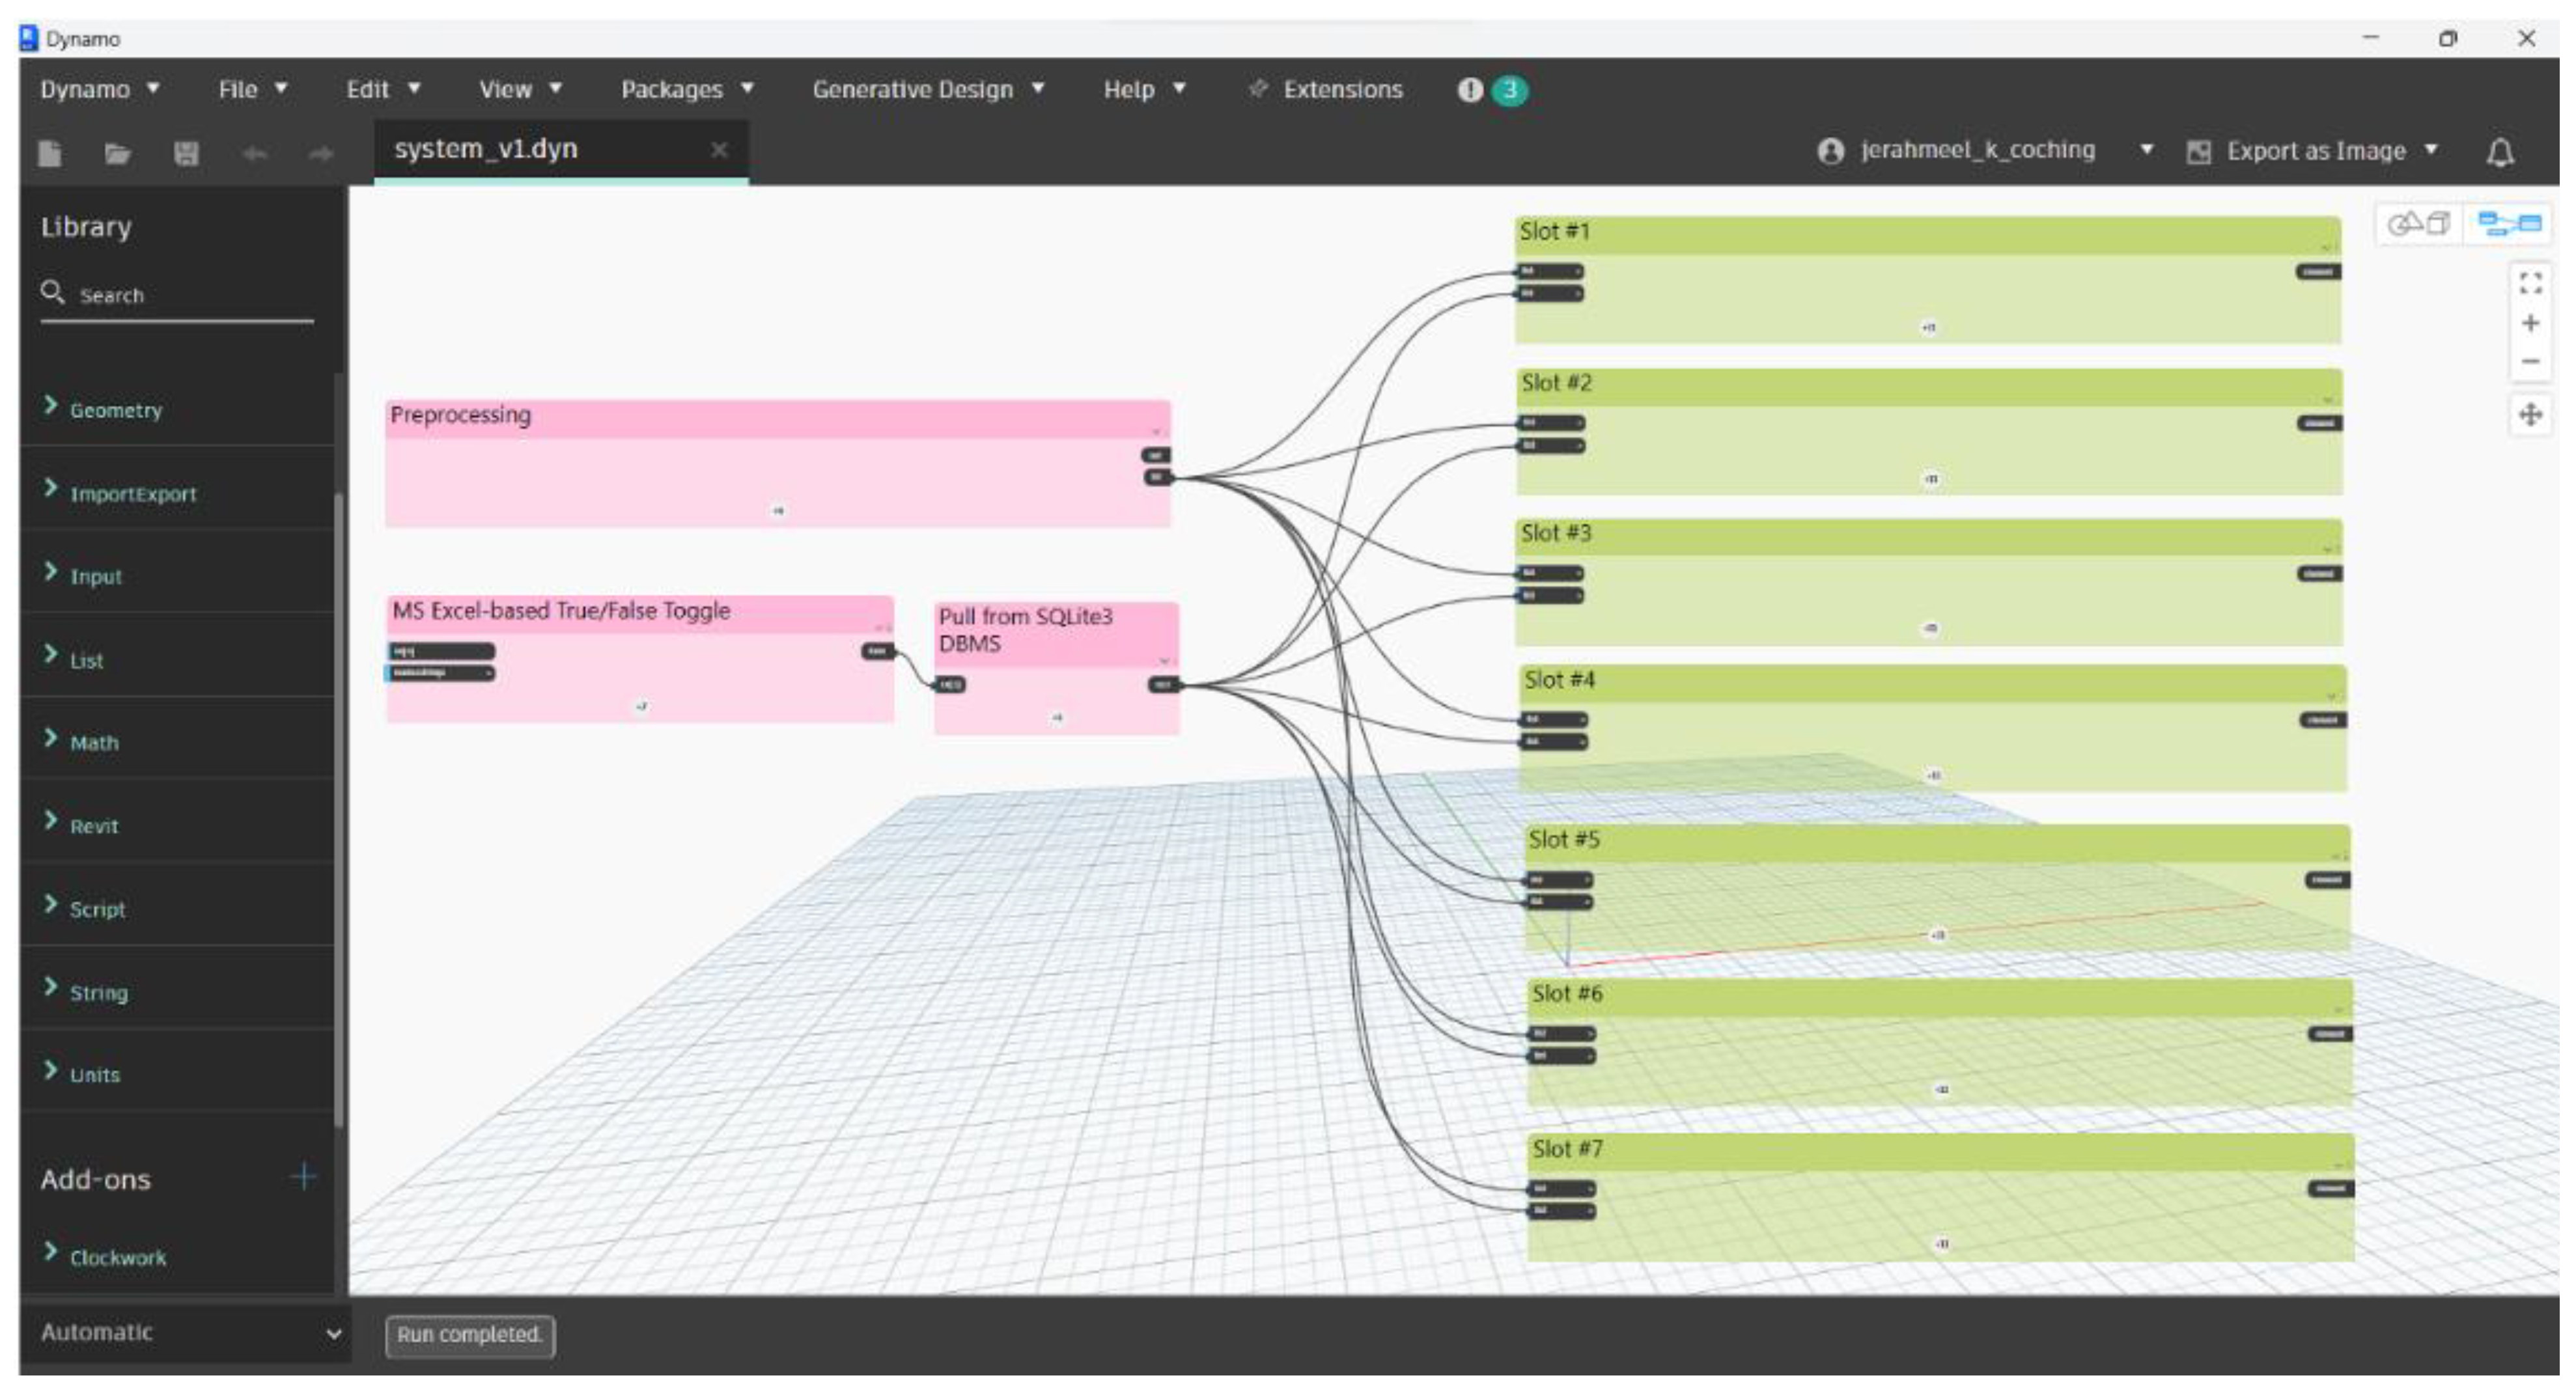
Figure 7.
Revit Dynamo for the Second Feature System Supporting the LPR-based POD Algorithm.
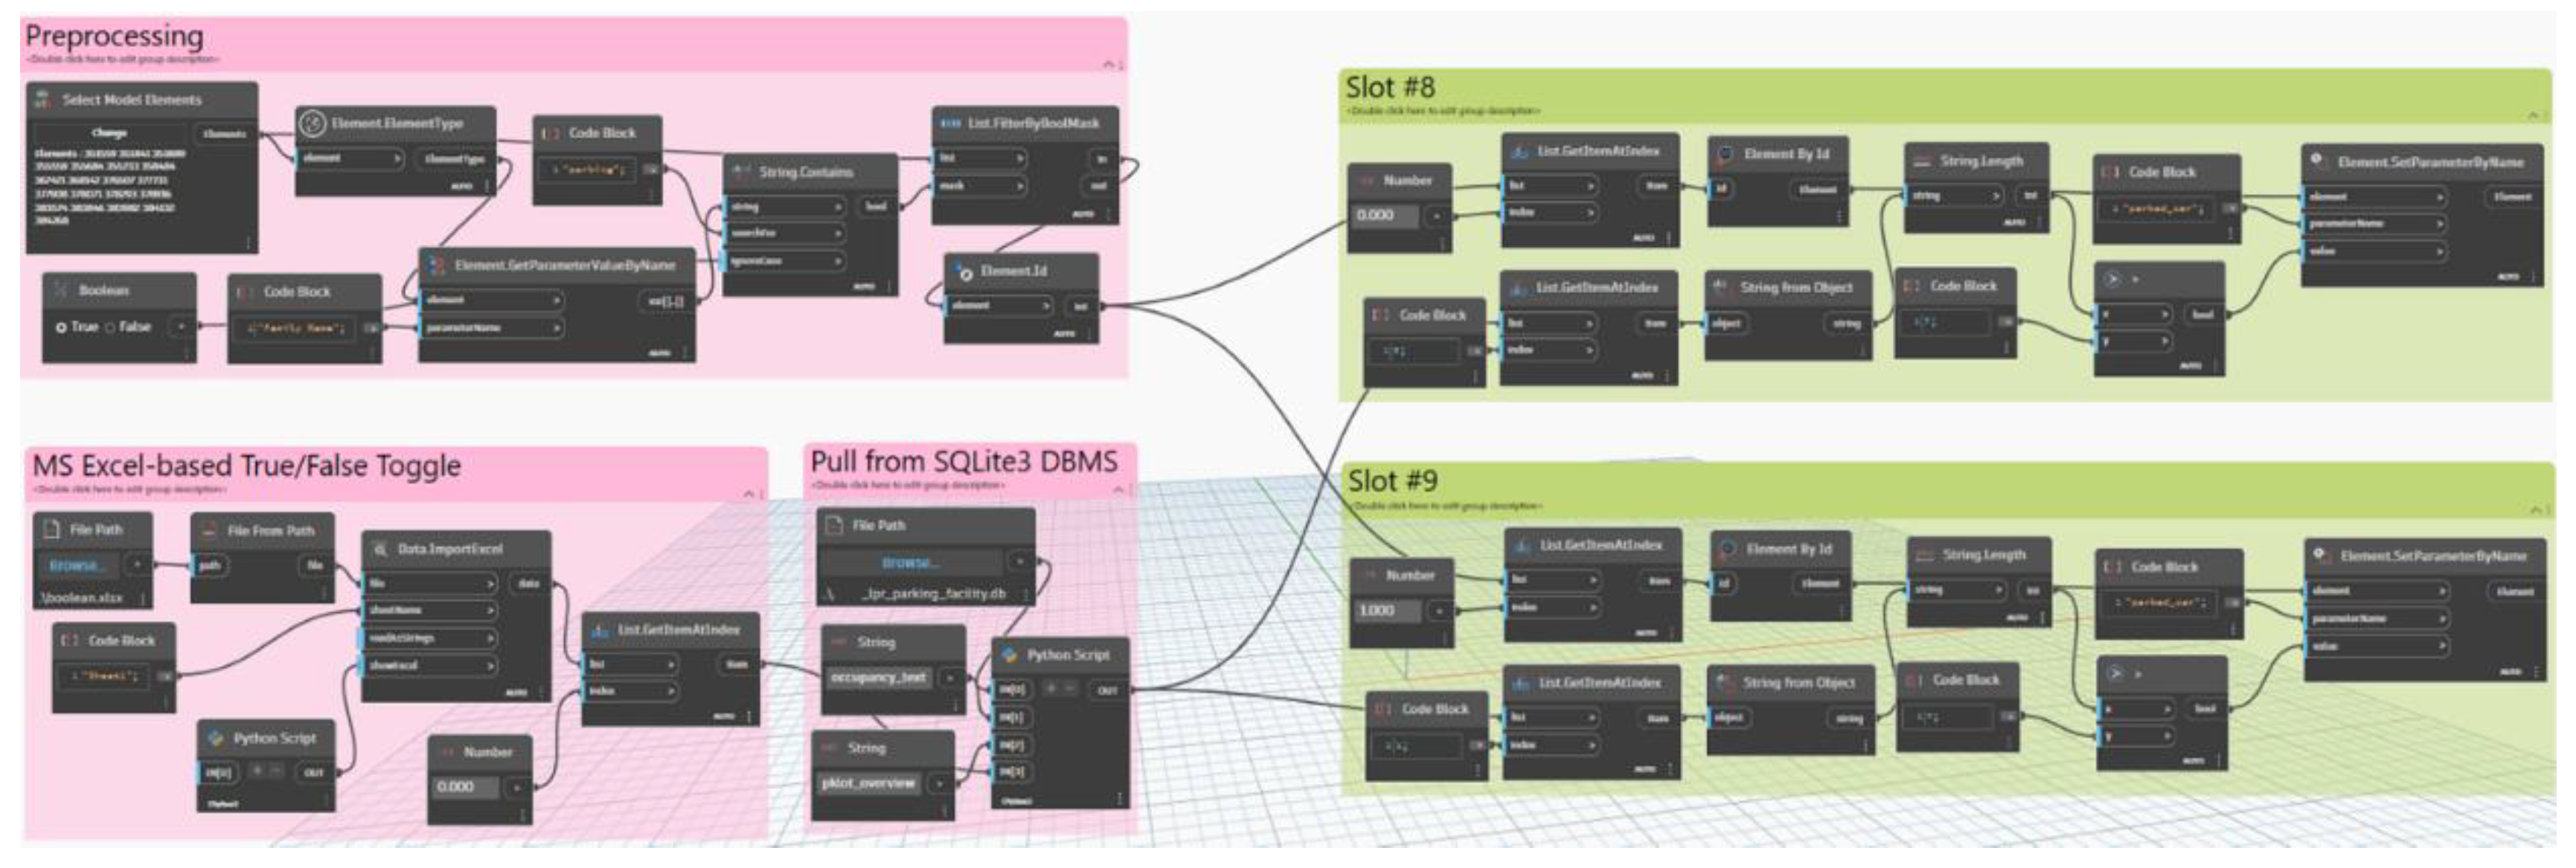
Figure 18.
Floor plan of the building complex with camera positions provided. Each camera is color-coded to provide information on which system feature it belongs to.
Figure 18.
Floor plan of the building complex with camera positions provided. Each camera is color-coded to provide information on which system feature it belongs to.
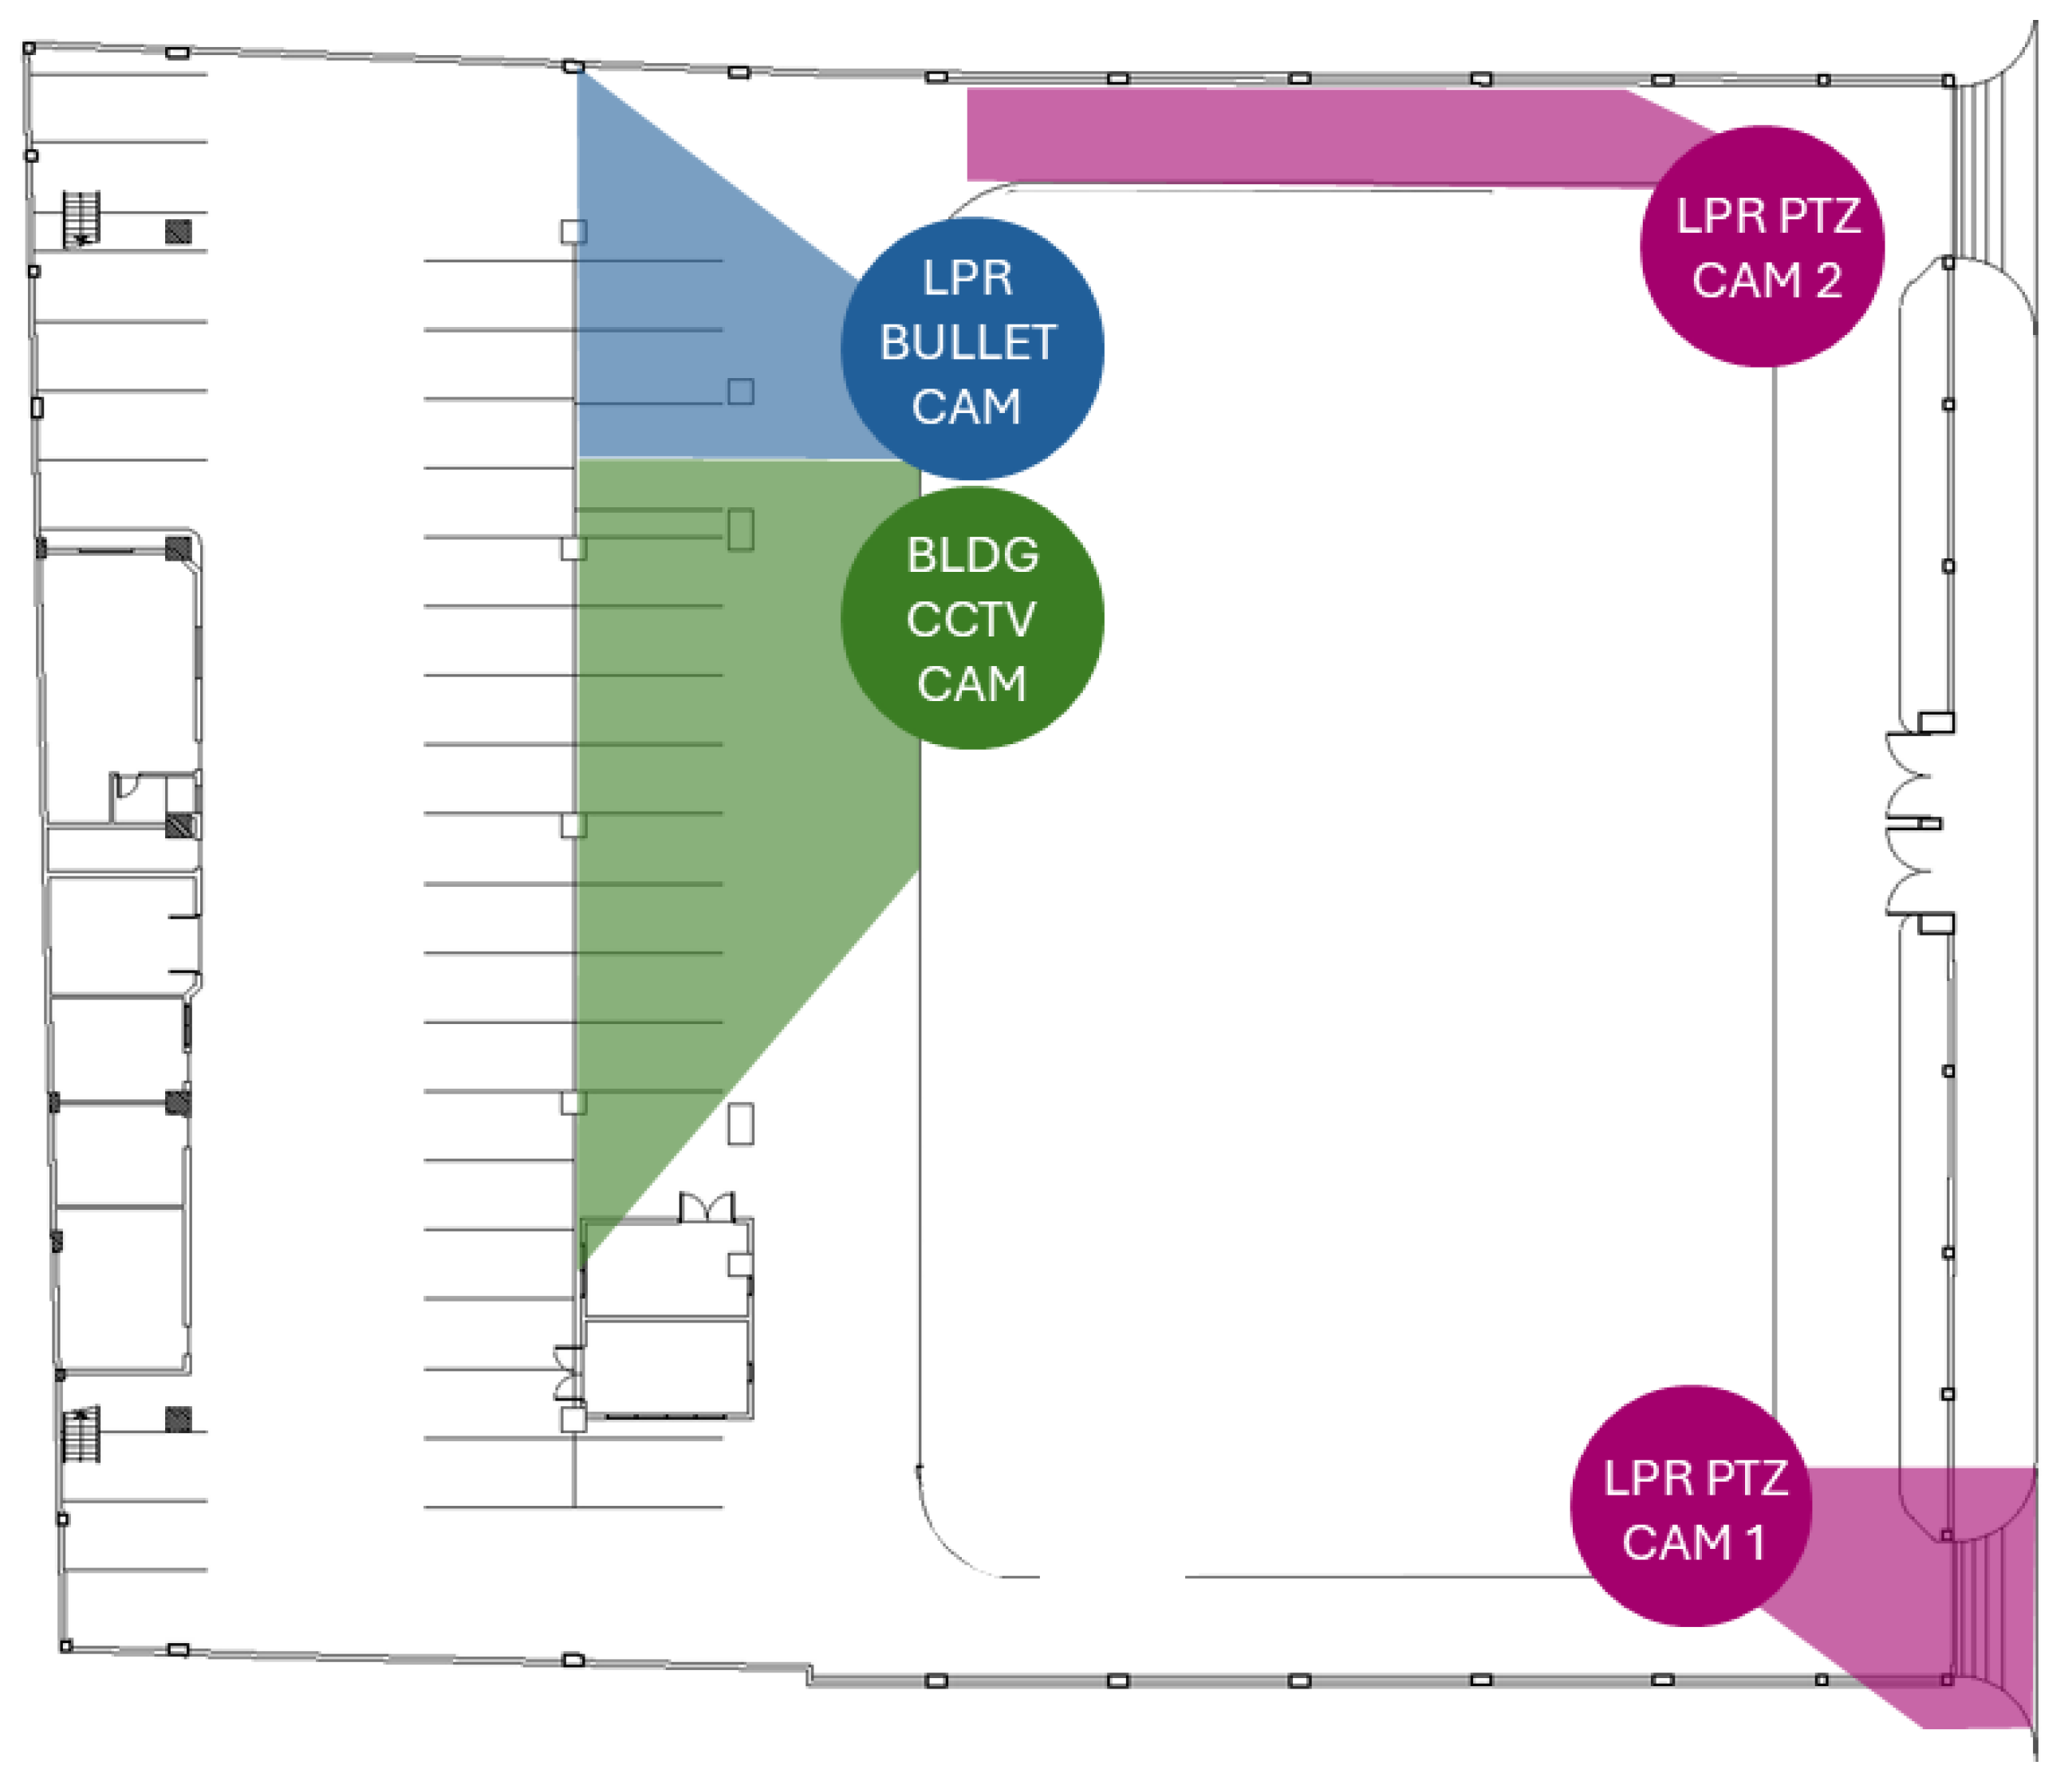
Figure 19.
Security cameras are installed in the building complex. The following security cameras are installed within the building complex: (a) a fish-eye lens camera for the first system feature, (b) from left to right, a fixed bullet turret camera for the second system feature, and PTZ cameras for monitoring vehicle entry and exit for the third feature.
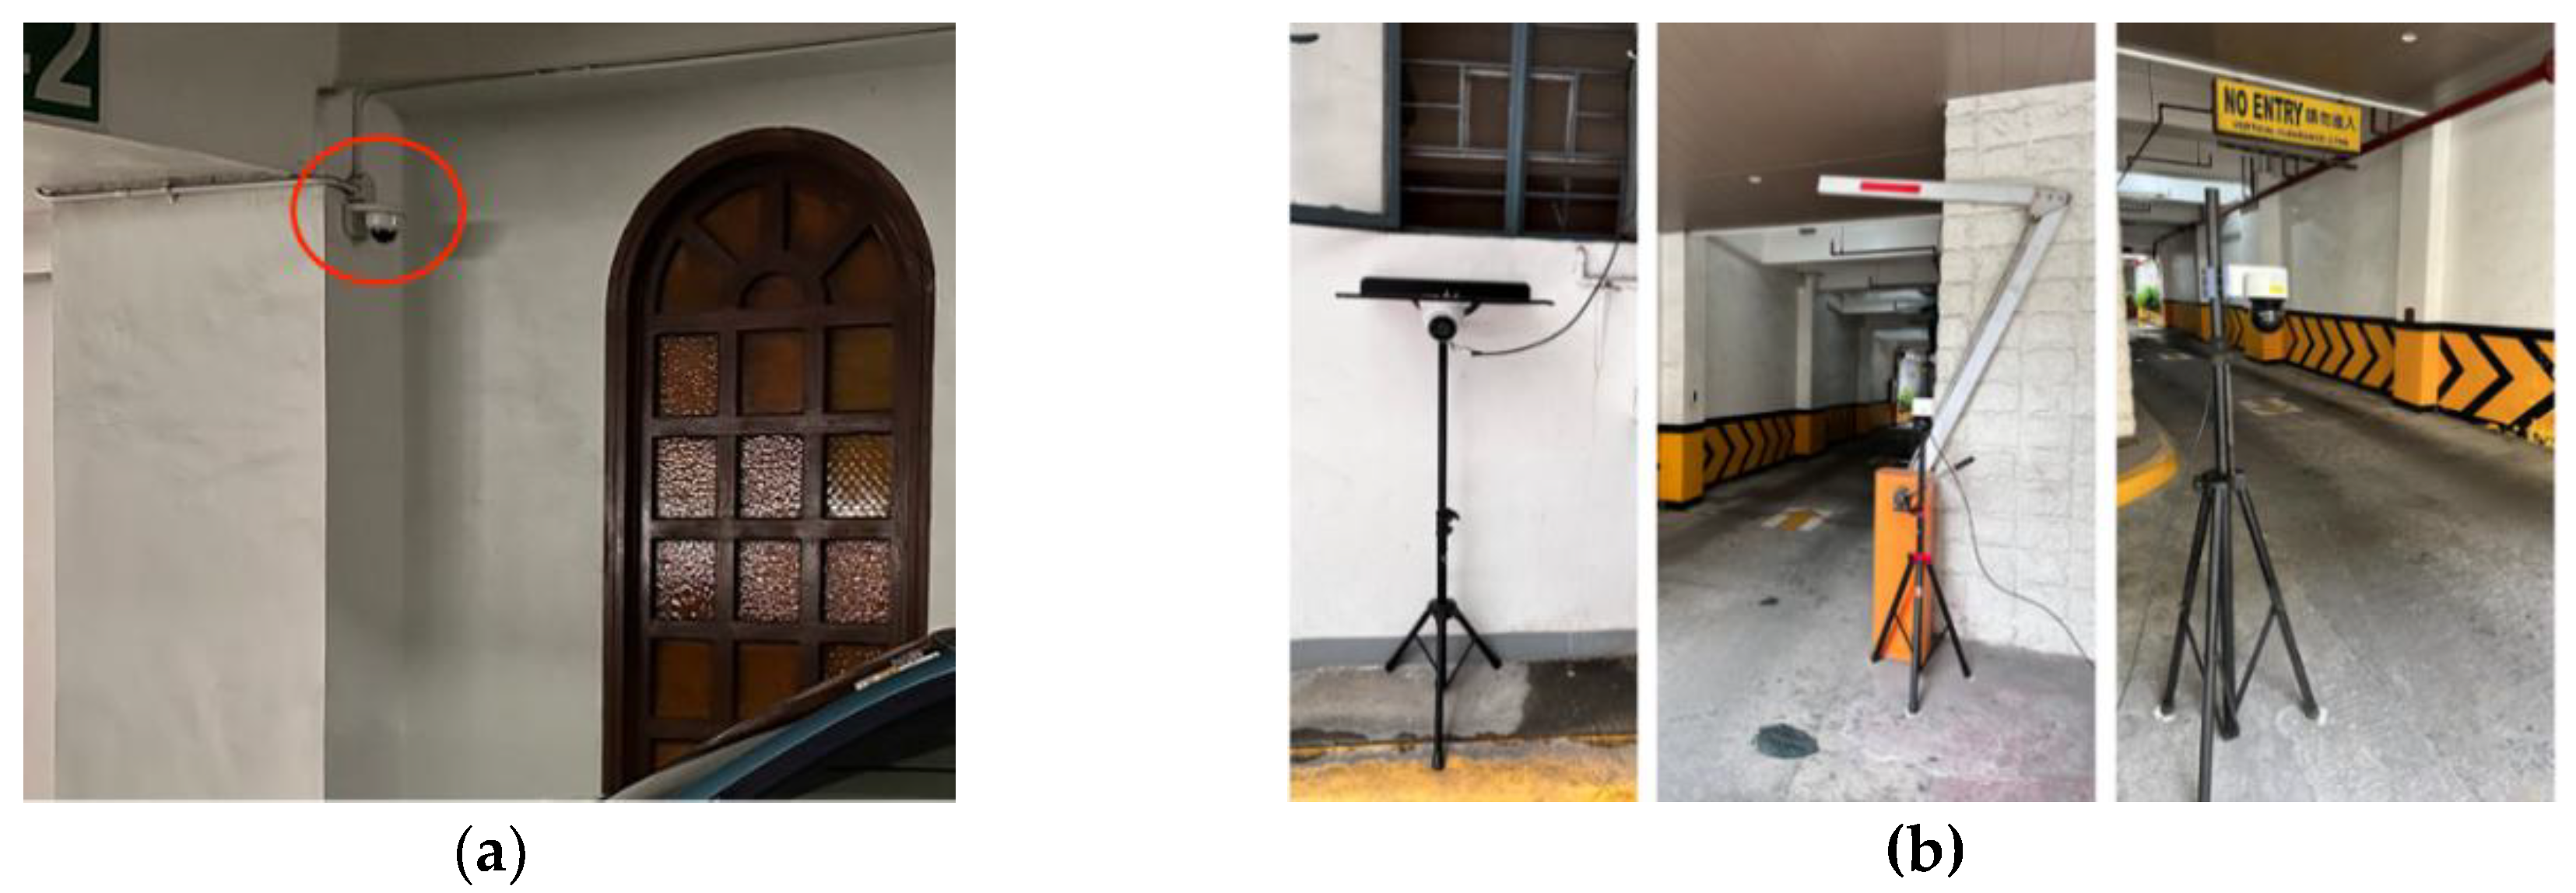
Figure 20.
Security camera video feeds within the building complex. (a) First monitor shows most parking spaces, while (b) shows the entrance and exit driveways, and selected parking spaces.
Figure 20.
Security camera video feeds within the building complex. (a) First monitor shows most parking spaces, while (b) shows the entrance and exit driveways, and selected parking spaces.
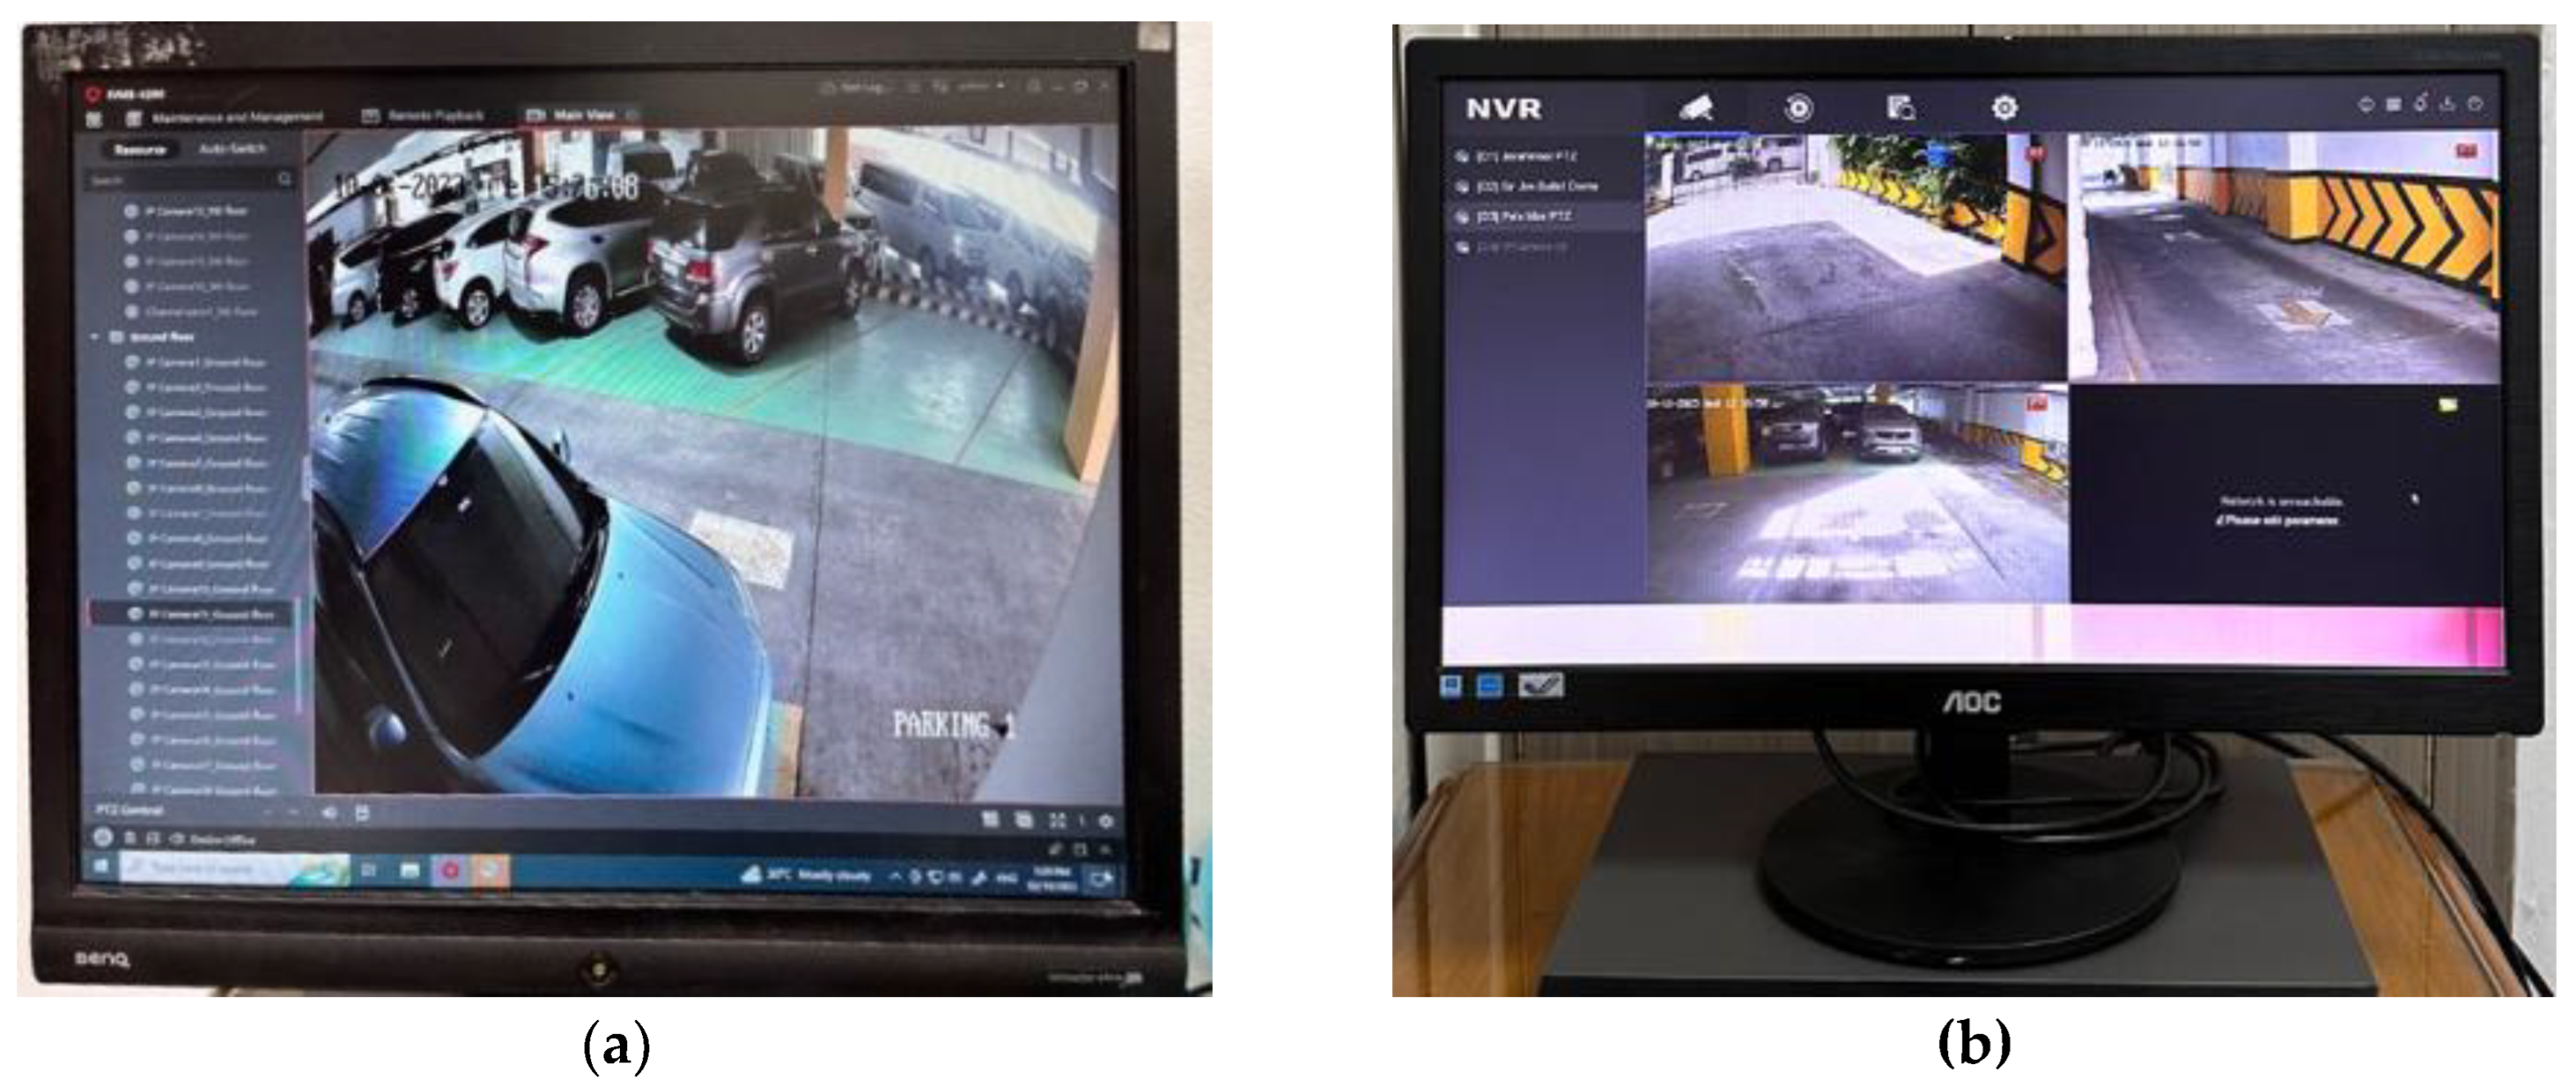
Figure 8.
Sample image from the CATCH-ALL dataset by DLSU ISL. This dataset shows a street with vehicles in Manila, Philippines.
Figure 8.
Sample image from the CATCH-ALL dataset by DLSU ISL. This dataset shows a street with vehicles in Manila, Philippines.
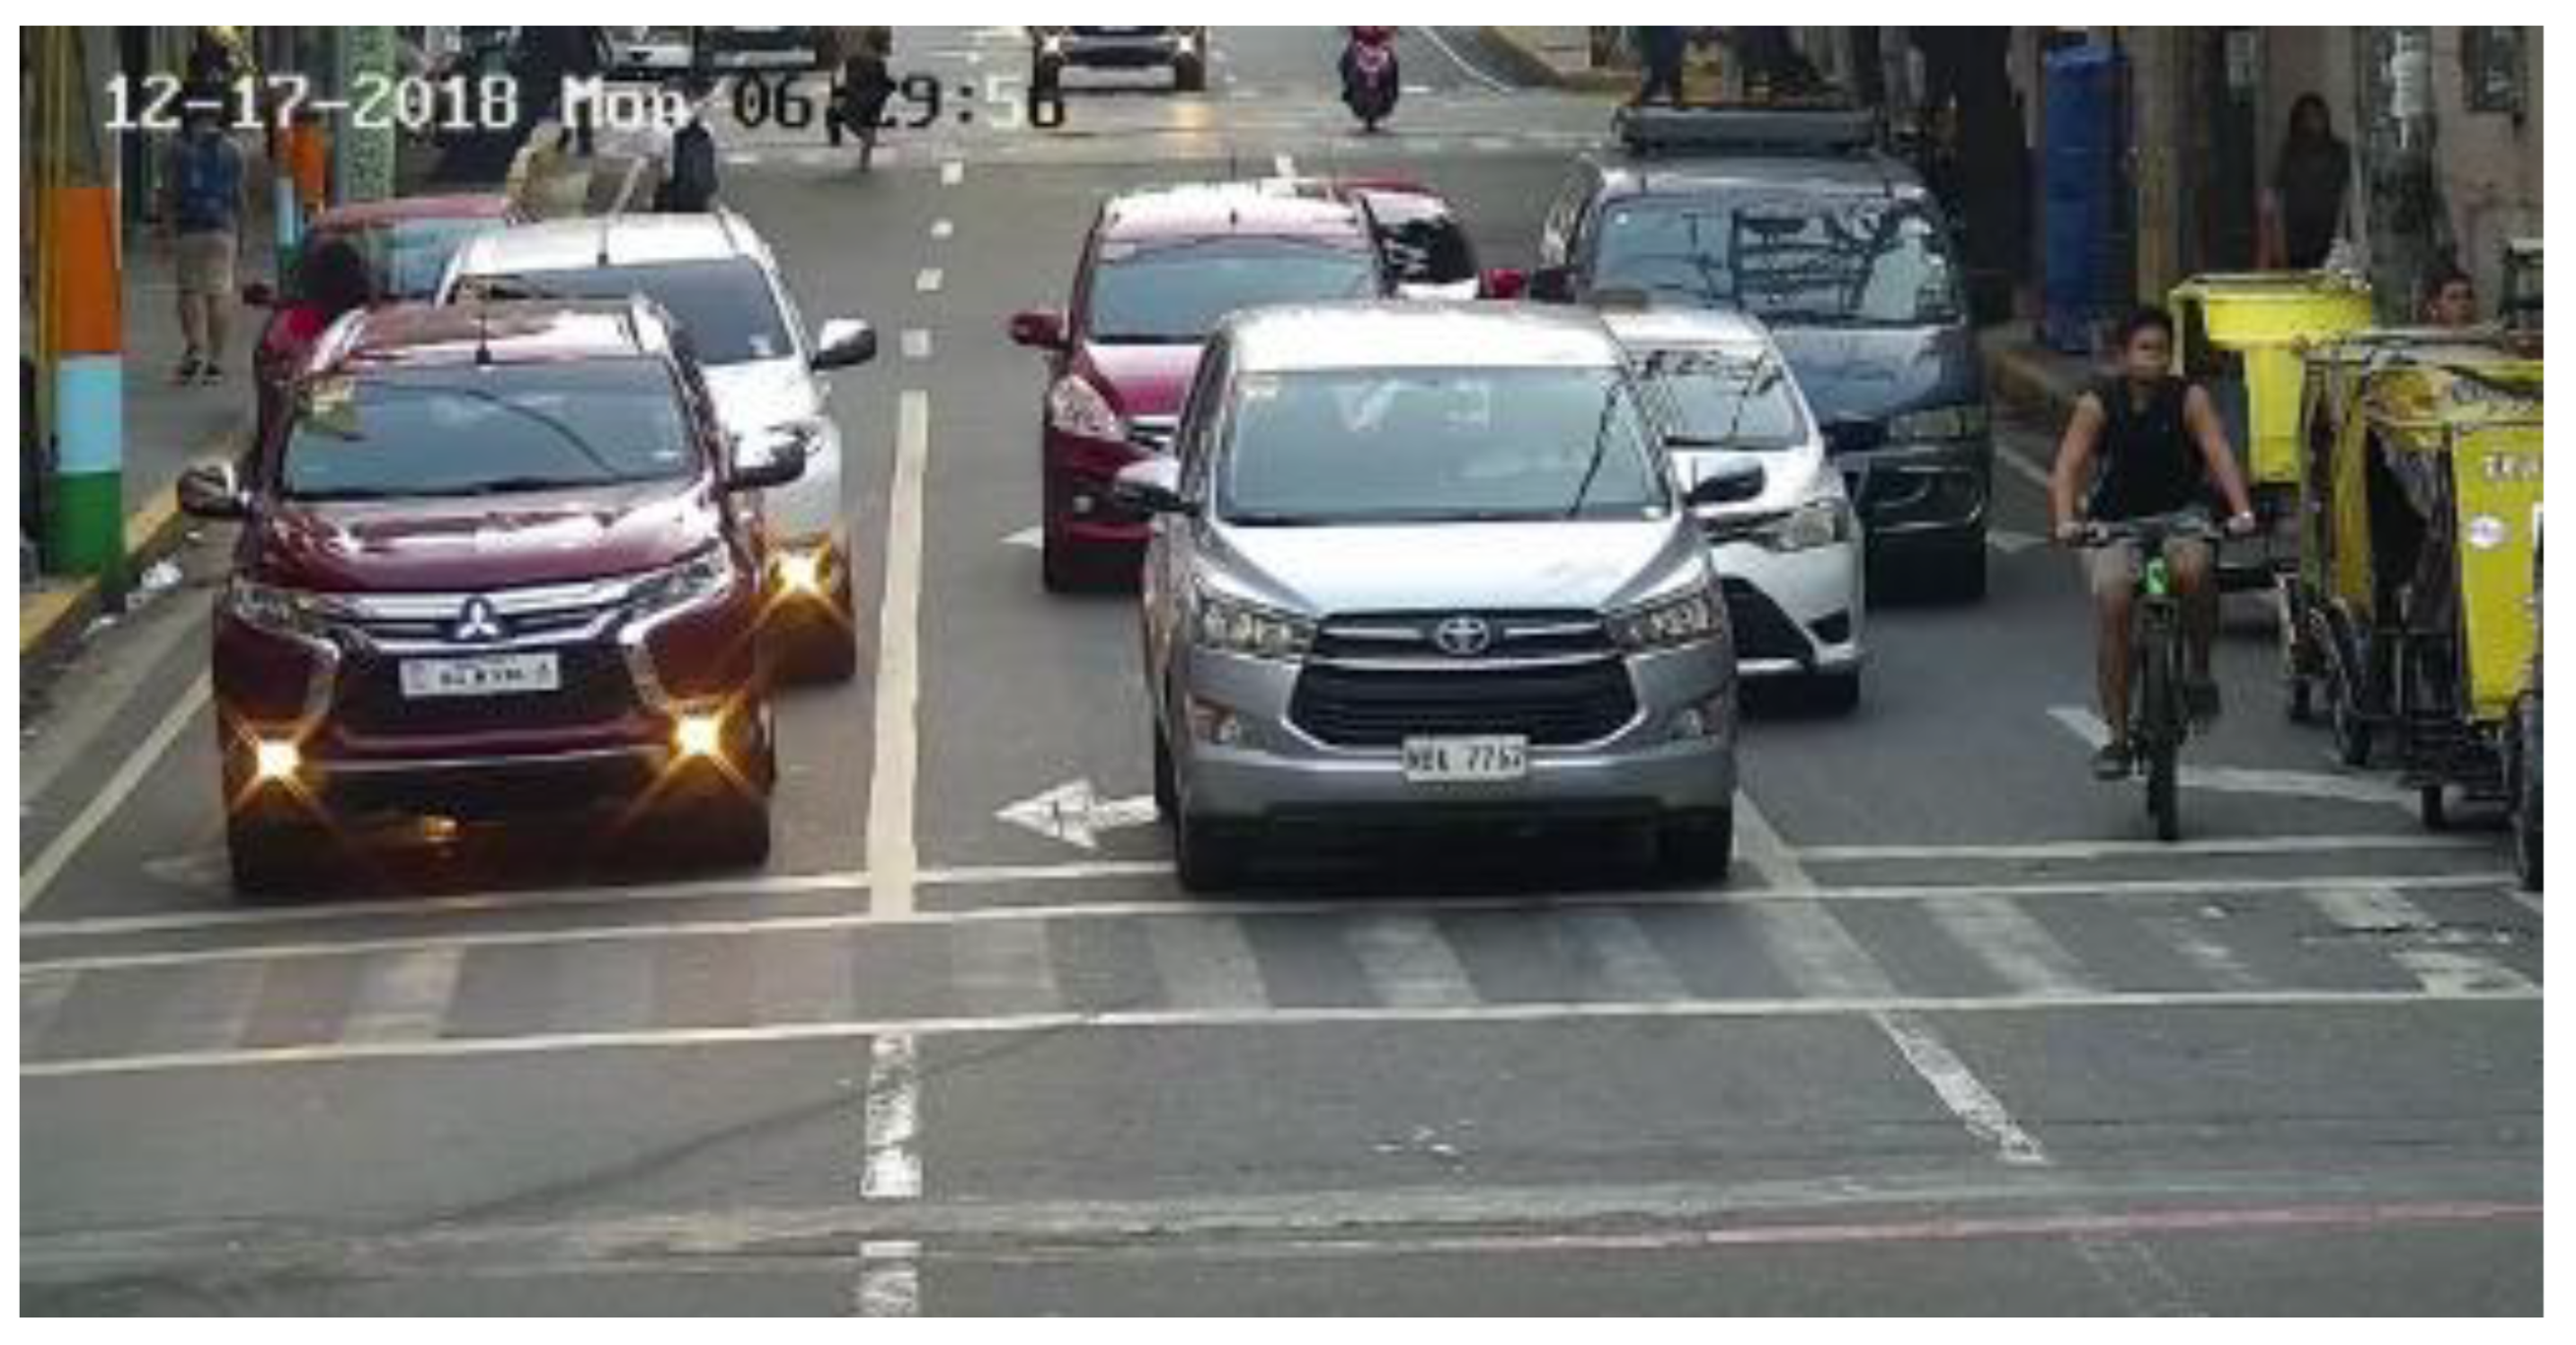
Figure 22.
YOLOv7-x Base Model Vehicle Detection Inferences on Video Footage Frames Showing different capacities: (a) Nearly Empty, (b) Moderately-Filled, and (c) Fully Occupied.
Figure 22.
YOLOv7-x Base Model Vehicle Detection Inferences on Video Footage Frames Showing different capacities: (a) Nearly Empty, (b) Moderately-Filled, and (c) Fully Occupied.
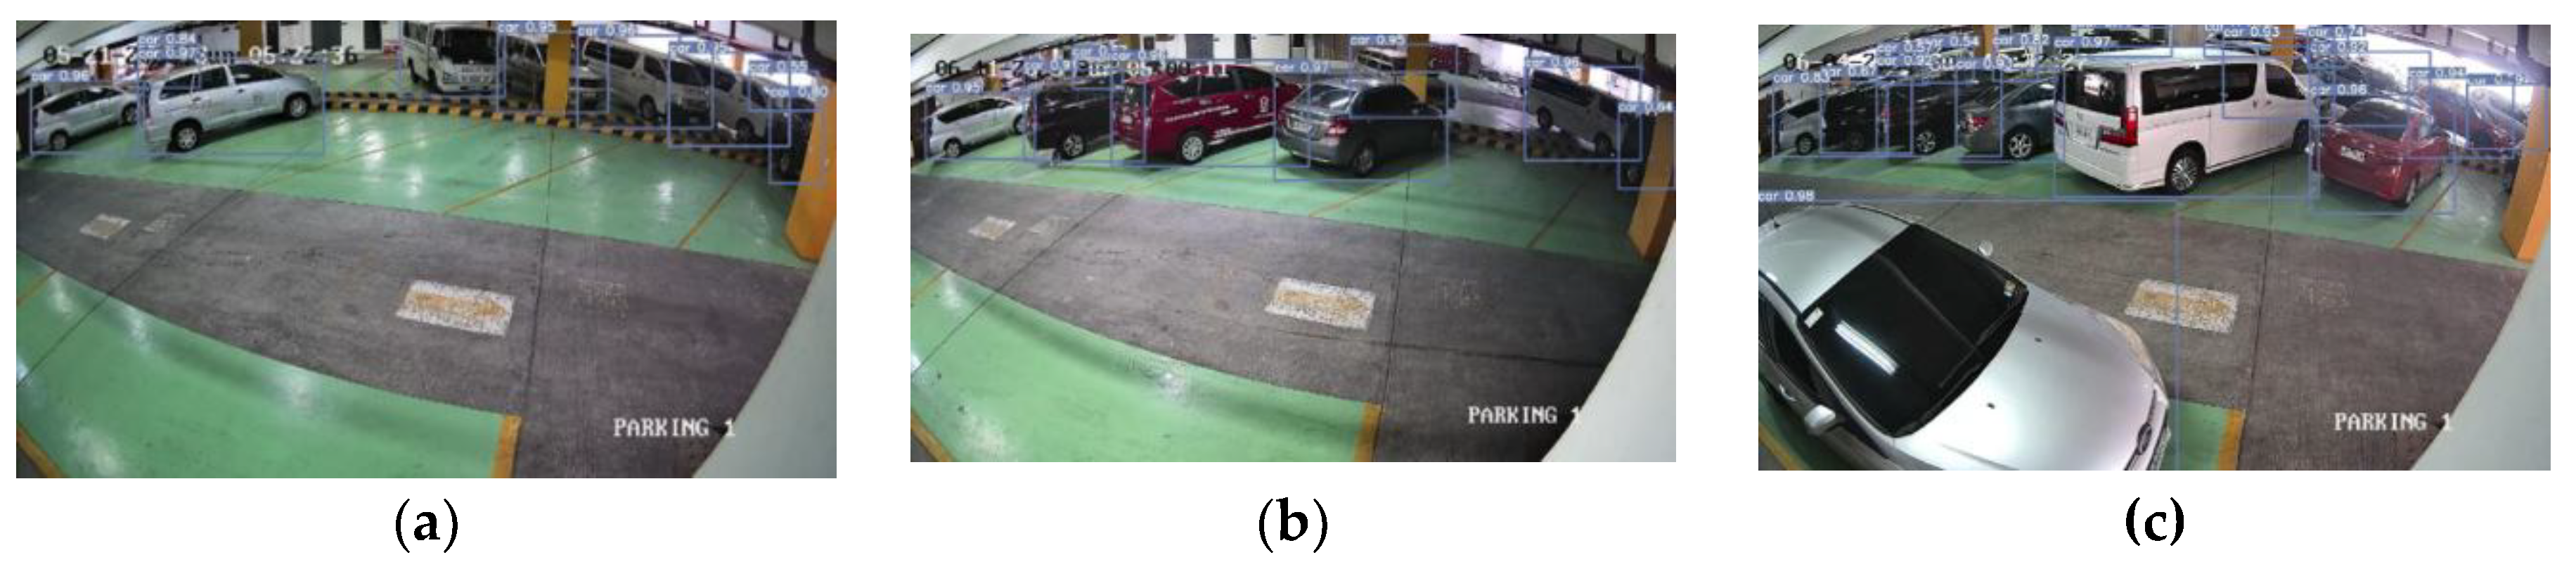
Figure 23.
LPD inference using the finetuned YOLOv7 LPD model on parking facility video frames, showing: (a) one of two parking spaces occupied, and (b) both spaces occupied.
Figure 23.
LPD inference using the finetuned YOLOv7 LPD model on parking facility video frames, showing: (a) one of two parking spaces occupied, and (b) both spaces occupied.
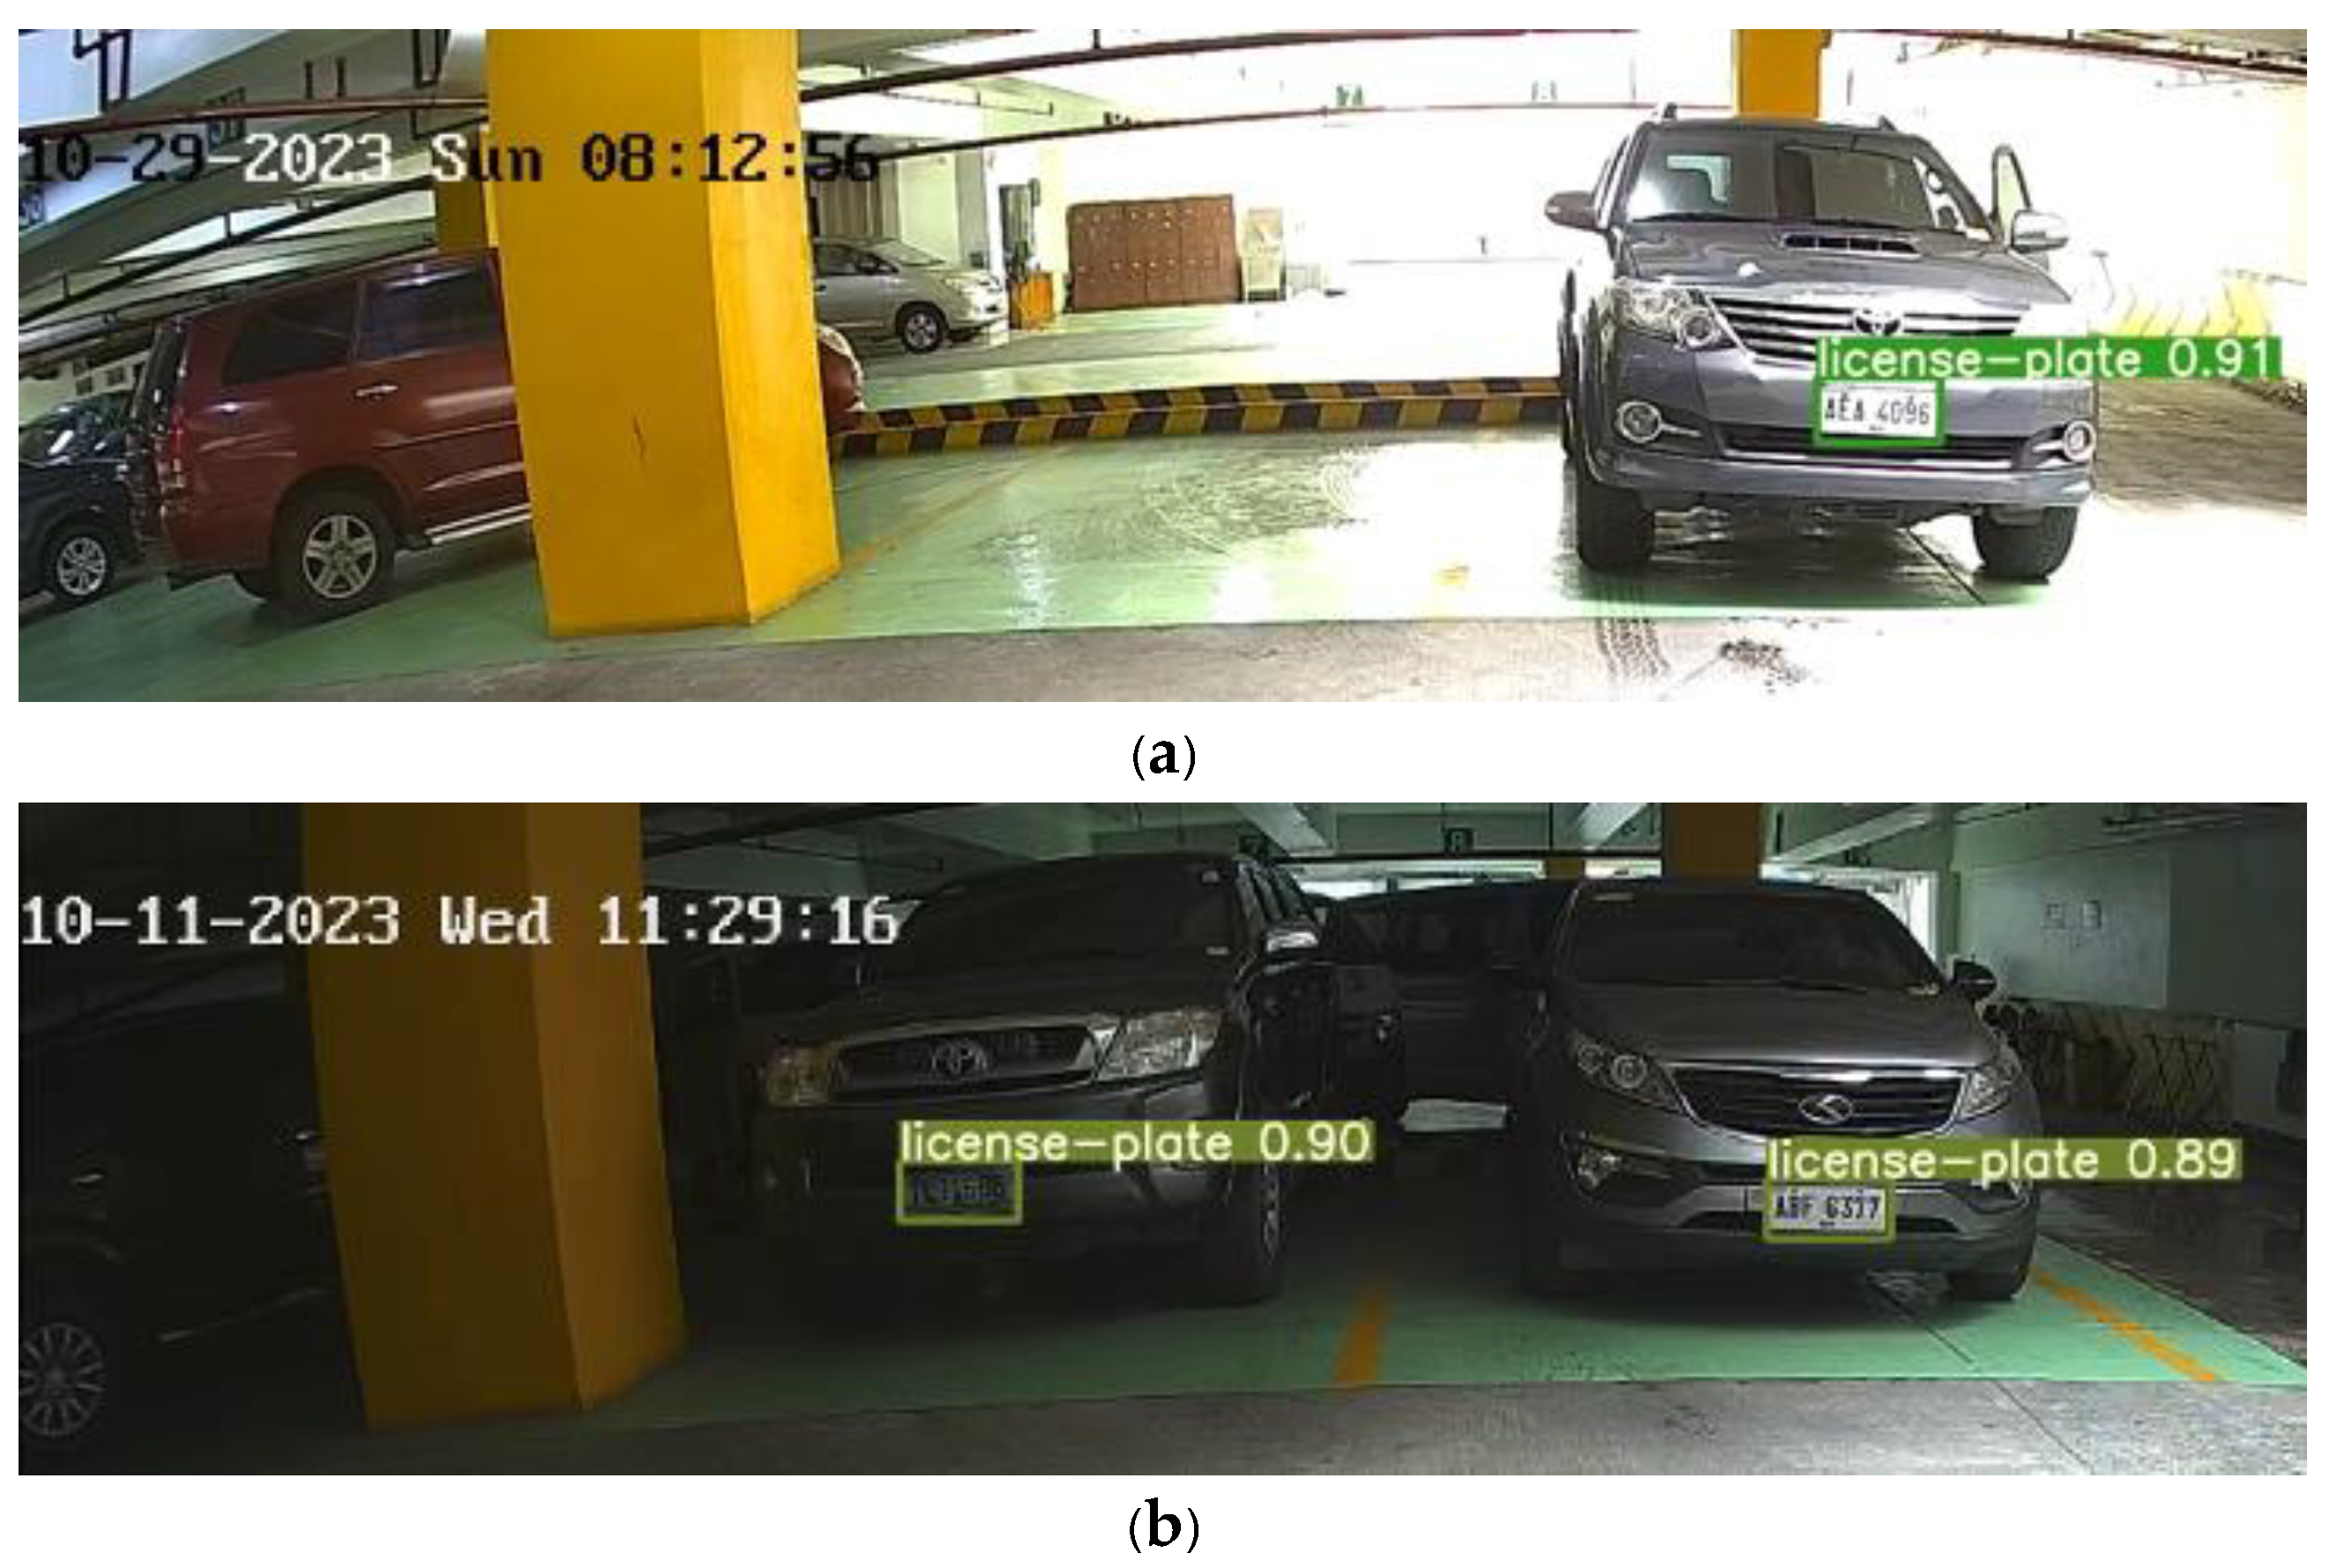
Figure 24.
Sample LPR Inference performed on video frame of parking facility footage. (a) Clear zoomed-in snapshot of the image frame, (b) Sample LPR reading stored in SQLite3 Database.
Figure 24.
Sample LPR Inference performed on video frame of parking facility footage. (a) Clear zoomed-in snapshot of the image frame, (b) Sample LPR reading stored in SQLite3 Database.
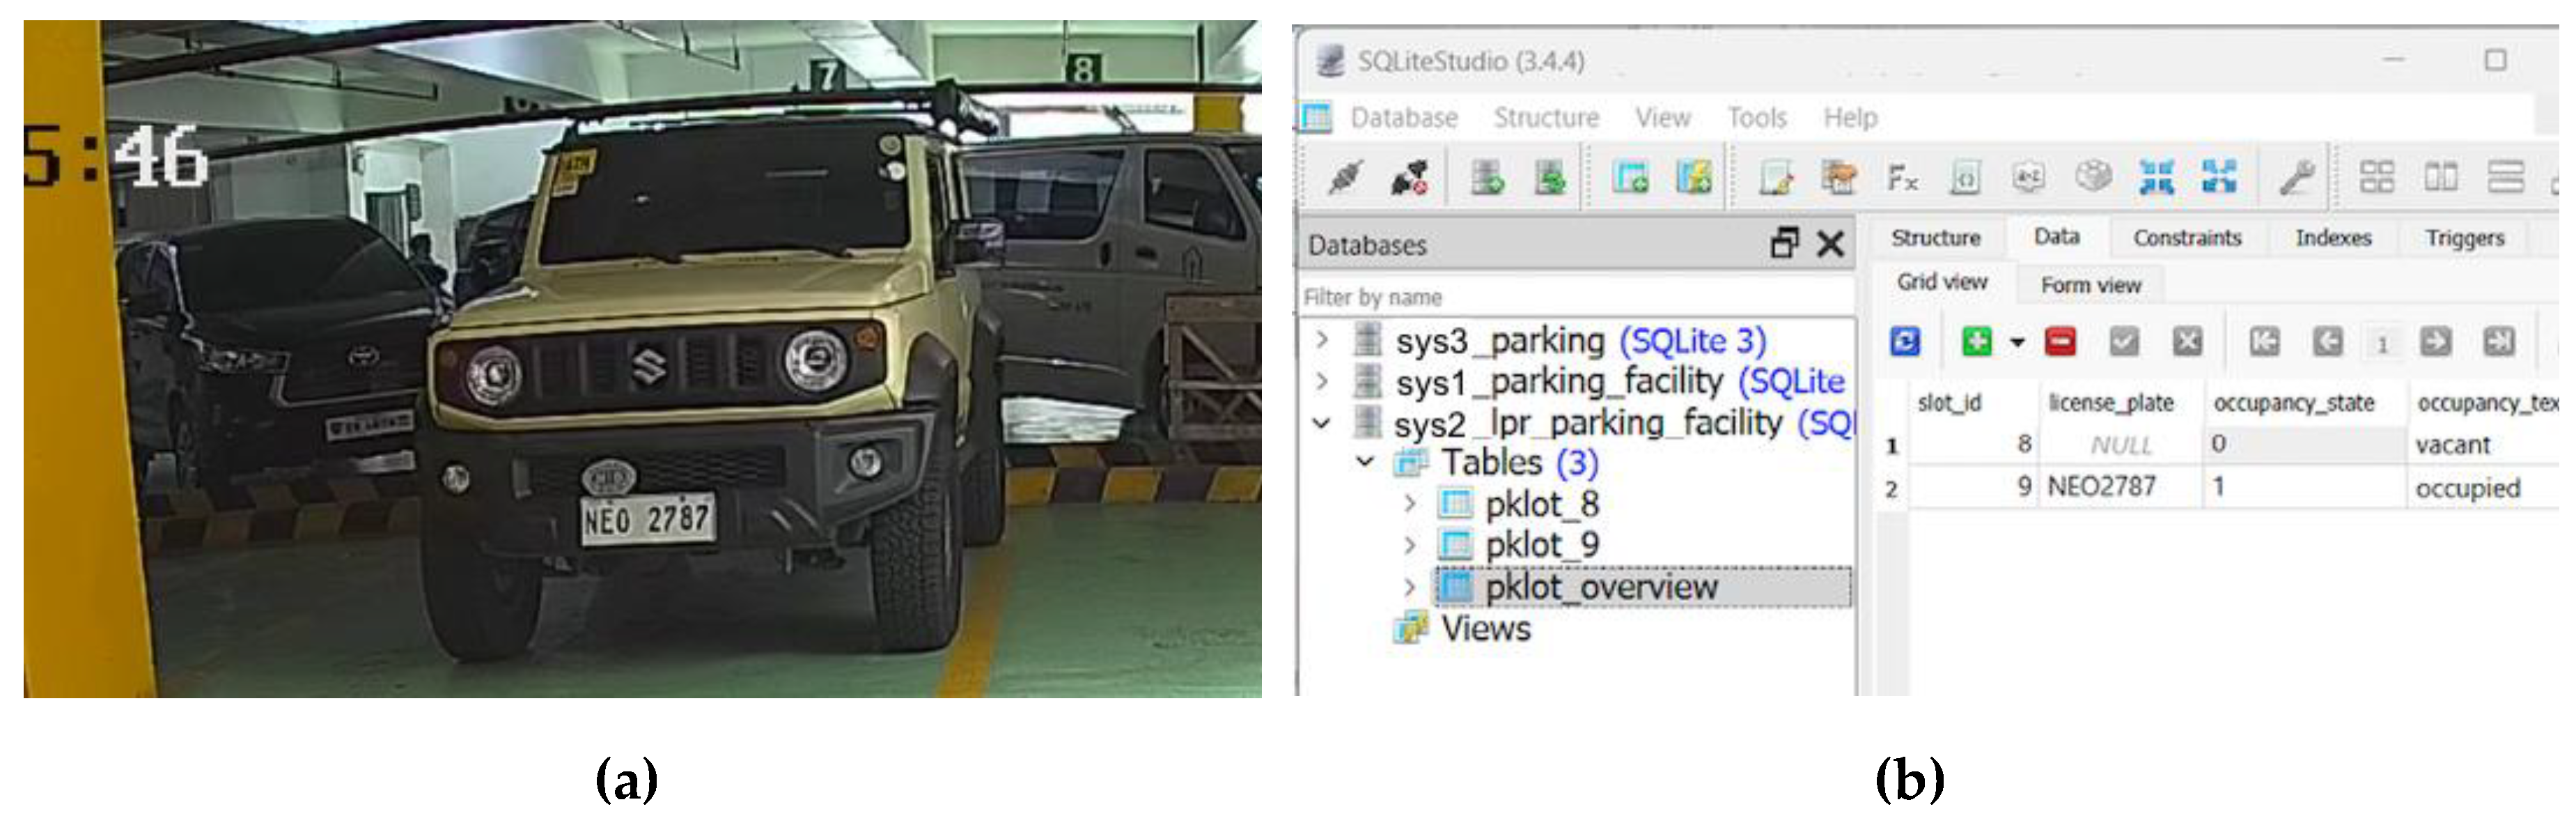
Figure 25.
Sample Output LPD Inferences taken from the (a) Entrance Driveway, and (b) the Exit Driveway during different times of the day.
Figure 25.
Sample Output LPD Inferences taken from the (a) Entrance Driveway, and (b) the Exit Driveway during different times of the day.
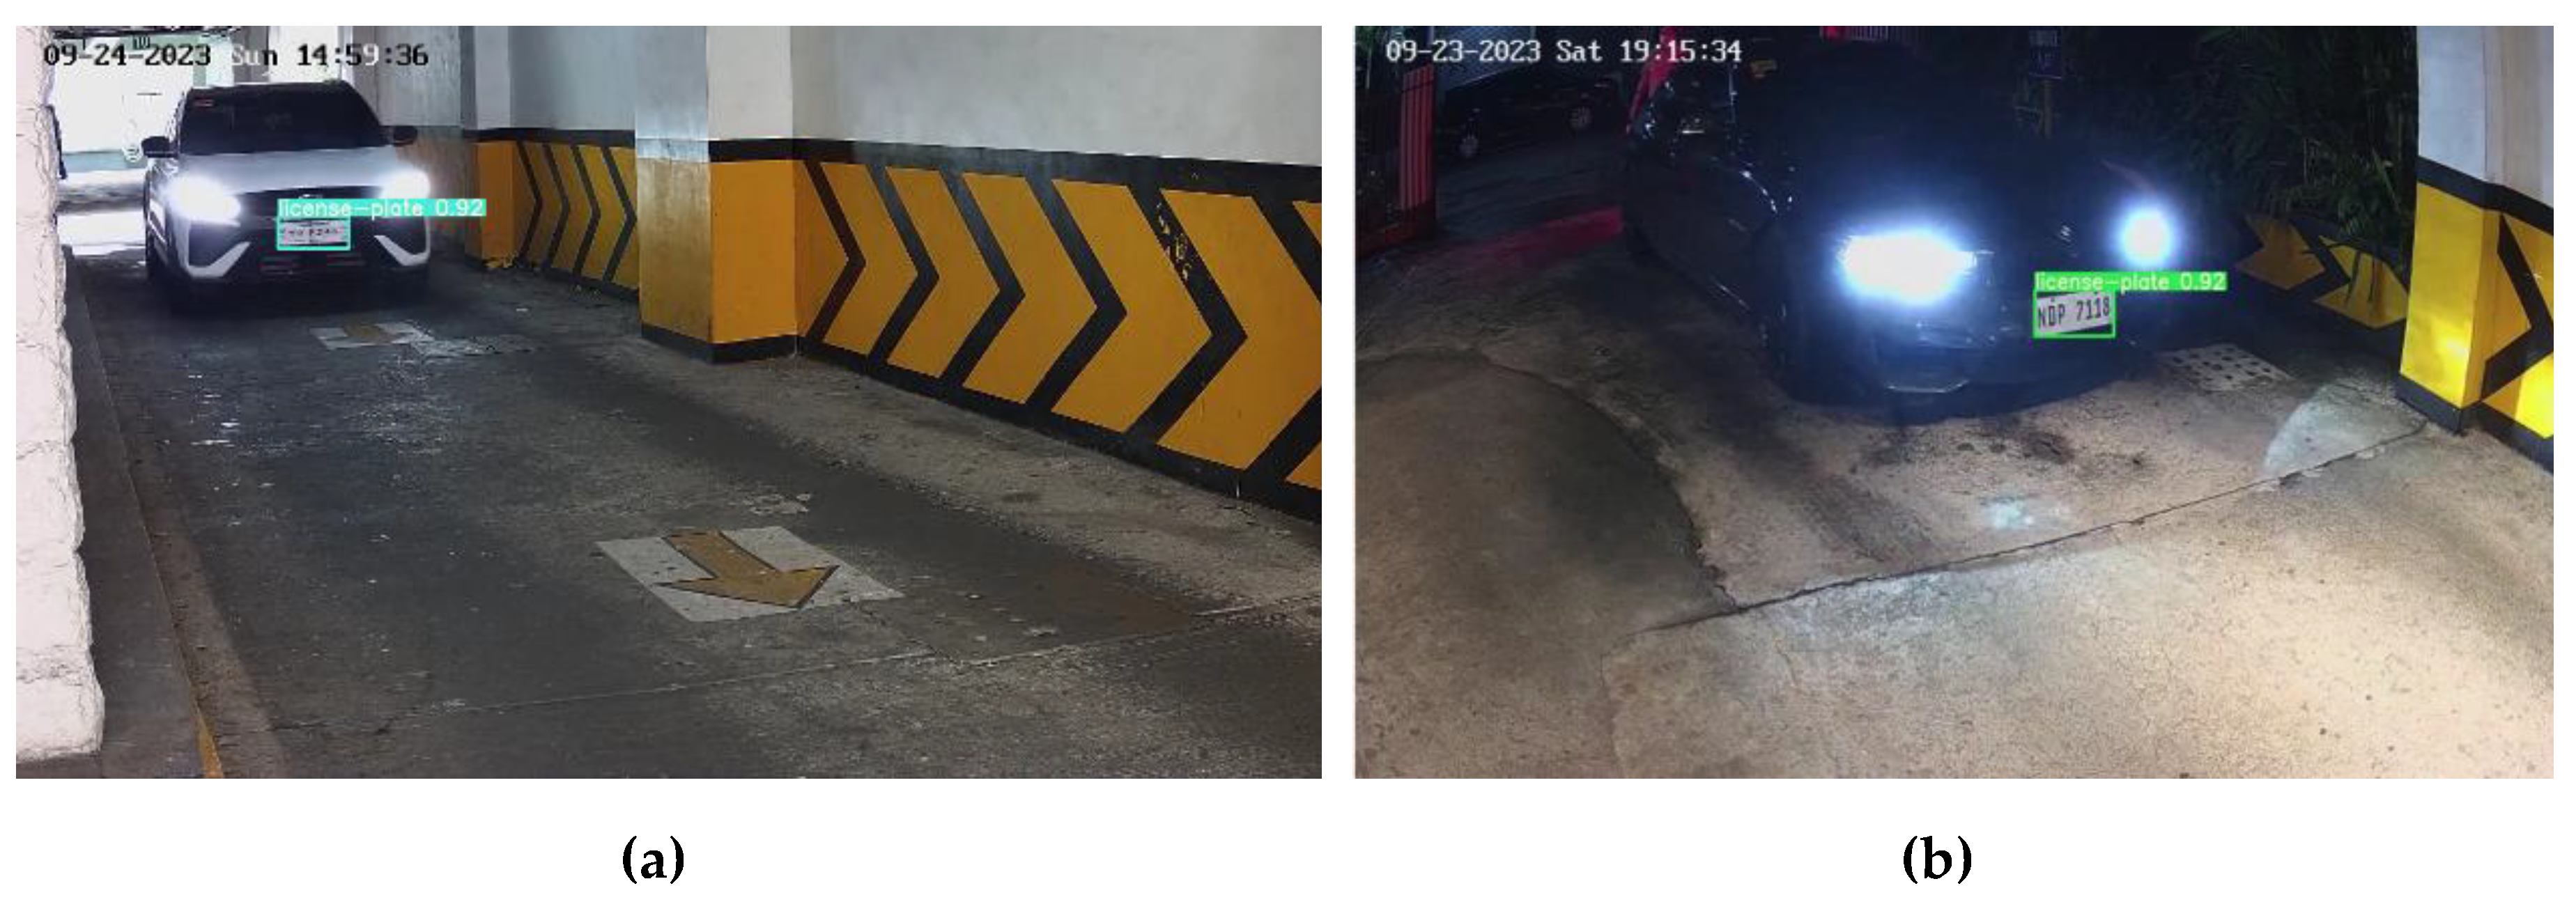
Figure 26.
Parking Space Numbering System for Database and BIM Model Reference. (a) The numbering system shown is for the vehicle detection-based POD feature system. (b) The numbering system for the LPR-based POD feature system.
Figure 26.
Parking Space Numbering System for Database and BIM Model Reference. (a) The numbering system shown is for the vehicle detection-based POD feature system. (b) The numbering system for the LPR-based POD feature system.
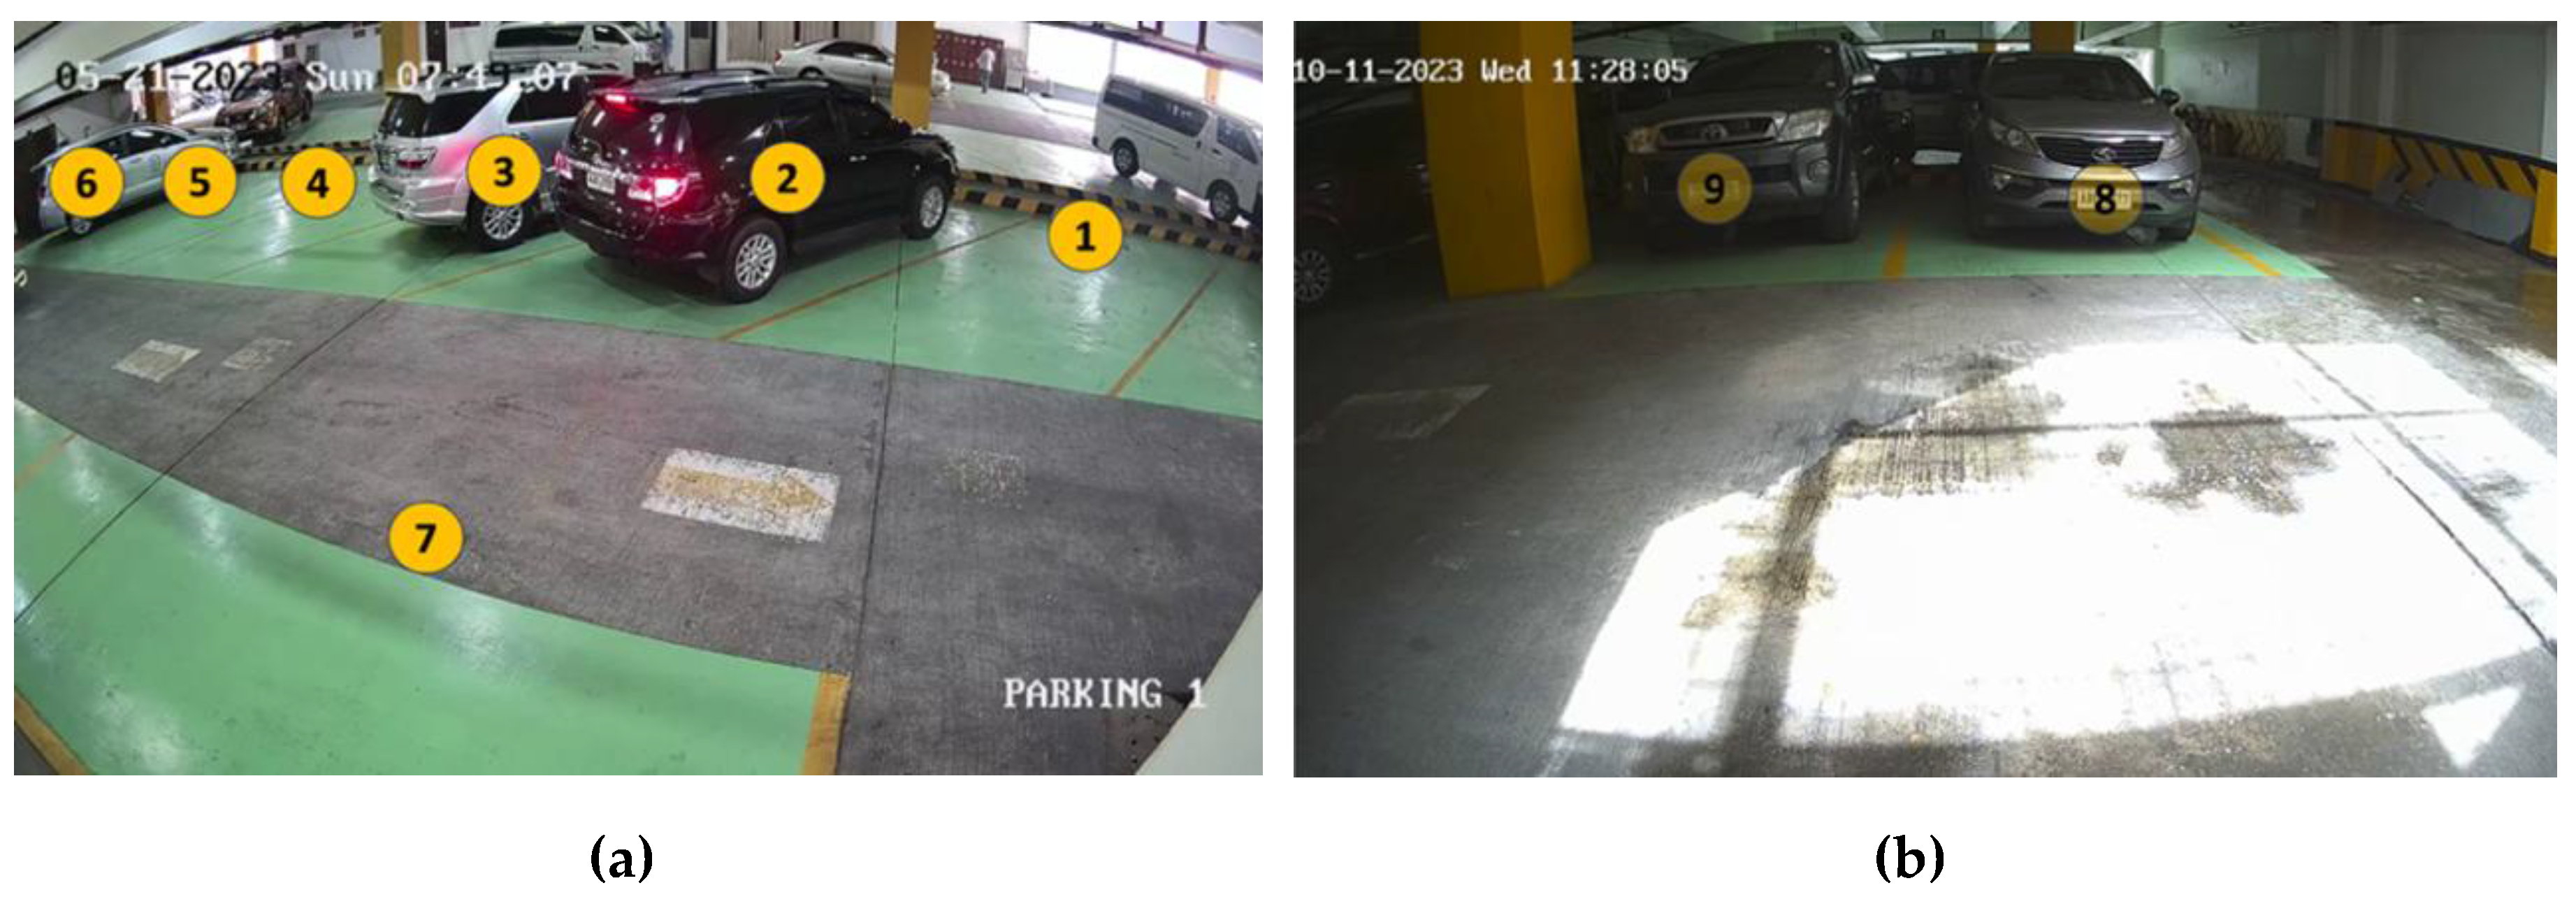
Figure 34.
DTM Data Dashboard Macro-Level Overview for the First Feature System. Metrics are displayed based on the specified filtration timestamps at the green-hued cells. Metrics are summarized at the top-middle of the dashboard, with various graphs provided below. These metrics explain vehicle parking activity for the whole parking based on vehicle occupancy in parking spaces.
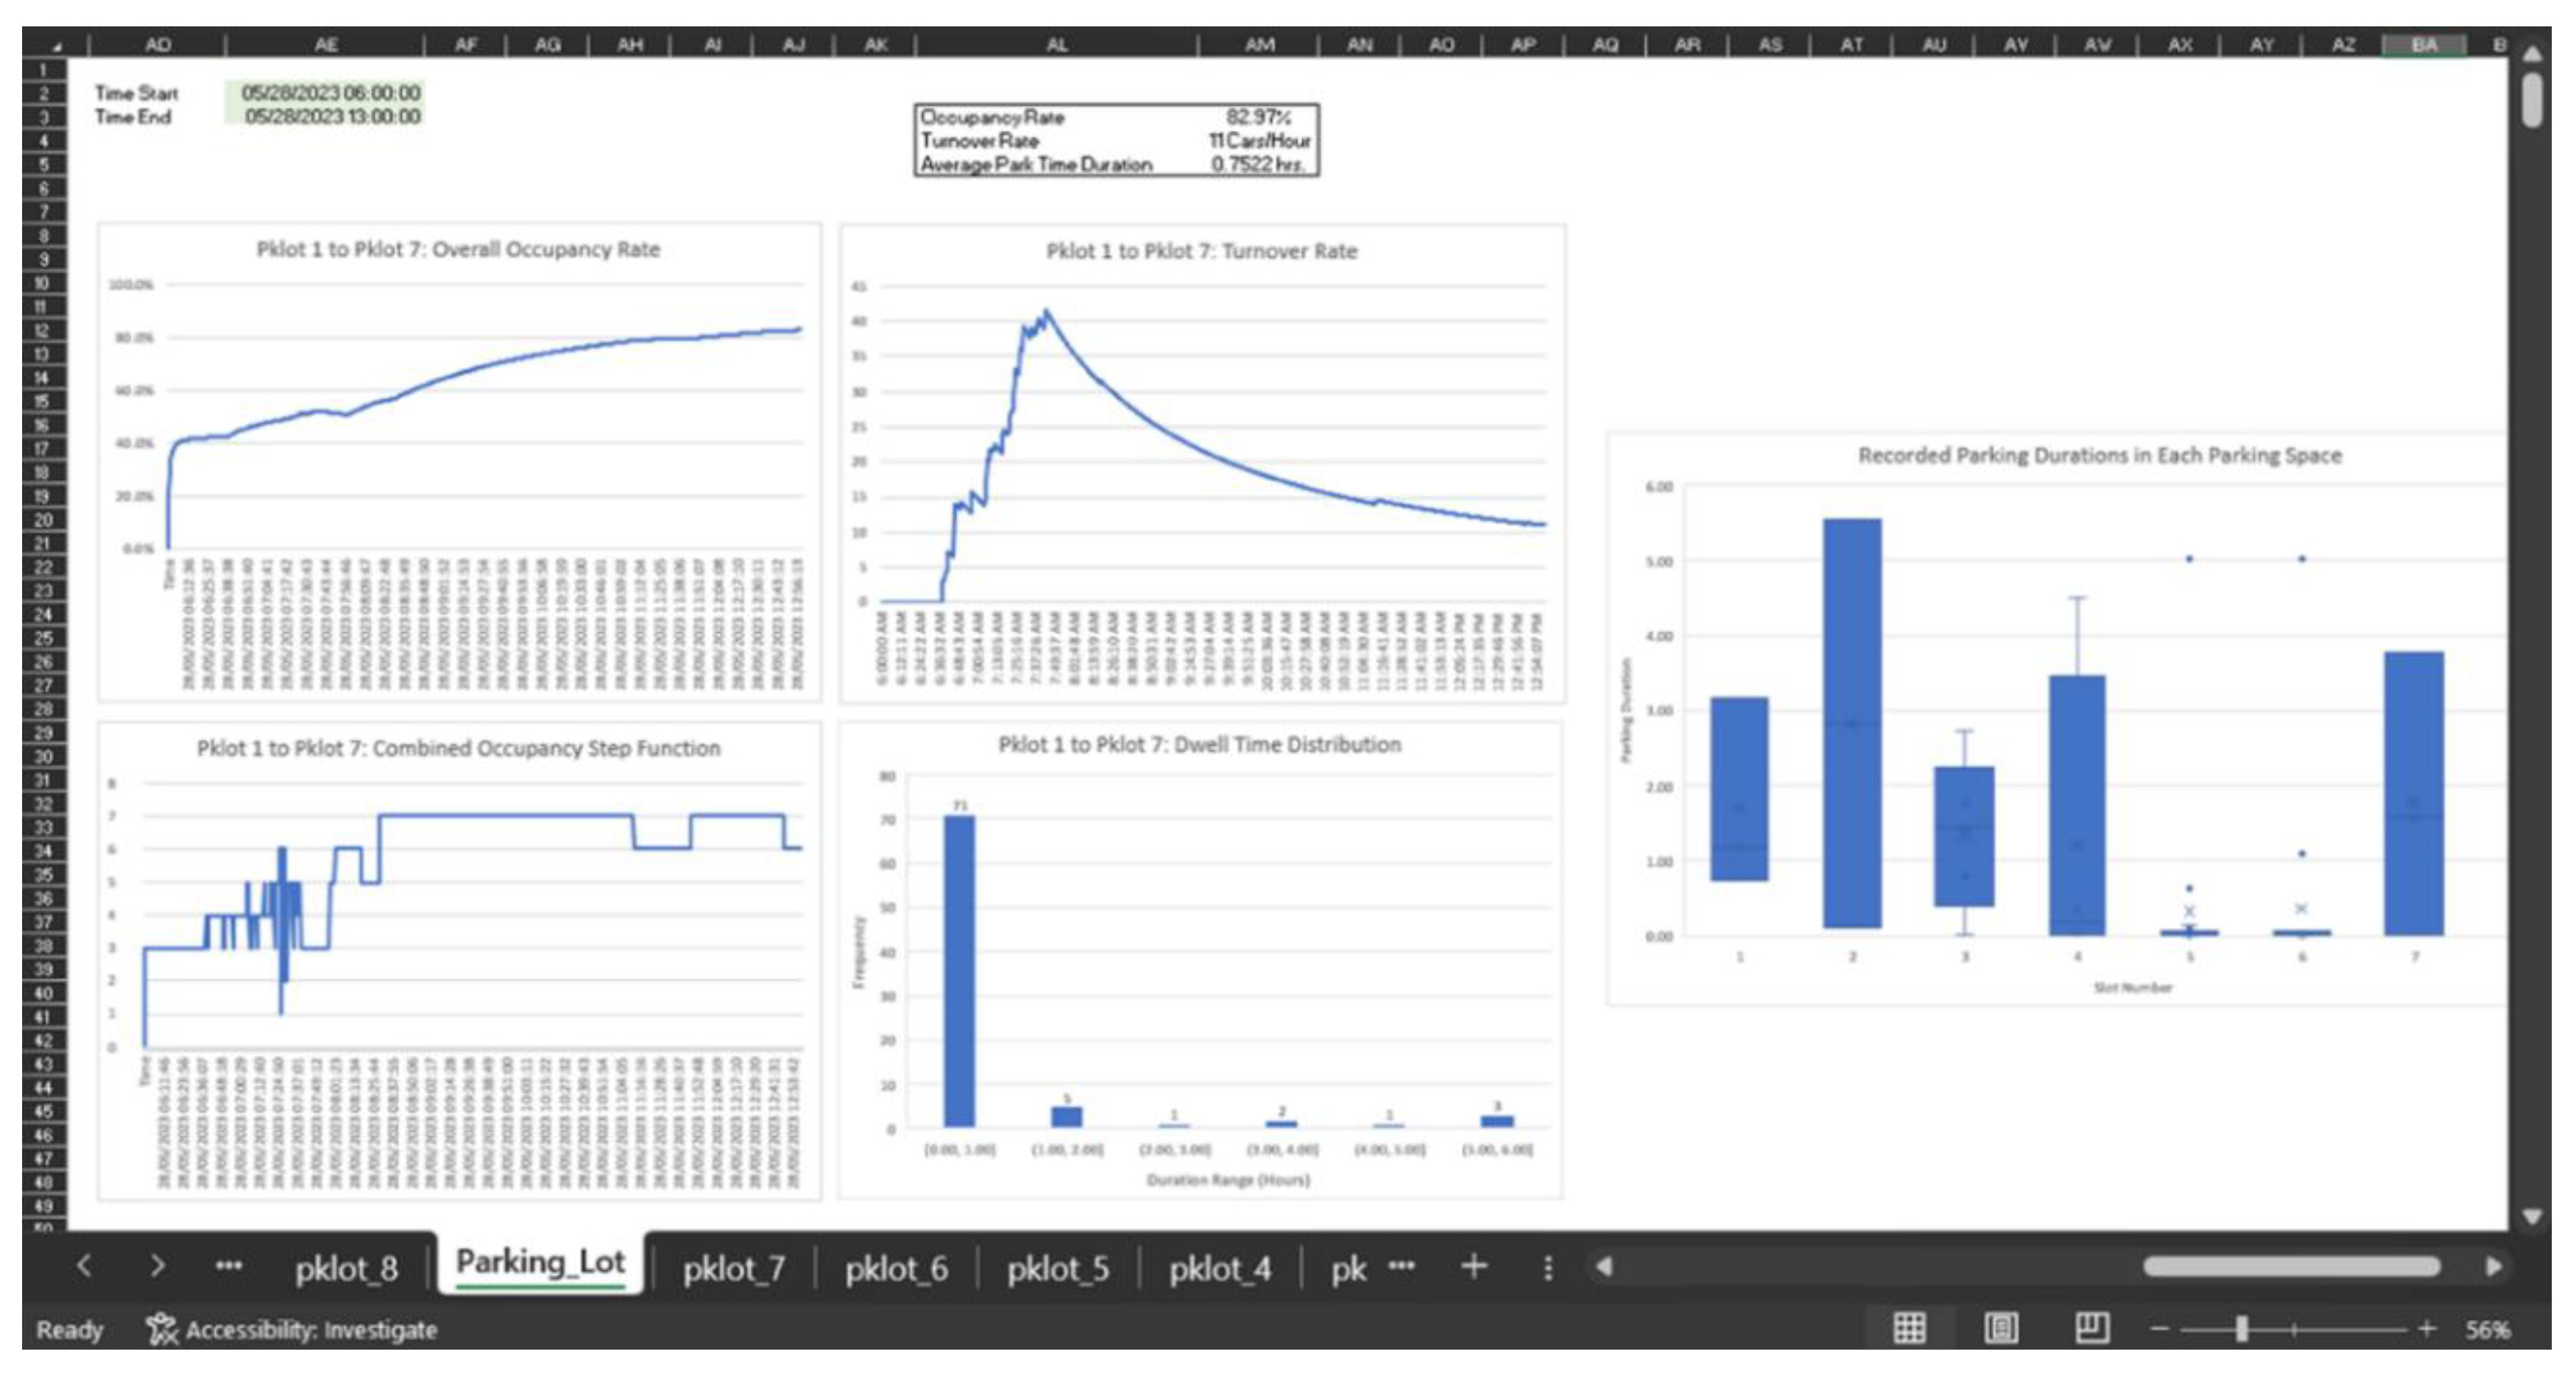
Figure 35.
Example sub-dashboard graph for Parking Slot #4. These graphs provide insights in parking activity behavior per parking slot.
Figure 35.
Example sub-dashboard graph for Parking Slot #4. These graphs provide insights in parking activity behavior per parking slot.
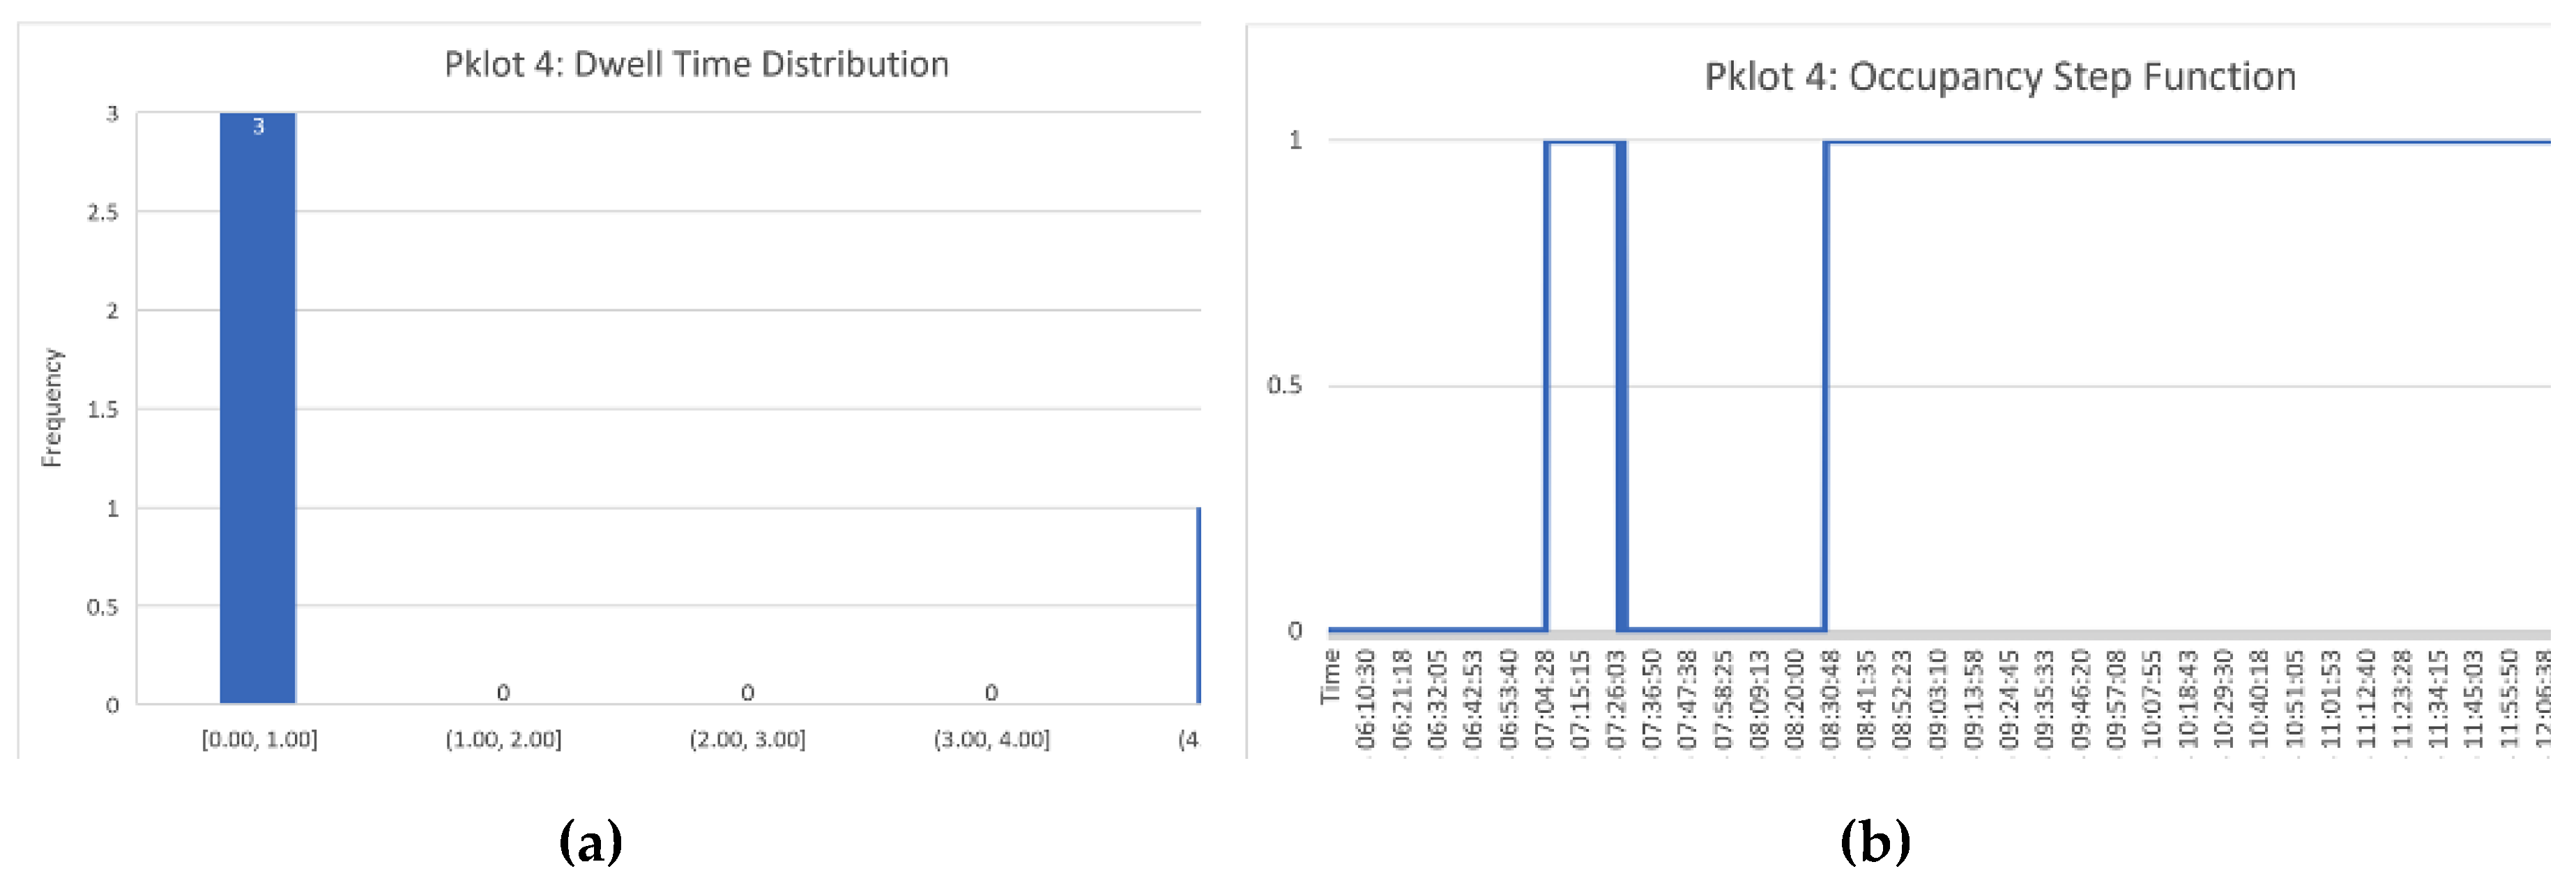
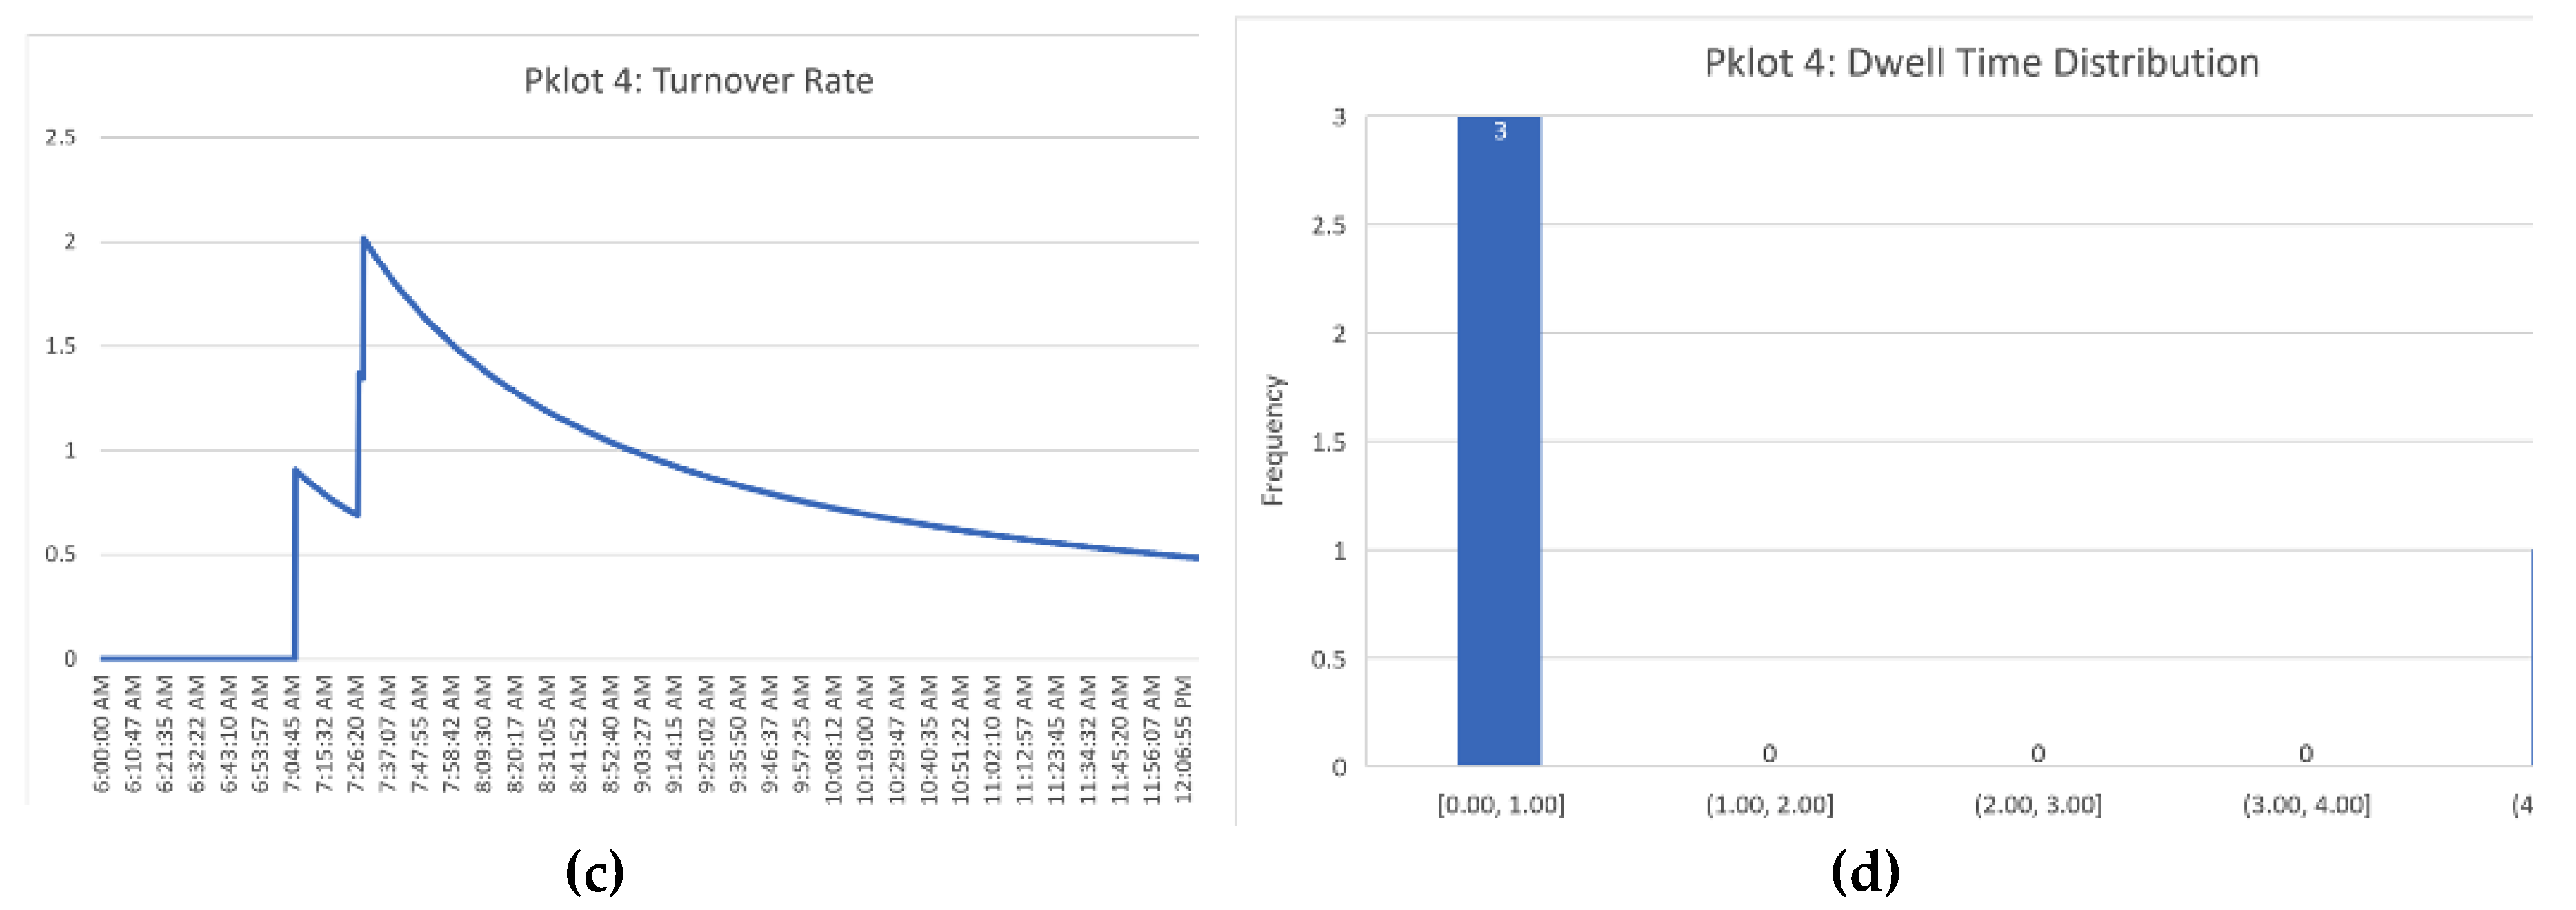
Figure 36.
DTM Data Dashboard Macro-Level Overview for the Third Feature System. Metrics are displayed based on the specified filtration timestamps at the green-hued cells. Metrics are summarized at the top-middle of the dashboard, with various graphs provided below to elucidate vehicle parking activity data in the parking facility based on vehicle entry and exit activity recorded by the parking management system.
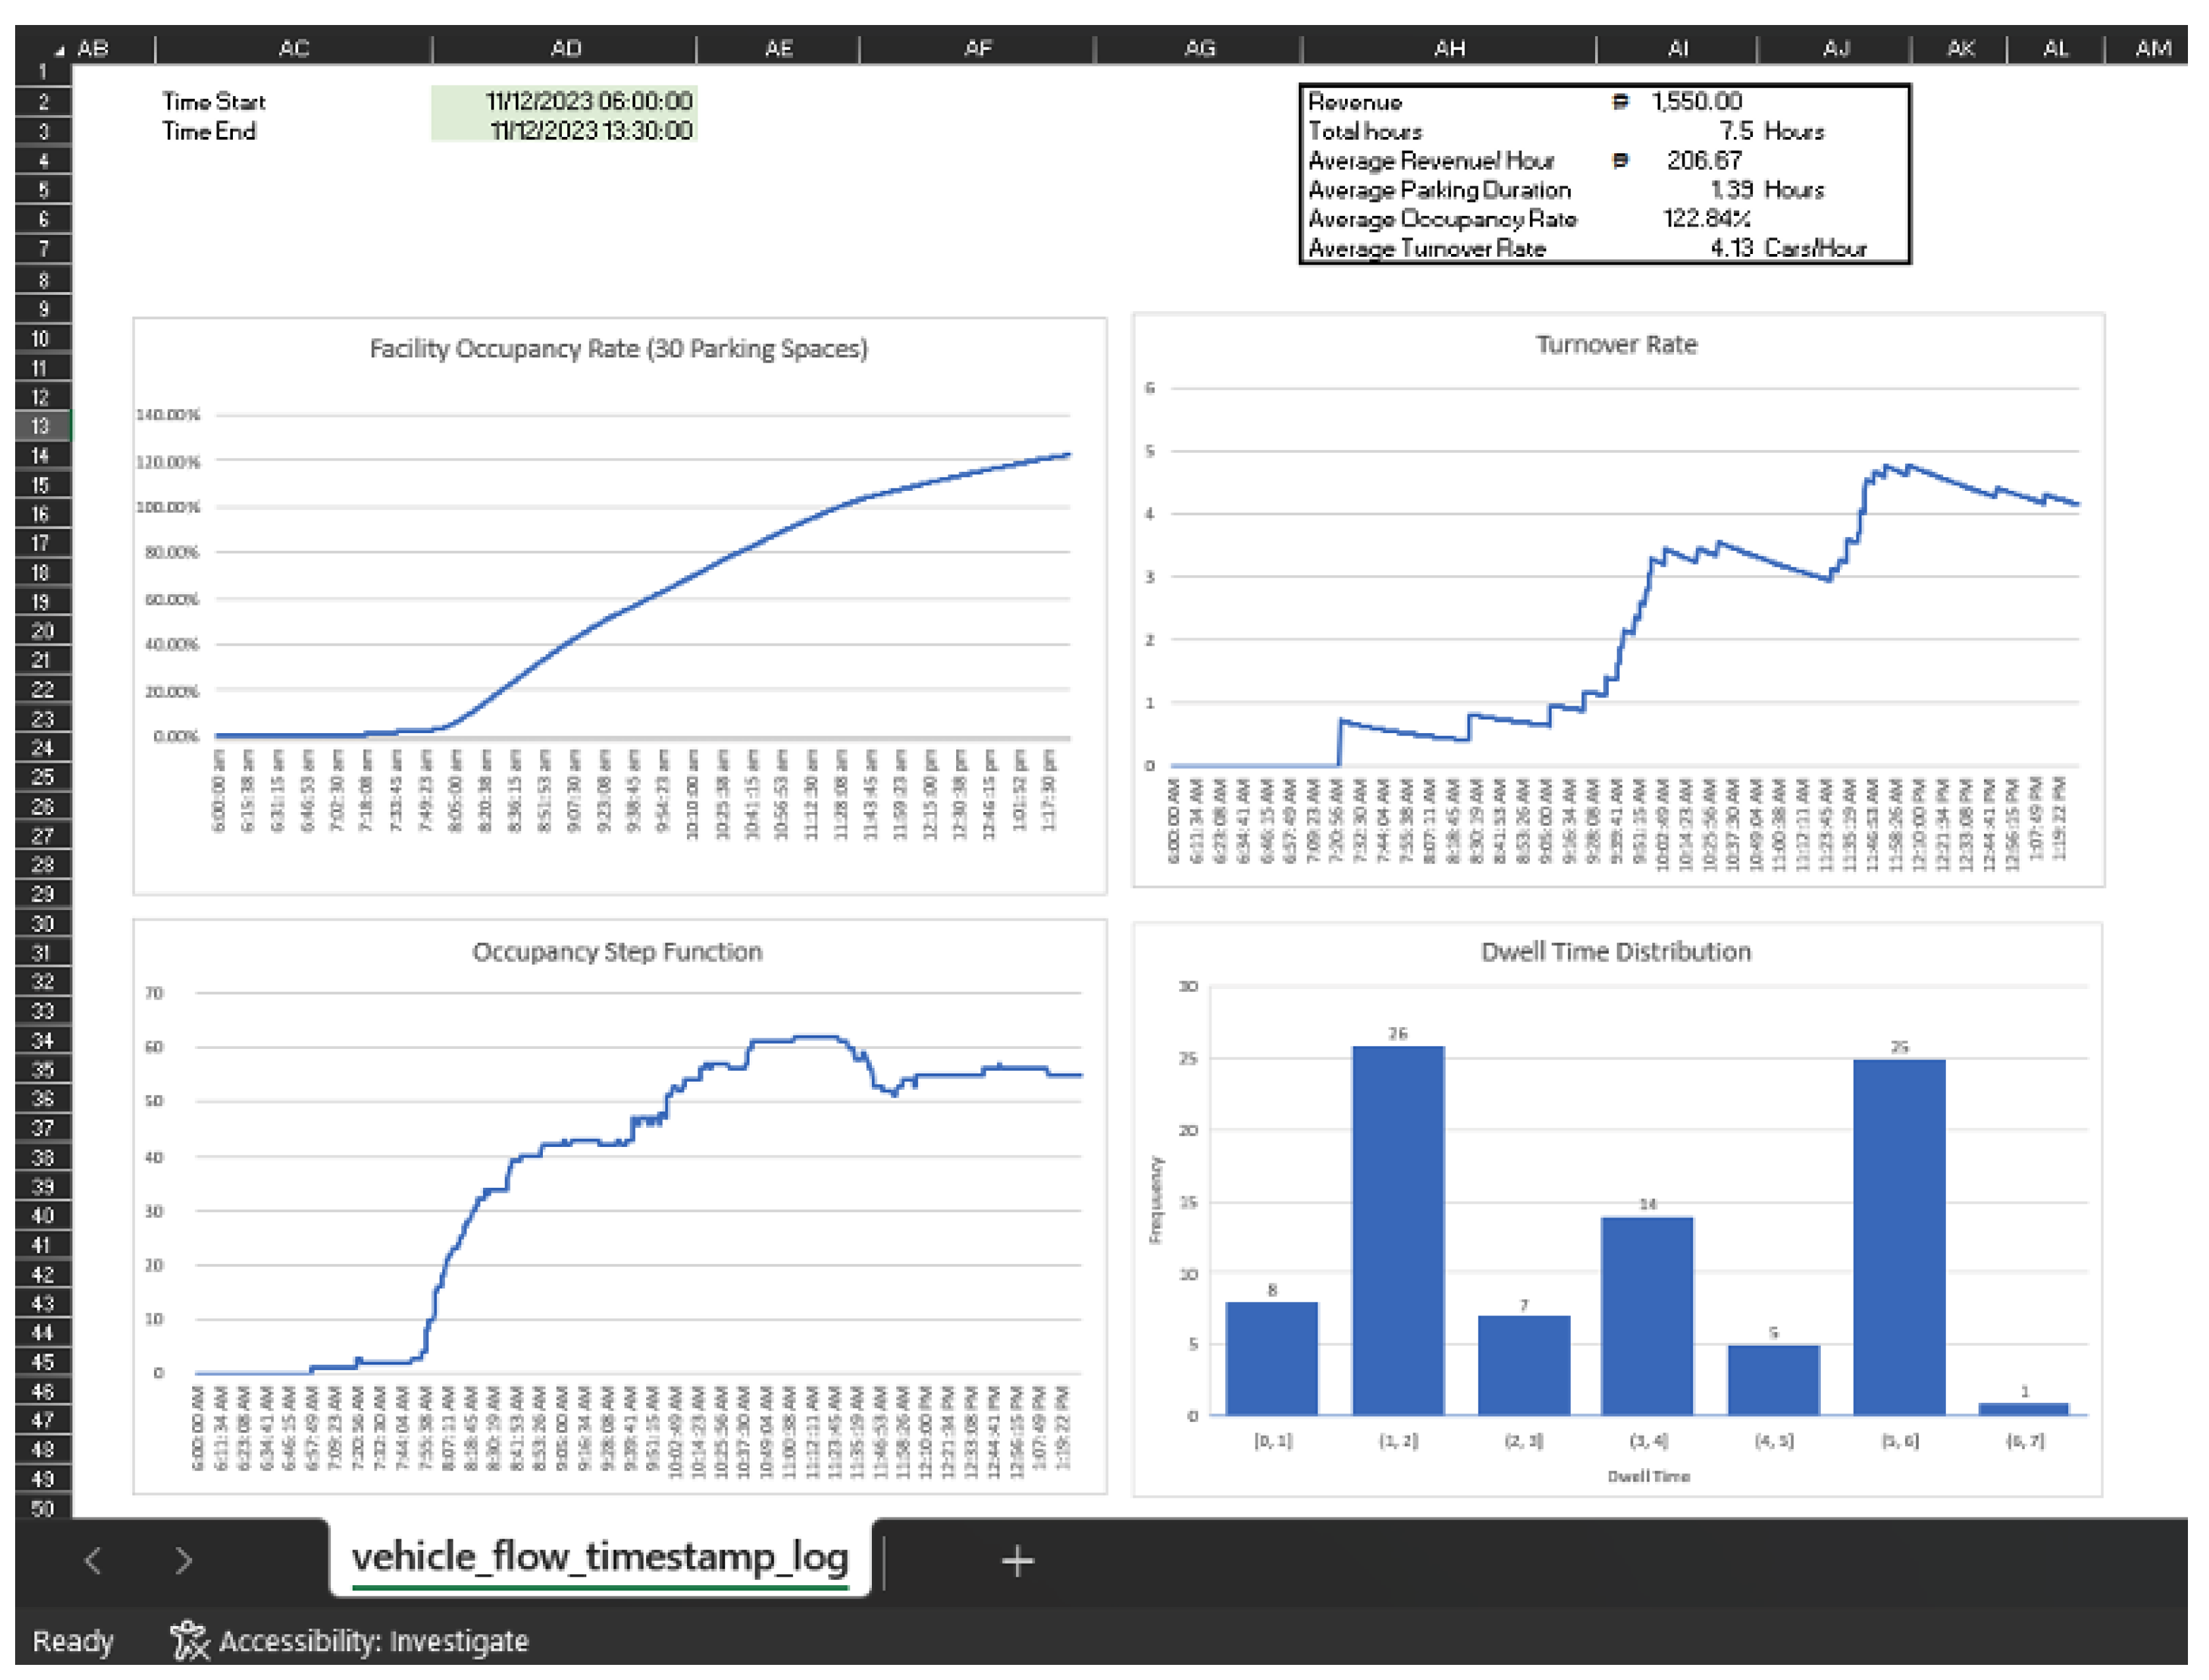
Figure 14.
Sample detected blurred license plate. Although LPD was performed successfully, the trained DTR model is unable to extract text from the blurred license plate.
Figure 14.
Sample detected blurred license plate. Although LPD was performed successfully, the trained DTR model is unable to extract text from the blurred license plate.
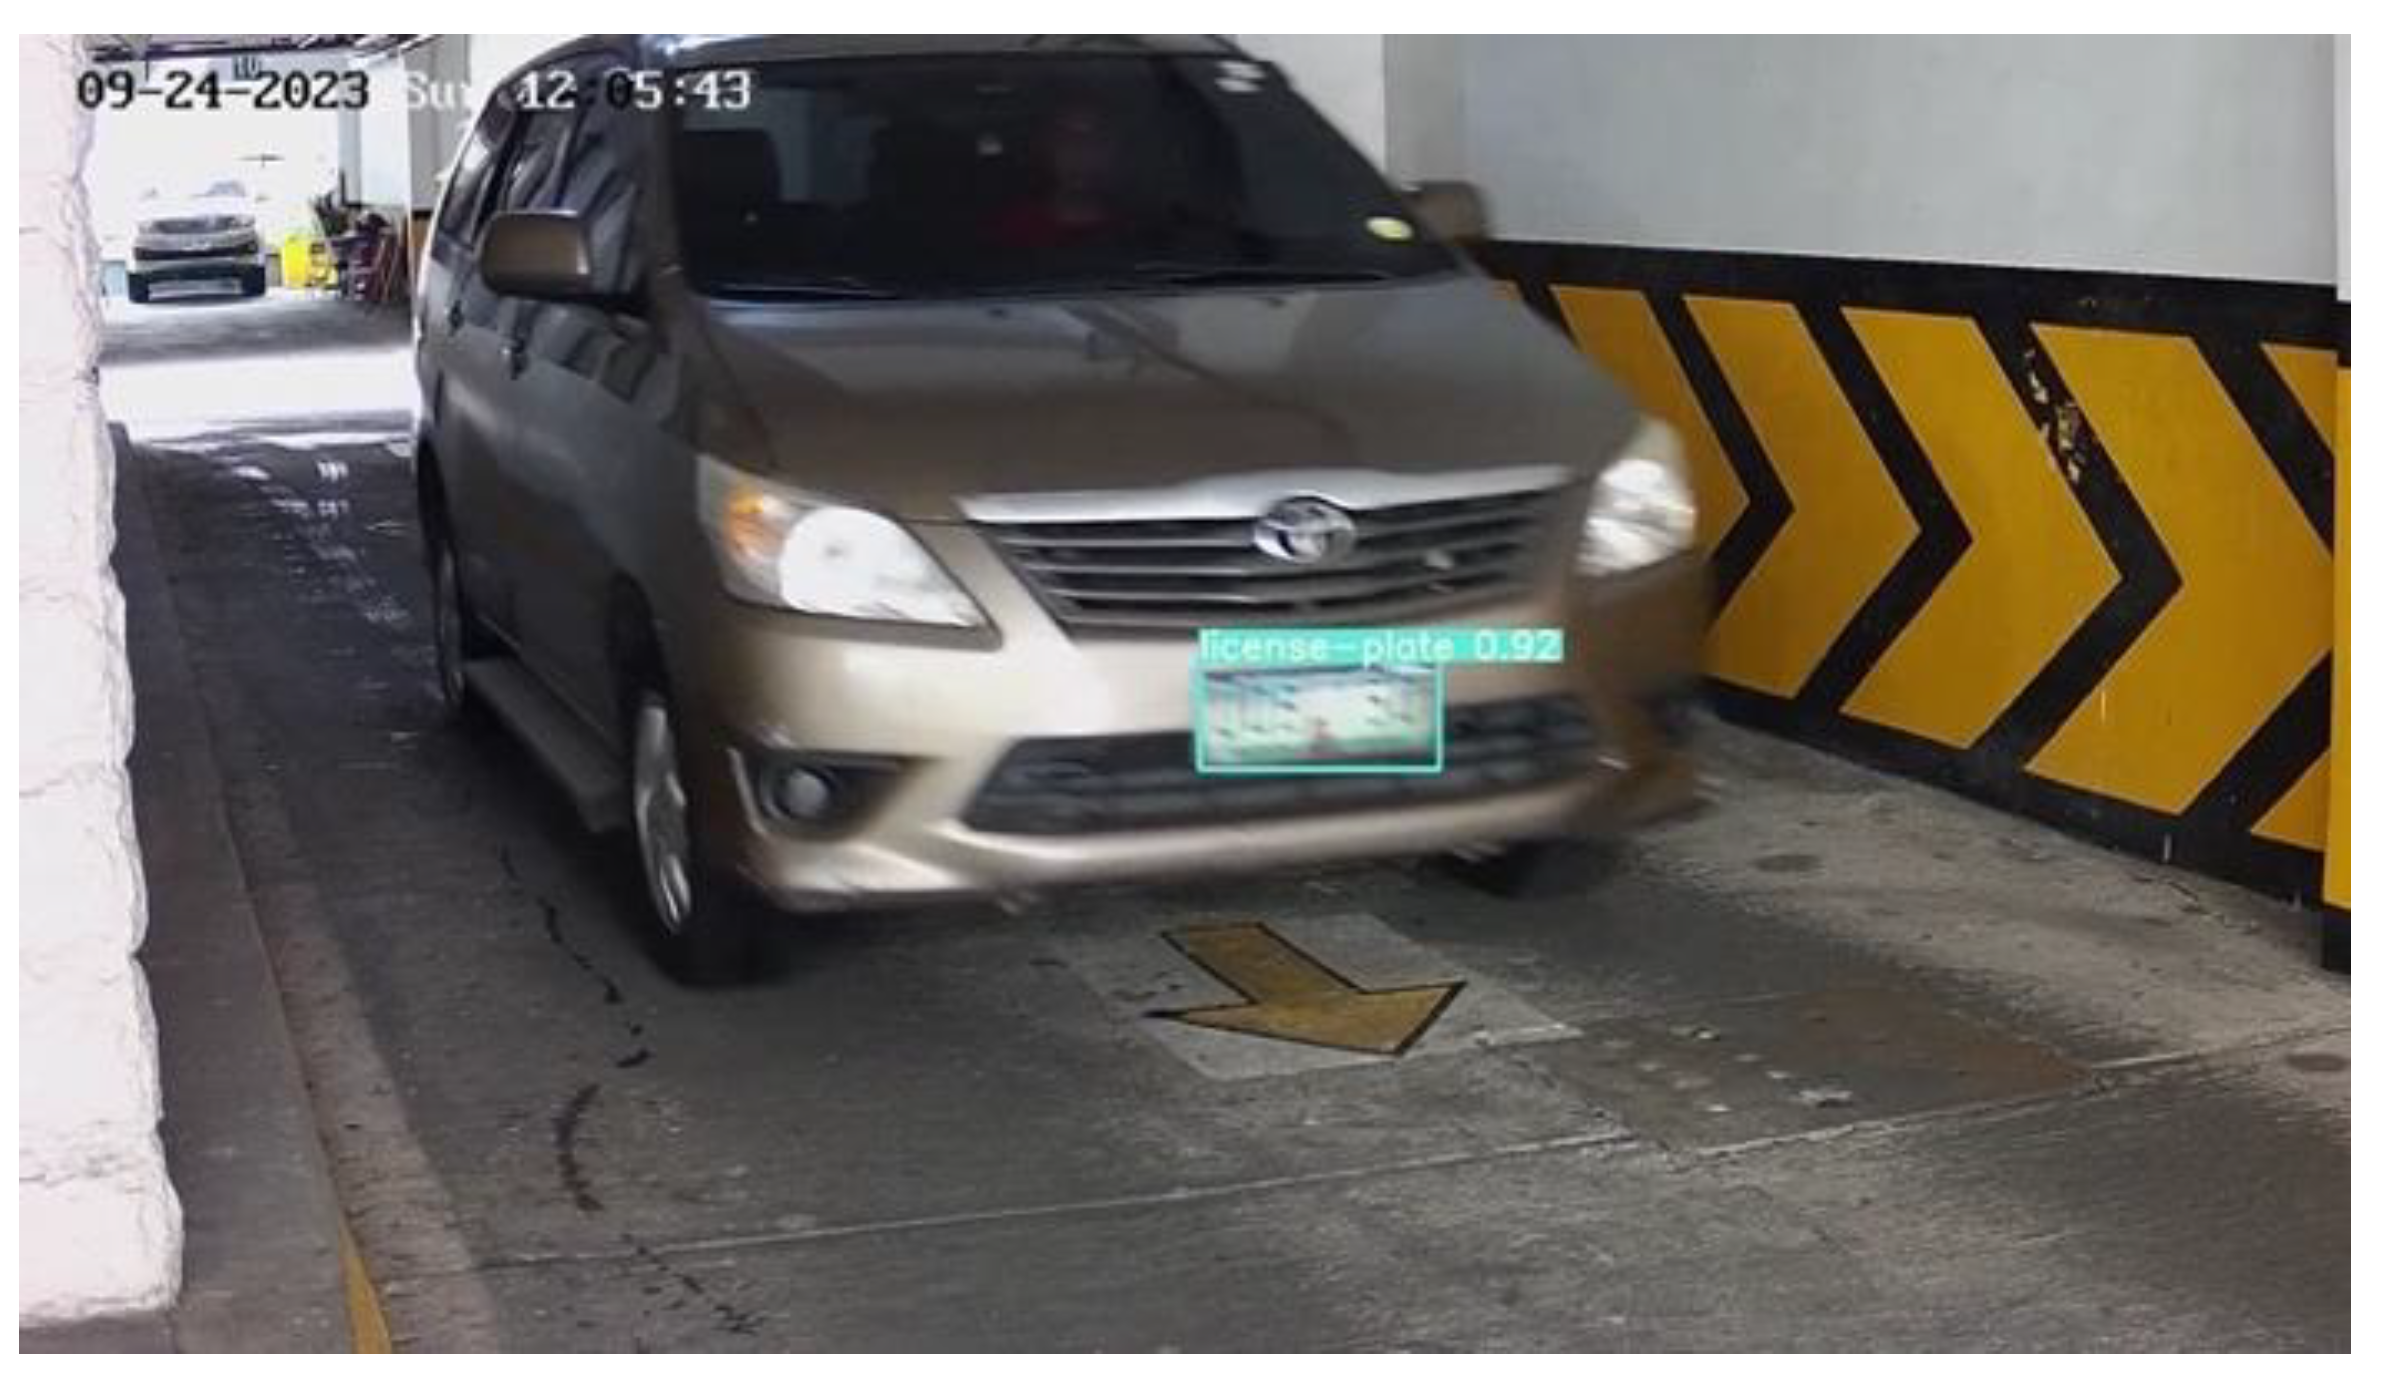
Figure 38.
Intense Sunlight Being Reflected on the Vehicle License Plates of Toyota Fortuner SUVs (right) in Two Separate Instances.
Figure 38.
Intense Sunlight Being Reflected on the Vehicle License Plates of Toyota Fortuner SUVs (right) in Two Separate Instances.
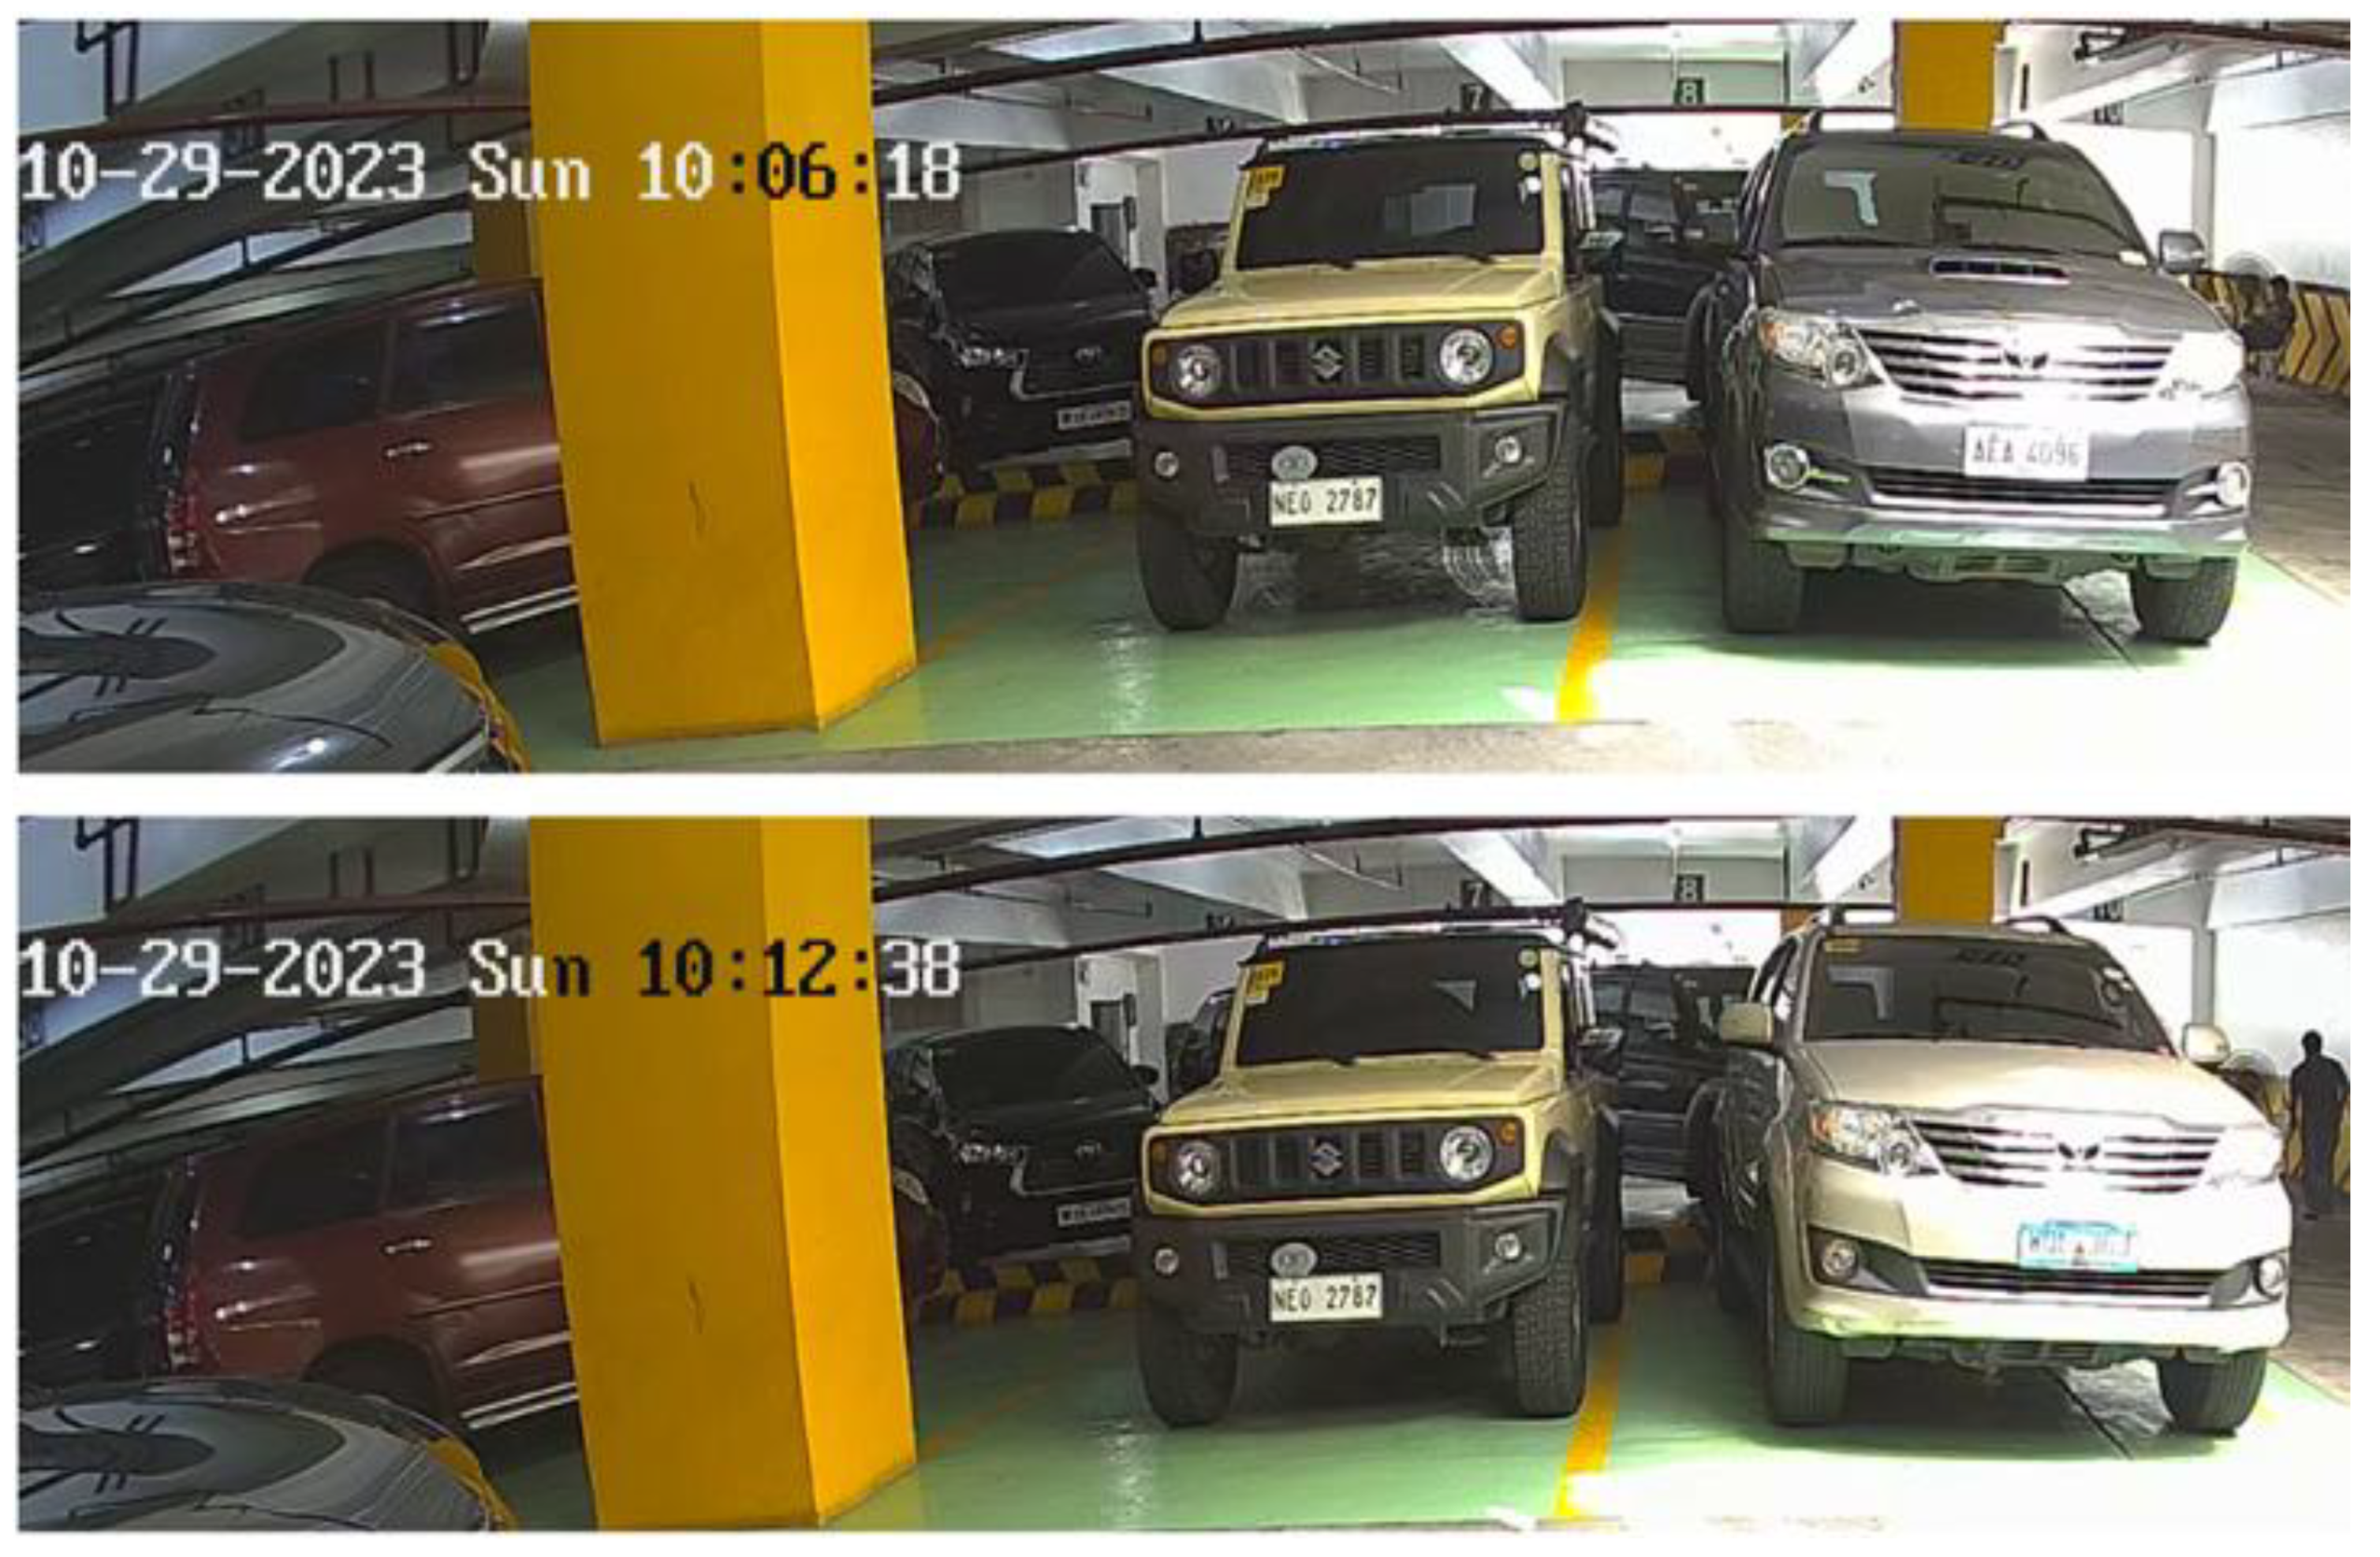
Figure 40.
Example Occluded Field of View of a Surveillance Camera.
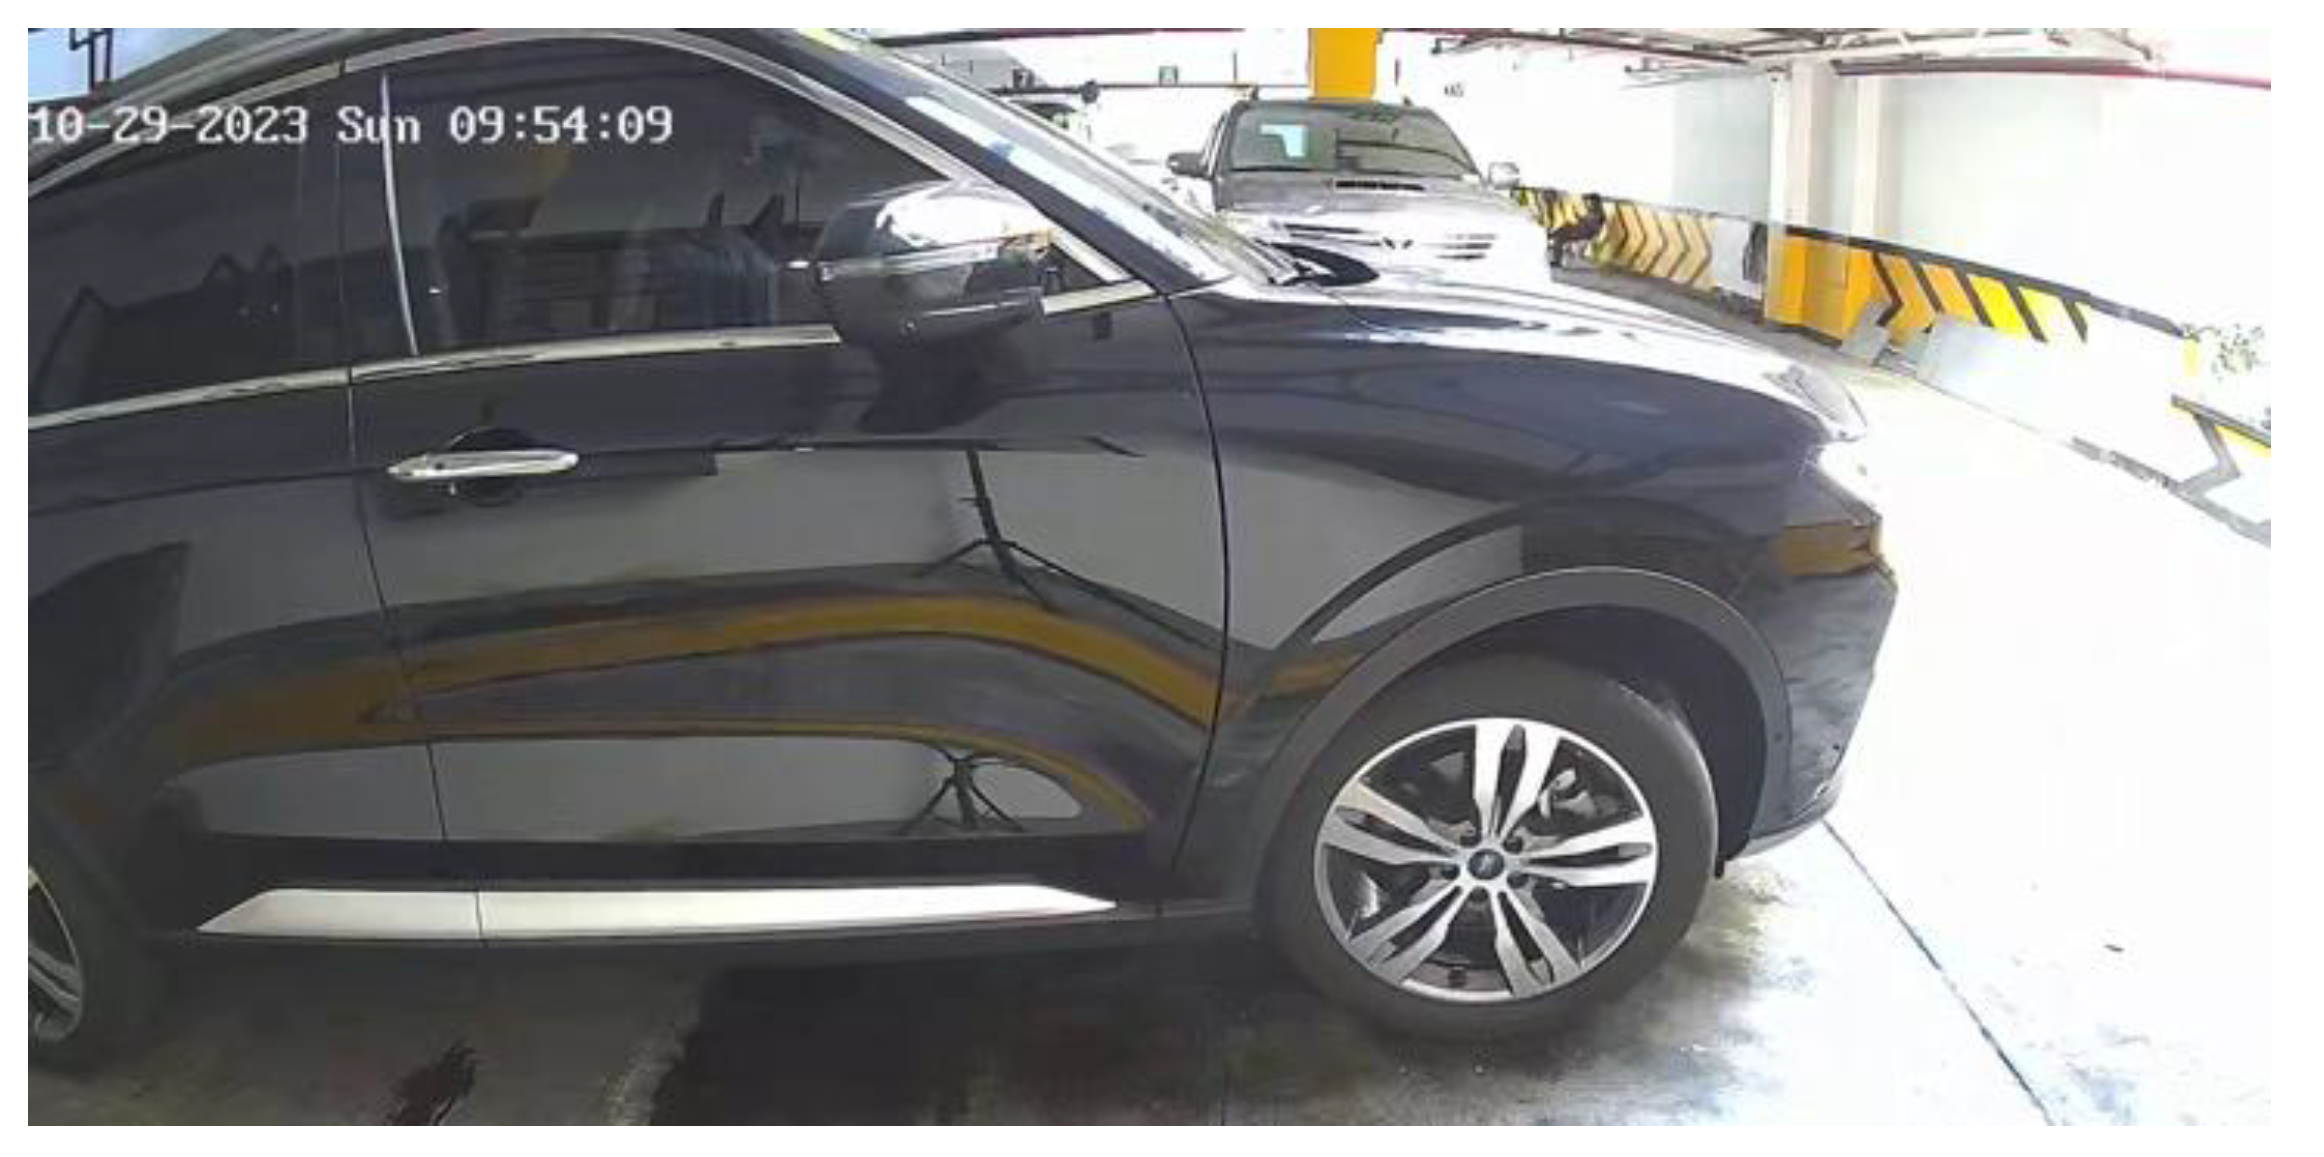

Table 1.
Literature Summary for ITS Research.
| Cluster |
Smart Application |
Publication Type |
Model Architecture |
Country | Number | |
| Traffic Control Management Applications | Vehicle Detection (10) |
Journal (3) | YOLO | Taiwan | [52,65] | |
| Mask R-CNN | USA | [19] | ||||
| Conference (7) | Deep CNN | [19] | ||||
| ANN | Philippines | [66] | ||||
| CNN | [59] | |||||
| OpenCV | Malaysia | [67] | ||||
| YOLO | Italy | [61] | ||||
| Vietnam | [68] | |||||
| Philippines | [69] | |||||
| License Plate Detection (8) |
Journal (2) | Inception V2 | [70] | |||
| Faster R-CNN | [57] | |||||
| Conference (6) | Bangladesh | [71] | ||||
| SSD | ||||||
| India | [72] | |||||
| Jordan | [40] | |||||
| YOLO | Italy | [61] | ||||
| Philippines | [36] | |||||
| License Plate Text Recognition (7) |
Journal (2) | Faster R-CNN | [57] | |||
| Inception V2 | ||||||
| Conference (5) | ANN | [8] | ||||
| Jordan | [40] | |||||
| Italy | [61] | |||||
| SSD | Bangladesh | [71] | ||||
| OpenCV | Korea | [43] | ||||
| Smart Parking Management Applications | Vehicle Detection (5) |
Journal (3) | YOLO | Croatia | [50] | |
| Korea | [33] | |||||
| MobileNetV3 | [49] | |||||
| Conference (2) | Deep CNN | India | [37] | |||
| Mask R-CNN | China | [38] | ||||
| License Plate Detection (6) |
Journal (1) | YOLO | Korea | [33] | ||
| Conference (5) | SSD | Jordan | [40] | |||
| Russia | [58] | |||||
| YOLOR | Philippines | [6,16] | ||||
| Faster R-CNN | [60] | |||||
| License Plate Text Recognition (6) |
Journal (1) | OpenCV | Korea | [33] | ||
| Conference (5) | ANN | Jordan | [40] | |||
| Resent-18 | Russia | [58] | ||||
| EasyOCR | India | [72] | ||||
| Philippines | [6,16] | |||||
| Deep Text Recognition | [36] |
Table 2.
Vehicle Detection-based POD Algorithm.
| Step 1: | Perform vehicle detection on video frame. | |
|
|
(1) | |
| Step 2 | Generate the accounting for seven parking spaces. | |
|
|
(2) | |
|
|
(3) | |
| Step 3: | Perform NumPy thresholding (80 pixels) to obtain the . |
|
|
|
(4) | |
|
|
(5) | |
| Step 4: | Generate the Flattened 1D Occ State Array for the current frame. | |
|
|
(6) | |
| Step 5 | Determine if the current inference is the first detection since initialization. IF first, THEN ELSE WHERE: |
|
|
|
(7) | |
|
|
(8) | |
| Step 6: | Examine all column elements in the to determine which parking spaces had changes in their occupancy state. | |
| Step 7: | Push updated data to the database depending on each value in the . |
|
| Step 8: | Return to Step 1. | |
Table 3.
License Plate Recognition-based POD Algorithm.
| Step 1: | Perform license plate detection on video frame. | |
| Step 2: | Generate the for the two parking spaces. | |
| Step 3: | Perform NumPy thresholding (70 pixels) to obtain the . |
|
| Step 4: | Generate the for the current frame. | |
| Step 5: | Determine if the current inference is the first detection since system initialization. IF first, THEN ELSE |
|
| Step 6: | Examine all column elements in the to determine which parking spaces had changes in their occupancy state. |
|
| Step 7: | Perform corresponding action for each element found in the . IF THEN Perform License Plate Recognition and Extract LPR Reading. ELSE: Do not perform LPR. |
|
| Step 8: | Return to Step 1. |
Table 4.
LPR Entry/Exit DBMS Data Processing Algorithm.
| Step 1: |
LPR during Vehicle Entry: The vehicle is subjected to LPR upon entry. |
|
| Step 2: |
Entry Record Creation: A new row is generated in the 进_car_record table to record the entry, which includes the entry timestamp, the LPR reading, and the reading score outputted by the system's model. |
|
| Step 3: |
Creation of Flow Log: In the vehicle_flow_timestamp_log table, a row entry is generated in to start the cycle record of the vehicle's activity within the facility. |
|
| Step 4: |
Mirrored Entry Timestamp and Foreign Key: The 进_timestamp from 进_car_record is mirrored in vehicle_flow_timestamp_log, which also stores the 进_car_record PK as an FK. |
|
| Step 5: |
Vehicle Exit and LPR: When the vehicle departs, the system records an exit LPR reading and timestamp in a new 出_car_record table row. |
|
| Step 6: |
Entry Record Matching: The system retrieves the latest matching PK from the 进_car_record table based on the vehicle's LPR reading at exit, ensuring accurate tracking of the most recent entry, even with multiple visits per day. |
|
| Step 7: |
Linking to Flow Log: The entry foreign key of the identified primary key from the 进_car_record table is then used to locate it within the vehicle_flow_timestamp_log table. This ensures the entry and exit data belong to the exact vehicle instance. |
|
| Step 8: |
Mirroring Exit Timestamp and Foreign Key: The exit record's primary key is stored as an foreign key in the vehicle_flow_timestamp_log table, and the exit timestamp (出_timestamp) is mirrored into the vehicle_flow_timestamp_log table. |
|
| Step 9: |
Automatic Calculations: SQLite3 value expressions compute total parking duration (in seconds and hours) and invoicing based on pricing, using timestamps from the vehicle_flow_timestamp_log table. |
Table 5.
Budget Expenditure for Research Materials.
| Quantity | Description | Price | |
| 1 | ASUS ROG Strix G713QM-HX073T | PHP | 97,920.00 |
| 1 | HIK VISION DS-2DE3A404IW-DE/W Outdoor PTZ Camera | PHP | 7,875.90 |
| 1 | HIK VISION DS-Outdoor PT Camera | PHP | 11,960.00 |
| 2 | HIK VISION HiWatch Series E-HWIT Exir Fixed Turret Network Camera | PHP | 3,500.00 |
| 3 | 20 Inch 60Hz LED Monitor | PHP | 6147.00 |
| 1 | iPhone 14 Pro (LIDAR Scanning Device) | PHP | 65,000.00 |
| 1 | HIK VISION DS-7604NI-Q1/4P POE NVR | PHP | 5,161.00 |
| 1 | Seagate ST1000VX005 1TB Skyhawk HDD | PHP | 2,479.00 |
| 2 | Monthly Polycam Subscription (USD 17.99/Month) | PHP | 2,016.03 |
| TOTAL | PHP | 202,058.93 | |
Table 6.
Applied Image Augmentations to the Vehicle Detection Dataset.
| Augmentation Operation | Value |
| Crop | [0%, 5%] |
| Rotation | [-10°, 10°] |
| Shear | [±5° Horizontal, ±5° Vertical] |
| Grayscale | 20% of Images |
| Saturation | [-20%, 20%] |
| Brightness | [-25%, 25%] |
| Exposure | [-10%, 10%] |
| Blur | Until 2.5px |
| Noise | Until 1% |
| Bbox Shear | [±5° Horizontal, ±5° Vertical] |
| Bbox Brightness | [-10%, 10%] |
| Bbox Exposure | [-10%, 10%] |
| Bbox Blur | Until 2px |
| Bbox Noise | Until 1% |
Table 7.
Applied Image Augmentations to the Two LPD Datasets.
| Augmentation Operation | CATCH-ALL | CUSTOM-LPD |
| Saturation | [-50%, 50%] | [-50%, 50%] |
| Brightness | [-30%, 30%] | [-30%, 30%] |
| Exposure | [-20%, 20%] | [-20%, 20%] |
| Blur | Until 2px | Until 2px |
| Noise | Until 1% | Until 1% |
| Rotation | N/A | [-5°, 5°] |
| Shear | N/A | [±5° Horizontal, ±5° Vertical] |
| Bbox Brightness | [-30%, 30%] | [-30%, 30%] |
| Bbox Exposure | [-20%, 20%] | [-20%, 20%] |
| Bbox Blur | Up to 2.5px | Up to 2.5px |
| Bbox Noise | Until 1% | Until 1% |
| Bbox Rotation | N/A | [-5°, 5°] |
| Bbox Shear | N/A | [±5° Horizontal, ±5° Vertical] |
Table 8.
Hardware Specifications of the Local Machine for Training.
| Hardware | Technical Specification |
| GPU | NVIDIA RTX 3060 Laptop GPU |
| CPU | Ryzen 5900HX CPU |
| System RAM | 16 GB Memory |
| Storage | 512 GB |
Table 1.
Training Hyperparameters used for Vehicle Detection Training.
| Model Type | Epochs | Image Size | Batch Size | Learning Rate |
| YOLOv7 Base | 20 | 416px | 12 | 0.0100 |
| YOLOv7 Finetuned | 15 | 416px | 12 | 0.0001 |
| YOLOv7-d6 Base | 20 | 416px | 8 | 0.0100 |
| YOLOv7-d6 Finetuned | 15 | 416px | 8 | 0.0001 |
| YOLOv7-e6 Base | 20 | 416px | 8 | 0.0100 |
| YOLOv7-e6 Finetuned | 15 | 416px | 8 | 0.0001 |
| YOLOv7-e6e Base | 20 | 416px | 8 | 0.0100 |
| YOLOv7-e6e Finetuned | 15 | 416px | 8 | 0.0001 |
| YOLOv7-w6 Base | 20 | 416px | 8 | 0.0100 |
| YOLOv7-w6 Finetuned | 15 | 416px | 8 | 0.0001 |
| YOLOv7-Tiny Base | 20 | 416px | 12 | 0.0100 |
| YOLOv7-Tiny Finetuned | 15 | 416px | 12 | 0.0001 |
| YOLOv7-x Base | 20 | 416px | 12 | 0.0100 |
| YOLOv7-x Finetuned | 15 | 416px | 12 | 0.0001 |
Table 10.
Training Hyperparameters Used for LPD Model Training.
| Training Hyperparameters | CATCH-ALL Dataset | Custom LPD Dataset |
| Epochs | 50 | 20 |
| Image Size | 416px | 416px |
| Batch Size | 12 | 22 |
| Learning Rate | 0.01 | 0.01 |
Table 11.
Training Hyperparameters Used for DTR Model Training.
| Training Hyperparameters | Training Categorization | |
| Initial | Finetuning | |
| Iterations | 5500 | 2000 |
| Image Size | [32px, 100px] | [32px, 100px] |
| Batch Size | 100 | 100 |
| Learning Rate | 1.00 | 0.01 |
Table 12.
Trained Vehicle Detection Models: Metrics of Assessment and Model Fitness Scores.
| Model Type |
|
|
Inference Speed | Model Fitness Score |
| YOLOv7 Base | 72.39% | 94.90% | 4.80 ms/img | 74.64% |
| YOLOv7 Finetuned | 72.60% | 95.01% | 4.70 ms/img | 74.84% |
| YOLOv7-d6 Base | 64.82% | 90.98% | 8.50 ms/img | 67.43% |
| YOLOv7-d6 Finetuned | 65.78% | 91.69% | 8.30 ms/img | 68.37% |
| YOLOv7-e6 Base | 66.51% | 93.57% | 7.10 ms/img | 69.22% |
| YOLOv7-e6 Finetuned | 67.80% | 93.58% | 6.90 ms/img | 70.38% |
| YOLOv7-e6e Base | 68.25% | 93.56% | 10.00 ms/img | 70.78% |
| YOLOv7-e6e Finetuned | 68.62% | 93.77% | 9.90 ms/img | 71.14% |
| YOLOv7-w6 Base | 64.55% | 92.74% | 5.00 ms/img | 63.37% |
| YOLOv7-w6 Finetuned | 65.56% | 92.75% | 5.30 ms/img | 68.28% |
| YOLOv7-Tiny Base | 63.83% | 91.70% | 2.90 ms/img | 66.62% |
| YOLOv7-Tiny Finetuned | 64.24% | 92.12% | 2.40 ms/img | 67.03% |
| YOLOv7-x Base | 73.83% | 94.86% | 6.30 ms/img | 75.94% |
| YOLOv7-x Finetuned | 73.78% | 94.71% | 6.10 ms/img | 75.87% |
Table 13.
Trained LPD and DTR Models: Metrics of Assessment.
| Model Type | Function |
|
|
Inference Speed |
| CATCH-ALL Model | LPD | 74.58% | 97.71% | 4.50 ms/img |
| Custom Dataset Model | LPD | 85.24% | 99.27% | 4.40 ms/img |
| Base DTR Model | DTR | 4.00% | 90.32% | 5.40 ms/img |
| Finetuned DTR Model | DTR | 4.00% | 90.50% | 5.50 ms/img |
Table 14.
Metric Summary for the LPR-based POD System.
| Category |
Occupancy Rate |
Turnover Rate |
Average Parking Duration |
| Parking Space #8 | 56.21% | 1 vehicle/hr | 0.56 hours |
| Parking Space #9 | 73.91% | 0.71 vehicle/hr | 1.03 hours |
| Combined Overview | 65.06% | 1.71 vehicle/hr | 0.74 hours |
Table 15.
Metric Summary for the Facility Entry-Exit Monitoring System.
| Metric | Metric Score |
| Total Revenue | Php 1550.00 |
| Average Revenue/Hour | Php 206.67 |
| Average Parking Duration | 1.39 Hours |
| Average Occupancy Rate | 122.84% |
| Average Turnover Rate | 4.13 Cars/Hour |
*Average Currency Conversion Rate (Year 2025): 1.00 USD = 58.10 PHP.
Table 16.
Monthly Electric Consumption Breakdown Costing for a Smart PMS.
| Category | Wattage Rating | Daily Energy Consumption | Quantity | Total Monthly Cost (PHP) |
| Security Camera | 14.0 W | 0.336 kWh | 4 | 461.17 |
| NVR | 10.0 W | 0.240 kWh | 1 | 82.35 |
| Light Bulbs | 10.0 W | 0.240 kWh | 35 | 2882.30 |
| LED Monitor for Security Camera Viewing | 15.0 W | 0.360 | 1 | 123.53 |
| Dedicated Monitor for DT Model Viewing | 15.0 W | 0.360 | 2 | 247.05 |
| TOTAL (PHP) | 3796.41 | |||
Table 17.
Budget Expenditure for Research Materials.
| Quantity | Description | Price | |
| 1 | HIK VISION DS-2DE3A404IW-DE/W Outdoor PTZ Camera | PHP | 7,875.90 |
| 1 | HIK VISION DS-Outdoor PT Camera | PHP | 11,960.00 |
| 2 | HIK VISION HiWatch Series E-HWIT Exir Fixed Turret Network Camera | PHP | 3,500.00 |
| 1 | 20 Inch 60Hz LED Monitor | PHP | 2049.00 |
| 1 | HIK VISION DS-7604NI-Q1/4P POE NVR | PHP | 5,161.00 |
| TOTAL | PHP | 30,545.90 | |
Table 18.
Monthly Expense Breakdown Costing for a Non-smart PMS.
| Category | Wattage Rating | Daily Energy Consumption | Quantity | Total Monthly Cost (PHP) |
| Security Camera | 14.0 W | 0.336 kWh | 4 | 461.17 |
| NVR | 10.0 W | 0.240 kWh | 1 | 82.35 |
| Light Bulbs | 10.0 W | 0.240 kWh | 35 | 2882.30 |
| LED Monitor for Security Camera Viewing | 15.0 W | 0.360 | 1 | 123.53 |
| Cashier Wage | N/A | N/A | 2 | 36244.84 |
| TOTAL (PHP) | 39794.19 | |||
Table 19.
Monthly Cost Savings Breakdown.
| Expense Type |
Without Smart System (PHP) |
Smart System (PHP) |
Cost Savings (PHP) |
| Electricity & Equipment | 3549.35 | 3796.41 | 247.06 (-) |
| Employee Wages | 36244.84 | 0.00 | 36244.84 |
| Total Cost | 39794.19 | 3796.41 | 35997.78 |
Table 20.
Annual Cost Savings Breakdown.
| Expense Type |
Without Smart System (PHP) |
Smart System (PHP) |
Cost Savings (PHP) |
| Electricity & Equipment | 42592.2 | 45556.92 | 2964.72 (-) |
| Employee Wages | 434938.08 | 0.00 | 434938.08 |
| Total Cost | 477530.28 | 45556.92 | 431973.36 |
Table 21.
Feature Performance Summary for the Developed Smart Parking Management System.
| System Feature | Feature Capability | Performance Metric | |
| 1 | Vehicle Detection-based POD 3D Digital Twin SPMS | Vehicle Object Detection (mAP50 = 94.86%) |
94.86% |
| 2 | LPR-based POD 3D Digital Twin SPMS | LPD (mAP50 = 99.27%) | 89.84% |
| DTR-based LPR (Accuracy = 90.50%) | |||
| 3 | LPR-based Data Dashboard Digital Twin | LPD (mAP50 = 99.27%) | 89.84% |
| DTR-based LPR (Accuracy = 90.50%) | |||
| Capacity to Compute for: ∙Total Fare ∙Total Revenue ∙Parking Duration ∙Occupancy Rate ∙Turnover Rate ∙Peak Occupancy Periods ∙Dwell Time Distributions | |||
Disclaimer/Publisher’s Note: The statements, opinions and data contained in all publications are solely those of the individual author(s) and contributor(s) and not of MDPI and/or the editor(s). MDPI and/or the editor(s) disclaim responsibility for any injury to people or property resulting from any ideas, methods, instructions or products referred to in the content. |
© 2025 by the authors. Licensee MDPI, Basel, Switzerland. This article is an open access article distributed under the terms and conditions of the Creative Commons Attribution (CC BY) license (http://creativecommons.org/licenses/by/4.0/).
Copyright: This open access article is published under a Creative Commons CC BY 4.0 license, which permit the free download, distribution, and reuse, provided that the author and preprint are cited in any reuse.


