Submitted:
03 July 2025
Posted:
04 July 2025
You are already at the latest version
Abstract
When an antigen molecule is exposed to serum, many different kinds of antibodies bind to it. The complexity of these binding events is only poorly characterized by assays that generate a single variable as readout. We have previously devised an assay that delivers the essential biochemical variables as output. Here we propose a visualization method for the practical and informative display of those variables. Using total antigen concentration, free and bound antibody concentration as coordinates in a three-dimensional space, a surface plot can depict the behavior of serum antibodies in the measurement range and identify key variables of binding activity. This surface display (antibody binding in 3-concentration display, Ab3cD) was used for the characterization of antibody binding to SARS-CoV-2 spike protein in seronegative and seropositive sera. We demonstrate that this visualization scheme is suitable for presenting both individual and group differences and that epitope density changes, commonly not measured by immunoassays, are also revealed by the method. We recommend the use of 3D visualization whenever detailed, informative and characteristic differences in serum antibody reactivity are studied.
Keywords:
antibody
; serology
; quantitative systems biology
; visualization
1. Introduction
Detection and characterization of antigen specific antibodies from serum is one of the building stones of immunodiagnostics. Depending on the nature and role of the antigen used, specific antibody measurement contributes to the in vitro diagnostics of infectious disease [1], autoimmunity [2], allergy [3] and tumors [4,5]. Beyond helping set up a diagnosis, by using panels of antigens and selecting the measured antibody isotype, staging and classification of the disease state and selection and monitoring of therapy is also helped by antibody serology [6,7,8,9]. The methods of specific serum antibody detection range from point-of-care qualitative assays, through standardized automated assays to quantitative tests. Most of these assays, even the most sophisticated ones, deliver results in arbitrary units [10]. This is because each assay comes with its own reference standards.
If we wish to evaluate the reactivity of serum antibodies, actually we should first answer the following question: What is the best readout for the binding activity of specific antibody in terms of being correlated to my clinical observation? The vast majority of the assays practically measures the number of antigen-bound antibody molecules and is therefore related to the fractional occupancy of target antigen: what percentage of antigen molecules is bound by antibodies. Besides the conventional indirect detection by labeled reagents, quantitative mass-spectrometry can directly identify and quantify the bound antibody molecules [11]. Fractional occupancy is in turn determined by the affinity (strictly speaking average affinity) and concentration (average concentration) of antibodies. Few assays measure directly these latter properties; nevertheless novel technologies, such as microscale thermopheresis [12] and microfluidic affinity profiling [13] are being applied to address them.
An important and often neglected aspect of the polyclonal response against antigens is that various epitopes on the same antigen molecule may be targeted by distinct antibody clonotypes. This is one of the reasons why a monoclonal antibody may not be optimal for reference in binding assays: an increased polyclonal binding signal might be caused both by additional antibodies binding to the same antigen molecule (increased molecular epitope density) and by antibodies binding to additional antigen molecules (higher fractional occupancy). It is important to stress that changes in epitope density are brought about by the emergence of antibody clones and their differentiation into antibody producing cells, therefore it is also a property of the antibody response. As long as we separately measure either the number of bound antibody molecules or their affinity and concentration, we will not be able to recognize and tell changes in molecular epitope density from changes in fractional occupancy (Figure 1).
Serum antibody measurements can be adjusted to focus on a binding property that is most relevant to us by choosing a proper method and readout. The best readout of an antibody assay is dependent on the clinical question being asked: for example, in the case of infections the correlation with protectivity, in autoimmunity the correlation with disease severity, for tumor diagnostics the best sensitivity could pinpoint a good methodological approach. But already to reveal such correlations we need to be able to measure and understand the above key properties of the antibody response. Previously we showed that antibody serology results can be obtained in universal biochemical units [14,15], now we provide a visualization method that highlights immunologically meaningful changes in reactivity and helps interpretation of quantitative antibody measurements. Here our goal was to identify and provide proof-of-concept for a visualization approach that is intuitive, as simple as possible and yet reveals all the determinants of the strength of the examined antigen specific response, to devise a plot that reflects changes of key variable values as modeled by the Richards function [16].
2. Methods
2.1. Dataset of SARS-CoV-2 Specific Antibody Binding Results
We used previously published data [15] obtained from commercially available serum samples from confirmed COVID-19 positive and negative subjects (RayBiotech CoV-PosSet-2). Tables containing the visualized dataset are available as Supplementary data. The variables used for visualization were logC, and logxi and were obtained previously as described [14,15].
2.2. Visualization Program
For displaying a simple 3D surface based on functions and variable values contained in a spreadsheet, we used the ‘persp’ command of the open-source free R programming language.
The surface was defined by equation (1) in which z defines the surface coordinates, logC is the logarithm of fluorescent signal at the point of intersection of inflection points of two Richards functions, is the asymmetry parameter representing a proportionality factor of affinity constants, x is the molar concentration of immobilized antigen, xi is antigen concentration at the point of inflection of the Richards curve, y is the relative serum antibody concentration expressed as 1/dilution factor and log stands for logarithm.
The code lines for the visualization are available as Supplementary data.
3. Results
3.1. Visual Interpretation of Key Variables of Serum Antibody Binding
As discussed above, the three key variables that determine the number of bound antibody molecules per unit area (surface concentration) are the equilibrium dissociation constant (KD), relative antibody concentration ([Ab]/KD) and epitope density. We can probe the first two by changing the number of immobilized antigen molecules per unit area and by diluting serum, respectively. Titration of these attributes identifies special values along the two axes, which correspond to the inflection points of titration curves when displayed on a linear scale. The reason we use a logarithmic scale is to be able to visualize events over a very wide range of values. Once we obtain these special values, namely the apparent KD derived from surface antigen concentration and the apparent KD derived from relative serum concentration, we can generate a 3D surface using the function used for fitting, equation (1) (Figure 2). The location along the z axis of this surface is determined by the molecular epitope density, besides the previous two variables, KD and [Ab]. Thus, the z axis is practically the logarithm of concentration of antigen-bound antibodies, which accommodates changes in KD, relative antibody concentration and in epitope density, as well. The special value for the characterization of epitope density is the concentration of bound antibody at the intersection of the other two special values, that is, it is the concentration of bound antibody when the concentration of both the free antigen and the serum antibody is equal to the KD. We call this value standard epitope density, being the concentration of epitopes observed under standard conditions.
The range of displayed values should be chosen so as to allow the positioning of the obtained prominent values and also to highlight whether the obtained values are in a common range. We propose the use of a 3D display with the undiluted serum being the end point of serum antibody concentration range and the plane corresponding to this value facing the observer. There are two advantages of this arrangement: 1) the visible right face of the display cube depicts the behavior of undiluted serum at different antigen densities, 2) if the concentration of antibodies is below the estimated KD the line corresponding to the KD derived from serum dilution moves “out” of the gradated display range. This implies that the KD is obtained by extrapolation and that the ability of antibodies to saturate the target antigen is weak (Figure 3). Another indication of low relative antibody concentration is the separation of the line indicative of epitope density from the 3D surface.
3.2. Application of the Visualization Scheme to Experimental Data
Demonstration of Individual Differences
To demonstrate the visual impressions of binding differences between two seropositive individuals with anti-SARS-2-CoV antibodies we selected two samples from a previously published dataset with marked differences in KD, concentration and epitope density (Figure 4). Sample PS604 contained antibodies with antibody concentration close to the KD value, a KD in the middle of the observation range and relatively high standard epitope density. Sample PS609 exhibited higher affinity and greater relative concentrations, yet lower epitope densities.
3.3. Demonstration of Group Differences
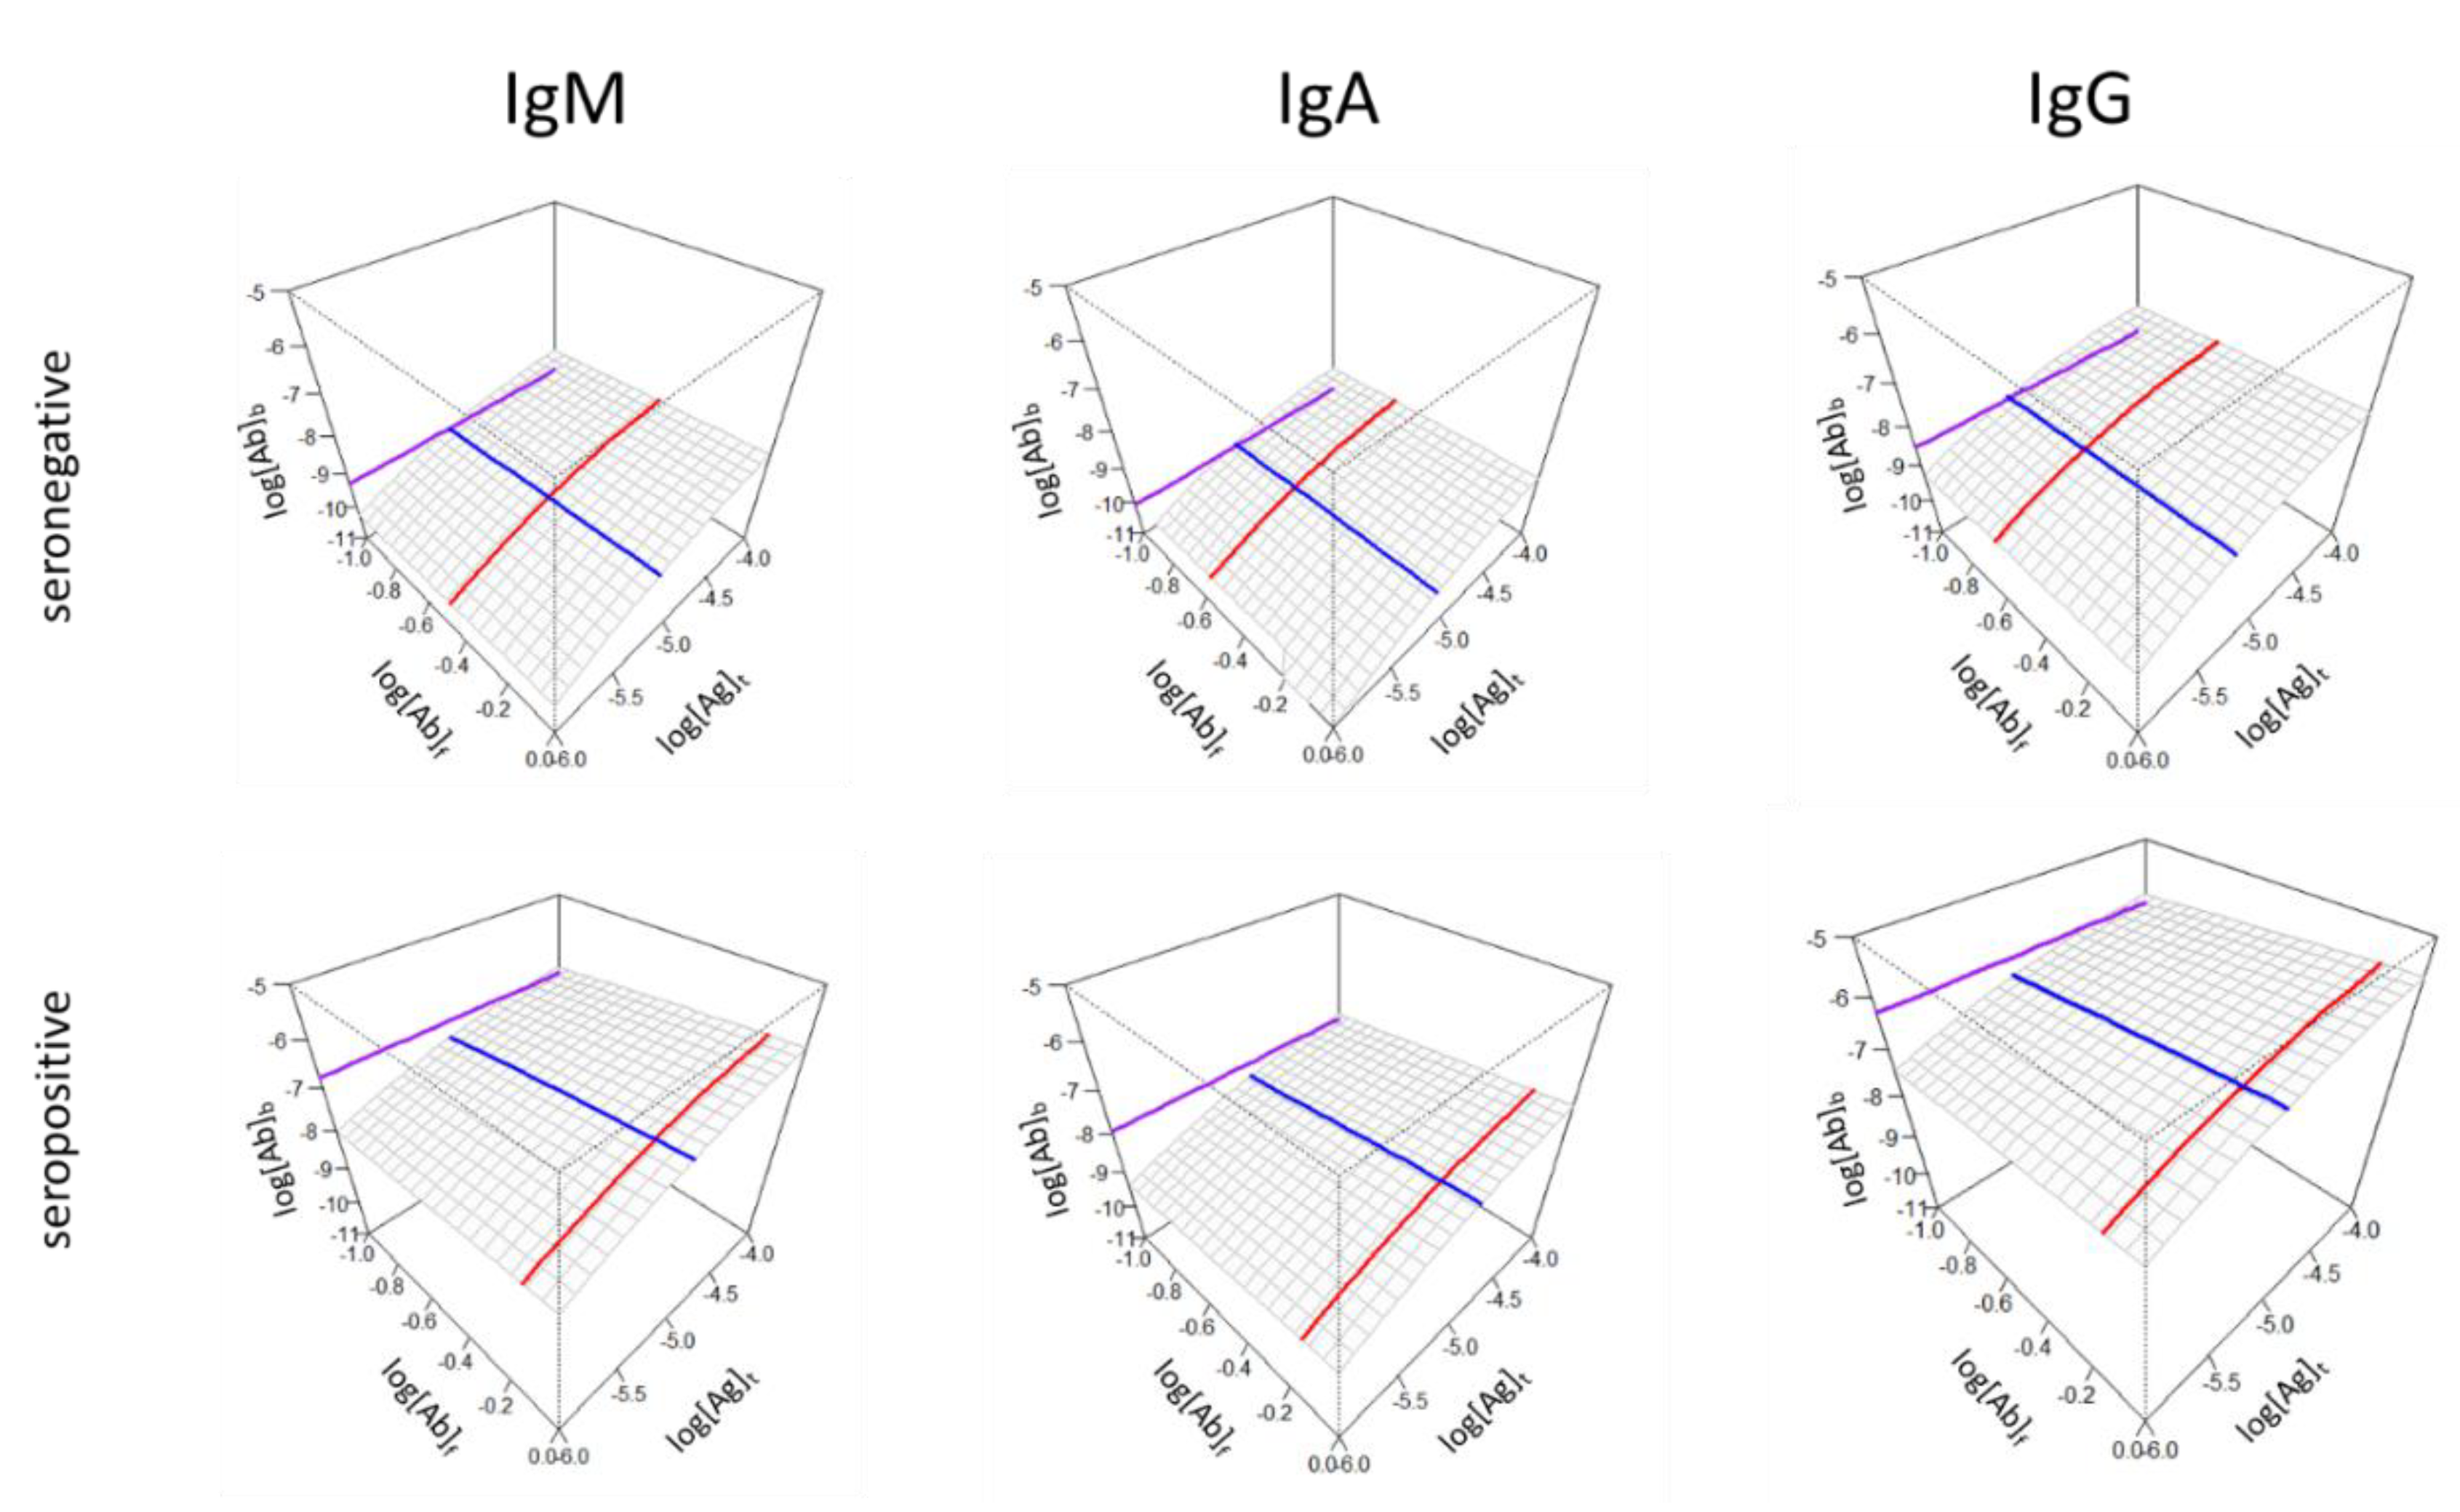
Besides highlighting differences in binding properties of individuals, characteristic differences between groups can also be demonstrated using the 3D surface display. The key variables of affinity (KD), relative concentration ([Ab]s/KD) and standard epitope density ([Ab]°b) can be averaged using an appropriate statistic (mean or median) and the surface and lines can be generated for each antibody isotype (Figure 5).
Both Figure 4 and 5 suggests that the concentration of bound antibodies is not necessarily directly determined by affinity and concentration but is an independent variable. Therefore, the z axis may represent the different extent of contributions from different antibody isotypes (compare IgM and IgA versus IgG epitope density in the seropositive group) since the epitope density measured here is the effective density to which antibodies are measurably bound, not just structural epitope density in the sense of surface patches of molecules.
4. Discussion
The reactivity of serum antibodies is often characterized by a single number, usually with arbitrary binding units [10], less frequently with proper concentration units [17]. While a single number and scale might be suitable for setting diagnostic cut-off values and might be related to protectivity [18], in-depth characterization is required for universal comparability and a quantitative systems biological approach. The use of monoclonal antibodies as molecular references for binding activity is undoubtedly useful for the standardization of measurements but can only yield concentrations expressed in monoclonal antibody equivalent units, applicable to particular antigens. The generalization of measurements to all antigens and antibody isotypes and the generation of antigen shape space and antibody binding data landscapes for quantitative systems biological databases would require universal measurement units of biochemistry. We propose that the measurement of the three key variables of serum antibody binding has the potential to reveal as yet unknown correlations with clinical immunological characteristics of health and disease.
While simply listing three values may reveal to an expert eye the nature of alterations in antibody reactivity, a proper visualization technique can help identify the extent of contributions of those three factors while still conveying the complexity of binding. The titration of two parameters can be effectively displayed in a three-dimensional space; what is also important is the arrangement of the axes, the setting of ranges for visualization and a self-explanatory aesthetics. We chose an angle of rotation for the 3D surface so that it slopes down towards the left back corner so the viewer can look over the surface and that the behavior of the undiluted serum faces the viewer (Figure 2-5). While several serological protocols use a predefined serum dilution for the measurement, the titration of serum allows to explore the binding of different concentrations of antibodies. In fact, it is the undiluted serum that interacts with blood-borne antigens in the body so this is a highly relevant information. Changing antigen density at fixed undiluted serum antibody concentrations reveals the combined effect of KD and relative concentration on the right front face of the diagram. The whole range of tested serum antibody concentrations is displayed starting from undiluted serum, as discussed above. The antigen concentration range is the tested range itself and should contain the estimated KD, which is therefore obtained by interpolation.
Strictly speaking, all the estimated values for the three variables are apparent or effective values: effective standard epitope density, effective concentration, effective KD, since these are all influenced by interactions ‘invisible’ to the measurement method, like antibody isotypes not detected but still binding and masking epitopes. These values are measurable as the outcome of many interactions in a complex system as opposed to a simple bimolecular interaction under clean experimental conditions.
We introduce here a technical term, epitope density, which is the number of antigen molecule surface patches available for binding by antibody paratopes in a unit area as determined by the number of antigen molecules per unit area and the number of epitopes per antigen molecule. Epitope density values expressed as the concentration of antibody binding sites are obtained from signal intensities via calibration [15]. In turn, standard epitope density, the number of epitopes bound to antibodies under selected equilibrium conditions (standard conditions) will be determined by the affinity and concentration of the antibodies (serum dilution). Unlike epitope density, which depends on the experimental conditions, standard epitope density is a quality of the serum. Counterintuitively a lower standard epitope density may be accompanied by stronger binding forces at a given relative concentration, since higher affinity means lower KD values and standard epitope density values comprise both KD and molecular epitope density:
Conversely, the higher standard epitope density may indicate higher molecular epitope density and therefore greater chemical potential of the antigen with respect to the antibody isotype being measured. This is revealed for example by the equilibrium process with three epitope per antigen molecule, which therefore binds three antibodies according to the equation
with potentially lower affinity. We can better understand this phenomenon if we think about decreasing the average affinity of antibodies. This means that we approach the overall average binding affinity of all serum antibodies and we measure the binding of all antibodies. Even though we obtain a high signal this is generally considered non-specific low affinity binding with no immunological and clinical relevance. Immunoassays specifically tailored for diagnostic measurements avoid this by using low antigen concentrations, practically excluding low-affinity interactions from the measurement. Single-point immunoassays, however, may also mistakenly qualify high affinity binding samples as negative, because the concentration of bound antibodies is low. Systemic autoimmune diseases with cycling disease activity (periods of relapse and remission) may also show periods of seropositive and seronegative status, in spite of gradual affinity maturation of autoantibodies.
In summary, the proposed visualization scheme answers three questions: How strongly are antibodies binding? Are antibodies present in excess? How many sites are antibodies directed against? The answers are the effective KD, the relative concentration and the standard epitope density, each represented by a line (Figure 2, Figure 3, Figure 4 and Figure 5) and all the three contributing to the routinely observable fractional occupancy that is deconvoluted by the dual-titration assay. Such in-depth analysis may not be required for routine diagnostic tests but should be useful for quantitative and systems biological studies where serum antibody responses are involved.
Supplementary Materials
The following supporting information can be downloaded at the website of this paper posted on Preprints.org.
References
- Haselbeck AH, Im J, Prifti K, Marks F, Holm M, Zellweger RM. Serology as a tool to assess infectious disease landscapes and guide public health policy. Pathogens. 2022 Jun 27;11(7).
- Agmon-Levin N, Damoiseaux J, Kallenberg C, Sack U, Witte T, Herold M, et al. International recommendations for the assessment of autoantibodies to cellular antigens referred to as anti-nuclear antibodies. Ann Rheum Dis. 2014 Jan;73(1):17–23.
- Ansotegui IJ, Melioli G, Canonica GW, Caraballo L, Villa E, Ebisawa M, et al. IgE allergy diagnostics and other relevant tests in allergy, a World Allergy Organization position paper. World Allergy Organiz J. 2020 Feb 25;13(2):100080.
- Morrison BJ, Labo N, Miley WJ, Whitby D. Serodiagnosis for tumor viruses. Semin Oncol. 2015 Apr;42(2):191–206.
- Ionov S, Lee J. An immunoproteomic survey of the antibody landscape: insights and opportunities revealed by serological repertoire profiling. Front Immunol. 2022 Feb 1;13:832533.
- Garrett ME, Galloway JG, Wolf C, Logue JK, Franko N, Chu HY, et al. Comprehensive characterization of the antibody responses to SARS-CoV-2 Spike protein finds additional vaccine-induced epitopes beyond those for mild infection. eLife. 2022 Jan 24;11.
- Eliyahu S, Sharabi O, Elmedvi S, Timor R, Davidovich A, Vigneault F, et al. Antibody repertoire analysis of hepatitis C virus infections identifies immune signatures associated with spontaneous clearance. Front Immunol. 2018 Dec 21;9:3004.
- Raeven RHM, van der Maas L, Pennings JLA, Fuursted K, Jørgensen CS, van Riet E, et al. Antibody Specificity Following a Recent Bordetella pertussis Infection in Adolescence Is Correlated With the Pertussis Vaccine Received in Childhood. Front Immunol. 2019 Jun 17;10:1364.
- Wu J, Li X, Song W, Fang Y, Yu L, Liu S, et al. The roles and applications of autoantibodies in progression, diagnosis, treatment and prognosis of human malignant tumours. Autoimmun Rev. 2017 Dec;16(12):1270–81.
- Prechl, J. Why current quantitative serology is not quantitative and how systems immunology could provide solutions. Biologia Futura. 2021 Mar;72(1):37–44.
- Tang C, Verwilligen A, Sadoff J, Brandenburg B, Sneekes-Vriese E, van den Kerkhof T, et al. Absolute quantitation of binding antibodies from clinical samples. npj Vaccines. 2024 Jan 6;9(1):8.
- Lippok S, Seidel SAI, Duhr S, Uhland K, Holthoff H-P, Jenne D, et al. Direct detection of antibody concentration and affinity in human serum using microscale thermophoresis. Anal Chem. 2012 Apr 17;84(8):3523–30.
- Fiedler S, Piziorska MA, Denninger V, Morgunov AS, Ilsley A, Malik AY, et al. Antibody Affinity Governs the Inhibition of SARS-CoV-2 Spike/ACE2 Binding in Patient Serum. ACS Infect Dis. 2021 Aug 13;7(8):2362–9.
- Papp K, Kovács Á, Orosz A, Hérincs Z, Randek J, Liliom K, et al. Absolute quantitation of serum antibody reactivity using the richards growth model for antigen microspot titration. Sensors. 2022 May 23;22(10).
- Kovács Á, Hérincs Z, Papp K, Kaczmarek JZ, Larsen DN, Stage P, et al. In-depth immunochemical characterization of the serum antibody response using a dual-titration microspot assay. Front Immunol. 2025 Feb 25;16:1494624.
- Prechl J, Papp K, Kovács Á, Pfeil T. The binding landscape of serum antibodies: how physical and mathematical concepts can advance systems immunology. Antibodies (Basel). 2022 Jun 23;11(3).
- Tian L, Elsheikh EB, Patrone PN, Kearsley AJ, Gaigalas AK, Inwood S, et al. Towards Quantitative and Standardized Serological and Neutralization Assays for COVID-19. Int J Mol Sci. 2021 Mar 8;22(5).
- Wang L, Patrone PN, Kearsley AJ, Izac JR, Gaigalas AK, Prostko JC, et al. Monoclonal Antibodies as SARS-CoV-2 Serology Standards: Experimental Validation and Broader Implications for Correlates of Protection. Int J Mol Sci. 2023 Oct 28;24(21).
Figure 1.
Schematic representation of the factors contributing to antibody binding. The number of antigen-bound antibody molecules per unit area in equilibrium (A) increases when antibody affinity (B) and/or concentration (C) and/or antigen epitope density (D) increases. Black and red colors stand for distinct antibody specificities of distinct clones.
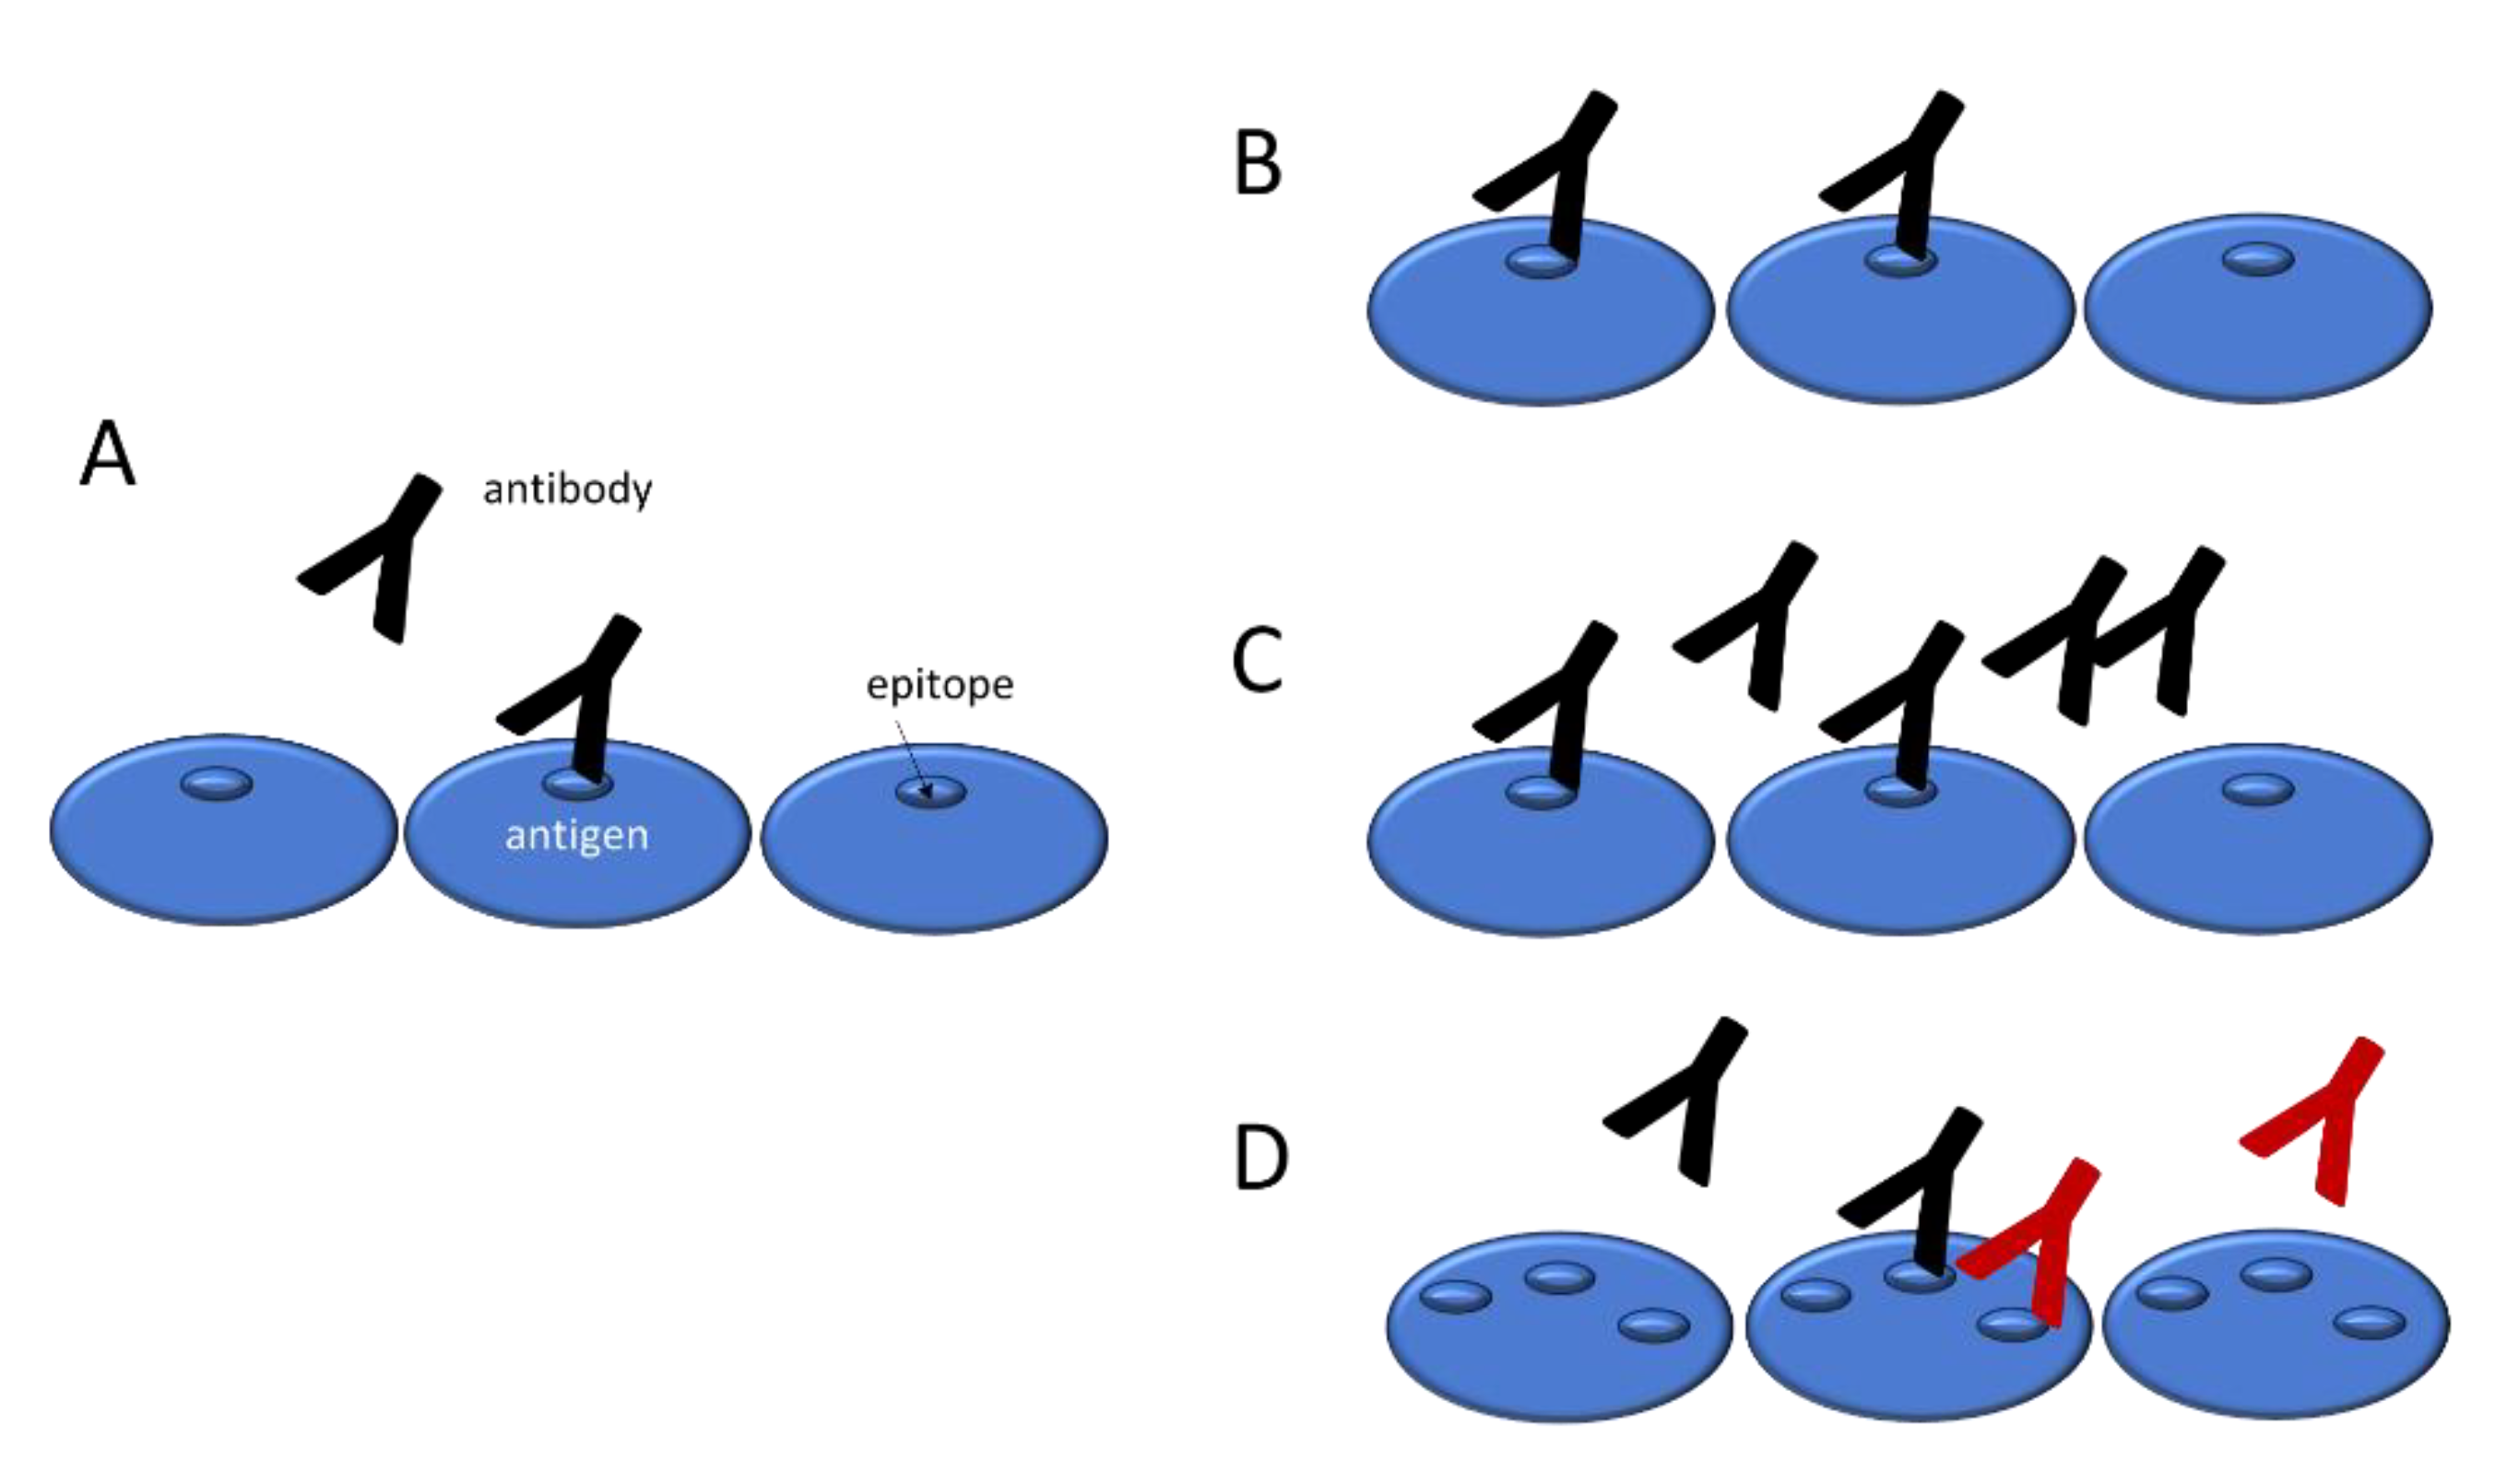
Figure 2.
Interpretation of the 3D binding surface. The surface corresponds to the logarithm of concentrations of bound antibodies (log[Ab]b) obtained by titrating binding sites immobilized on the surface (log[Ag]t) and antibody concentrations (log[Ab]). The contribution to binding by the three factors, namely affinity, concentration and epitope density, in a given serum sample are characterized by the three lines (blue, red and purple, respectively) identifying special values along the three axes.
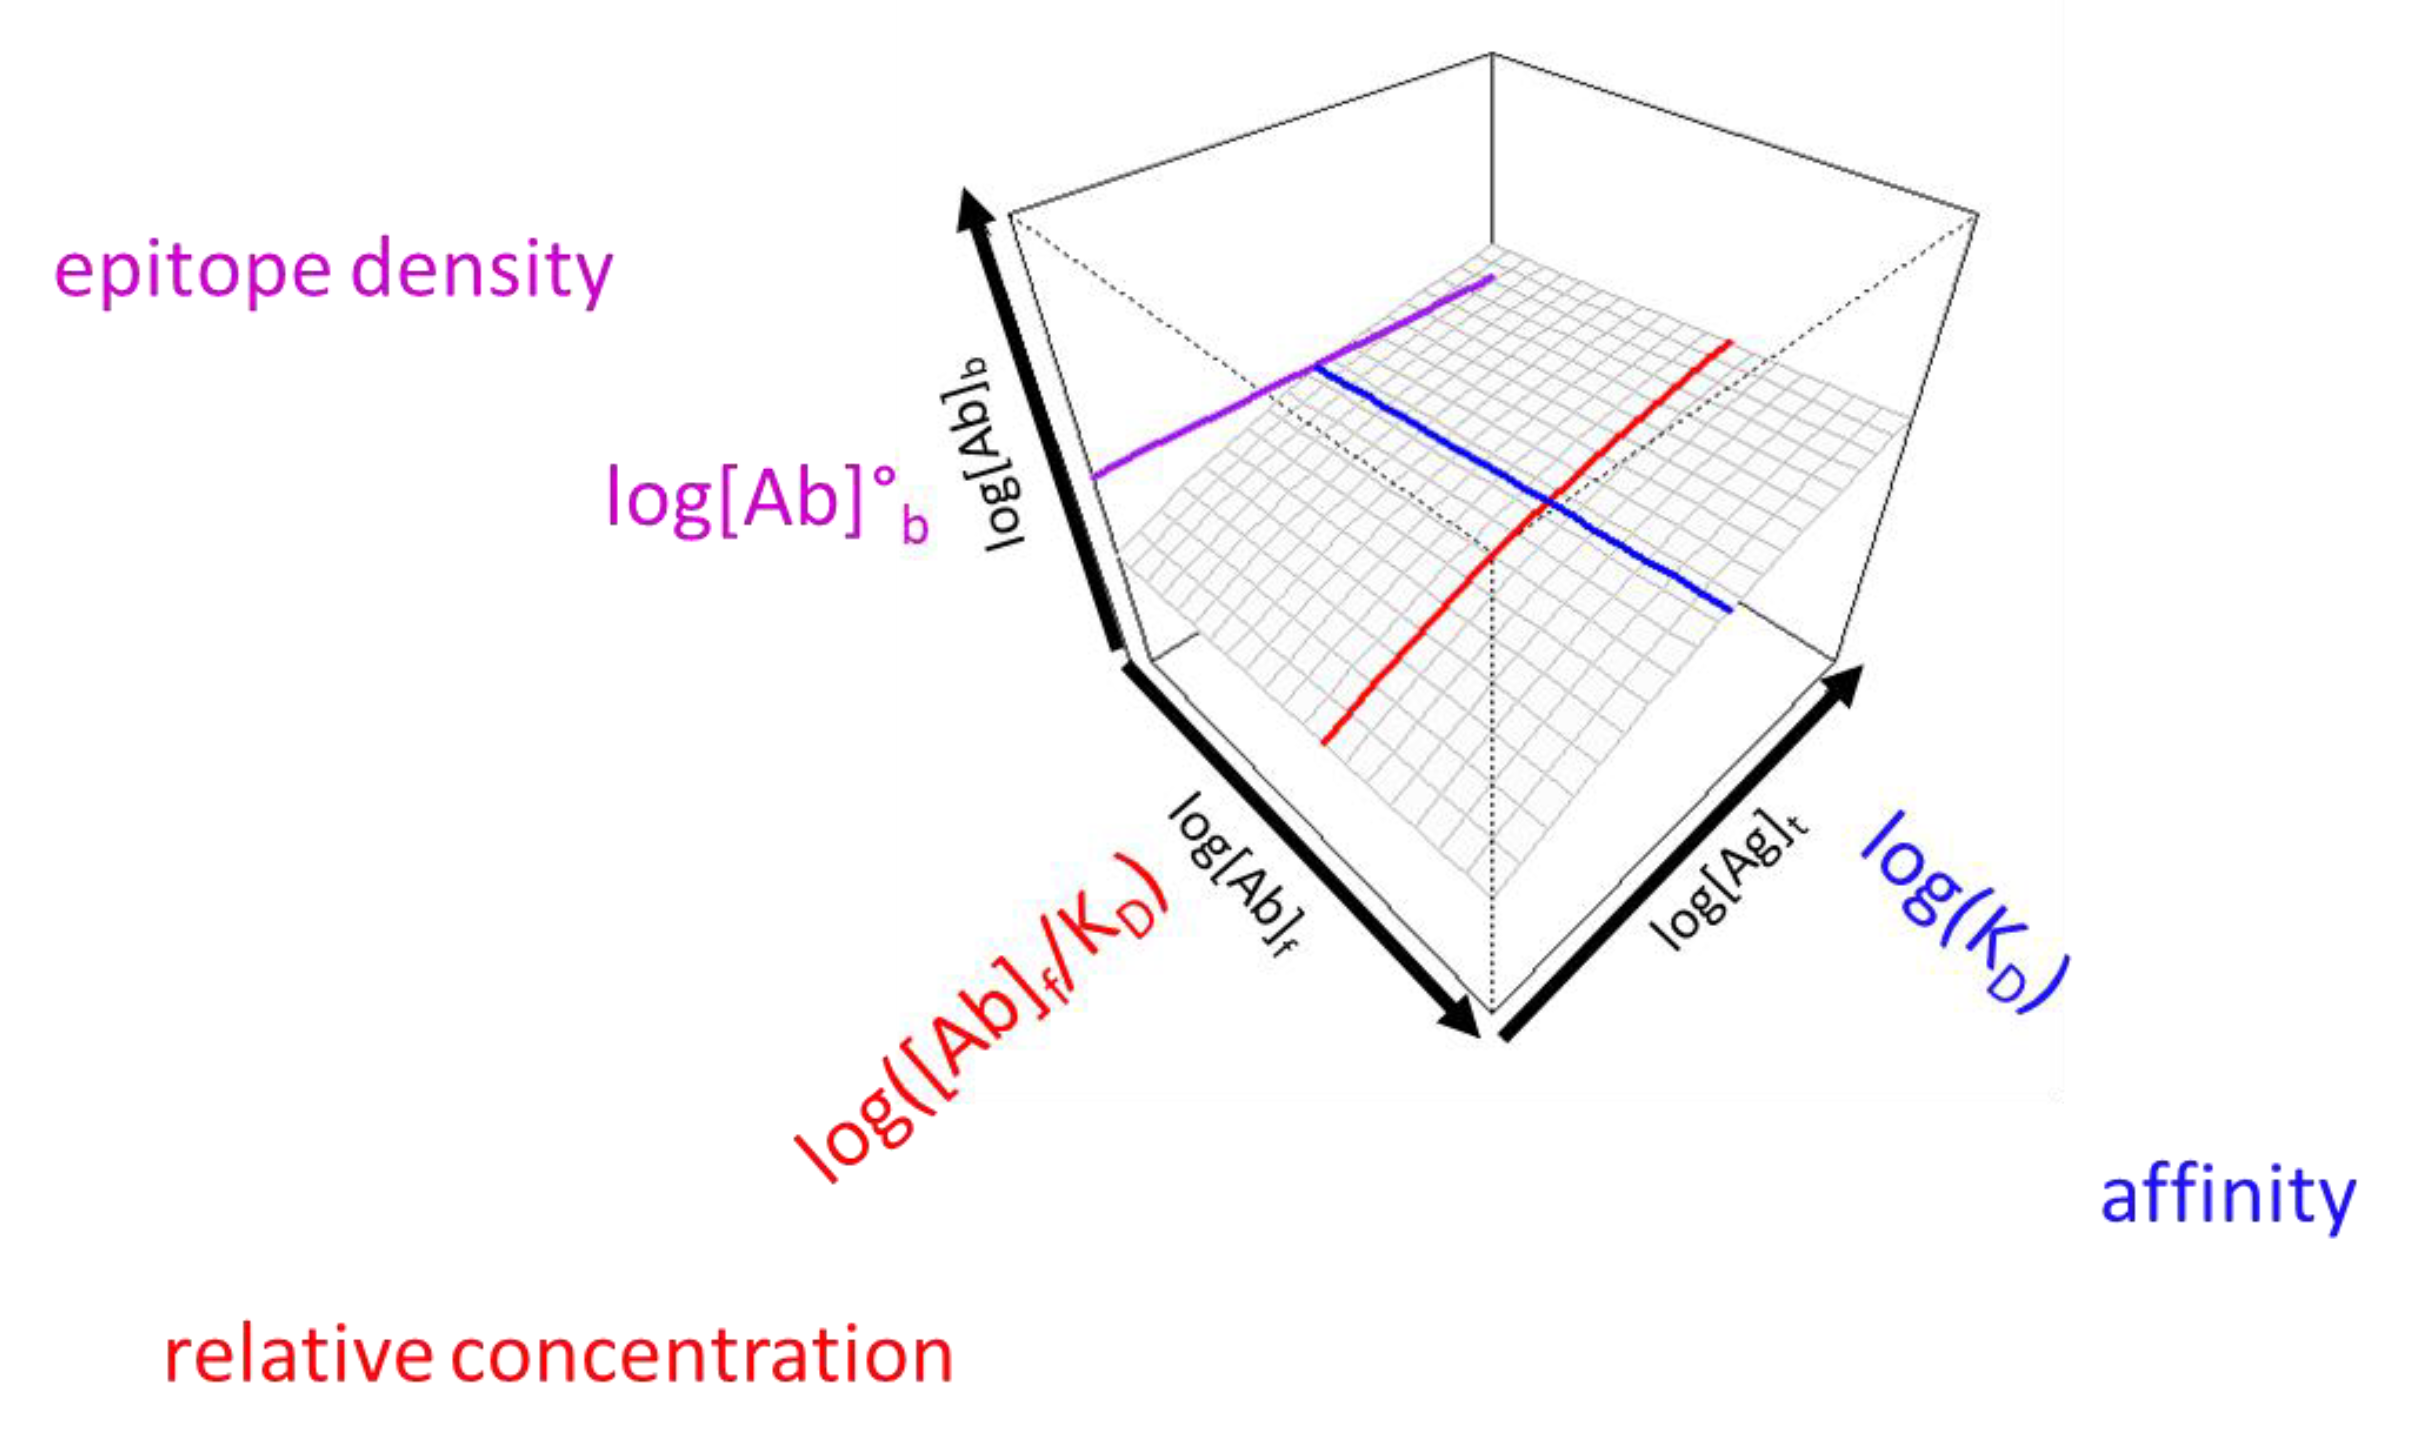
Figure 3.
Visual effects of antibody concentration change relative to KD. The bottom right face depicts undiluted serum binding. The KD estimated from serum dilution (red line) is smaller (A), equal to (B) or greater than (C) the apparent serum antibody concentration. Epitope density (purple) and KD (blue) values are identical for the three diagrams.
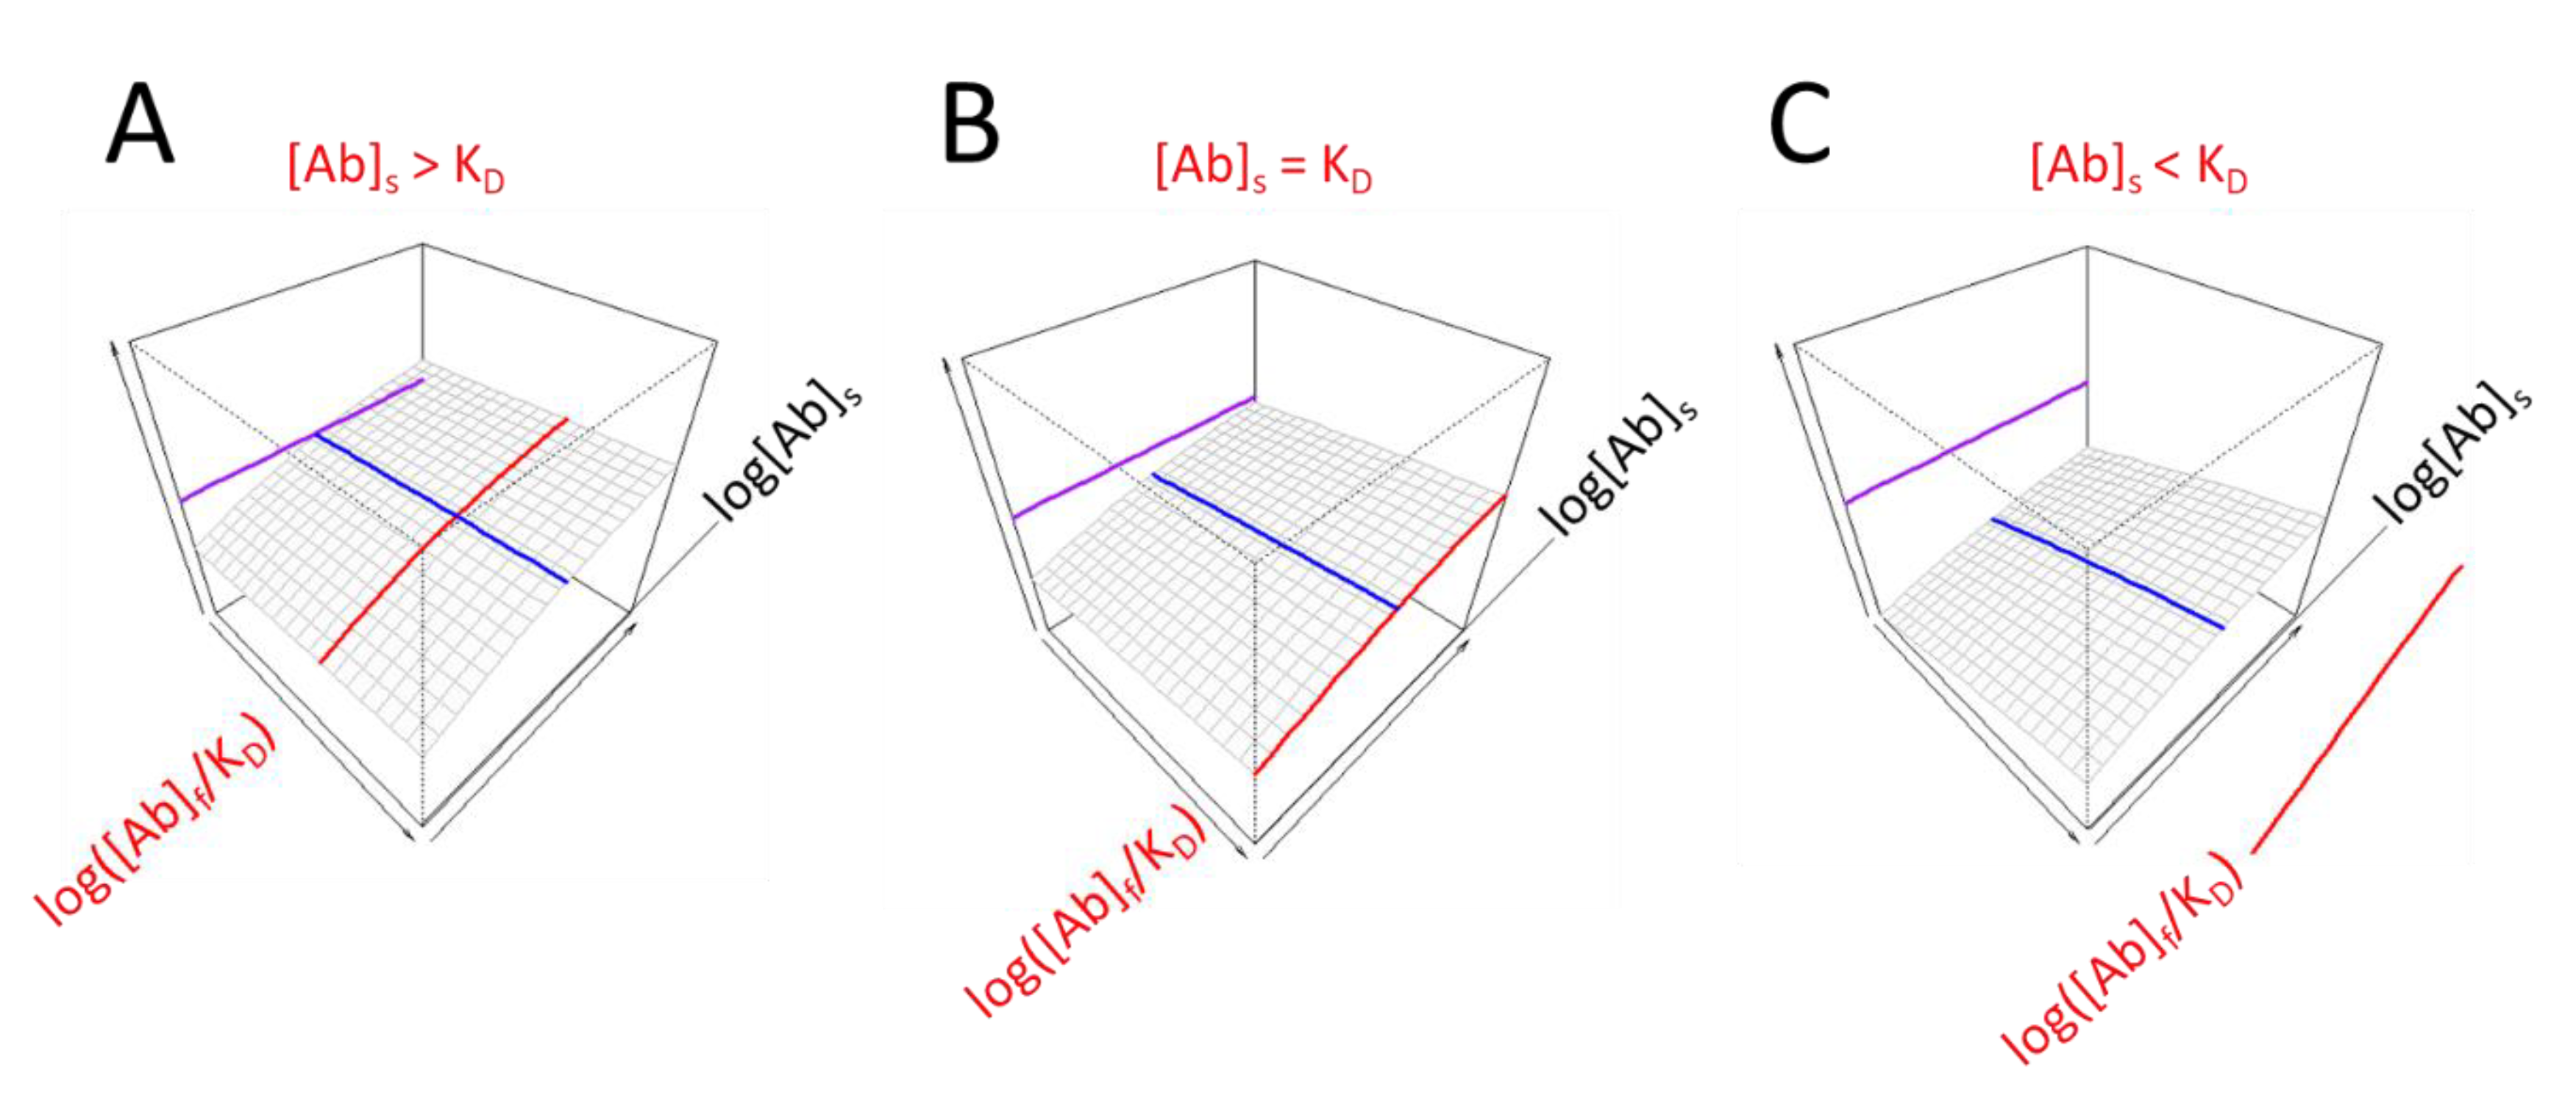
Figure 4.
Visualization of individual differences in the seropositive group for IgG reactivity. Axes and color codes are identical to previous figures.
Figure 4.
Visualization of individual differences in the seropositive group for IgG reactivity. Axes and color codes are identical to previous figures.
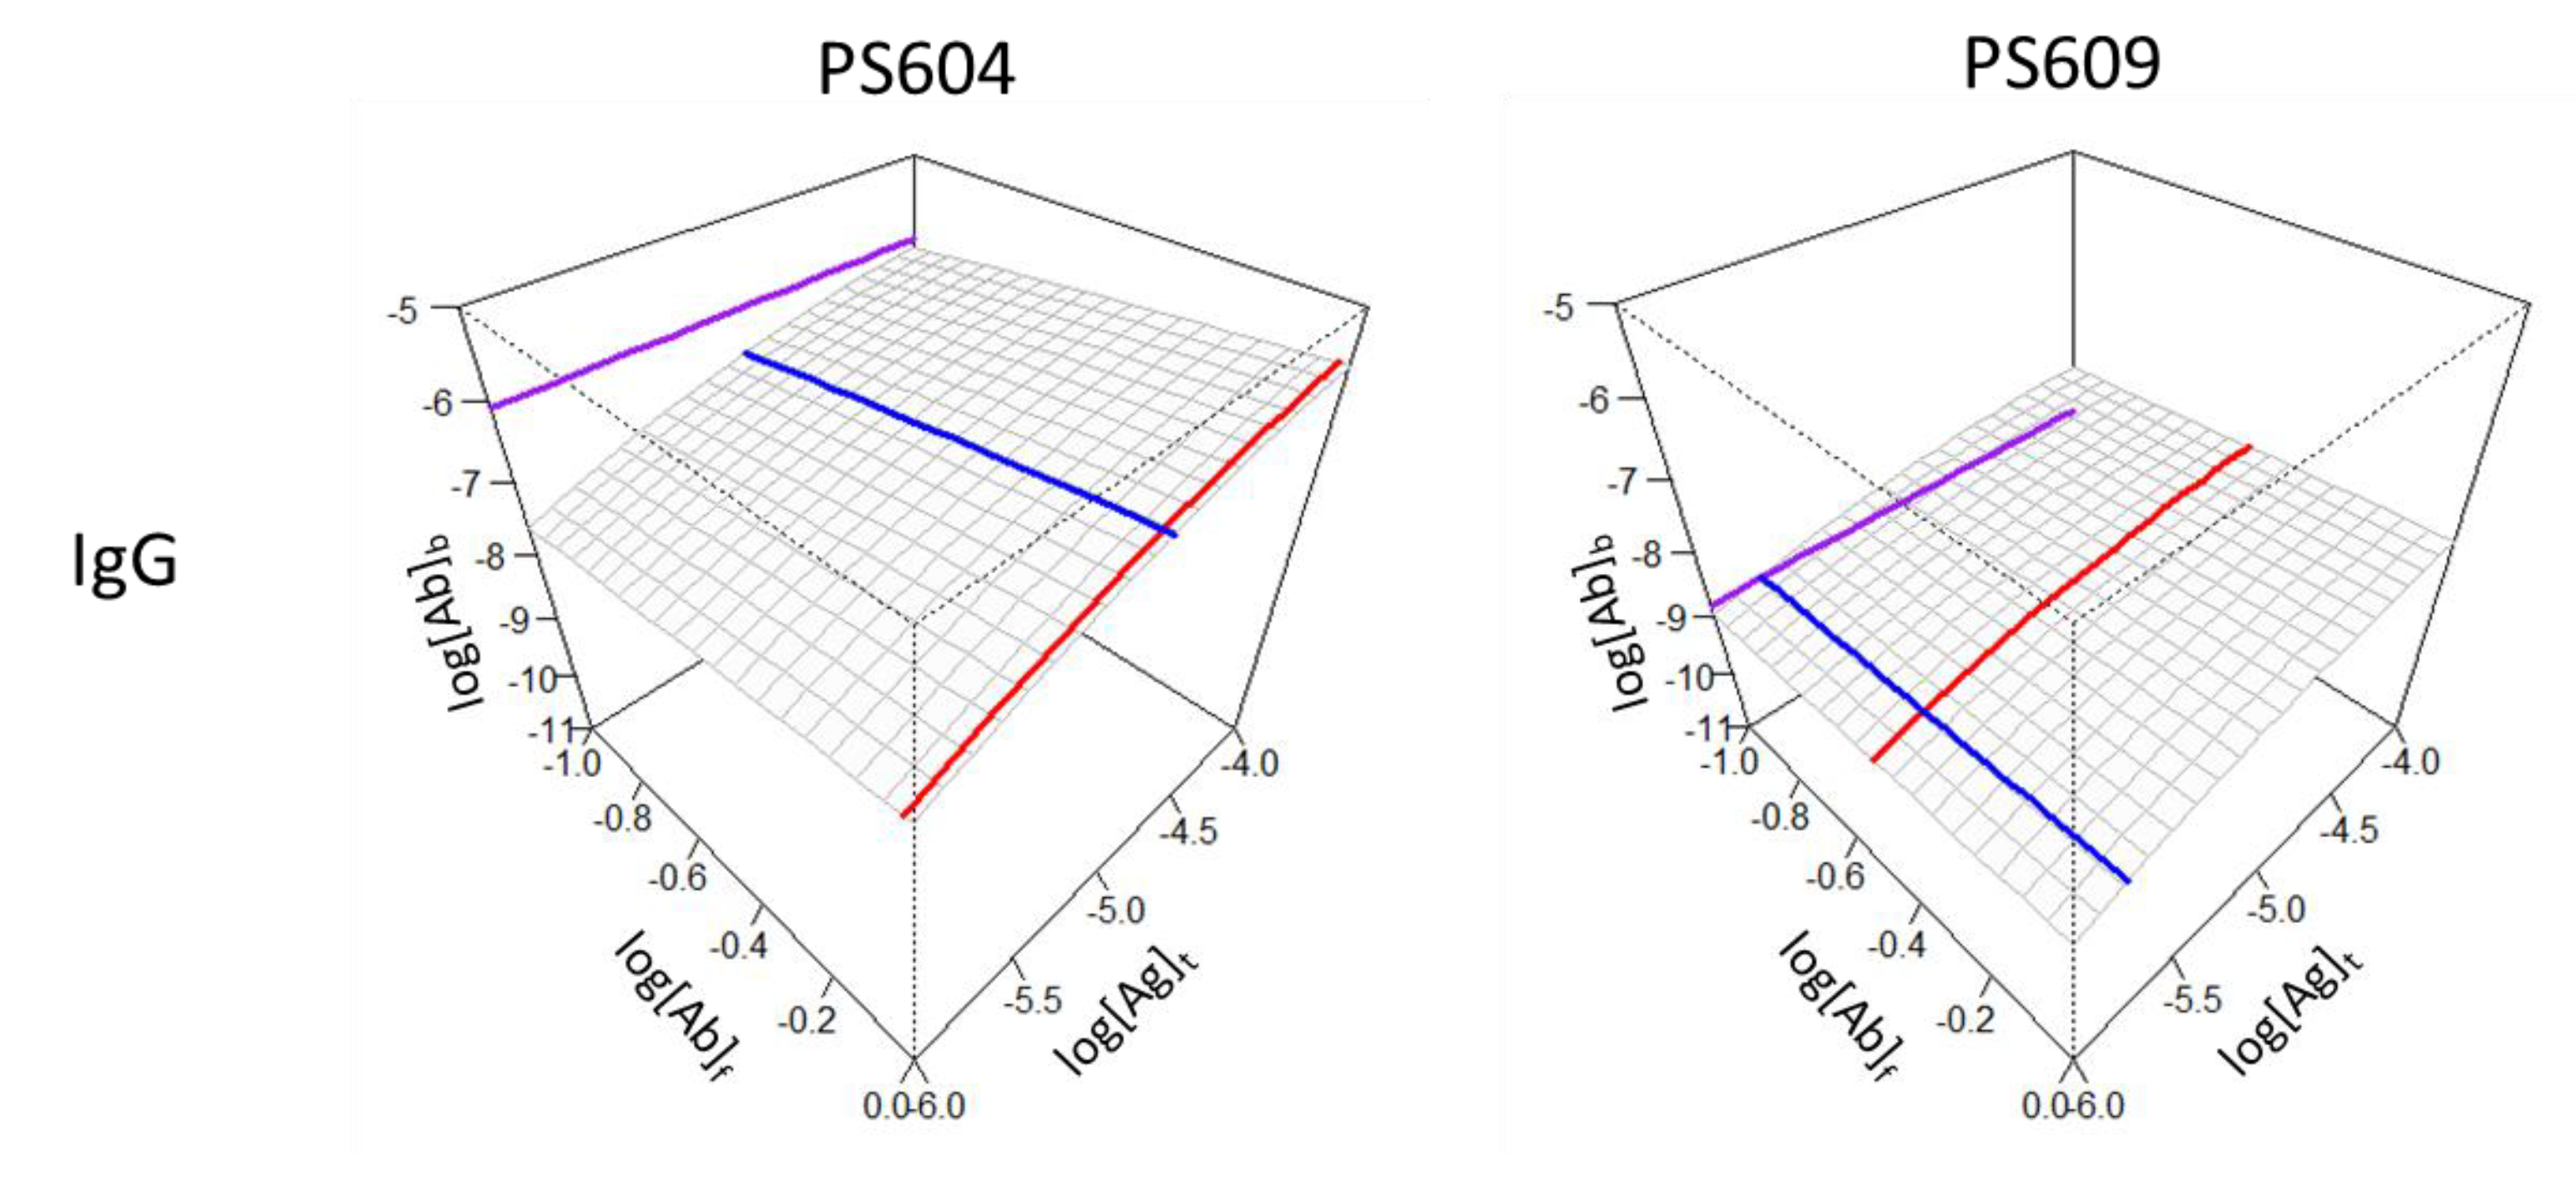
Figure 5.
Effects of relative antibody concentration changes for three antibody classes in two patient groups. Axes and color codes are identical to previous figures.
Figure 5.
Effects of relative antibody concentration changes for three antibody classes in two patient groups. Axes and color codes are identical to previous figures.
Disclaimer/Publisher’s Note: The statements, opinions and data contained in all publications are solely those of the individual author(s) and contributor(s) and not of MDPI and/or the editor(s). MDPI and/or the editor(s) disclaim responsibility for any injury to people or property resulting from any ideas, methods, instructions or products referred to in the content. |
© 2025 by the authors. Licensee MDPI, Basel, Switzerland. This article is an open access article distributed under the terms and conditions of the Creative Commons Attribution (CC BY) license (http://creativecommons.org/licenses/by/4.0/).
Copyright: This open access article is published under a Creative Commons CC BY 4.0 license, which permit the free download, distribution, and reuse, provided that the author and preprint are cited in any reuse.


