Submitted:
03 July 2025
Posted:
03 July 2025
You are already at the latest version
Abstract
Navigating and planning optimal paths for resource delivery algorithms presents significant physical and technical challenges in urban areas, particularly due to the use of existing infrastructure. As smart cities continue to grow, the importance of these algorithms becomes increasingly evident. The current urban landscapes are becoming saturated, which increases the complexity and difficulty of navigating vital resources. However, navigating densely connected networks can be intricate, often requiring substantial computational resources or additional algorithms. Unfortunately, there is a scarcity of explicit algorithms for navigating these networks, leading to a reliance on heuristic approaches and previous network systems. This dependence can create computational challenges, as navigation in this context often involves a combinatorial search space. One recent solution to address this issue is Morphological Shortness Path Planning (MSPP), which offers an efficient method for calculating the best trajectory within a complex graph. In larger towns, calculating and estimating the optimal trajectory and delivery time for resources starting from a store is a common task. Various external factors, such as average speed, time, and distance, influence these challenges. This paper presents a strategy for computing and forecasting delivery times by analyzing the accessibility of reliable paths from a delivery center. The results demonstrate a more efficient response time, ultimately improving planning for resource delivery in complex urban environments.
Keywords:
urban road network
; mathematical morphology search
; resource management
; graph search
; smart cities
1. Introduction
The nature, magnitude, and complexity of the transportation network environment pose major challenges for intelligent navigation systems [1,2]. One of the main tasks in this context is the selection of the most efficient route for logistical transfer management between two points of interest [3].
In this context, road and highway systems are a critical component of the urban and rural infrastructure that enables the livelihood of the population. These transportation systems are an indispensable part of the good development and economic growth of a region, reflecting its economic condition [4,5]. Transport and distribution logistics represent the last stage of the traditional life cycle in the development of products and services [6]. This phase involves the effective, efficient, and safe transportation of goods and services from distribution centers to multiple delivery points, in order to meet the needs of the end customer. Companies need to reduce the variable costs and fixed costs associated with the processes of distributing goods, since these directly impact the final cost of the products. Specifically, variable costs usually include, among others, fuel costs when traveling a route or the time spent on each transfer. Therefore, these costs are directly influenced by the distance and duration of the trip. In a real context, it is necessary to consider various restrictions and parameters that depend on the route, length, and travel time [7,8,9].
A transportation system is fundamentally comprised of a vast and interconnected network of roads, streets, avenues, highways, railways, ports, and air routes. These elements are essential for facilitating communication between populated areas. Effective road communication is crucial; it ensures that people, services, and supplies can reach their destinations quickly and safely, significantly enhancing the quality of life and driving the socioeconomic growth of the population [10]. The avenue network can be accurately modeled as a graph, and navigating this graph-based structure is a critical focus within graph theory. One of the primary objectives in this field is to identify the most efficient path. The literature offers numerous approaches to tackle this challenge, often constrained by the specific context of their application. Nevertheless, these constraints make it possible to compute solutions effectively under certain conditions [11,12,13].
The core issue at hand is to find a suitable solution to the most efficient path problem. It is essential to acknowledge that this problem is undecidable [14]; therefore, the proposal focuses on developing a practical approach to identify reliable solutions that closely approximate the optimal ones in a timely manner.
The task of computing the shortest path over a dense graph is considered an NP-complete problem [15]. There are robust methodologies that propose alternative solutions to help determine a solution that is regarded as computable in terms of adequate resources and time, thereby avoiding unmanageable computational tasks. The environment of the scenario and the operation define a set of restrictions that allow the problem to remain within ranges considered manageable.
Morphological Mathematics (MM) offers two fundamental operators: dilation and erosion. By combining these operators, we can create new filters and operators, such as opening, closing, and the morphological gradient. These operations modify input data based on a neighborhood constraint defined by a structural element [16,17,18]. In most applications, MM serves as a generalized reference framework primarily used in grid structures, and less frequently in graph spaces associated with a lattice through morphological operators[19,20]. In a graph space that lacks a defined order relation, morphological operators act as predecessor and successor operators, thereby generating an order relation. This work implements a generalized framework to identify the minimum path between two designated points, based on the morphological operators. The morphological approach begins with a minimum connected subgraph, in contrast to the total search space, referred to as the supremum. This method has proven efficient for finding optimal routes in graph-based spaces [21].
Now, the literature defines an urban road network as a complex interconnected system, due to the large number of spatial components with intricate structures that interact with each other and can be represented as a dense graph [22]. Roads in a city/town/country can be represented as a graph of interconnections, and finding the best route with minimum cost in a graph is a challenging task that requires NP-algorithms [23,24,25]. One of the complex challenges arises when any position in an urban center does not rise with the road infrastructure due to the urban conditions.
The approach focuses on analyzing the applicability of optimizing resource distribution by calculating optimal routes based on the concept of critical radius of impact reach. This concept defines the reach of trajectories generated from a distribution center and their impact when traversing a graph space composed of a dense network in a settlement with manageable complexity. To achieve this goal, the approach introduces two new operators that support a new family of algorithms, providing an efficient framework for navigation in dense graphs [21].
Finally, the proposed strategy is validated through an experimental process aimed at identifying the scope of the most efficient routes, using the geographic image layer corresponding to the avenues of Mexico’s largest and most representative city as a basis. The study focuses on distribution centers located in highly economically relevant and densely populated areas, characterized by a complex road network and a high number of interconnected avenues. These areas exhibit significant variations in traffic speeds throughout the day. This task is carried out by implementing in the case study the Morphological Shortening Path Planning algorithm (MSPP), proposed by Pérez-Ramos et al. in 2024 [21]. The results obtained demonstrate the effectiveness and scope of applying the proposed methodology in real, dynamic, and complex urban scenarios.
The rest of the article is organized into sections. Section 2 presents a literature review of the works considered relevant on the subject. Then, Section 3 describes the details of the proposal. Section 4 presents the experimental process developed in the work. Section 4.2 presents the results obtained and discusses the findings. Finally, Section 5 presents the conclusions, discusses the limitations of the proposed case study, and describes any future work that may arise.
2. Literature Review
Since the beginning of the COVID-19 pandemic, the world has experienced significant changes in its consumption dynamics, highlighting a notable growth in demand for goods and services. This increase has generated significant opportunities in urban freight distribution. This distribution plays a fundamental role as the basis for commercial activities that support the economy and the dynamics of growing cities. However, indirect problems related to increased traffic flow and the quality of services have also been detected [26].
The fundamental problem of vehicle routing initially arises as an optimization complement to the classic routing problem used in maritime oil transport between underlying refineries. In this sense, a specific set of customers with potential variable product demands is defined, and a centralized distribution center manages the delivery of goods to these customers through a predefined transport fleet that allows for efficient organization of distribution routes. The main objective is for the distribution of products to reach their destinations, covering the distance with the lowest possible cumulative cost, which in turn implies the minimization of operating costs and operating times. Various constraints defined by the use case are also considered [27].
Moutaoukil [28] classifies the problems associated with urban freight distribution into three large groups: the first, related to economic impact, covers problems of operational inefficiency, high service costs, among others; the second, focused on environmental impact, considers aspects such as emissions, global warming, and excessive consumption of fossil fuels; finally, the social impact, which is reflected in issues of public health, traffic accidents, noise pollution, and customer satisfaction.
Based on this evidence, two key components can be identified that contribute to addressing these areas of opportunity. The first component generally focuses on the analysis of optimal routes, with the goal of reducing the calculation of discretized geodesic distances along the avenues that must be traveled efficiently, minimizing costs and delivery times, and improving the customer experience. The second component focuses on the analysis of the impact radius of distribution centers, especially in complex cities, enabling greater efficiency in delivery planning through the use of parameters such as the best routes and average traffic speeds.
2.1. Distribution Center Location Logistics
The literature describes the hub as a unified distribution center where key tasks such as receiving, sorting, storing, and processing goods of various types are performed. These centers are essential for logistics management, as they allow for the implementation of more efficient distribution strategies, significantly contributing to cost reduction. Furthermore, each transport unit that departs from the distribution center can be considered a mobile mini-hub, as it transports various quantities of goods that are delivered along a pre-planned route, serving multiple customers located in the same area. The problem of hub location consists of determining the optimal location for these centers, ensuring an efficient flow of goods. To do this, it is necessary to consider the operational scope of the fleet, avoiding areas with high overlap in delivery routes that could hinder or impede the logistics process [29].
Considering the aforementioned challenges and areas of opportunity, a disproportionate growth in demand is identified, along with urban management and logistics problems. Therefore, analyzing the impact radius based on distribution centers located in densely populated areas represents a promising strategy to reduce these problems [30,31].
Some works have proposed models based on the optimal location of micro-hub networks that allow covering the largest possible area in urban delivery services, as in [32]. These models are based on optimization algorithms for agile routing, which have proven effective in cities with high logistical complexity, such as the case study of Barcelona, where a large number of distribution centers with variable impact radius are required [10].
Bard and Nananukul [33] propose an integrated framework that includes production, inventory, and distribution planning, with the objective of satisfying customer demand by minimizing total costs. This type of model focuses on clearly defined objective functions, which include: (i) minimizing transportation costs, considering the number of vehicles, their types, and load capacities; (ii) minimizing the total distance traveled; (iii) determining the minimum fleet necessary to complete deliveries; (iv) minimizing downtime or empty vehicle runs; and (v) reducing penalty costs associated with non-compliance with customer service levels.
To address this problem, the model presented in [34] proposes a single hub as a unified distribution center with time-varying demand, a finite planning horizon, and a homogeneous fleet of vehicles for deliveries. The routing problem is solved using reactive tabu search, which allows for finding feasible solutions to the entire problem. However, the model faces significant challenges as the amount of information analyzed increases, due to the high computational complexity of the proposal.
2.2. Optimal Routes Approach
In the context of intelligent navigation, route planning represents one of the most relevant areas to consider. Some works introduce the concept of symmetry through bidirectional search techniques, thus optimizing the route calculation process. In practical scenarios, where complex real-world environments are represented as densely connected graphs, planning algorithms such as have established themselves as fundamental tools for determining the route with the lowest cumulative cost, according to a metric defined based on the analysis case.
To address this task, there are various approaches aimed at obtaining optimal routes. One of the most classic approaches is based on graph search techniques, among which the most notable are Dijkstra’s algorithm [35], which has been improved and adapted with use-case-specific restrictions, expanding its applicability; and the algorithm, which uses a heuristic function to estimate the minimum cost required to reach the target node [36].
On the other hand, sampling-based algorithms, such as Rapidly-Exploring Random Tree (RRT) [37] and Branch and Bound (B&B) [38], build random trees from samples of the search space, discarding trajectories that are not viable for achieving the objective.
However, there are strategies based on optimization functions, among which stand out genetic algorithms [39], particle swarm optimization (PSO) [40], and ant colony optimization (ACO) [41], among others.
In [42], a model is proposed that addresses the problem of vehicle routing under delivery time window constraints. The total distribution radius is calculated using the algorithm, considering objective functions that incorporate penalties for delivery overtime, as well as customer satisfaction. This process is optimized using a hybrid algorithm based on ant colonies. Along these lines, various approaches are compared in Table 1, considering the search space addressed in each study, as well as the constraints and key factors included in the proposed models.
On the other hand, graph-based search approaches that determine the best possible route have proven to be a robust framework for this type of study [21]. This approach focuses on analyzing and predicting maximum reach ranges based on the geodesic distance, defined by the distribution environment and centers strategically located in areas with high commercial traffic, such as Mexico City. In addition to considering the geodesic distance as a relevant factor, the average traffic speed is incorporated into the analysis according to the time of day in which the delivery is simulated, as well as the delivery area in which it is carried out.
3. The Proposal
In this section, an efficient distribution scheme based on the concept of critical radius of affectation range is presented, using the Morphological Shortness Path Planning (MSPP), proposed by Perez-Ramos et al. in 2024 [21]. This approach is used as a framework for the optimized search process in a discrete space represented by dense graphs.
3.1. Search Criterion
The MSPP method employs morphological operators to evaluate the spatial neighborhood to identify potential path trajectories. This technique involves executing a series of dilation operations initiated from the origin node. Upon reaching the destination node, the frequency of dilation for each node generates a new topological surface. On this surface, the paths connecting the origin to the destination nodes represent the shortest trajectories, adhering to a semi-order relation. The semi-order relation is defined by the number of times each node was dilated.
This approach demonstrates computational efficiency by exploring both breadth and depth, thereby enabling the effective elimination of node regions that do not contribute to the optimal solution. The algorithm works on the assumption that solutions can be accessed through dilation, which may lead to a non-decidable state. However, as discussed in , this issue is addressed by implementing a conditional test that verifies whether the solution remains within a non-connected graph structure.
This characteristic makes it feasible to use the algorithm for work purposes, which necessitates an efficient algorithm that is decidable over the best path trajectory to be applied in the infrastructure of dense towns. The algorithm pseudo-code is presented in Algorithm 1.
| Algorithm 1 Pseudo code of MSPP based from [21] |
|
3.2. Implementation Issues
To summarize the concepts introduced in this chapter, the proposed methodology focuses on selecting a distribution center and evaluating its surroundings to estimate delivery routes. This process involves considering the size of the access area based on the chosen location, the distribution of vehicles, and the maximum distance that needs to be covered. This distance depends on the delivery infrastructure and can vary; larger zones tend to be more beneficial, as they reduce complexity in the analysis.
Next, the local neighborhood is analyzed to understand the topology (road infrastructure) surrounding the distribution center. The topology is crucial because the complexity and constraints of access can affect the actual distance that needs to be traveled to deliver goods. The distance traveled is referred to as the geodesic distance, as it represents the real adjacency of the roads that form the sequence of routes for delivering the goods. The Eucliden distances (as the distance from the delivering center to the location in a direct line) are used to appreciate the complexity of delivering to each destination zone.
Following this, we used the neighborhood topology along with prior information about common destinations and potential delivery locations to assess neighborhood accessibility. Table 2 illustrates the destination zones; these zones become used as a reference to understand the topology establish the best criteria for delivering goods, and evaluate the best time response. Formally, the delivering center becomes denoted by a tuple , which indexes in the geographical grid the physical location. the list of possible destination that represent a geographical delivering locations.
Based on this data, we computed a list of optimal delivery paths using the MSSP algorithm described in Algorithm 1. The optimal routes computed denote the geodesical shortest path and represent the most suitable to be performed. This list produced a set of optimal routes for deliveries in the area.
The previously destination places, which, together with a sampling process, build a list of destinations. The first step involves determining the geographical location. Once the map of the vitality structure is obtained, the next task is to compute potential and probable destinations within a proximity radius using the MSPP algorithm. This process is illustrated in Figure 2 for the Terminal Norte location. The geographical zone indicates the location of the distribution center. In this context, the proximity area is defined as approximately 2 km, the distance an operator can cover on a motorcycle. Using a motorcycle is preferred because it offers a dynamic mode of transport that is more effective in crowded scenarios.
4. Experimental Analysis and Results
In this section, an experimental model is presented to evaluate the strategy’s performance and applicability in a practical case in large cities with complex road systems.
4.1. The Context of Application
Planning and estimating deliveries from a store or distribution point in a large town presents a significant opportunity, as it directly impacts customer satisfaction and can make delivery planning more cost-effective based on the town’s local dynamics. To address this challenge, a strategy focused on delivery locations around the store was proposed. This strategy leverages potential delivery areas and sub-sampling locations to optimize the delivery process.
By using this information, we can define a maximum distance for delivering goods based on the physical distance from the store. A list of available locations allows us to compute the best delivery path using the Morphological Shortest Path Planning (MSPP) approach, constructing a dense graph based on the city’s layout. This graph is created to show the center of average distribution within the maximum proximity radius. The computation considers the town’s structure and direction within this proximity perimeter.
The continuous evaluation of the best delivery path yields insights into the optimal physical delivery route. As a result, the distance distribution across all delivery routes provides valuable data, enabling us to calculate the expected distance that will need to be covered.
While physical distance is an essential factor, it only accounts for part of the task. Traffic flow throughout the day significantly influences the average speed of navigation within the town, which can be represented as a delay in arriving at each destination in our graph. By combining the average traffic flow with the expected delivery distances from the store throughout the day, we can anticipate the delivery times to various locations. This information serves as the data foundation for creating our delivery planning strategy, which is the primary objective of this work.
4.2. The Case of Study
Mexico City, the country’s capital, is divided into five main zones: South, North, East, Central, and West. It is Mexico’s most densely populated city, with the highest population density in the central-northern zone. As a result, certain densely populated areas have been identified where delivery services tend to incur high costs due to the time and distance required for deliveries. Figure 2 illustrates the location of Mexico City and the candidate zones to analyze, labeled by the numbers 1 to 5 that represent strategic zones to install a center delivery. In particular, Table 2 summarizes the specific candidate zones to be considered, indicating in a small map the geographical place that corresponds to each one set up to deliver supplies.
The implementation involves using the current town topology while adhering to existing flow restrictions and directions. In this analysis, the proximity radius is approximately 2 km (that represents a coverage area around 12 km2), which is a manageable distance for a motorcycle. To illustrate the case study, we focus on one of the selected locations, Terminal Norte, and the complete results for all locations are presented in Section 4.3.
Figure 1.
Location of a Mexico City Town and distribution centers to analyze the proximity radius [44].
Figure 1.
Location of a Mexico City Town and distribution centers to analyze the proximity radius [44].
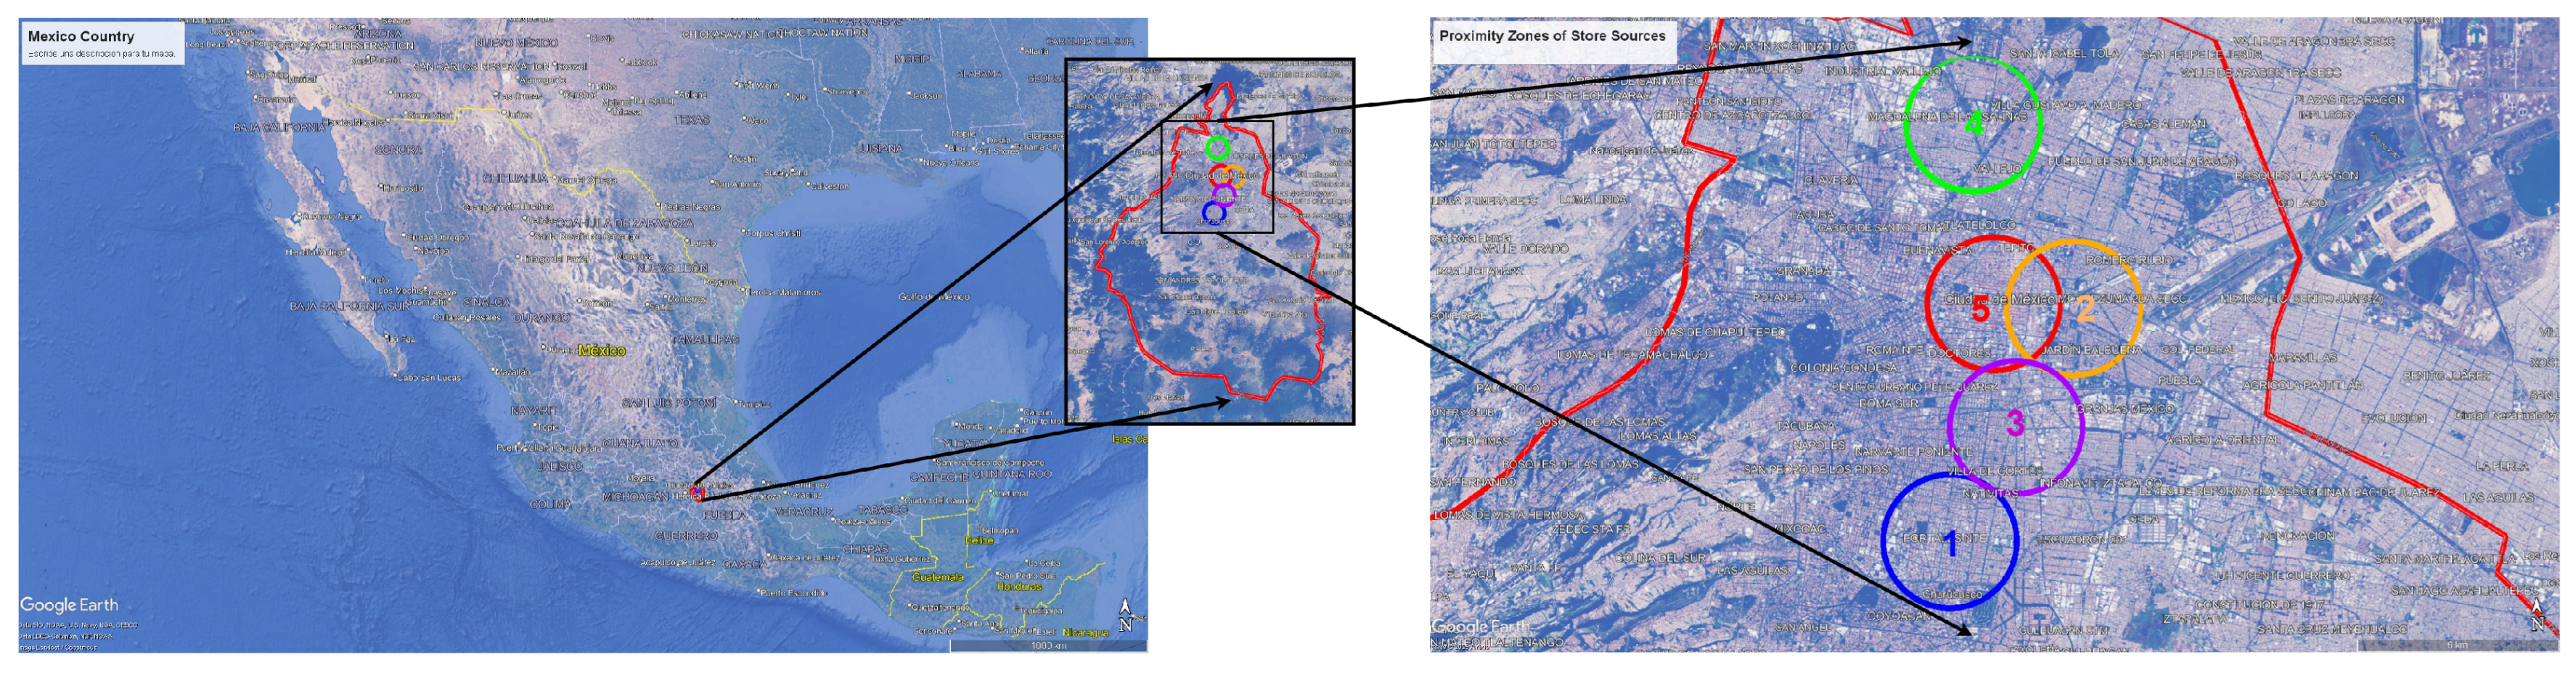

Table 2.
Step 1: Table of distribution center location.
| No | Place | Town area | Illustration |
|---|---|---|---|
| 1 | Churubusco | South of town | 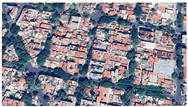 |
| 2 | San Lazaro | Center-East of town | 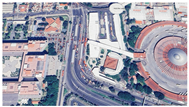 |
| 3 | Santa Anita | Center-South of town | 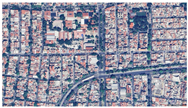 |
| 4 | Terminal Norte | North of town |  |
| 5 | Zocalo | Center of town |  |
Figure 2.
Illustration of process analysis.
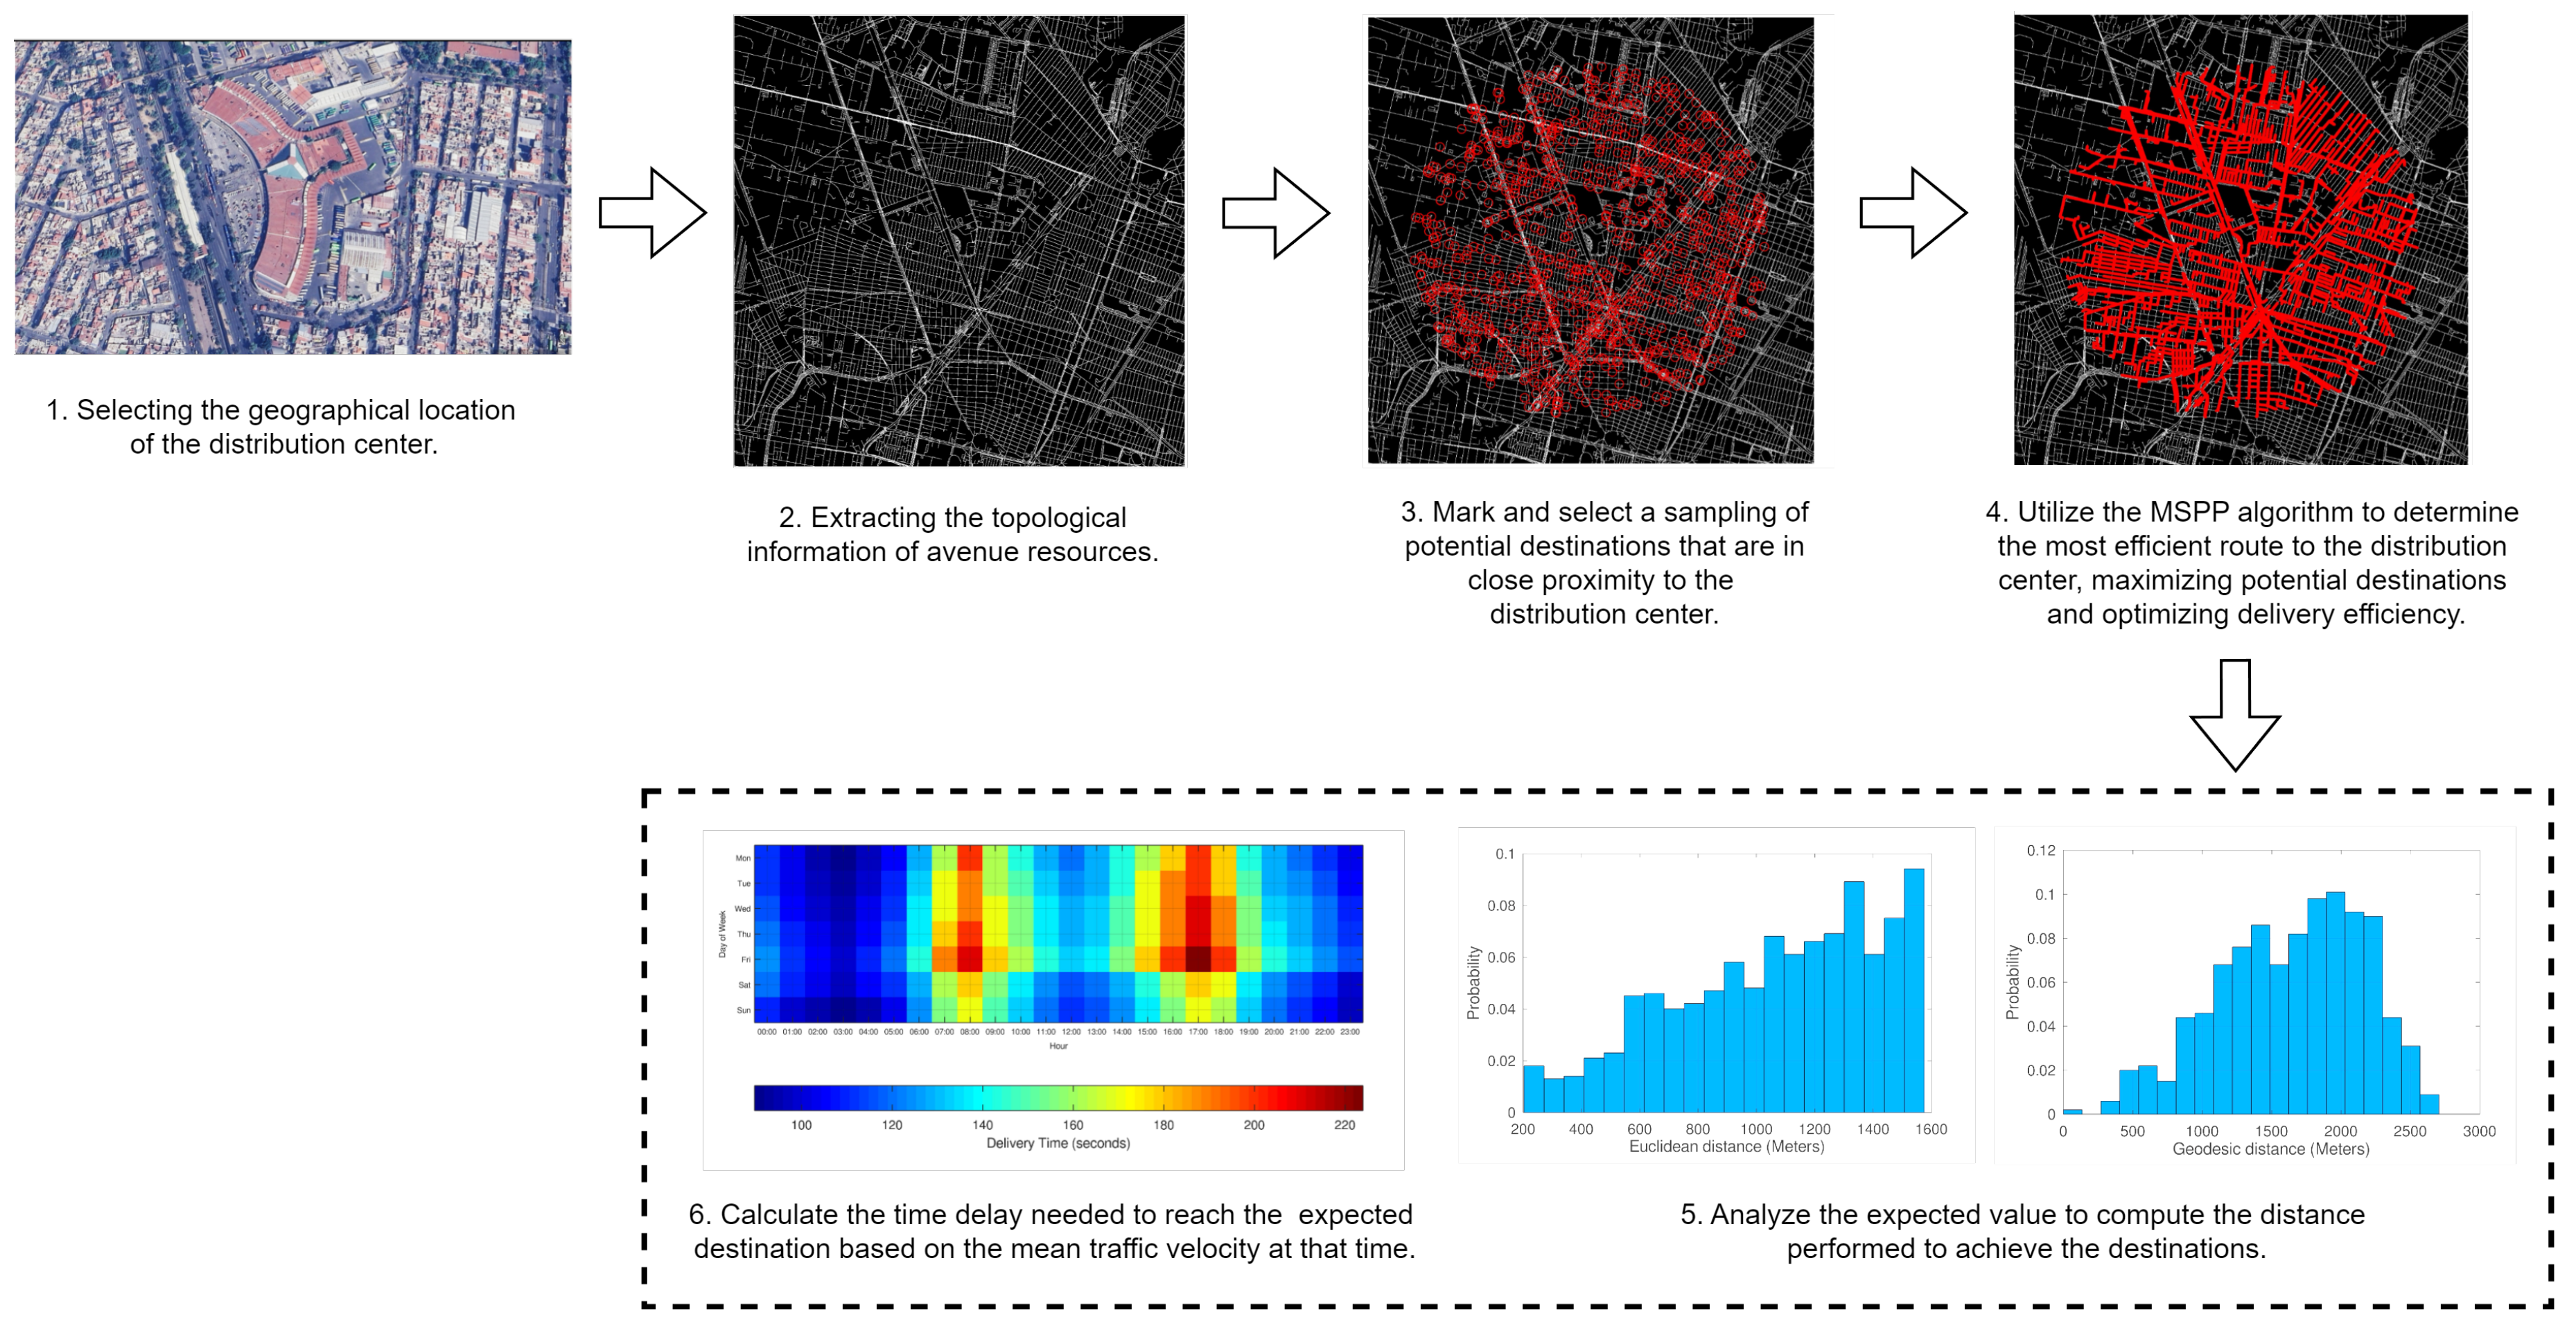
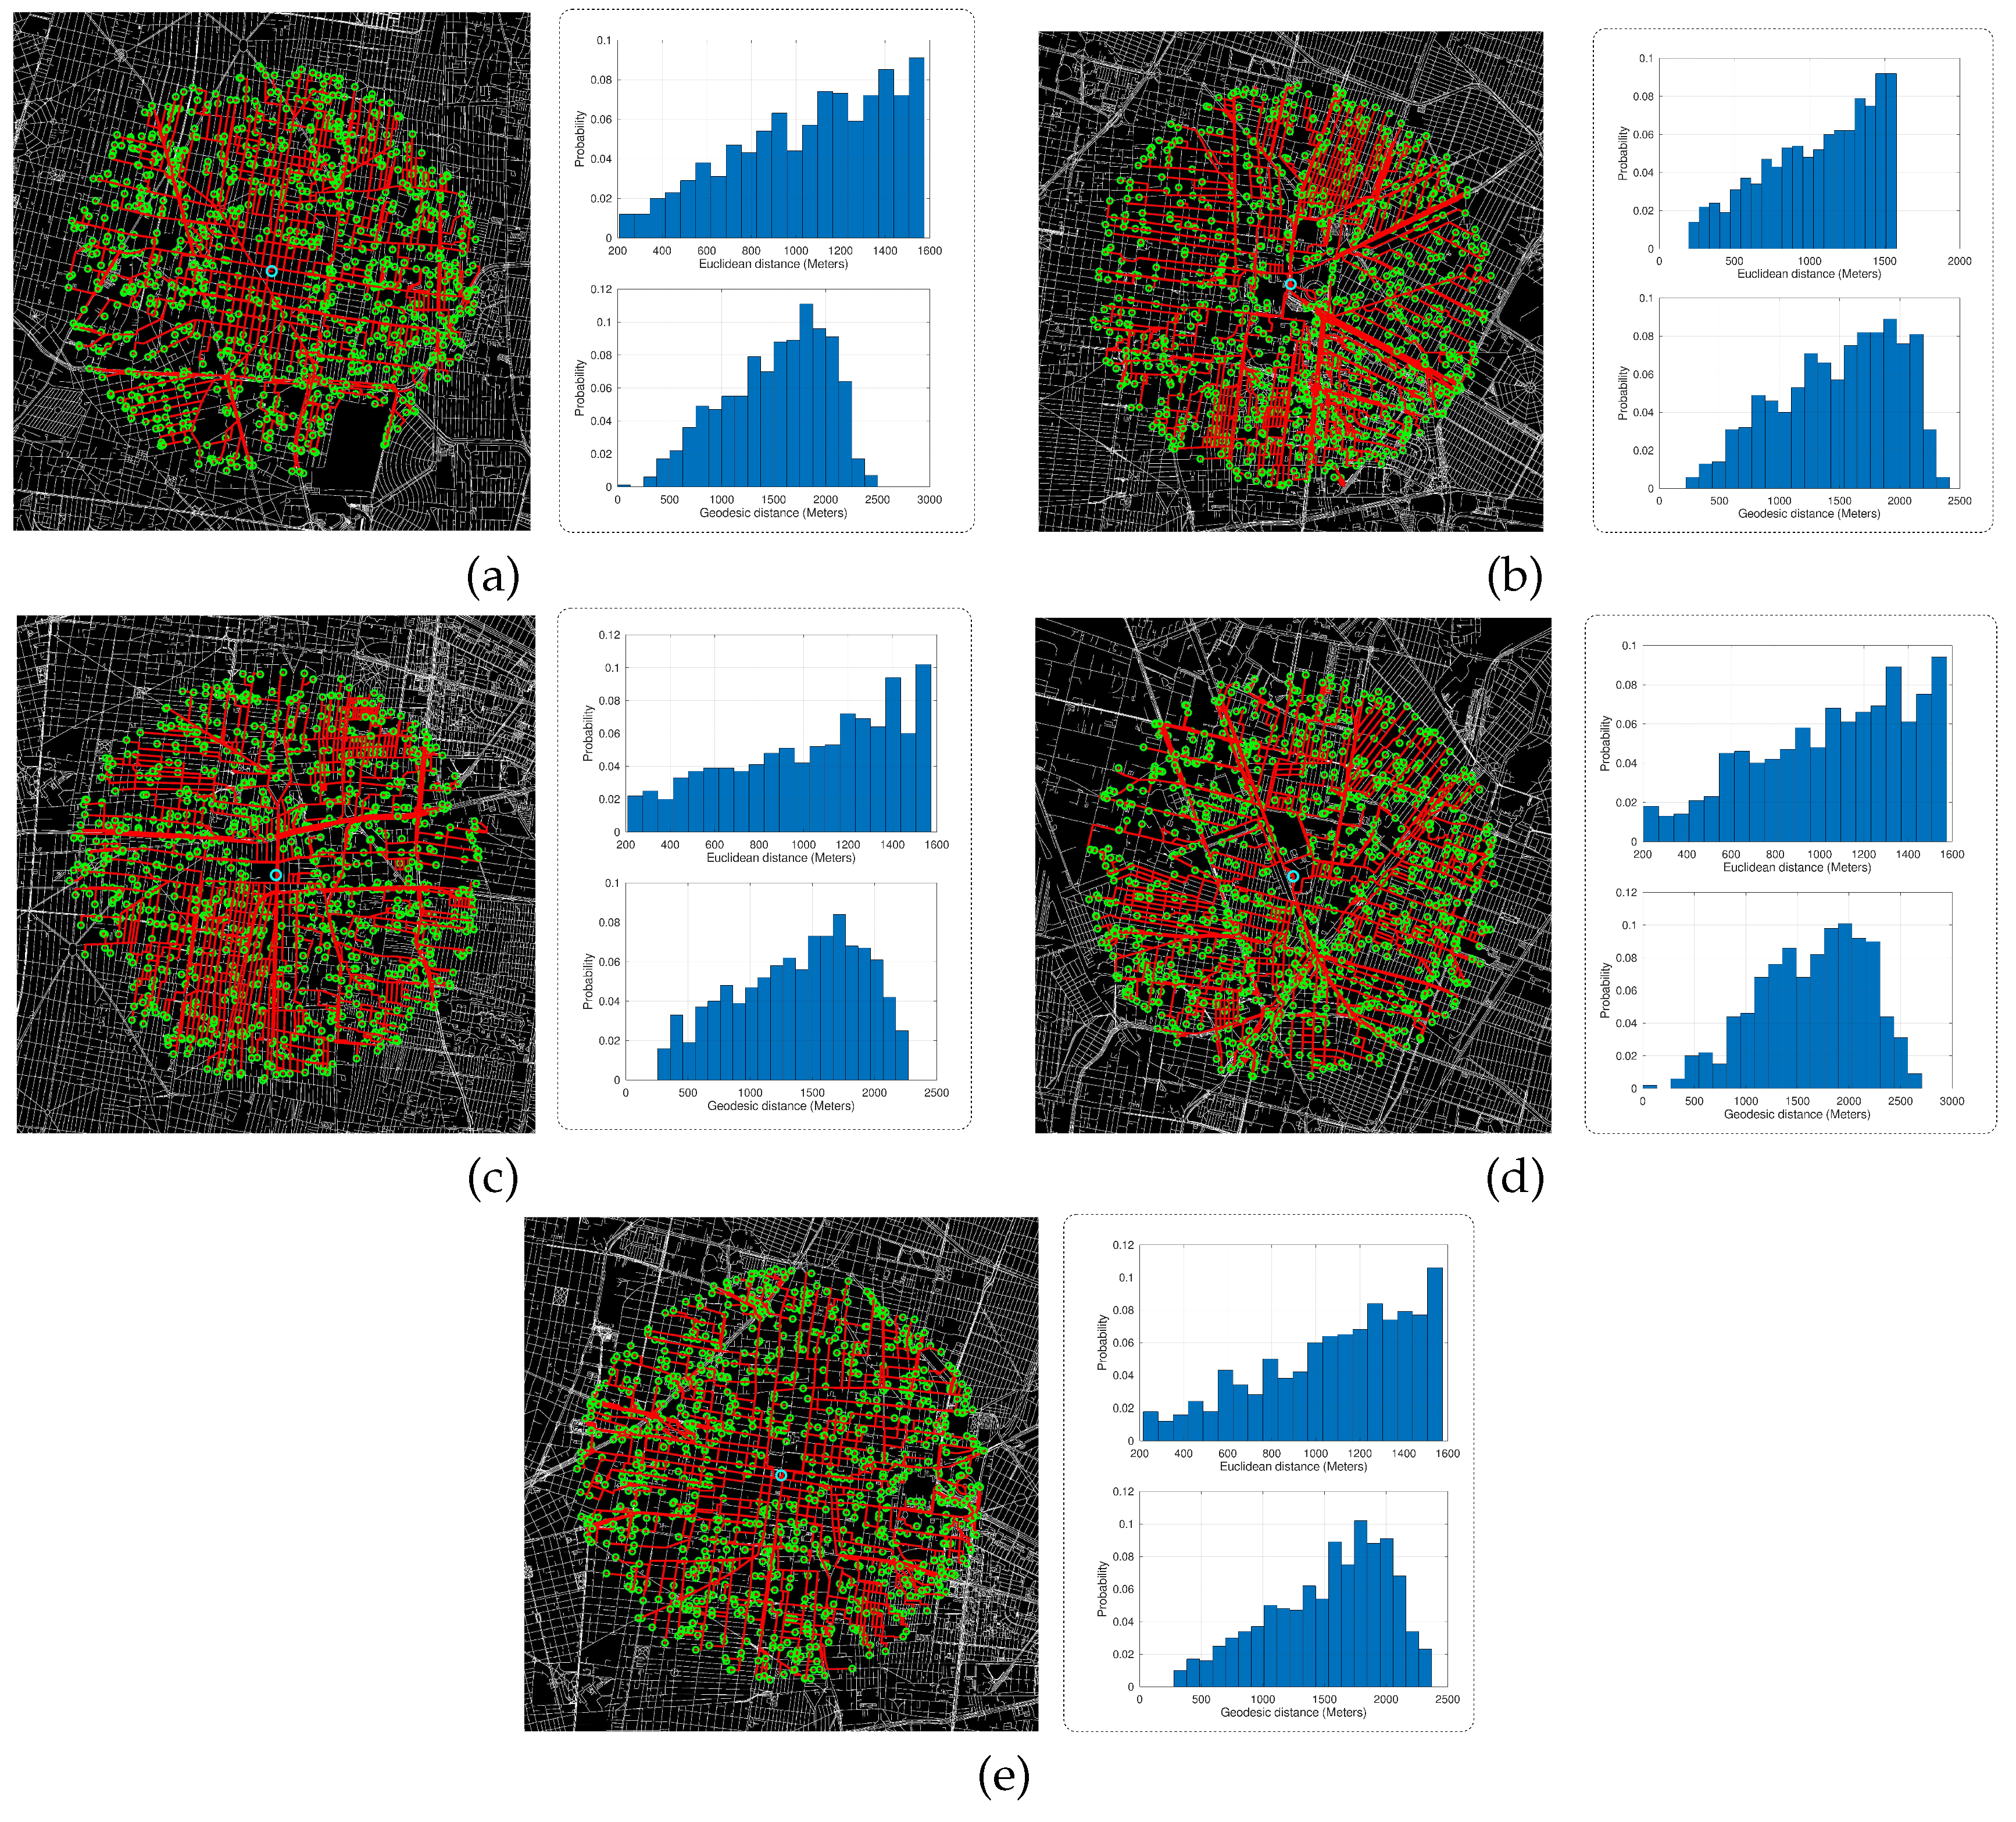
Figure 3.
Sampling of candidate distribution locations within the vicinity radius using Euclidean and geodesic distances for the optimal distribution of resources to various distribution centers: (a) Churubusco, (b) San Lázaro, (c) Santa Anita, (d) Terminal Norte, and (e) Zócalo.
Figure 3.
Sampling of candidate distribution locations within the vicinity radius using Euclidean and geodesic distances for the optimal distribution of resources to various distribution centers: (a) Churubusco, (b) San Lázaro, (c) Santa Anita, (d) Terminal Norte, and (e) Zócalo.
The experimental process shows an application of the algorithm for calculating the minimum route in a graph-based space proposed by Perez et al. (2024) [21]. The validation of the application is evaluated in a practical case of calculating optimal routes by radius of reach of impact on the distribution of resources. The experimental process is described from the stage of reinterpretation of the map in a graph-based representation to the analysis of the calculation of the approximate geodetic distance until the objectives are reached. The complete process consists of the following stages.
- Selecting the geographic location of the distribution center. In this process, well-known distribution centers in the city are selected, located in central, high-traffic areas of Mexico City (see Table 2). This selection aims to evaluate the efficiency of the proposal in representative environments with high demand for this type of service.
- Extract topological information of avenue resources. The process involves encoding the cities as a connected graph and creating the nodes through the encoding process by detecting these as the intersection zones between the avenues. For this purpose, a section of the map of the most densely populated and complexly structured cities like Mexico, such as Mexico City, is used. The graph is weighted based on the distance in a defined metric space to represent the connections of the nodes accurately. The vertex detection method is used to segment the road and identify the maximum values of the distance transformation, which serve as nodes. The interconnection between the avenues generates the arcs that serve to connect each pair of nodes.
- Marking potential destinations near the distribution center. Random points are proposed that simulate the final delivery or distribution locations. These delivery points will serve as a reference for calculating the best possible route, considering the average speed variables defined by the area being analyzed.
- Application of the MSPP algorithm to determine the most efficient distribution route. This process defines route reach areas from a central distribution point and a maximum reach. This critical radius is defined under an Euclidean metric and Geodesic distance. The structure of the avenues, streets and highways define the trajectories with radius based on the geodesy of the scenario, calculating the maximum reach radius of a service.
- Analyze the expected value to calculate the distance traveled to reach the destinations. In this stage, the impact is analyzed in multiple representative areas of the main distribution points in Mexico City. The objective is to evaluate the distance traveled to reach any target point, starting from the distribution center, considering it as the center of the affected area, considering both the expected Euclidean distance and the geodesic distance.
- Calculate the delay time to reach the expected destination based on the average traffic speed. Finally, a complementary analysis is carried out by analyzing the length of the maximum range geodetic routes in contrast with the estimated time it takes to travel in an average week, according to average traffic speed values in Mexico City by urban area.
4.3. Results
Following Figure 2, it begin with satellite images to create binary representations of vital resources and traffic flow within the city. The image encodes all vehicular communication viaities expressed as marked zones. The information about the city’s avenues can be represented as a graph space. The binary map results in an effective navigable map, because it becomes represented as the graph adjacency to navigate among the viatliaties.
The algorithm’s input image is derived from candidate locations designated as distribution centers and available distribution destinations, while also considering the surrounding areas for goods delivery. We employ random sampling from these candidate zones, ensuring a uniform probability distribution that accurately extracts local neighborhood behavior.
In the same vein, the computational process responsible for analyzing and processing all candidate delivery zones and the candidate delivery center by calculating the shortest routes with MSPP.
After identifying all the shortest paths, we calculate the Euclidean distance, representing the direct line between the origin and destination, and the geodesic distance, which reflects the actual distance based on the graph’s topology. These calculations are highly relevant for estimating the travel distance of each delivery vehicle from the distribution center to the destination. The results of the shortest path distribution are illustrated in the fifth step of Figure 2, which shows the distances calculated from the areas defined as sampling points. The expected value calculation provides information about the actual distance traveled during the distribution process.
Like distance, the average speed at which vehicles can move in these areas of Mexico City plays a crucial role in calculating the time required for deliveries. These data were analyzed last year (2024) based on studies conducted by INEGI and SEMOVI. [45,46]. The importance of this variable is clearly illustrated in the calculation of delivery times shown in the fourth step of Figure 2.
The time required for delivering goods is not constant; it varies over time due to differences in the average speed of vehicles in each local neighborhood. This speed reflects the density of communication resource usage at different times, affecting delivery timelines. In step 6, we will detail the computation and adjustment of average velocity to varying hours of the day to provide further clarity on this matter.
The complete data analysis regarding delivery times is illustrated in Figure 4. The results show the average time delay for completing deliveries in different city zones. Notably, delivery times are influenced by both the hour and the location. For instance, in Churubusco on a Saturday at 8:00 AM, the delivery time is approximately 160 seconds. However, if the delivery is made at the same location and time but on a different day (e.g., Friday), the time increases to about 190 seconds. A similar effect is observed on Saturdays in the Santa Anita area, where the difference between making a delivery at 7:00 a.m. and 8:00 a.m. increases from 130 to 160 seconds, due to the variation in average speed and well-known peak hours in the city.
As is appreciated, the shortest of the previously calculated paths is always the most efficient path to deliver the goods. The implication of always computing the efficient trajectory is that the uniform sampling of the local neighborhood delivering places provides the local information distances to travel for real delivery. Ideally, the Euclidean distance represents the shortest rectilinear distance (right-up graph from Figure 3a–e). It is observed that the Euclidean distribution is approximated by an incremental distribution in all cases. The surface becomes sampled as a circle, so selecting zones becomes more probable in external zones as the sampling is uniform. To respect geodesic distance (right-up graph from Figure 3a–e), the range of true distance to be traveled for delivering becomes increased. This is because there is no direct path for different locations, so the candidate path depends on local avenius connections and the topology. This might cause physically near locations to have higher geodesical distances due to the topology of the infrastructure, which conditions the available routes to the destination. This is shown as a PDF distribution, such that they have a maximum value before the most distant location to travel, representing that the delivering distances become uniformly distributed. In the locality, a certain degree of connection determines the most probable distances to cover. Once the real distance to travel to each locality, with the average velocity over time, is known, the time response can be estimated. The advantage of this computation reflects the most probable and true-time delay due to the physical distance to cover in the delivery process, which is shown in Figure 4. The delivery time figure is now used to determine the time lapse, which is more suitable for best responses, or the time delivering at an exact hour.
The proposed methodology serves as the basis for creating delivery plans and criteria linked to well-established variables such as cost, response time, and scheduling, while excluding the impact of traffic.
The results confirm that the proposed approach is a highly reliable framework for developing search algorithms in a graph-based space. Additionally, it establishes a robust framework for path searching, providing a strong and concise theoretical foundation for defining the search process in any given environment. This method effectively simplifies the general approach to searching in discrete spaces.
5. Conclusions
In dense urban networks, the predictive determination of the most efficient route for delivery vehicles to follow is of primary interest in order to ensure the timely distribution of goods and services. This work focuses on a real-life case study, which seeks to calculate the critical distribution radius, considering real-life variables such as average traffic speed in five dynamically active areas of Mexico City. Furthermore, the variability in traffic speed throughout the day is incorporated. For this purpose, the Morphological Shortness Path Planning (MSPP) approach proposed by [21] was implemented. The main contribution of this work lies in defining a strategy to compute and predict delivery times based on the analysis of the best route calculated from specific distribution centers for each area. This strategy is developed on a space represented by graphs, defined by the dynamics of the road system composed of streets and avenues in the analyzed areas of Mexico City.
The experimental results demonstrate that the MSPP-based strategy is efficient in determining the best delivery route from a known distribution center by calculating the geodesic distance, which represents the most appropriate trajectory to consider.
5.1. Futher Works
This case study has allowed the MSPP approach to be tested. The documented strategy presents areas of opportunity, particularly in the future incorporation of criteria that enable algorithm parallelization, as discussed in the original work by Pérez et al. [21]. This would improve overall system performance by distributing tasks across multiple processing cores, accelerating execution and reducing response times. As a result, it would facilitate obtaining solutions in applications that require real-time responses in a fluid and efficient manner.
In this same sense, the use of computational resources would be optimized in embedded environments and autonomous systems, where energy and computing capacity constraints are significant. It is precisely in these scenarios that route planning algorithms such as MSPP find their main field of application.
Finally, the use of a graph-based search space offers a more flexible and efficient representation of complex interconnected networks, allowing for better memory management by avoiding the exhaustive analysis of the entire space, as is the case with grid space representations.
Author Contributions
Conceptualization, J.-L.P.-R. and H.J.-H.; Formal analysis, A.-M.H.-N. and H.J.-H.; Methodology, J.-L.P.-R., A.-M.H.-N. and H.J.-H.; Software, H.J.-H.; Supervision, A.-M.H.-N. and H.J.-H.; Writing—original draft, J.-L.P.-R. and A.-M.H.-N.; Writing—review and editing, A.-M.H.-N., J.-L.P.-R. and H.J.-H.. All authors have read and agreed to the published version of the manuscript.
Funding
This research received no external funding.
Institutional Review Board Statement
Not applicable.
Data Availability Statement
Data are contained within the article.
Acknowledgments
We wish to give thanks to the Mexican Artificial Intelligence Alliance, with the FORDECYT Project 296737 Consorcio en Inteligencia Artificial, which provided the student scholarships, and CIICCTE (Centro de Investigación e Innovación en Ciencias de la Computación y Tecnología Educativa) laboratory belonging to the FIF-UAQ, which provided technical and infrastructure support.
Conflicts of Interest
The authors declare no conflicts of interest.
References
- Farahani, R.Z.; Miandoabchi, E.; Szeto, W.Y.; Rashidi, H. A review of urban transportation network design problems. European journal of operational research 2013, 229, 281–302. [Google Scholar]
- Zhang, H.; Zhang, G.; Cai, X. Logistics Transfer Center Planning Based on Internet of Things Technology. In Proceedings of the Application of Intelligent Systems in Multi-modal Information Analytics: Proceedings of the 2020 International Conference on Multi-model Information Analytics (MMIA2020); Springer, 2021; Volume 1, pp. 175–182. [Google Scholar]
- Tian, Z.; Jia, L.; Dong, H.; Su, F.; Zhang, Z. Analysis of urban road traffic network based on complex network. Procedia engineering 2016, 137, 537–546. [Google Scholar]
- Idhoko, K.; Ndiwari, E.; Ogeh, V.; Ikegbulam, S. Urban road network analysis of Yenagoa, Bayelsa State Using GIS. International Journal Of Engineering And Computer Science 2016, 5, 15605–15615. [Google Scholar]
- Steever, Z.; Karwan, M.; Murray, C. Dynamic courier routing for a food delivery service. Computers & Operations Research 2019, 107, 173–188. [Google Scholar]
- Liu, W.; Zhang, J.; Shi, Y.; Lee, P.T.W.; Liang, Y. Intelligent logistics transformation problems in efficient commodity distribution. Transportation Research Part E: Logistics and Transportation Review 2022, 163, 102735. [Google Scholar]
- Konstantakopoulos, G.D.; Gayialis, S.P.; Kechagias, E.P. Vehicle routing problem and related algorithms for logistics distribution: A literature review and classification. Operational research 2022, 22, 2033–2062. [Google Scholar]
- Li, Y.; Liu, M.; Jiang, D. Application of unmanned aerial vehicles in logistics: a literature review. Sustainability 2022, 14, 14473. [Google Scholar] [CrossRef]
- Mahmoudi, M.; Chen, J.; Shi, T.; Zhang, Y.; Zhou, X. A cumulative service state representation for the pickup and delivery problem with transfers. Transportation Research Part B: Methodological 2019, 129, 351–380. [Google Scholar]
- Castillo, C.; Panadero, J.; Alvarez-Palau, E.; Juan, A.A. Towards greener city logistics: an application of agile routing algorithms to optimize the distribution of micro-hubs in Barcelona. European Transport Research Review 2024, 16, 44. [Google Scholar]
- Candra, A.; Budiman, M.A.; Hartanto, K. Dijkstra’s and a-star in finding the shortest path: A tutorial. In Proceedings of the 2020 International Conference on Data Science, Artificial Intelligence, and Business Analytics (DATABIA); IEEE, 2020; pp. 28–32. [Google Scholar]
- Samolej, S.; Dec, G.; Rzonca, D.; Majka, A.; Rogalski, T. Regular graph-based free route flight planning approach. Aircraft Engineering and Aerospace Technology 2021, 93, 1488–1501. [Google Scholar]
- Cui, H.; Qiu, J.; Cao, J.; Guo, M.; Chen, X.; Gorbachev, S. Route optimization in township logistics distribution considering customer satisfaction based on adaptive genetic algorithm. Mathematics and Computers in Simulation 2023, 204, 28–42. [Google Scholar]
- Ju, C.; Luo, Q.; Yan, X. Path planning using an improved a-star algorithm. In Proceedings of the 2020 11th international conference on prognostics and system health management (PHM-2020 Jinan); IEEE, 2020; pp. 23–26. [Google Scholar]
- Halim, A.H.; Ismail, I. Combinatorial optimization: comparison of heuristic algorithms in travelling salesman problem. Archives of Computational Methods in Engineering 2019, 26, 367–380. [Google Scholar]
- Gaikwad, S.K.; Karwankar, A.R. Food image 3D reconstruction using image processing. 2019, Vol. 2019-April. [CrossRef]
- Hÿtch, M.; Hawkes, P.W. Morphological image operators; Academic Press, 2020. [Google Scholar]
- Aiguier, M.; Bloch, I. Logical dual concepts based on mathematical morphology in stratified institutions: applications to spatial reasoning. Journal of Applied Non-Classical Logics 2019, 29, 392–429. [Google Scholar]
- Marcondes, D.; Barrera, J. Discrete morphological neural networks. SIAM Journal on Imaging Sciences 2024, 17, 1650–1689. [Google Scholar]
- Maragos, P. Tropical geometry, mathematical morphology and weighted lattices. In Proceedings of the International Symposium on Mathematical Morphology and Its Applications to Signal and Image Processing; Springer, 2019; pp. 3–15. [Google Scholar]
- Perez-Ramos, J.L.; Ramirez-Rosales, S.; Canton-Enriquez, D.; Diaz-Jimenez, L.A.; Xicotencatl-Ramirez, G.; Herrera-Navarro, A.M.; Jimenez-Hernandez, H. Algorithm Based on Morphological Operators for Shortness Path Planning. Algorithms 2024, 17, 184. [Google Scholar] [CrossRef]
- Shang, W.L.; Chen, Y.; Bi, H.; Zhang, H.; Ma, C.; Ochieng, W.Y. Statistical characteristics and community analysis of urban road networks. Complexity 2020, 2020, 6025821. [Google Scholar]
- Yahia, N.B.; Eljaoued, W.; Saoud, N.B.B.; Colomo-Palacios, R. Towards sustainable collaborative networks for smart cities co-governance. International journal of information management 2021, 56, 102037. [Google Scholar]
- Arosio, M.; Martina, M.L.; Figueiredo, R.; Creaco, E. GRAph-based Model (GRAM) to assessment of flood impacts in the complex metropolitan area of Mexico City. In Proceedings of the Geophysical Research Abstracts; 2019; Vol. 21. [Google Scholar]
- Gross, J.L.; Yellen, J.; Anderson, M. Graph theory and its applications; Chapman and Hall/CRC, 2018. [Google Scholar]
- Escudero-Santana, A.; Muñuzuri, J.; Lorenzo-Espejo, A.; Muñoz-Díaz, M.L. Improving e-commerce distribution through last-mile logistics with multiple possibilities of deliveries based on time and location. Journal of Theoretical and Applied Electronic Commerce Research 2022, 17, 507–521. [Google Scholar]
- Rios, B.H.O.; Xavier, E.C.; Miyazawa, F.K.; Amorim, P.; Curcio, E.; Santos, M.J. Recent dynamic vehicle routing problems: A survey. Computers & Industrial Engineering 2021, 160, 107604. [Google Scholar]
- Moutaoukil, A.; Neubert, G.; Derrouiche, R. Urban Freight Distribution: The impact of delivery time on sustainability. IFAC-PapersOnLine 2015, 48, 2368–2373. [Google Scholar]
- Alumur, S.; Kara, B.Y. Network hub location problems: The state of the art. European journal of operational research 2008, 190, 1–21. [Google Scholar]
- Golinska-Dawson, P.; Sethanan, K. Sustainable urban freight for energy-efficient smart cities—systematic literature review. Energies 2023, 16, 2617. [Google Scholar]
- Mazzarino, M.; Rubini, L. Smart urban planning: Evaluating urban logistics performance of innovative solutions and sustainable policies in the Venice Lagoon—The results of a case study. Sustainability 2019, 11, 4580. [Google Scholar] [CrossRef]
- Zhao, L.; Li, H.; Li, M.; Sun, Y.; Hu, Q.; Mao, S.; Li, J.; Xue, J. Location selection of intra-city distribution hubs in the metro-integrated logistics system. Tunnelling and Underground Space Technology 2018, 80, 246–256. [Google Scholar]
- Bard, J.F.; Nananukul, N. The integrated production–inventory–distribution–routing problem. Journal of Scheduling 2009, 12, 257–280. [Google Scholar]
- Lei, L.; Liu, S.; Ruszczynski, A.; Park, S. On the integrated production, inventory, and distribution routing problem. IIE Transactions 2006, 38, 955–970. [Google Scholar]
- Lotfi, M.; Osório, G.J.; Javadi, M.S.; Ashraf, A.; Zahran, M.; Samih, G.; Catalão, J.P. A Dijkstra-inspired graph algorithm for fully autonomous tasking in industrial applications. IEEE Transactions on Industry Applications 2021, 57, 5448–5460. [Google Scholar]
- Liu, X.; Zhang, D.; Zhang, T.; Cui, Y.; Chen, L.; Liu, S. Novel best path selection approach based on hybrid improved A* algorithm and reinforcement learning. Applied Intelligence 2021, 51, 9015–9029. [Google Scholar]
- Pham, Q.D.; Deville, Y.; Hentenryck, P.V. LS(Graph): A constraint-based local search for constraint optimization on trees and paths. Constraints 2012, 17, 357–408. [Google Scholar] [CrossRef]
- Dell’Amico, M.; Montemanni, R.; Novellani, S. Algorithms based on branch and bound for the flying sidekick traveling salesman problem. Omega 2021, 104, 102493. [Google Scholar]
- D’Angelo, G.; Palmieri, F. GGA: A modified genetic algorithm with gradient-based local search for solving constrained optimization problems. Information Sciences 2021, 547, 136–162. [Google Scholar]
- Marinakis, Y.; Migdalas, A.; Sifaleras, A. A hybrid particle swarm optimization–variable neighborhood search algorithm for constrained shortest path problems. European Journal of Operational Research 2017, 261, 819–834. [Google Scholar]
- Zhang, H.; Zhang, Q.; Ma, L.; Zhang, Z.; Liu, Y. A hybrid ant colony optimization algorithm for a multi-objective vehicle routing problem with flexible time windows. Information Sciences 2019, 490, 166–190. [Google Scholar]
- Wu, D.; Zhu, Z.; Hu, D.; et al. Optimizing Fresh Logistics Distribution Route Based on Improved Ant Colony Algorithm. Computers, Materials & Continua 2022, 73. [Google Scholar]
- Sarma, S.S.; Sinha, B.P.; Sinha, K. Efficient Traffic Routing in Smart Cities to Minimize Evacuation Time During Disasters. In Proceedings of the International Conference on Distributed Computing and Internet Technology. Springer; 2022; pp. 185–197. [Google Scholar]
- Google Earth. Google Earth 10.77.0.0 (2023), Mexico City, Mexico, 19°26’19"N 99°07’52"W, elevation 2240m. Online, 2023. Accessed: 25 March 2025.
- INEGI. Mexico - Estadística de Transporte Urbano de Pasajeros 2024. Online, 2024. Accessed: 28 March 2025.
- Secretaría de Movilidad de la CDMX. Secretaría de Movilidad de la CDMX. Secretaría de Movilidad de la CDMX. Online, 2025. Accessed: 27 March 2025.
Figure 4.
The delivery time is determined based on the different delivery centers: (a) Churubusco, (b) San Lázaro, (c) Santa Anita, (d) Terminal Norte, and (e) Zócalo.
Figure 4.
The delivery time is determined based on the different delivery centers: (a) Churubusco, (b) San Lázaro, (c) Santa Anita, (d) Terminal Norte, and (e) Zócalo.
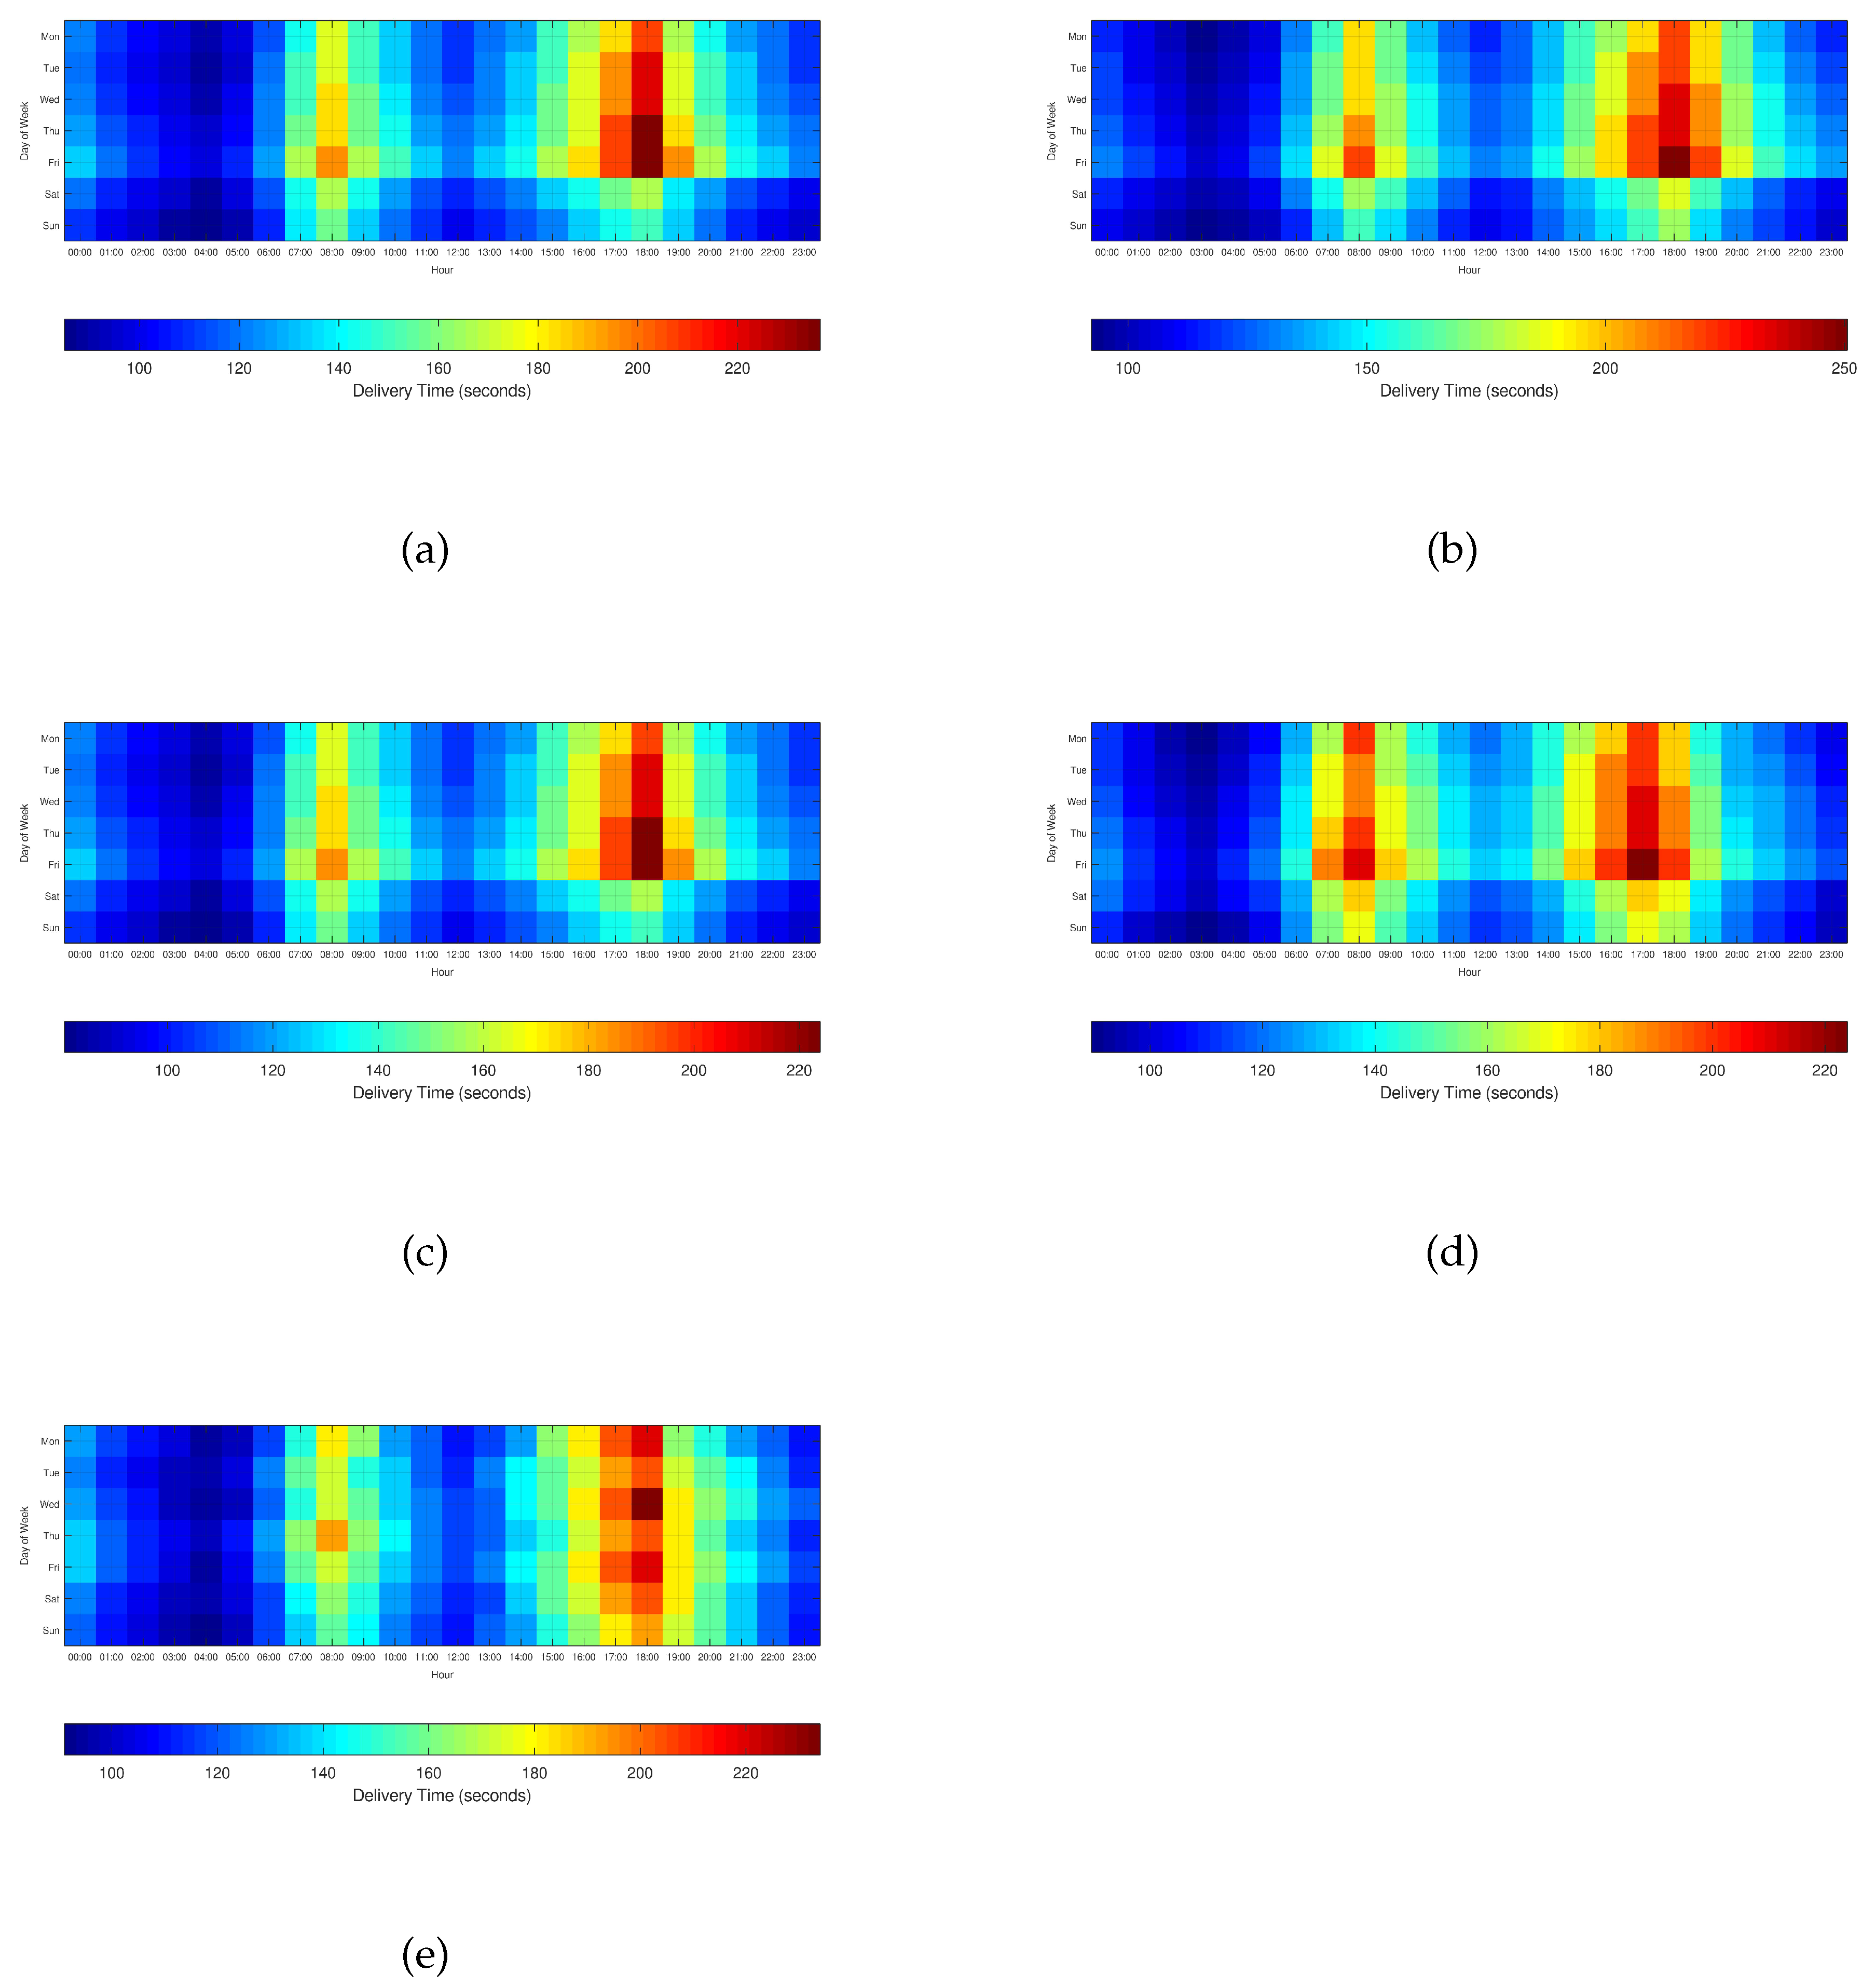
Table 1.
Approaches to computing the best path trajectory.
| Approach | Space | Remarks |
|---|---|---|
| Agile routing algorithms [10] | Graph | An adaptive algorithm is proposed that efficiently determines the optimal number and ideal location of micro-distribution centers, optimizing urban freight logistics using heuristic methods and machine learning. This approach considers minimizing the total distance, associated costs, and emissions throughout the distribution network. |
| Optimal traffic allocation approach [43] | Grid | The approach employs an optimal traffic allocation technique aimed at minimizing average travel time. This methodology has proven effective in practical contexts, particularly in traffic management during disaster evacuation scenarios where densely populated areas generate increased traffic congestion on major arteries, increasing travel time to safe areas. |
| Improved A* algorithm and Ant colony algorithm [42] | Graph | It proposes a logistics route optimization model based on the relationship between maximum customer satisfaction and minimum total distribution costs. The model considers two objective functions: the first focuses on minimizing costs associated with emissions, overloading, and transportation, while the second seeks to maximize customer satisfaction. To solve the problem, improved A* algorithms and ant colony-based optimization techniques are implemented. |
| Adaptive genetic algorithm [13] | Graph | An adaptive genetic algorithm is introduced that improves local optimization capabilities by exploring large neighborhoods. This algorithm is applied to an urban logistics distribution model with variable constraints and time windows. The objective function considers both total cost minimization and customer satisfaction maximization. |
| The tabu search algorithm [34] | Graph | An approach to supply chain optimization is presented, focusing on the coordination of production, inventory, and delivery planning, with the goal of minimizing logistics costs. The model considers a single production point, variable customer demand, and a fleet of delivery vehicles. To solve the problem efficiently, a reactive tabu search procedure is implemented. |
| Dynamic programming and Lagrangian heuristics algorithms [9] | Graph | This approach uses a new mathematical model that incorporates numerous complex constraints of classical routing problems. A dynamic programming solution is offered, dividing the general problem into subproblems, which are solved repeatedly and stored to avoid unnecessary recalculations. |
| Heuristic approach with Integer Programming [5] | Graph | This heuristic incorporates fairness and dispersion criteria as auxiliary metrics in solving the delivery problem. It also considers multiple variables associated with the loading, unloading, and transfer processes, among other factors that can influence the estimated delivery time. Given that this is a dynamic-stochastic problem, an integer programming-based formulation is proposed, allowing for an approximate static-deterministic solution. |
| Morphological Shortness Path Planning Approach [21] | Graph & Grid | An innovative approach is proposed that defines a general framework based on operators from morphological mathematics, from which two new operators are generated. These operators establish an incremental natural order relationship, determined by the optimal least-cost path between two points of interest, with a computational complexity comparable to that of state-of-the-art methods. |
Disclaimer/Publisher’s Note: The statements, opinions and data contained in all publications are solely those of the individual author(s) and contributor(s) and not of MDPI and/or the editor(s). MDPI and/or the editor(s) disclaim responsibility for any injury to people or property resulting from any ideas, methods, instructions or products referred to in the content. |
© 2025 by the authors. Licensee MDPI, Basel, Switzerland. This article is an open access article distributed under the terms and conditions of the Creative Commons Attribution (CC BY) license (http://creativecommons.org/licenses/by/4.0/).
Copyright: This open access article is published under a Creative Commons CC BY 4.0 license, which permit the free download, distribution, and reuse, provided that the author and preprint are cited in any reuse.


