Submitted:
01 July 2025
Posted:
02 July 2025
You are already at the latest version
Abstract
Disparities in primary care access among Medicaid enrollees may be driven by differences in provider acceptance of Medicaid, yet the extent to which primary care provider (PCP) panels reflect the racial and ethnic diversity of local Medicaid populations is unknown. Objectives: To quantify the alignment between the racial/ethnic composition of PCP Medicaid panels and the underlying Medicaid population in their service areas. Methods: We conducted a cross-sectional analysis of 2019 Transformed Medicaid Statistical Information System Analytic Files from 44 states focusing on non-Hispanic White (NHW), non-Hispanic Black (NHB), and Hispanic enrollees. We calculated a Panel Representation Ratio (PRR) for each PCP (physicians, nurse practitioners, and physician associates) as the proportion of a racial/ethnic group in their panel divided by that group’s proportion in the county Medicaid population. PRRs >1 indicate overrepresentation; PRRs <1, underrepresentation. Analyses were stratified by provider specialty, rurality, and Health Professional Shortage Area (HPSA) status. Results: The study sample included 372,320 PCPs from following professions: nurse practitioners (NP), and physician associates (PA), along with physicians from the following specialties: family physicians (FP), internal medicine physicians (IM), obstetrician gynecologists (ObGyn), pediatricians (Peds). In the full sample, PRR was 1.28 for NHW enrollees, but less than one for NHB (0.98) and Hispanic (0.82) enrollees. Across provider specialties and professions, NHW enrollees were overrepresented in both rural and urban areas. In rural areas, NHB enrollees were overrepresented, but Hispanic enrollees remained underrepresented regardless of Health Professional Shortage Area (HPSA) status. In urban areas, both NHB and Hispanic enrollees were underrepresented in provider panels. Conclusions: Medicaid PCP panels do not reflect the racial/ethnic diversity of local Medicaid populations, particularly for NHB and Hispanic enrollees in urban settings. Efforts to improve equitable access to primary care must address these disparities in provider panel composition.
Keywords:
health workforce
; medicaid
; underserved communities
; access to care
; health policy
1. Introduction
Access to primary care is a cornerstone of health equity, yet Medicaid enrollees continue to face significant barriers in obtaining timely and consistent care. Numerous studies have shown that Medicaid enrollees experience greater difficulty scheduling appointments and report higher levels of unmet healthcare needs compared to those with private insurance [1,2,3]. These challenges are even more pronounced among racial and ethnic minority groups within the Medicaid population, who often encounter compounded barriers due to systemic inequities [4,5]. Addressing these disparities requires not only expanding insurance coverage but also ensuring that primary care providers (PCPs) are both available and willing to serve Medicaid enrollees [6,7].
While financial concerns such as low reimbursement rates and administrative complexity are commonly cited reasons for limited provider participation in Medicaid [8,9,10,11,12], there is growing recognition that non-financial factors may also influence provider behavior. For example, studies show that the racial and ethnic composition of a local Medicaid population may affect whether providers choose to participate in the program [13,14]. This raises important questions about how structural factors may shape access to care for Medicaid enrollees from different racial and ethnic groups.
Despite this body of evidence, relatively little is known about how the racial and ethnic makeup of Medicaid enrollees is reflected in the patient panels (referred to as Medicaid panels hereon) of PCPs. Understanding this variation is essential, as it may reveal patterns of concentration or dispersion that are not immediately visible through traditional measures of access. To explore this issue, we introduce a new metric called the panel representation ratio, or PRR. This measure compares the racial and ethnic composition of a provider’s Medicaid panel to that of the surrounding Medicaid population at the county level. A PRR of one indicates proportional representation; if it is more than one, that may indicate overrepresentation, and if it is below one, that indicates underrepresentation.
Using multi-state Medicaid claims data, we estimated PRRs for a large sample of PCPs. We examined how PRRs vary by provider specialty, geographic location, Health Professional Shortage Area (HPSA) designation, and practice setting. Special attention was given to Community Health Centers (CHCs), which play a critical role in serving Medicaid populations. Our goal was to identify patterns that can inform more equitable workforce policies and improve access to care for all Medicaid enrollees.
2. Materials and Methods
We used multi-state Medicaid claims data from the 2019 Transformed Medicaid Statistical Information System (T-MSIS) Analytic Files (TAF) in a cross-sectional design to determine PCPs’ Medicaid panels. PCPs included nurse practitioners (NPs), physician associates (PAs), and physicians practicing in family physician (FP), general internal medicine (IM), obstetrics and gynecology (ObGyn), and pediatrics specialties. The National Plan and Provider Enumeration System (NPPES) was used as the primary source for clinician location and specialty classification [15].
We obtained the race and ethnicity of enrollees in PCPs’ Medicaid panels and categorized them as: non-Hispanic White (NHW), non-Hispanic Black (NHB), non-Hispanic Asian (NH Asian), non-Hispanic American Indian/Alaska Native (NH AIAN), non-Hispanic Hawaiian/Pacific Islander (NH HPI), and Hispanic. Next, we used the demographic and eligibility (DE) file from TAF to determine the racial and ethnic composition of the Medicaid population in each county. For each PCP, we then calculated a panel representation ratio (PRR) for each racial and ethnic group. We calculated this by dividing the percentage of a specific group in the provider’s Medicaid panel by that group’s percentage in the county’s overall Medicaid enrollee population. A PRR of one indicates that the group is proportionally represented in the provider’s panel, with values more or less than one suggesting overrepresentation or underrepresentation, respectively. We recognize that the county of a PCP’s practice location may not always serve as the most accurate catchment area for defining the community served by that PCP, as patients may cross county lines or be drawn from broader geographic regions [16]. However, developing refined catchment area measures was beyond the scope of this study. Therefore, we used the Medicaid population of a PCP’s county as a proxy for the community they served.
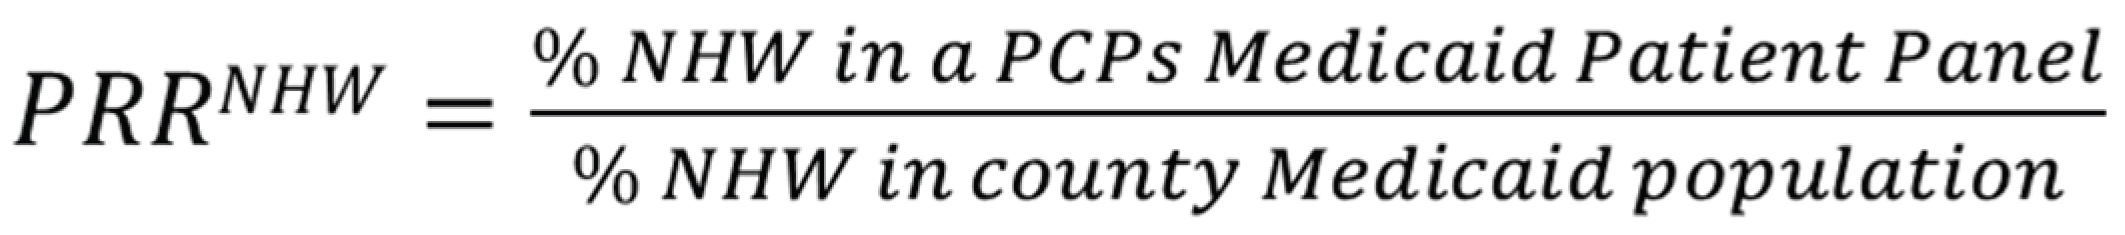
The calculation of PRR for NHW enrollees can be represented as:
Figure 1.
An example of PRRNHW calculation for PCP Medicaid panels.
While data were available for six racial and ethnic groups, our primary analyses focused on NHW, NHB and Hispanic enrollees. These groups represented the largest segments of the Medicaid population and allowed for more stable estimates across geographic areas. To avoid skewing our results, we excluded PCPs with extremely large (more than 5,000 patients) or very small (fewer than 10 patients) Medicaid enrollee panels. We also excluded PCPs whose panels had more than 50% of enrollees with missing race or ethnicity data. Additionally, providers practicing in states with poor-quality T-MSIS Analytic Files (TAF) data were excluded. As described in prior workforce studies using TAF, data quality was assessed by examining the proportion of claims from each state that lacked provider identifiers [17]. Based on this criterion, six states (Delaware, Florida, Maine, Minnesota, New Hampshire, and Rhode Island) were excluded. The final analytic sample included data from the remaining 44 states.
We examined panel diversity and PRR across four key dimensions: (1) provider profession/specialty, (2) rurality of the county (classified using the USDA’s Rural-Urban Continuum Codes (RUCC)), (3) geographic Health Professional Shortage Area (HPSA) designation, and (4) practice setting, specifically whether the provider worked at a CHC. PCPs in rural areas may exhibit distinct practice patterns not typical in densely populated and more diverse urban areas. HPSA designation is used to identify areas with shortages of PCPs and to allocate resources such as loan repayment programs and workforce incentives. Including HPSA status in the analysis allows us to assess whether these designations align with equitable representation of racial and ethnic groups in provider panels. Finally, CHCs are the main safety net providers for Medicaid populations and are likely to have unique practice patterns. We identified all providers associated with CHCs using methods described elsewhere [18].
To assess whether provider Medicaid panels in each subgroup (e.g., HPSA vs. non-HPSA, rural vs. urban, or by specialty) differed meaningfully from the overall sample, we conducted a series of t-tests. For each variable of interest, we compared the mean within each subgroup to the overall sample mean. This approach allowed us to identify which providers had Medicaid panels that were significantly more or less representative of specific racial and ethnic populations compared to the full sample. All analyses were conducted using Stata 18.
3. Results
3.1. Sample Description
Among the 372,320 PCPs in the sample, 22.1% practiced in Health Professional Shortage Areas (HPSAs), and 7.0% practiced in rural HPSAs (Table 1). Rural providers overall accounted for 7.1% of the total sample. Compared to those not in HPSAs, providers in HPSAs served panels with a higher proportion of NHW enrollees (67.7% vs. 50.7%) and a lower proportion of NHB (17.6% vs. 21.5%) and Hispanic enrollees (10.1% vs. 20.2%). Rural HPSA panels were the least diverse, with 78.2% NHW enrollees and only 8.2% NHB enrollees. PRRs showed consistent overrepresentation of NHW enrollees (range: 1.04 to 1.32) and underrepresentation of Hispanic enrollees (range: 0.80 to 1.03) across all groups. Comparisons of panel sizes revealed interesting patterns – the average panel size was largest among rural HPSA providers (339) and smallest among urban non-HPSA providers (291).
3.1. Specialty Comparison
Across provider types, pediatricians had the largest and the most diverse panels, with the lowest proportions of NHW enrollees (43.4%) and the highest proportions of Hispanic enrollees (26.8%) (Table 2). ObGyns followed a similar pattern, with 46.4% NHW and 21.2% Hispanic enrollees in their panels. In contrast, other providers had higher shares of NHW enrollees (around 58%). PRRs showed consistent overrepresentation of NHW enrollees across all provider types (range: 1.12 to 1.39), while Hispanic enrollees were generally underrepresented, except in pediatrics (PRR: 1.17).
3.2. Comparison of CHC and Other PCPs
Patterns of PRR varied notably between those practicing at CHCs and other settings (Figure 2). CHC providers consistently served more racially and ethnically representative panels, with PRRs for NHB and Hispanic enrollees exceeding 1.0 across all geographic and HPSA categories, reaching as high as 1.64 for NHB and 1.37 for Hispanic enrollees in non-HPSA rural areas. In contrast, other PCPs showed underrepresentation of Hispanic enrollees in all settings, with PRRs ranging from 0.77 to 0.98, and mixed representation for NHB enrollees, with overrepresentation in rural areas but underrepresentation in urban HPSAs. NHW enrollees were generally overrepresented among other PCPs, especially in urban non-HPSAs where the PRR reached 1.36, while CHC providers showed more balanced NHW representation with PRRs near or less than 1.0. These findings highlight CHCs’ stronger alignment with the racial and ethnic composition of their communities, particularly in underserved areas.
4. Discussion
To our knowledge, this is the first study that estimates the racial and ethnic diversity of PCPs’ Medicaid enrollee panels using multi-state claims data. We find that ObGyns and pediatricians had higher proportions of Hispanic enrollees in their panels. This is consistent with both a relatively higher proportion of Hispanic births funded by Medicaid compared to other subgroups, and a higher proportion of Hispanic children among those covered by Medicaid.
Using the PRR, our findings show that enrollee panels are racially and ethnically more diverse in urban non-HPSA areas. These findings remain consistent regardless of PCP specialty. However, despite the higher proportion of racial and ethnic minorities in enrollee panels of urban PCPs, this did not translate into higher representation relative to their share of the county’s Medicaid population. One possible explanation is that NHB and Hispanic Medicaid enrollees may be less likely to see PCPs than other types of providers, such as those in emergency room settings. Literature suggests a preference for non-primary care sites as a usual source of care, particularly among NHB individuals from low-income, urban, and racially integrated areas, which has been attributed to medical mistrust [19]. Additionally, underrepresentation in enrollee panels may reflect barriers to care faced by minoritized enrollees. Racial and ethnic disparities in determinants of access, such as lack of transportation, long waiting times, and inconvenient office hours, have worsened over time [20]. These factors, combined with difficulties in obtaining appointments due to low Medicaid acceptance, can further impede access [8,21,22,23,24]. Regardless of the cause, limited access to or use of primary care by marginalized communities is concerning, as it can lead to poorer health outcomes, preventable hospitalizations, and higher costs of care [19].
It is also noteworthy that we find a higher representation of NHB and Hispanic Medicaid enrollees in the panels of PCPs practicing at CHCs, regardless of the CHCs’ rurality or HPSA designation. One plausible explanation is that Medicaid enrollees may prefer seeking care at CHCs. Alternatively, this pattern could reflect greater conscious or unconscious bias among non-CHC PCPs, or a shortage of bilingual providers in those settings. Regardless of the reason, the findings suggest that non-CHC PCPs and settings could improve their inclusivity, particularly with respect to Hispanic enrollees. These findings add to a growing body of evidence on the pivotal role of CHCs in providing primary care to racial and ethnic communities [25,26], and supports arguments that greater investment in CHCs could improve access to care for low-income and minority individuals [27].
Our study has several limitations. First, TAF data are reported at the state level, and some states have insufficient data quality on enrollee race and ethnicity and provider characteristics. Second, we relied on a single year of data to calculate panel diversity, though we recognize that panel composition may change over time. Third, we were only able to identify PCPs associated with CHCs when services were billed under an individual NPI. Additionally, we acknowledge that Medicaid panels are shaped not only by individual providers but also by the practices or organizations they work for. We did not control for practice-level factors beyond PCPs’ association with CHCs. Finally, this is a descriptive analysis of a novel method to assess the representation of Medicaid enrollee groups in provider panels. Future studies should examine whether this method of examining representation impacts access and health outcomes.
5. Conclusions
Inequitable workforce distribution remains a persistent health policy challenge. Deep-rooted discriminatory policies in the United States have exacerbated these distributional inequities, particularly in racially segregated areas [28]. Policies aimed at universal access have traditionally focused on redistributing the workforce by incentivizing PCPs to practice in designated shortage areas [29]. However, our findings suggest that marginalized communities in non-shortage urban areas may face even greater barriers than those in rural or shortage areas, and that CHCs play a critical role in serving diverse populations. To improve both the equitable distribution of providers and the PRR of enrollee panels, workforce allocation policies may need to move beyond current shortage designations and incorporate additional equity-focused metrics. For example, incorporating PRR data into shortage designations could help target resources more effectively.
Recent policy provisions which reduce Medicaid funding can potentially reduce coverage and disproportionately affect low-income and minority populations, straining access to primary care [30]. As policymakers debate the future of Medicaid, tools like the PRR can help ensure that equity considerations inform workforce and access planning. The recently published final rule on Medicaid managed care establishes new standards for access, transparency, and quality, including benchmarks for wait times and enrollee experience surveys [31]. Evaluations of these policies and regulations could include active monitoring of the racial and ethnic representation in PCPs’ Medicaid panels using the PRR methodology.
Author Contributions
M.B.: conceptualization, formal analysis, writing—original draft, writing—review. A.V.: conceptualization, methodology, writing—review and editing, validation. Q.L.: resources, formal analysis, data curation, investigation. All authors have read and agreed to the published version of the manuscript.
Funding
This project was supported by the Bureau of Health Workforce (BHW), National Center for Health Workforce Analysis (NCHWA), Health Resources and Services Administration (HRSA) of the U.S. Department of Health and Human Services (HHS) as part of an award totaling $450,000, with zero percent financed with non-governmental sources. The contents are those of the author [s] and do not necessarily represent the official views of, nor an endorsement by HRSA, HHS, or the U.S. Government funding.
Institutional Review Board Statement
This study was approved by The George Washington University institutional review board in July 2020 (NCR202330).
Informed Consent Statement
Because this is a study of secondary data, it did not need informed consent. We did not collect data from participants but used previously collected data from medical claims and other sources.
Data Availability Statement
The data used in this study was obtained by authors from the Centers for Medicare and Medicaid Services (CMS) the data use agreement signed by the authors disallows them from sharing it.
Conflicts of Interest
The authors declare no conflicts of interest. The funders had no role in the design of the study; in the collection, analyses, or interpretation of data; in the writing of the manuscript; or in the decision to publish the results.
Abbreviations
The following abbreviations are used in this manuscript:
| TAF | Transformed Medicaid Statistical Information System Analytic Files (TAF) |
| NPPES | National Plan and Provider Enumeration System |
| NPI | National Provider Identifier |
| NP | Nurse Practitioner |
| FP | Family Physician |
| IM | Internal Medicine |
| ObGyn | Obstetrics/Gynecology |
| PA | Physician Associates |
References
- Hsiang, W.R.; Lukasiewicz, A.; Gentry, M.; Kim, C.Y.; Leslie, M.P.; Pelker, R.; Forman, H.P.; Wiznia, D.H. Medicaid Patients Have Greater Difficulty Scheduling Health Care Appointments Compared With Private Insurance Patients: A Meta-Analysis. Inquiry 2019, 56, 0046958019838118. [Google Scholar] [CrossRef] [PubMed]
- Tipirneni, R.; Kieffer, E.C.; Ayanian, J.Z.; Campbell, E.G.; Salman, C.; Clark, S.J.; Chang, T.; Haggins, A.N.; Solway, E.; Kirch, M.A.; et al. Factors Influencing Primary Care Providers’ Decisions to Accept New Medicaid Patients under Michigan’s Medicaid Expansion. Am J Manag Care 2019, 25, 120–127. [Google Scholar] [PubMed]
- Bond, A.; Pajerowski, W.; Polsky, D.; Richards, M.R. Market Environment and Medicaid Acceptance: What Influences the Access Gap? Health Econ 2017, 26, 1759–1766. [Google Scholar] [CrossRef] [PubMed]
- Call, K.T.; McAlpine, D.D.; Garcia, C.M.; Shippee, N.; Beebe, T.; Adeniyi, T.C.; Shippee, T. Barriers to Care in an Ethnically Diverse Publicly Insured Population: Is Health Care Reform Enough? Med Care 2014, 52, 720–727. [Google Scholar] [CrossRef]
- Brown, E.J.; Polsky, D.; Barbu, C.M.; Seymour, J.W.; Grande, D. Racial Disparities In Geographic Access To Primary Care In Philadelphia. Health Aff (Millwood) 2016, 35, 1374–1381. [Google Scholar] [CrossRef]
- Kullgren, J.T.; McLaughlin, C.G.; Mitra, N.; Armstrong, K. Nonfinancial Barriers and Access to Care for U.S. Adults. Health Serv Res 2012, 47, 462–485. [Google Scholar] [CrossRef]
- Kullgren, J.T.; McLaughlin, C.G. Beyond Affordability: The Impact of Nonfinancial Barriers on Access for Uninsured Adults in Three Diverse Communities. J Community Health 2010, 35, 240–248. [Google Scholar] [CrossRef]
- Decker, S.L. Two-Thirds of Primary Care Physicians Accepted New Medicaid Patients in 2011-12: A Baseline to Measure Future Acceptance Rates. Health Aff (Millwood) 2013, 32, 1183–1187. [Google Scholar] [CrossRef]
- Decker, S.L. Acceptance of New Medicaid Patients by Primary Care Physicians and Experiences with Physician Availability among Children on Medicaid or the Children’s Health Insurance Program. Health Serv Res 2015, 50, 1508–1527. [Google Scholar] [CrossRef]
- Hing, E.; Decker, S.L.; Jamoom, E. Acceptance of New Patients With Public and Private Insurance by Office-Based Physicians: United States, 2013 Key Findings Data from the 2013 National Electronic Health Records Survey. 2013.
- Cunningham, P.J.; Nichols, L.M. The Effects of Medicaid Reimbursement on the Access to Care of Medicaid Enrollees: A Community Perspective. Med Care Res Rev 2005, 62, 676–696. [Google Scholar] [CrossRef]
- Cunningham, P.J.; O’Malley, A.S. Do Reimbursement Delays Discourage Medicaid Participation By Physicians? 2008, 28. [CrossRef]
- Greene, J.; Blustein, J.; Weitzman, B.C. Race, Segregation, and Physicians’ Participation in Medicaid. Milbank Q 2006, 84, 239. [Google Scholar] [CrossRef] [PubMed]
- Daly, M.R.; Mellor, J.M. Racial and Ethnic Differences in Medicaid Acceptance by Primary Care Physicians: A Geospatial Analysis. Med Care Res Rev 2020, 77, 85–95. [Google Scholar] [CrossRef] [PubMed]
- NPPES. Available online: https://nppes.cms.hhs.gov/#/ (accessed on 12 October 2024).
- McGrail, M.R.; Humphreys, J.S. Measuring Spatial Accessibility to Primary Care in Rural Areas: Improving the Effectiveness of the Two-Step Floating Catchment Area Method. Applied Geography 2009, 29, 533–541. [Google Scholar] [CrossRef]
- Luo, Q.; Bodas, M.; Vichare, A.; Montellano, J.; Jennings, N.; Erikson, C.; Chen, C. Primary Care Provider Medicaid Participation Across the United States, 2016. J Health Care Poor Underserved 2023, 34, 703–718. [Google Scholar] [CrossRef]
- Luo, Q.; Park, Y.H.; Dor, A.; Moghtaderi, A. Trends and Impact of Vertical Integration of Chcs on Workforce 2024.
- Arnett, M.J.; Thorpe, R.J.; Gaskin, D.J.; Bowie, J. V.; LaVeist, T.A. Race, Medical Mistrust, and Segregation in Primary Care as Usual Source of Care: Findings from the Exploring Health Disparities in Integrated Communities Study. J Urban Health 2016, 93, 456–467. [Google Scholar] [CrossRef]
- Delamater, P.L.; Messina, J.P.; Shortridge, A.M.; Grady, S.C. Measuring Geographic Access to Health Care: Raster and Network-Based Methods. Int J Health Geogr 2012, 11, 1–18. [Google Scholar] [CrossRef]
- Luo, Q.; Bodas, M.; Vichare, A.; Montellano, J.; Jennings, N.; Erikson, C.; Chen, C. Primary Care Provider Medicaid Participation Across the United States, 2016. J Health Care Poor Underserved 2023, 34, 703–718. [Google Scholar] [CrossRef]
- Spivack, S.B.; Murray, G.F.; Rodriguez, H.P.; Lewis, V.A. Avoiding Medicaid: Characteristics Of Primary Care Practices With No Medicaid Revenue. Health Aff (Millwood) 2021, 40, 98–104. [Google Scholar] [CrossRef]
- Holgash, K.; Heberlein, M. Medicaid and CHIP Payment and Access Commission Physician Acceptance of New Medicaid Patients. 2019.
- Caraballo, C.; Ndumele, C.D.; Roy, B.; Lu, Y.; Riley, C.; Herrin, J.; Krumholz, H.M. Trends in Racial and Ethnic Disparities in Barriers to Timely Medical Care Among Adults in the US, 1999 to 2018. JAMA Health Forum 2022, 3, E223856. [Google Scholar] [CrossRef]
- Seymour, J.W.; Polsky, D.E.; Brown, E.J.; Barbu, C.M.; Grande, D. The Role of Community Health Centers in Reducing Racial Disparities in Spatial Access to Primary Care. J Prim Care Community Health 2017, 8, 147–152. [Google Scholar] [CrossRef]
- Adashi, E.Y.; Geiger, H.J.; Fine, M.D. Health Care Reform and Primary Care--the Growing Importance of the Community Health Center. N Engl J Med 2010, 362, 2047–2050. [Google Scholar] [CrossRef] [PubMed]
- Saloner, B.; Wilk, A.S.; Levin, J. Community Health Centers and Access to Care Among Underserved Populations: A Synthesis Review. Med Care Res Rev 2020, 77, 3–18. [Google Scholar] [CrossRef] [PubMed]
- Gaskin, D.J.; Dinwiddie, G.Y.; Chan, K.S.; McCleary, R.R. Residential Segregation and the Availability of Primary Care Physicians. Health Serv Res 2012, 47, 2353–2376. [Google Scholar] [CrossRef] [PubMed]
- Leveraging Career Pathway Programs: State Strategies to Combat Health Care Workforce Shortages. Available online: https://www.ncsl.org/health/leveraging-career-pathway-programs-state-strategies-to-combat-health-care-workforce-shortages (accessed on 30 June 2025).
- Keith, K. Senate GOP Makes Last-Minute Health Care Changes To Budget Bill Ahead Of Scheduled Motion To Proceed. Health Affairs Forefront 2025. [CrossRef]
- Rosenbaum, S.; Casoni, M. The Medicaid Managed Care Rule Is A Blockbuster. Health Affairs Forefront. [CrossRef]
Figure 2.
Comparing the PRR of PCPs associated with CHCs to other PCPs, TAF 2019.
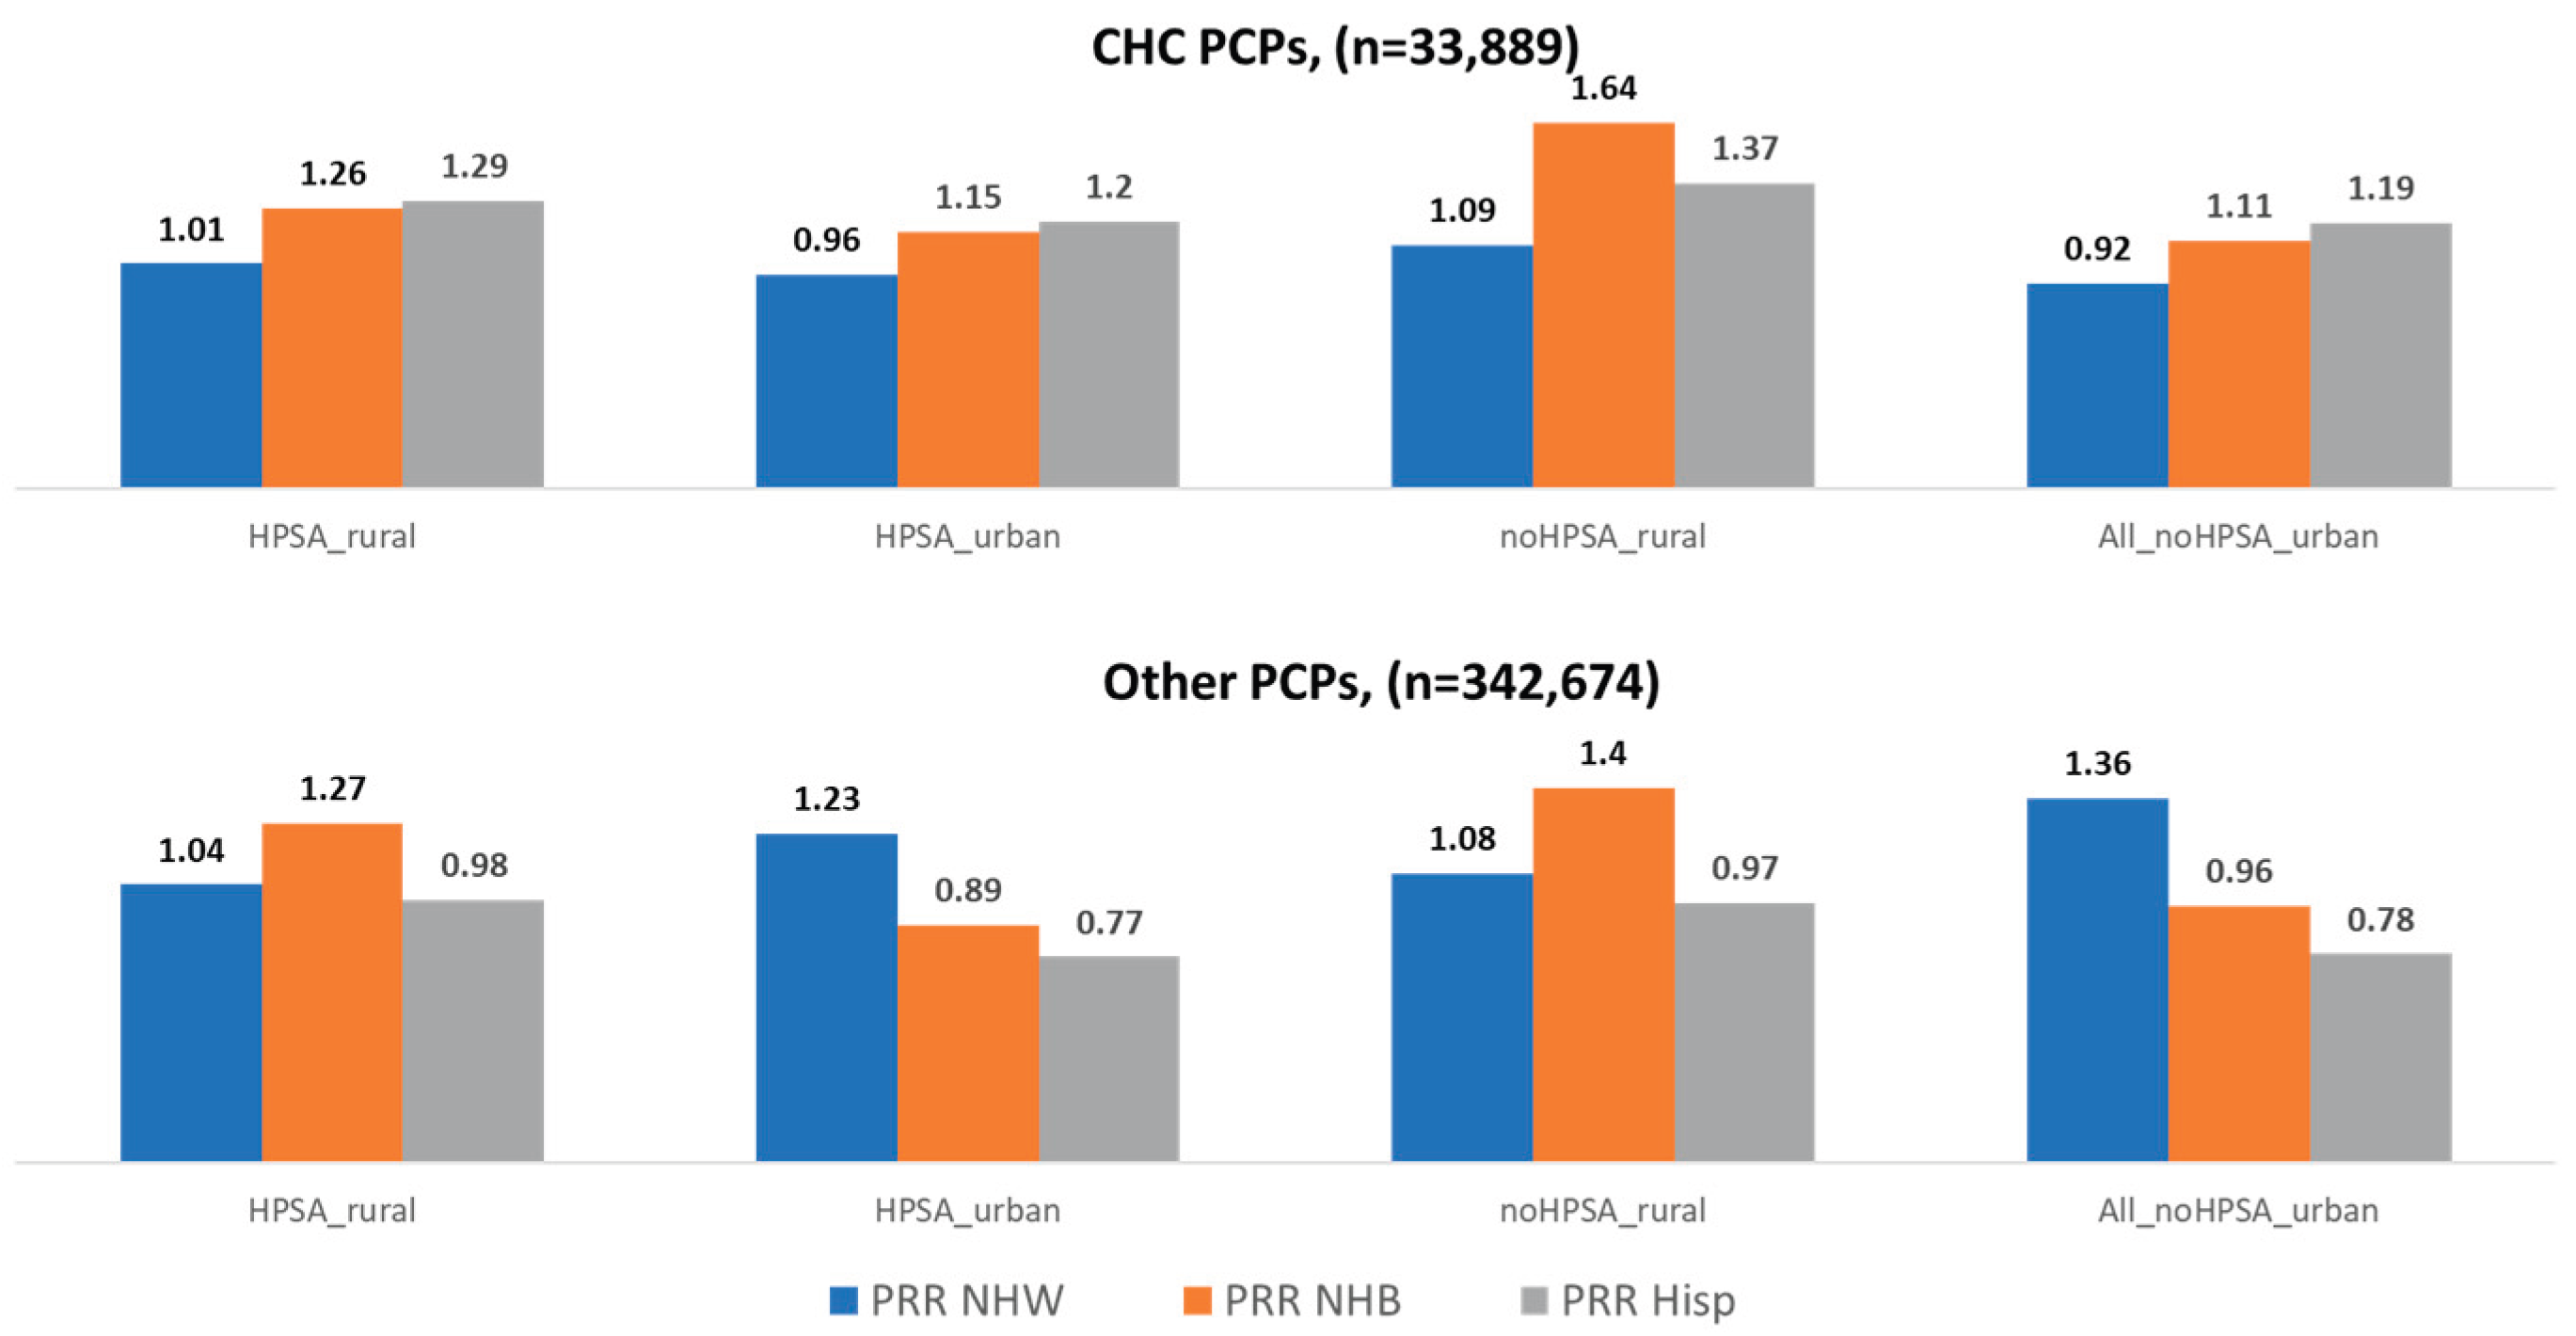

Table 1.
Characteristics of Medicaid Panels of Primary Care Providers in the Sample.
| Full Sample | Not Practicing in HPSAs | Practicing in HPSAs | HPSA Rural | HPSA Urban | Non-HPSA Rural | Non-HPSA Urban | |
|---|---|---|---|---|---|---|---|
| PCPs (N) | 372,320 | 289,884 | 82,436 | 13,035 | 69,401 | 12,998 | 276,886 |
| Panel characteristics* | |||||||
| % NH White enrollees | 54.5 | 50.7** | 67.7** | 78.2** | 65.8** | 69.7** | 49.8** |
| % NH Black enrollees | 20.6 | 21.5** | 17.6** | 8.2** | 19.4** | 11.6** | 21.9** |
| % NH Asian enrollees | 4.2 | 4.9** | 1.6** | 0.4** | 1.9** | 0.5** | 5.2** |
| % NH AIAN enrollees | 1.8 | 1.7** | 2.1** | 4.3** | 1.6** | 8.0** | 1.4** |
| % NH HPI enrollees | 0.6 | 0.7** | 0.2** | 0.1** | 0.3** | 0.2** | 0.7** |
| % Hispanic enrollees | 17.9 | 20.2** | 10.1** | 7.9** | 10.5** | 9.1** | 0.4** |
| % Enrollees missing race/ethnicity data | 11.9 | 11.2** | 14.4** | 9.2** | 15.3** | 9.0** | 20.7** |
| Panel Representative Ratios (PRR) | |||||||
| PRR: NH White | 1.28 | 1.31** | 1.18** | 1.04** | 1.21** | 1.08** | 1.32** |
| PRR: NH Black | 0.98 | 0.99 | 0.97 | 1.28** | 0.91** | 1.44** | 0.97** |
| PRR: Hispanic | 0.82 | 0.82 | 0.84 | 1.02** | 0.80** | 1.03** | 0.81** |
| Average panel size | 298 | 292 | 318 | 339 | 314 | 315 | 291 |
*p < 0.05, **p < 0.01, $ NHW = non-Hispanic; AIAN = American Indian/Alaska Native; HPI = Hawaiian/Pacific Islander.
Table 2.
Comparison of Medicaid Panels by PCP Specialty and Profession.
| NPs | PAs | FM | IM | ObGyn | Pediatricians | |
|---|---|---|---|---|---|---|
| PCPs (N) | 125,221 | 56,647 | 74,864 | 51,251 | 27,088 | 37,249 |
| Panel characteristics* | ||||||
| % NH White enrollees | 57.5** | 58.0** | 58.0** | 50.2** | 46.4** | 43.4** |
| % NH Black enrollees | 20.5 | 17.6** | 17.3** | 25.3** | 25.5** | 22.2** |
| % NH Asian enrollees | 3.0** | 3.5** | 4.3* | 7.2** | 4.4** | 4.9** |
| % NH AIAN enrollees | 1.9** | 2.1** | 2.1** | 1.2** | 1.5** | 1.3** |
| % NH HPI enrollees | 0.5** | 0.4** | 0.6** | 0.6 | 0.6** | 0.8** |
| % Hispanic enrollees | 16.1** | 17.8 | 17.3** | 15.4** | 21.1** | 26.8** |
| % Enrollees missing race/ethnicity data | 11.4** | 11.1** | 10.9** | 12.2** | 11.0** | 16.6** |
| Panel Representative Ratios (PRR) | ||||||
| PRR: NH White | 1.28 | 1.32** | 1.31** | 1.39** | 1.18** | 1.12** |
| PRR: NH Black | 0.96** | 0.94** | 0.98 | 1.04** | 1.12** | 0.97 |
| PRR: Hispanic | 0.81** | 0.80** | 0.77** | 0.66** | 0.92** | 1.17** |
| Average panel size | 256 | 300 | 205 | 259 | 292 | 626 |
*p < 0.05, **p < 0.01, $ NHW = non-Hispanic; AIAN = American Indian/Alaska Native; HPI = Hawaiian/Pacific Islander.
Disclaimer/Publisher’s Note: The statements, opinions and data contained in all publications are solely those of the individual author(s) and contributor(s) and not of MDPI and/or the editor(s). MDPI and/or the editor(s) disclaim responsibility for any injury to people or property resulting from any ideas, methods, instructions or products referred to in the content. |
© 2025 by the authors. Licensee MDPI, Basel, Switzerland. This article is an open access article distributed under the terms and conditions of the Creative Commons Attribution (CC BY) license (http://creativecommons.org/licenses/by/4.0/).
Copyright: This open access article is published under a Creative Commons CC BY 4.0 license, which permit the free download, distribution, and reuse, provided that the author and preprint are cited in any reuse.


