
Submitted:
26 June 2025
Posted:
27 June 2025
You are already at the latest version
Abstract
Medical image segmentation plays a crucial role in diagnosing and modeling anatomical and functional structures of organs. Region-based segmentation methods, especially clustering techniques like K-Means, Fuzzy C-Means, Expectation Maximization, and Histogram Quantization, are widely used due to their adaptability across various imaging modalities. However, segmentation outcomes vary depending on the clustering method and parameters used, making reproducibility a challenge. To address this, the MIS-U Imaging and Clustering Suite is introduced—a versatile software tool for visualizing, clustering, segmenting, and exporting medical imaging data, with a particular emphasis on diffusion tensor imaging (DTI). The suite includes dedicated utilities for image clustering, anatomical segmentation using binary layers, and exporting data for simulation and analysis. By standardizing the preprocessing and clustering workflow and incorporating advanced concepts like Unistable and Unistable 3D representations, MIS-U provides a consistent, flexible environment for medical image segmentation and modeling tasks.
Keywords:
MIS-U
; clustering
; segmentation
; unistable
; unistable 3d
; medical images
1. Introduction
The diagnosis and modeling of the anatomy and function of various organs are significantly impacted by the segmentation of medical images. Either region-based, boundary-based, or hybrid approaches can be used to complete the segmentation. While some studies use hybrid or boundary-based approaches, particularly the level-set approach, region-based approaches are significantly more common in the segmentation of medical pictures [1, 2]. Clustering techniques like Histogram Quantization [3], K-Means [4], Fuzzy C-Means (FCM) [5], Expectation Maximization (EM) [6], or basic manual thresholding are the foundation of region-based methods. The picture segmentation process makes extensive use of Markov Random Fields (MRF) and its models, such as Iterated Conditional Modes (ICM) [1, 2, 7]. One noteworthy aspect of the segmentation problem is that the results of the segmentation process will vary depending on the number of clusters and the clustering technique utilized; therefore, there is no one-size-fits-all solution [1, 2, 7]. By creating universal and stable images [8, 9] from the original photos, two techniques have been devised to lessen the impact of that issue. As a consequence, the results will be almost same whether using different clustering algorithms and/or different numbers of clusters. Details of a novel tool that generates personalized segmentation of a medical imaging scan are presented in this publication.
2. Software Description
The MIS-U Imaging and Clustering Suite [10] is a comprehensive software application designed for the visualization, clustering, segmentation, and export of medical imaging data, particularly focusing on diffusion tensor imaging (DTI) [11] and other scalar-valued modalities such as MRI, X-Ray, CT, FLAIR, PET and MRA [12]. The software offers a user-friendly interface that begins with the main form, the Image Clustering Utility, where users can load either a MIS-U file or a series of standard image files (BMP, PNG, and JPG). When a MIS-U file is loaded, the software automatically detects the modality and provides appropriate scalar indices: DTI scans grant access to multiple scalar indices (e.g., FA, MD) [8, 9, 13, 14] and advanced constructs like Unistable [8] and Unistable 3D [9], while other modalities expose only magnitude images and basic Unistable features.
Once an image is selected, users can apply various clustering algorithms, such as thresholding, Histogram Quantization [3], K-Means [4], Fuzzy C-Means (FCM) [5], expectation maximization (EM) [6], or iterated conditional mode (ICM) [7], to cluster the image into distinct tissue classes or structural regions. Each clustered result can be visualized alongside the original image, with clear labeling and cluster distribution statistics.
Users can export these results as histograms in CSV format, segmentation masks in binary (.BIN) format, or save image slices as high-resolution PNGs in 1x1, 2x2, 3x3, or 4x4 grid layouts. The Image Segmentation Utility builds upon this by allowing users to combine up to three binary segmentation layers (e.g., WM, GM, CSF) to construct complex anatomical models. Through a layer-based interface, users can dynamically include or exclude clusters from each layer, enabling precise control over tissue representation. The final results can be exported for use in advanced simulation utilities such as brain excitation propagation or tumor growth modeling.
Complementing these tools is the File Exporter Utility, which allows users to generate MIS-U files from raw DTI data (exported using MRI Studio), including eigenvalue and eigenvector files. It also supports scalar image data, where sequentially named slices are processed automatically to generate Unistable and Unistable 3D representations. The software manages all outputs in structured folders, ensuring organized data handling, and provides an end-to-end pipeline from raw imaging input to processed, analyzable, and export-ready data, making it ideal for both research environments and medical imaging applications.
3. Illustrative Examples
3.1. Image Clustering Utility
Loading the File: Image Clustering Utility is the main form (Figure 1) of the application. Just load MIS-U file or any Image files (BMP, PNG, JPG) and then you are ready to go.
When loading MIS-U file: For DTI modality, all Scalar Indices (SI) + Unistable and Unistable 3D are included, however for other modalities (MRI, CT, Flair … etc.) only magnitude, Unistable and Unistable 3D would be available.
When loading Image file: Only magnitude will be available.
Clustering Algorithms: According to the selected image, Clustering algorithm can be applied. You can select simple threshold clustering or use one of the following clustering algorithms:
- Histogram Quantization
- K-Means
- Fuzzy C-Means (FCM)
- Expectation Maximization (EM)
- Iterated Conditional Mode (ICM)
Just specify the algorithm and the required number of clusters and click the button.
You can switch between the original image view and the clustered image view (Figure 2). In the clustered image view, the detailed title of the image is displayed at the top of the image and counting of each cluster is displayed at the bottom of the image.
Export Histogram (Clustered Image): Will export those statistics to CSV file (to be used by Excel)
Export Binary (Clustered Image): Will export the binary file of the segmentation, where the .BIN file will be used in the segmentation process.
Save Image (Original Image / Clustered Image): Save only the current image to a PNG file (Figure 3). The name of the file will be the detailed title of the image.
Save Image 2x2 (Original Image / Clustered Image): Save 4 slices of the scan to a PNG file (Figure 4). The name of the file will be the detailed title of the image 2x2.
Save Image 3x3 (Original Image / Clustered Image): Save 9 slices of the scan to a PNG file (Figure 5). The name of the file will be the detailed title of the image 3x3.
Save Image 4x4 (Original Image / Clustered Image): Save 16 slices of the scan to a PNG file (Figure 6). The name of the file will be the detailed title of the image 4x4.
All files will be saved on the folder “MIS-U_Output” inside a sub-folder with the MIS-U file name
3.2. Image Segmentation Utility
After exporting the suitable Binary files, you can customize which clusters will be included to represent the tissue.
Example How to build Brain’s WM, GM and CSF:
In the Clustering Utility do the following:
- Generate the WM/non-WM file: Select FA, apply Histogram Quantization with 3 clusters, and save the binary file of the clustered image.
- Generate the CSF/non-CSF file: Select MD, apply Histogram Quantization with 3 clusters, and save the binary file of the clustered image.
- Generate the entire tissues file (GM is non-WM and non-CSF): Select MD, apply Threshold clustering with value 2, and save the binary file of the threshold image.
In the Segmentation Utility do the following (Figure 7):
- Load WM/non-WM file as Layer 1 (Top Layer), CSF/non-CSF file as Layer 2 and the entire tissues file as layer 3.
- Once you unselect one of the clusters check boxes, the cluster will not be included in the layer and its space will be available for the other lower layers.
Once again, “Images Export” buttons are available with the same manner as the clustering utility. You can export the segmentation file for further modeling (Brain or heart excitation propagation utility and Tumor growth simulation utility which will be soon available on GitHub).
3.3. File Exporter
You can generate the following using this utility:
- The MIS-U file
- Unistable File(s)
- Unistable 3D File(s)
- The Mask file of the MIS-U file (based on manual removal of undesired tissues)
Sample Brain file is included in the program folder “MIS-U_Input”
For Tensor-Valued scans (Figure 8):
- Used MRI Studio Software (https://www.mristudio.org/) to export eigenvector and eigenvalue data that derived from diffusion tensor imaging (DTI) as raw binary files.
- ○
- eigenvalue files are (e1, e2, and e3)
- ○
- eigenvector files are (ev1, ev2, and ev3)
- eVec1, Mask Uni D, Uni A, Uni3d D and Uni3D A are optional (but also recommended)
- Dimensions and Scales SHOULD be specified by the user as eigenvalue files (which are exported by DTI Studio) contains raw data
- Once you specify eVal1, eVal2 and eVal3, you can export the Unistable and Unistable 3D files.
- The Mask can be generated by the Scalar-Valued scans option first and then it can be used here.
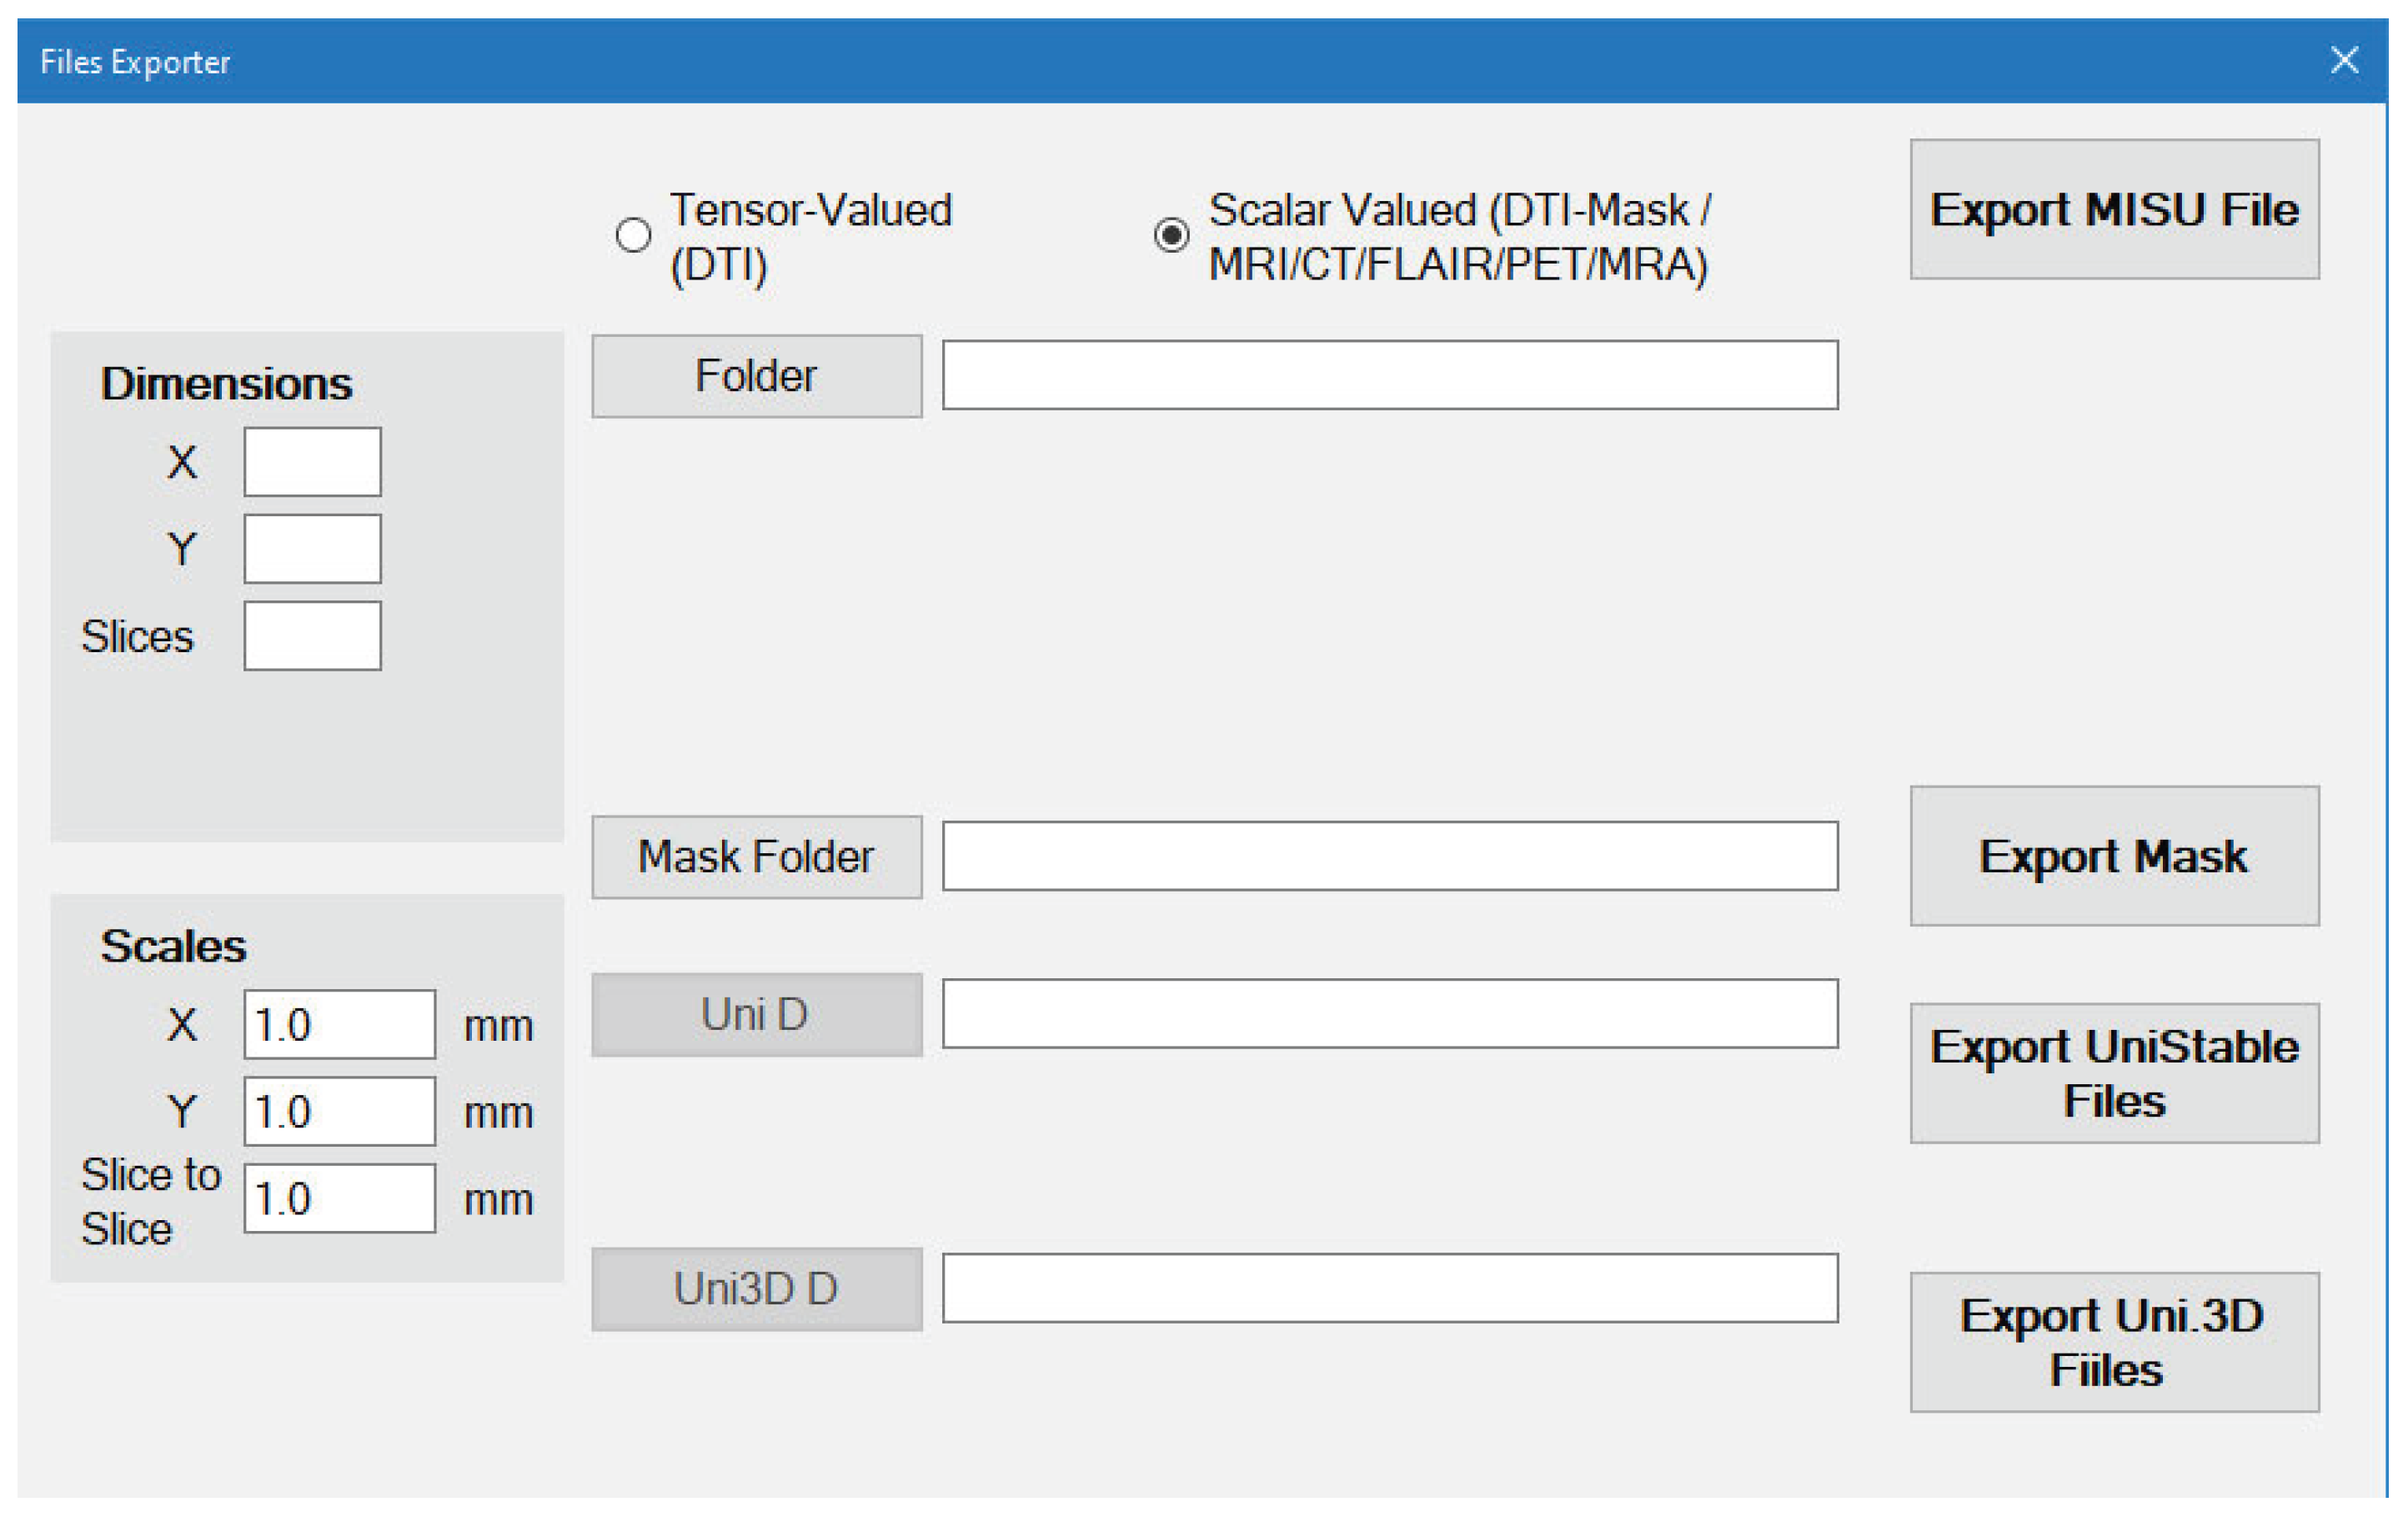
For Scalar-Valued scans such as MRI/CT/FLAIR/PET/MRA/X-Ray (Figure 9):
- The files should be stored as image files (BMP, PNG or JPG)
- The order of the Slices of the scan depends on the order of the image files Name.
- You select the folder that contains the images and everything will be done automatically.
- Dimensions will be detected automatically but the Scales are still required to be entered by the user.
4.Conclusions
The MIS-U Imaging and Clustering Suite offers a comprehensive and practical solution for medical image segmentation and clustering. It integrates multiple clustering algorithms and supports both scalar- and tensor-valued modalities, enabling users to generate customized anatomical segmentations with high flexibility. By automating complex steps such as DTI data handling and Unistable file generation, and allowing dynamic layer-based segmentation, MIS-U enhances the reproducibility and clarity of medical image analysis. The modular export functionalities further extend its usability to simulation platforms for brain activity or tumor modeling. This software serves as a valuable tool for researchers and clinicians seeking accurate and customizable segmentation workflows in diverse medical imaging contexts.
License
This project is licensed under the MIT License for academic and educational use only. If you use MIS-U software, please cite the following papers:
[1] Elaff, I. EL-KEMANY, A. and KHOLIF, M. "Universal and stable medical image generation for tissue segmentation (The unistable method)" Turkish Journal of Electrical Engineering and Computer Sciences: Vol. 25: No. 2, Article 32, 2017. https://doi.org/10.3906/elk-1509-100.
[2] Elaff, I. “Medical Image Enhancement Based on Volumetric Tissue Segmentation Fusion (Uni-Stable 3D Method)”, Journal of Science, Technology and Engineering Research, vol. 4, no. 2, pp. 78–89, 2023. https://doi.org/10.53525/jster.1250050.
[3] Elaff I "Brain Tissue Classification Based on Diffusion Tensor Imaging: A Comparative Study Between Some Clustering Algorithms and Their Effect on Different Diffusion Tensor Imaging Scalar Indices". Iran J Radiol. 2016 Feb 28;13(2):e23726. https://doi.org/10.5812/iranjradiol.23726
[4] El-Aff I "Human brain tissues segmentation based on DTI data," 2012 11th International Conference on Information Science, Signal Processing and their Applications (ISSPA), Montreal, QC, Canada, 2012, pp. 876-881, https://doi.org/10.1109/ISSPA.2012.6310677
Acknowledgments
- SharpDevelop– IDE used for development (GNU GPL).
- OpenTK– Open Toolkit Library for OpenGL graphics.
- MRI Studio– For dataset samples and diffusion imaging tools.
References
- H. Khotanlou 3D brain tumors and internal brain structures segmentation in MR images Ph.D. thesis, Ecole Nationale Superieure des Telecommunications, France, 2008.
- R.B. Dubey, M. Hanmandlu, S.K. Gupta, and S.K. Gupta "The Brain MR Image Segmentation Techniques and use of Diagnostic Packages" Academic Radiology, Vol 17, No 5, pp. 658 - 671, 2010.
- C. -Y. Wan and L. -S. Lee, "Histogram-Based Quantization for Robust and/or Distributed Speech Recognition," in IEEE Transactions on Audio, Speech, and Language Processing, vol. 16, no. 4, pp. 859-873, May 2008.
- K. Wagsta, C. Cardie, S. Rogers, and S. Schroedl "Constrained K-means Clustering with Background Knowledge" Proceedings of the Eighteenth International Conference on Machine Learning, pp. 577-584, 2001.
- Wen, Ying, et al. "Brain tissue classification based on DTI using an improved Fuzzy C-means algorithm with spatial constraints." Magnetic resonance imaging 2013; 31(9): 1623-1630. [CrossRef]
- P. Dempster , N. M. Laird, and D. B. Rubin Maximum “ Likelihood from Incomplete Data via the EM Algorithm “. Journal of the Royal Statistical Society, B, vol. 39, pp. 1–38, 1977.
- Demirkaya, M.K. Asyali and P.K. Sahoo Image Processing with MATLAB: Application in Medicine and Biology, CRC Press, USA, 2009.
- Elaff, I. EL-KEMANY, A. and KHOLIF, M. "Universal and stable medical image generation for tissue segmentation (The unistable method)" Turkish Journal of Electrical Engineering and Computer Sciences: Vol. 25: No. 2, Article 32, 2017. [CrossRef]
- Elaff, I. “Medical Image Enhancement Based on Volumetric Tissue Segmentation Fusion (Uni-Stable 3D Method)”, Journal of Science, Technology and Engineering Research, vol. 4, no. 2, pp. 78–89, 2023. [CrossRef]
- MIS-U download and help page, https://github.com/Ihab-ELAFF/Medical-Image-Segmentation-Utility-MISU.
- S. Mori, Introduction to Diffusion Tensor Imaging, Elsevier, USA, 2007.
- Sollini, M., Boni, R., Lazzeri, E., Erba, P.A. (2016). PET/CT and PET/MRI in Neurology: Infection/Inflammation. In: Ciarmiello, A., Mansi, L. (eds) PET-CT and PET-MRI in Neurology. Springer, Cham. [CrossRef]
- Elaff I "Brain Tissue Classification Based on Diffusion Tensor Imaging: A Comparative Study Between Some Clustering Algorithms and Their Effect on Different Diffusion Tensor Imaging Scalar Indices". Iran J Radiol. 2016 Feb 28;13(2):e23726. [CrossRef]
- El-Aff I "Human brain tissues segmentation based on DTI data," 2012 11th International Conference on Information Science, Signal Processing and their Applications (ISSPA), Montreal, QC, Canada, 2012, pp. 876-881. [CrossRef]
Figure 1.
Main Form of MIS-U application showing the original image view.

Figure 2.
Main Form of MIS-U application showing a Clustered image view.
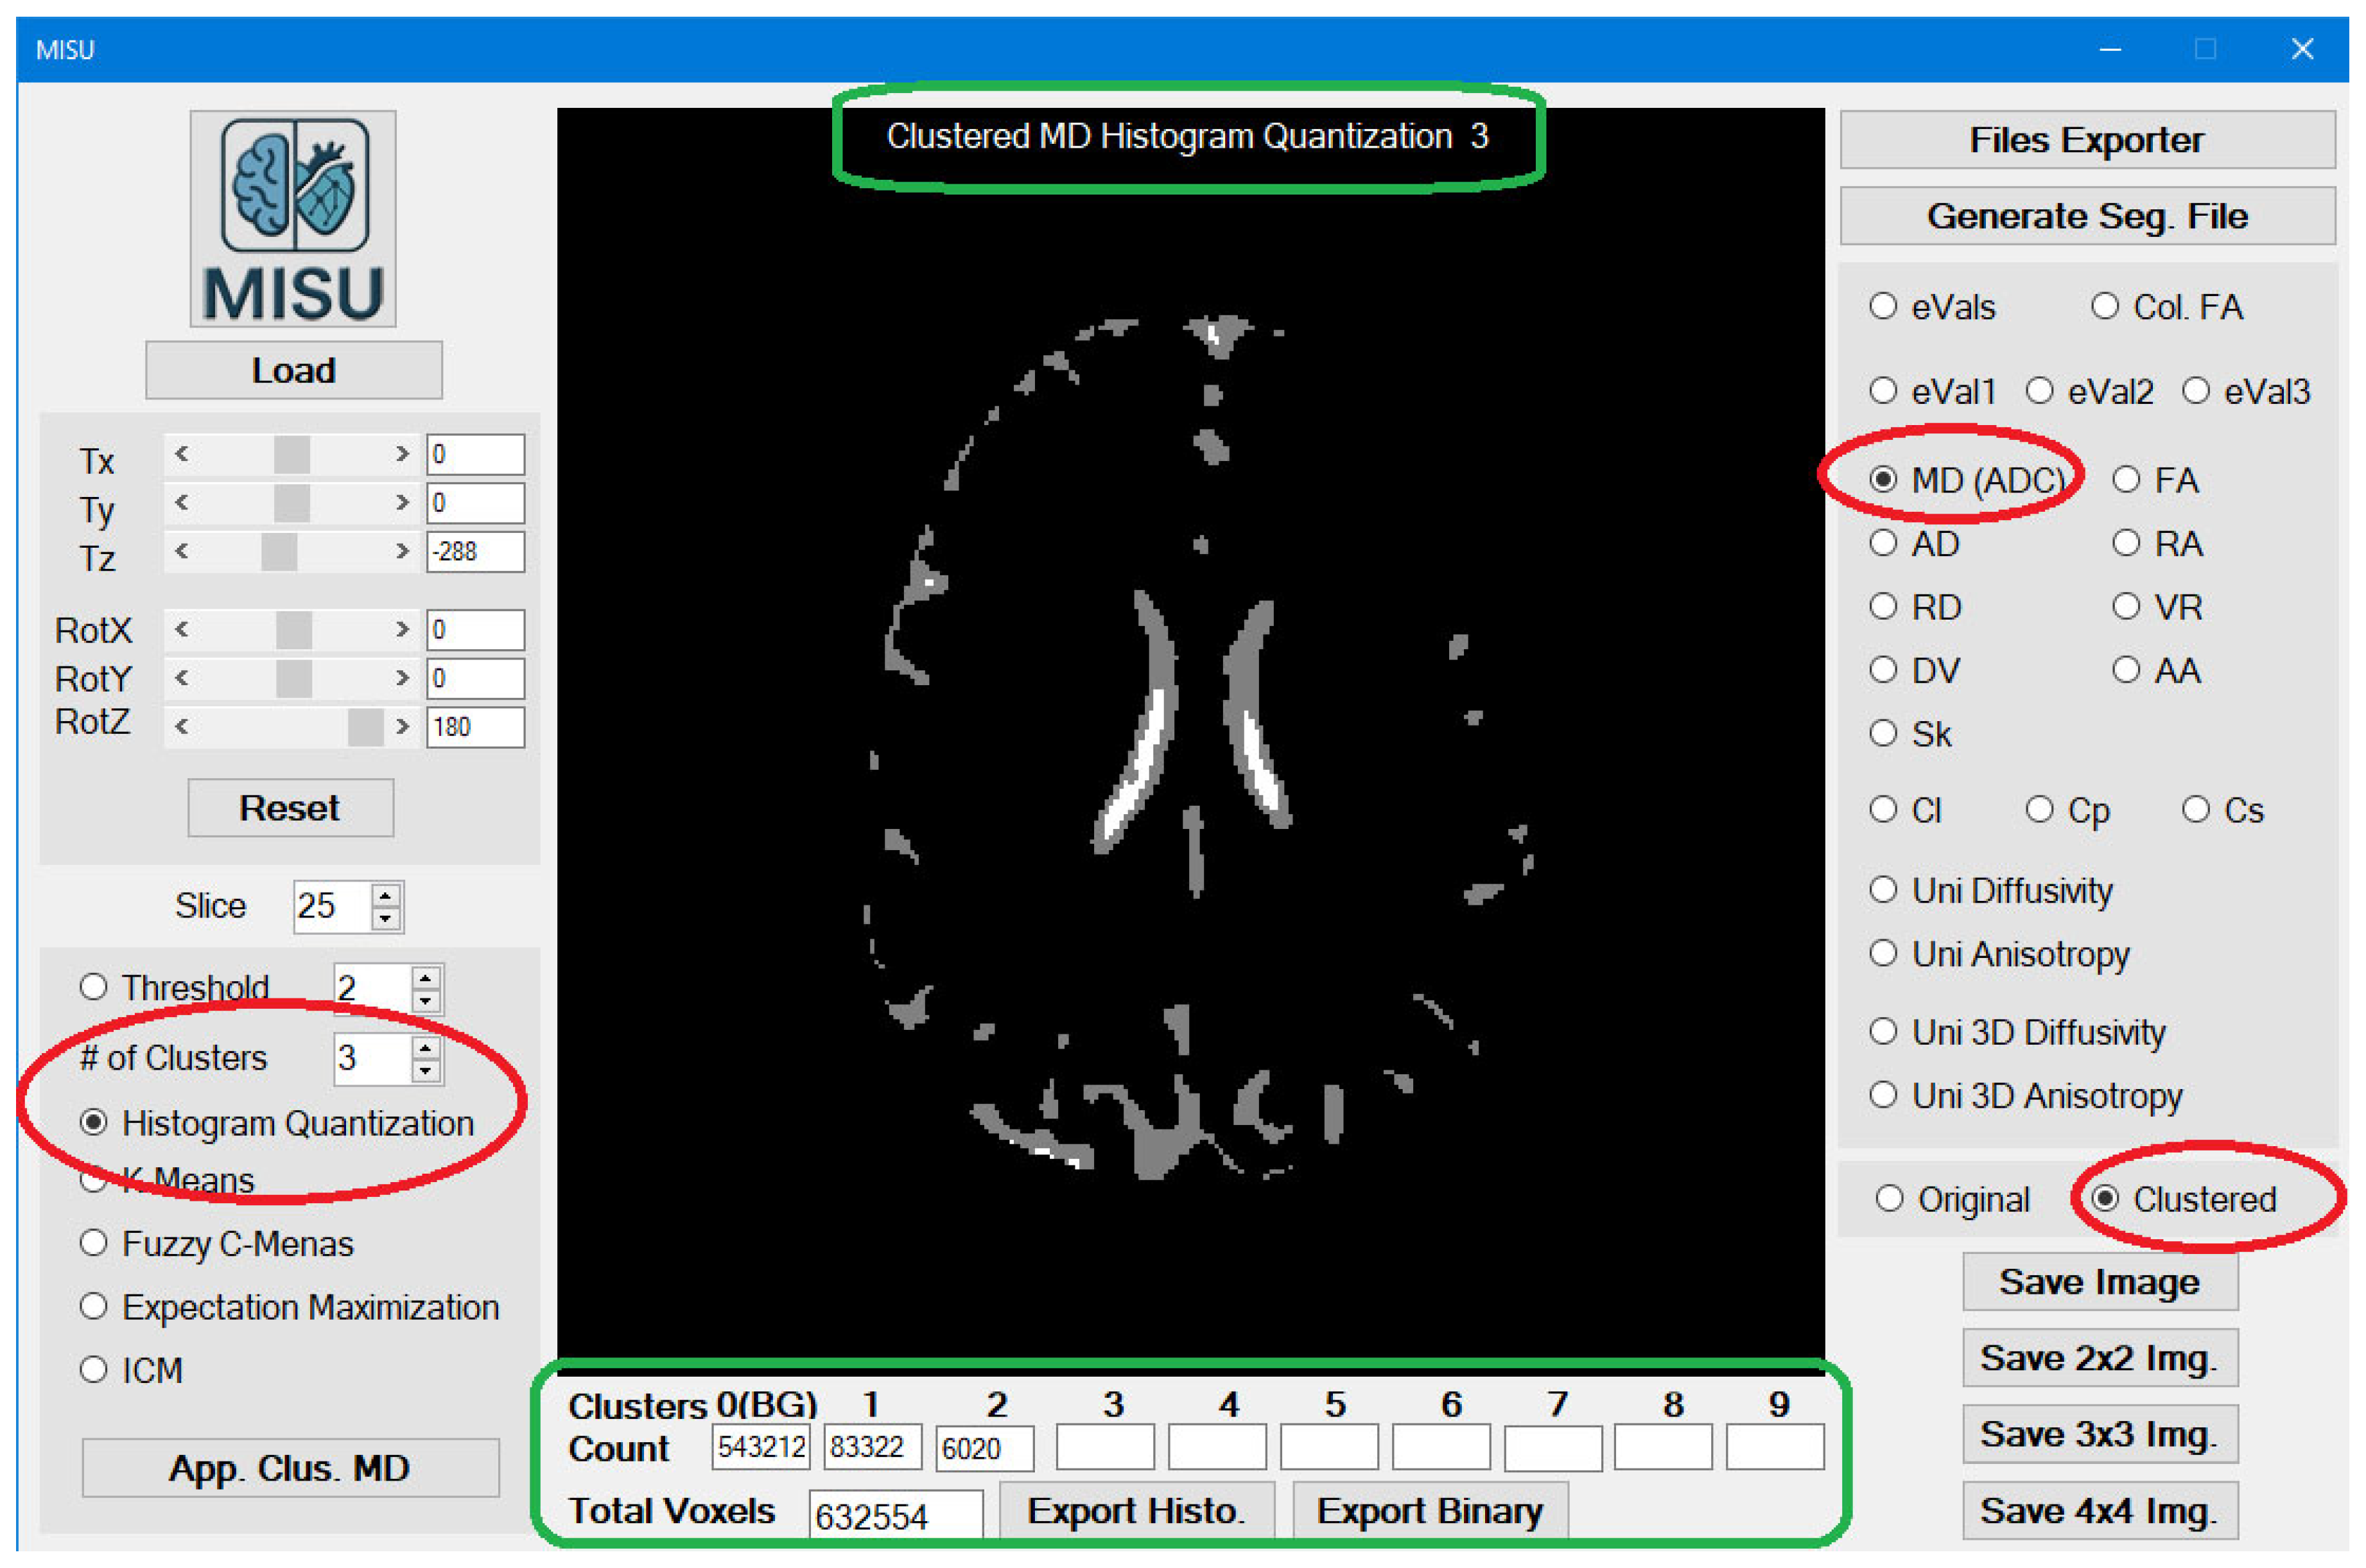
Figure 3.
Single Image Result.
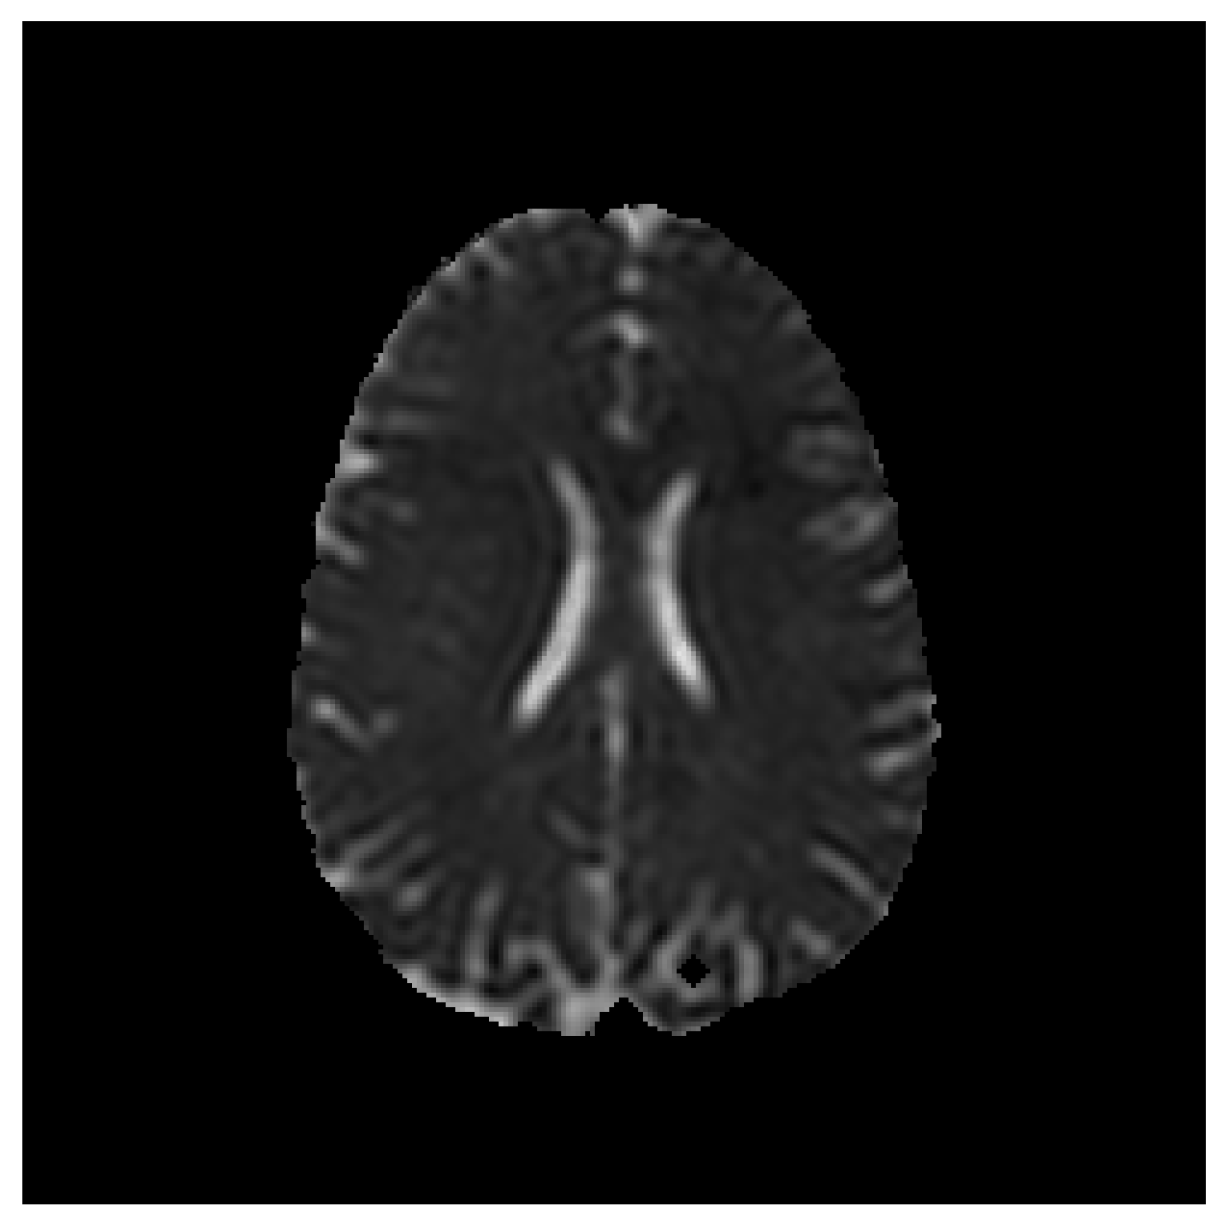
Figure 4.
2x2 Image Result.
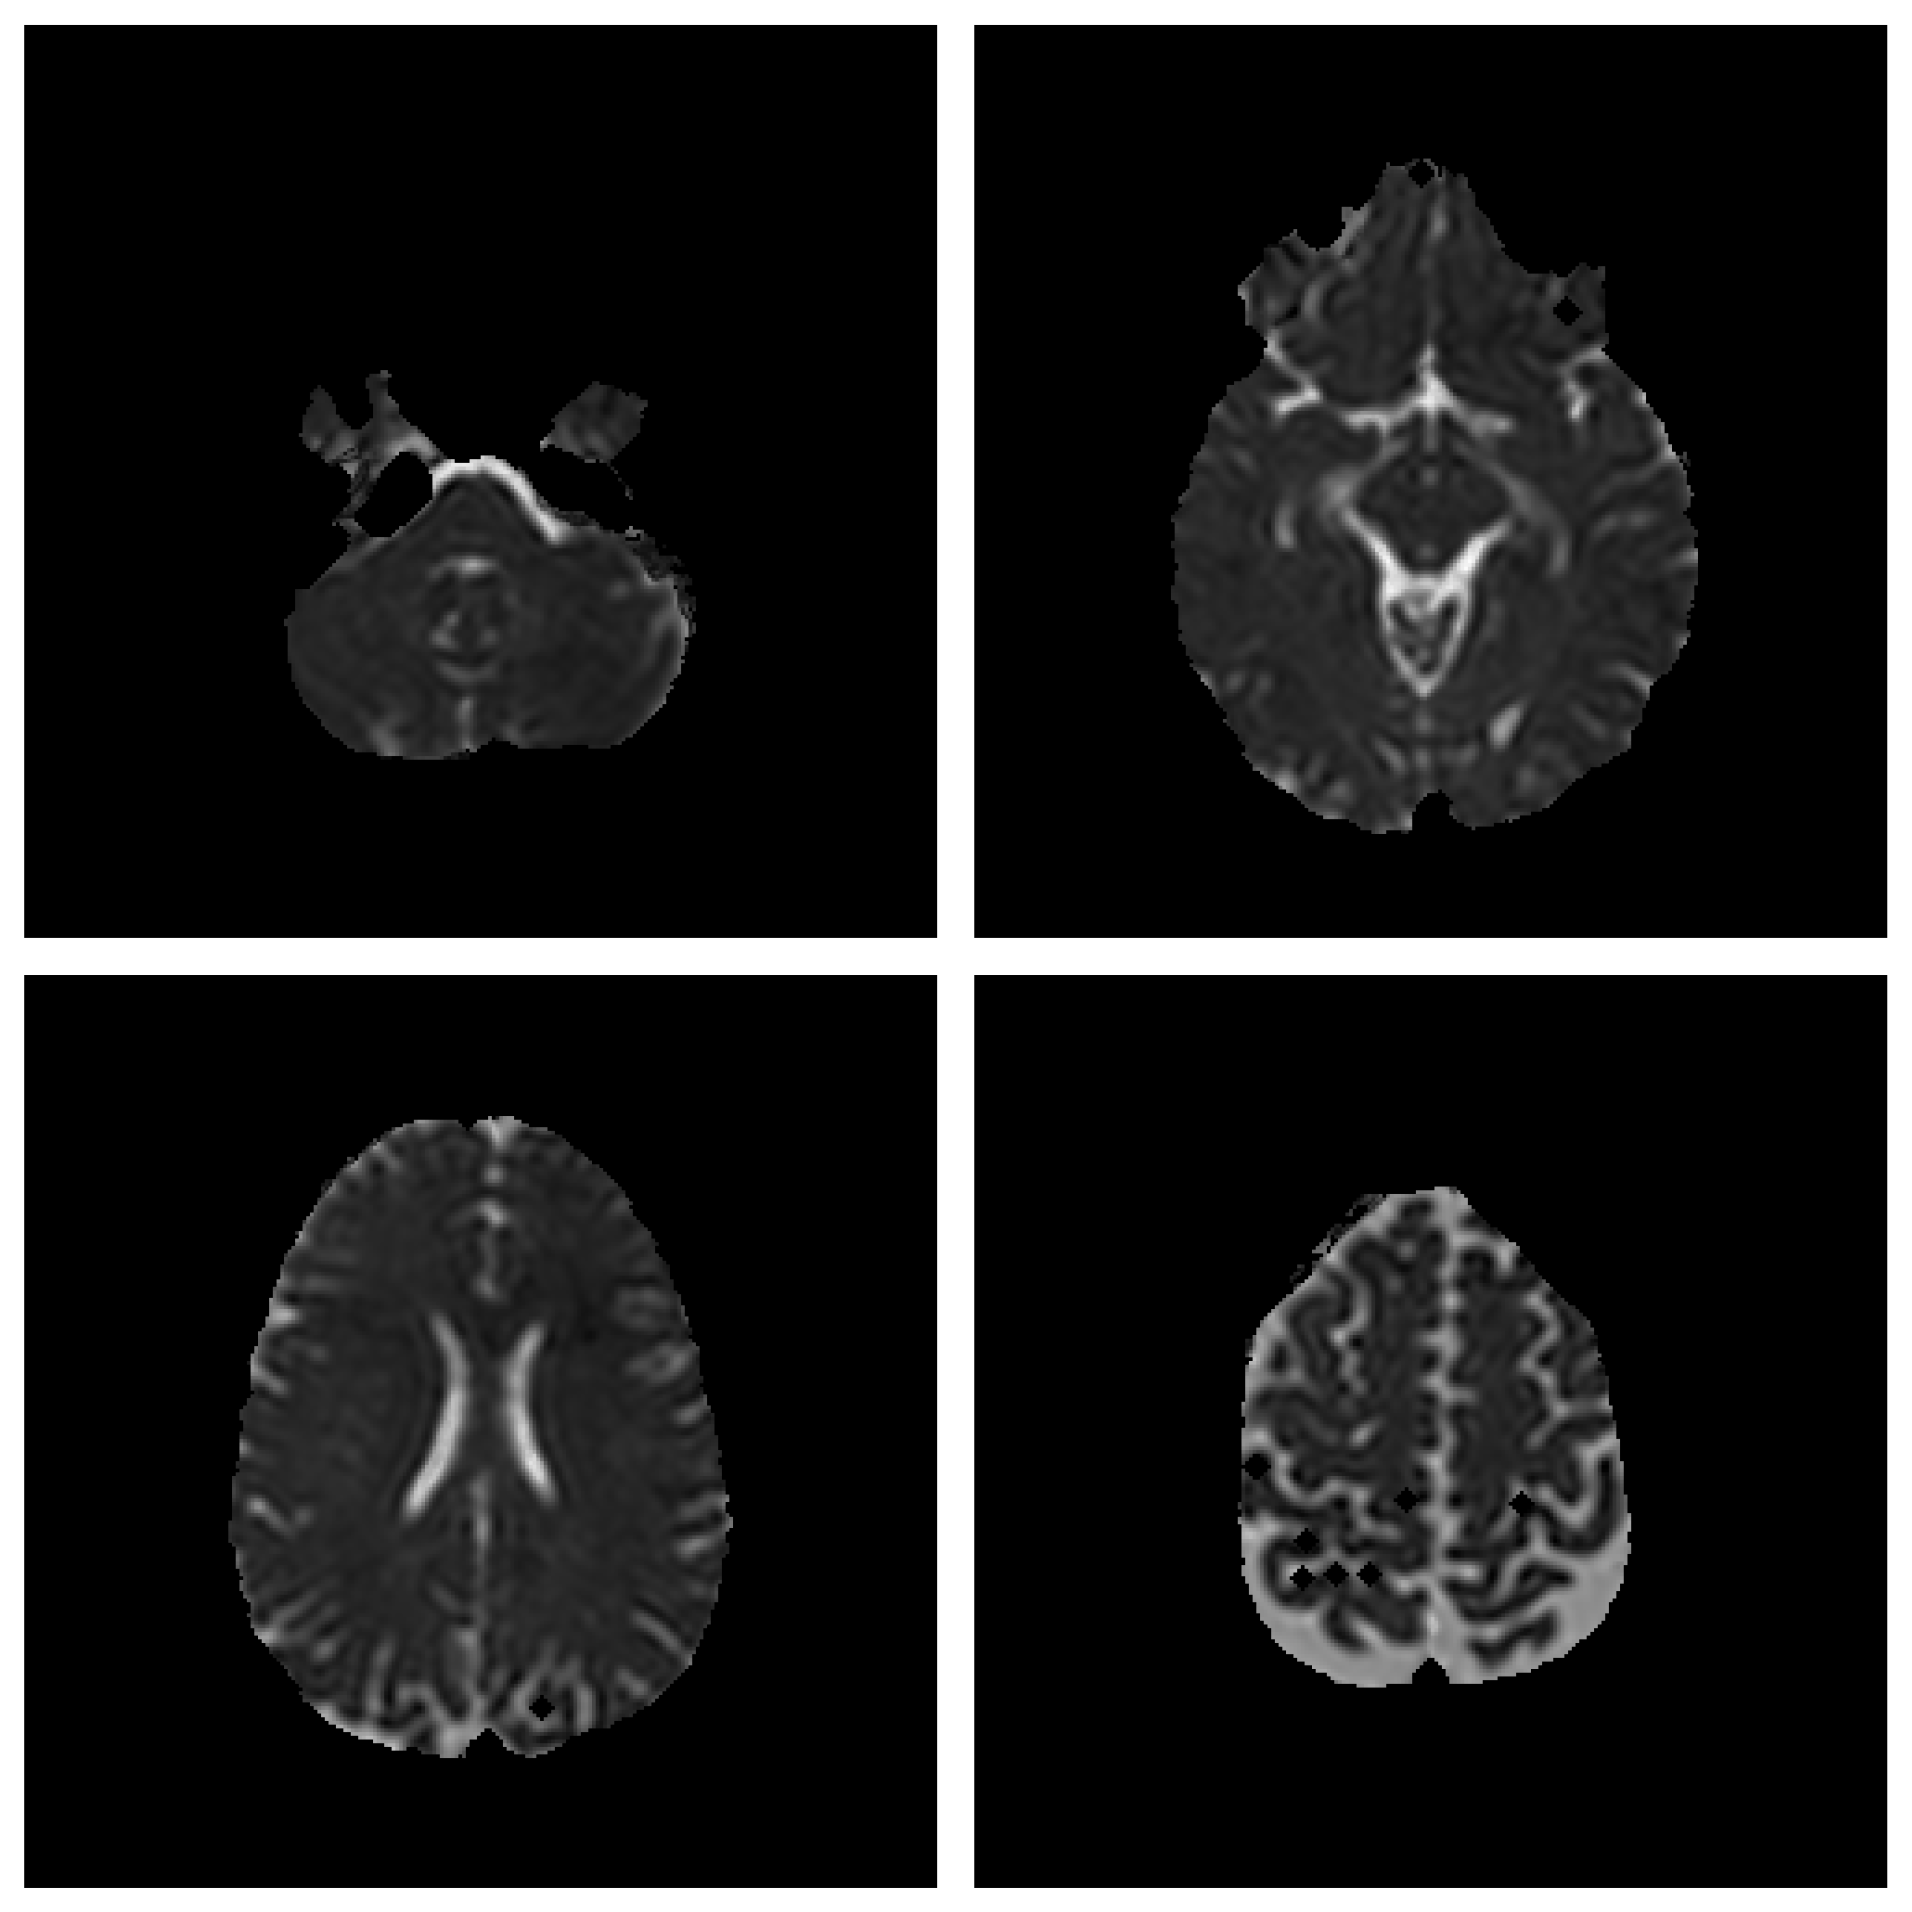
Figure 5.
3x3 Image Result.
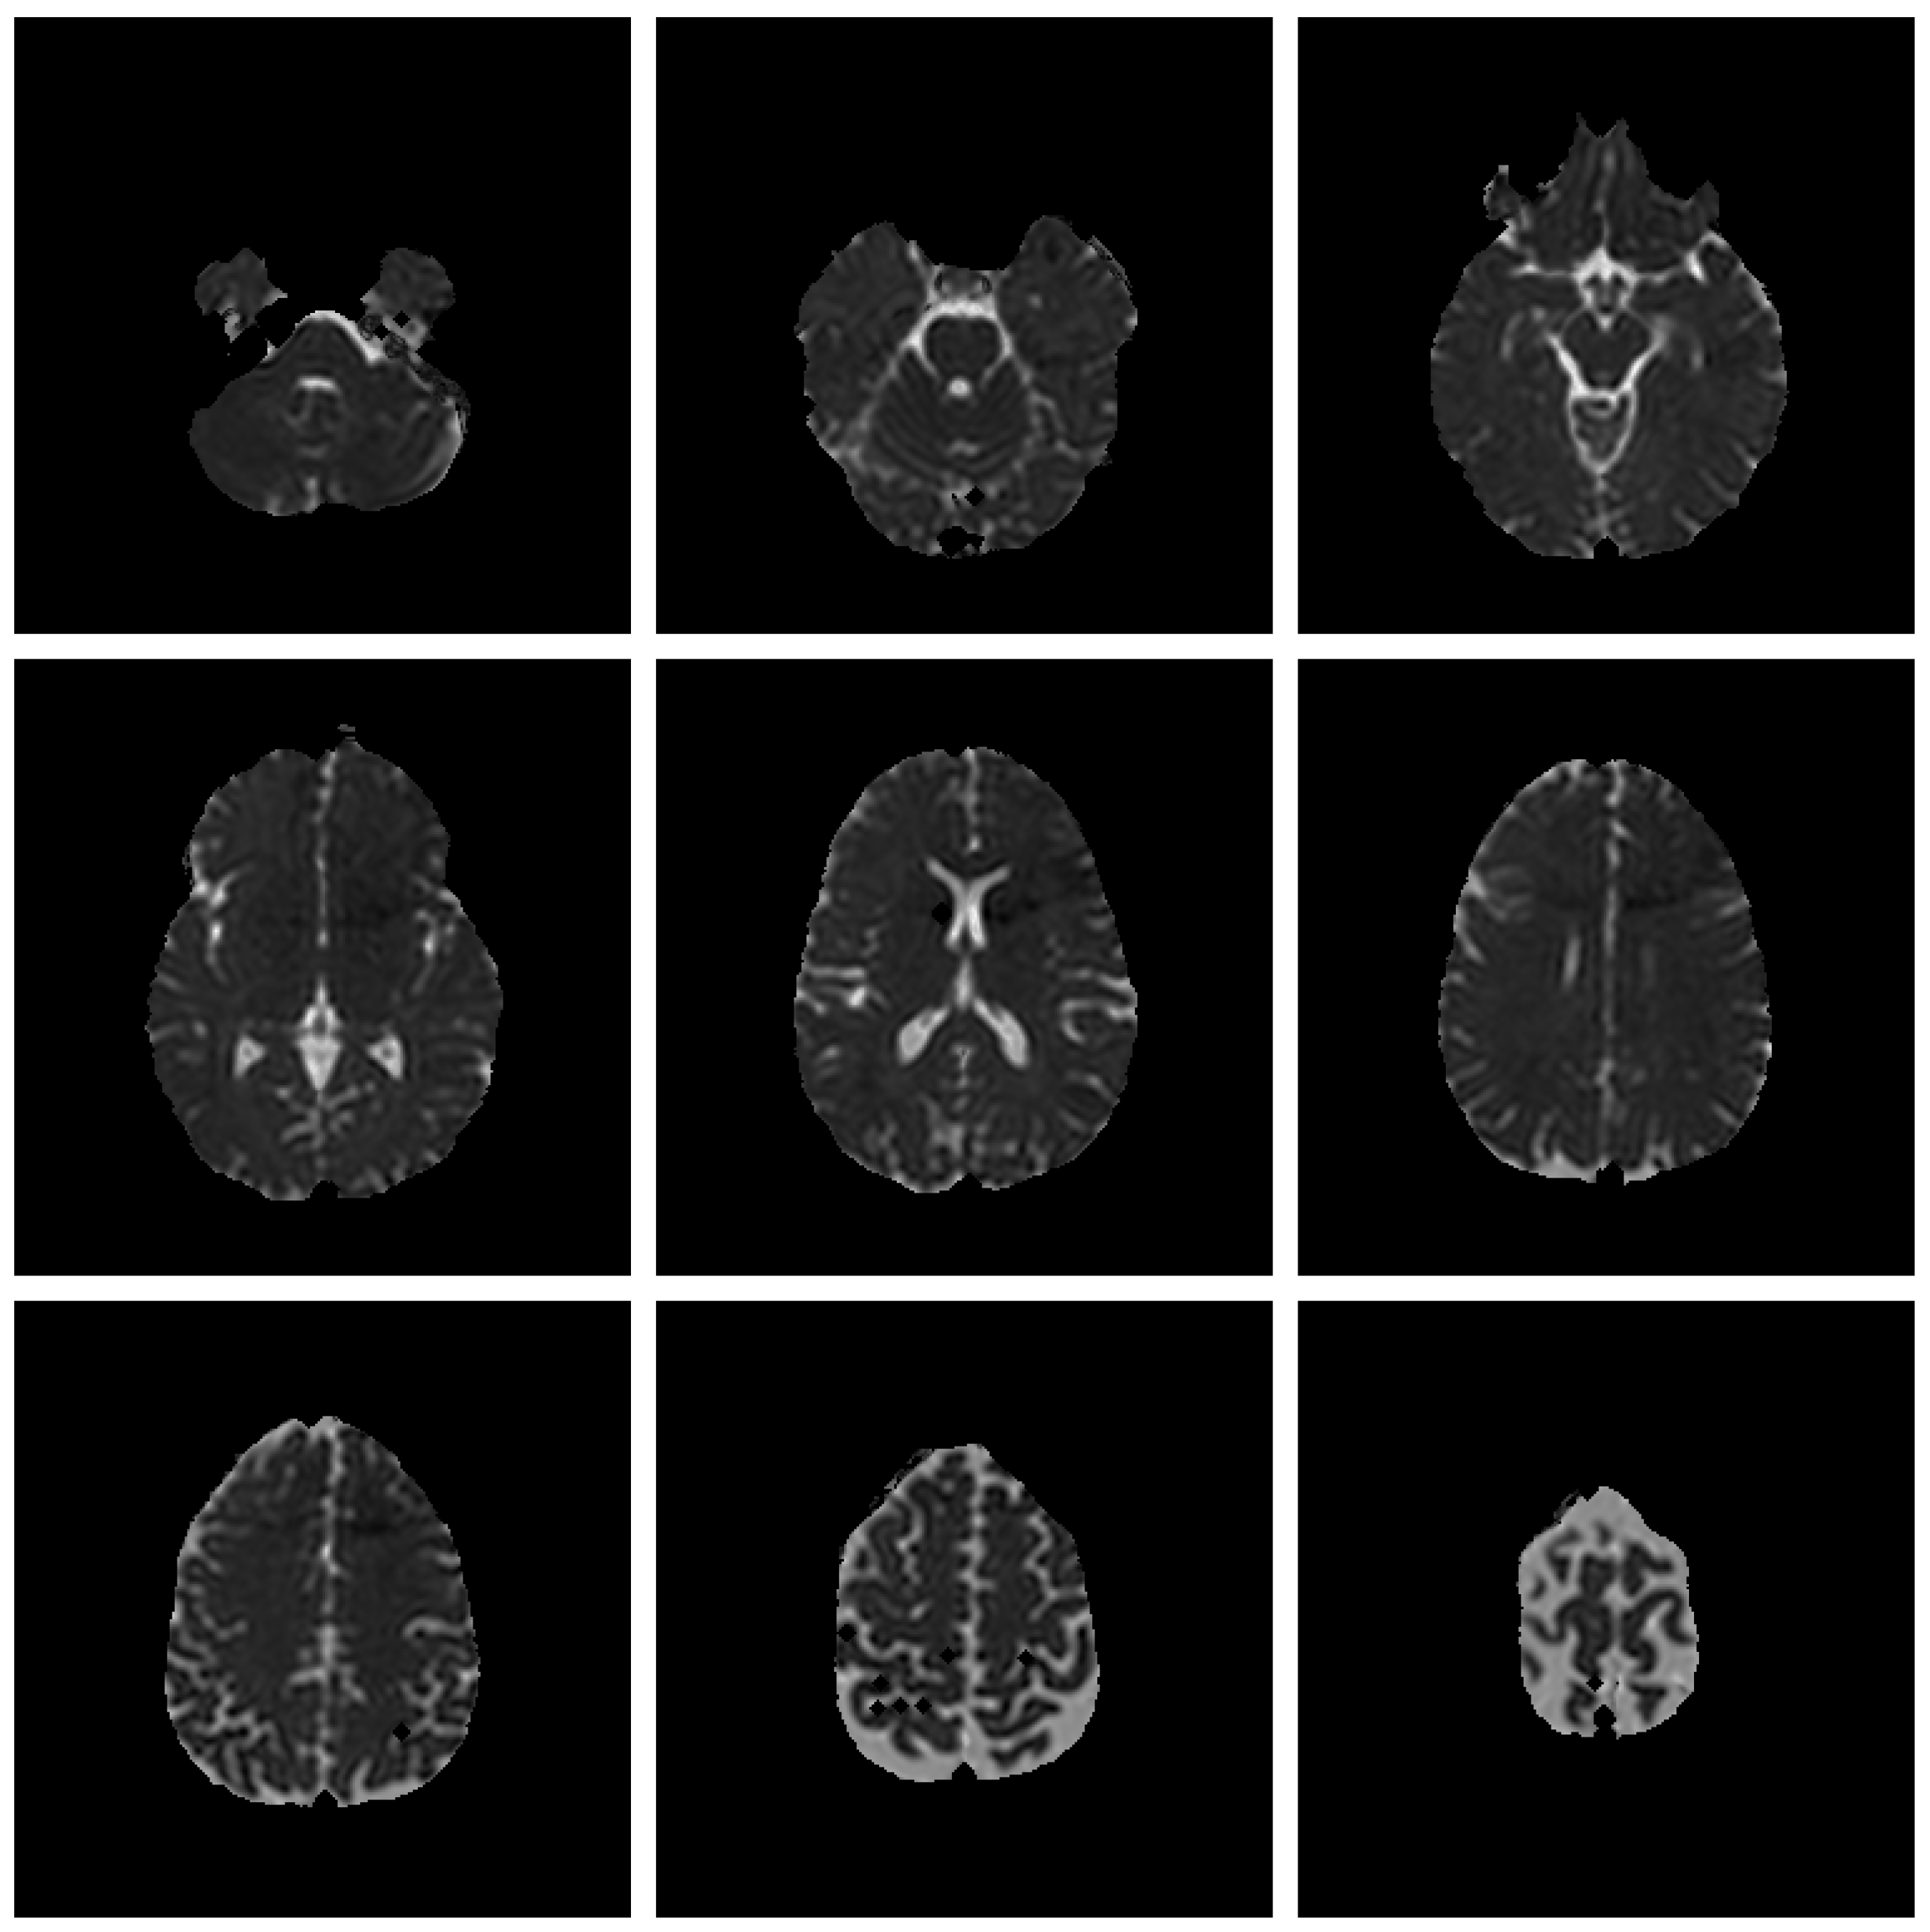
Figure 6.
4x4 Image Result.
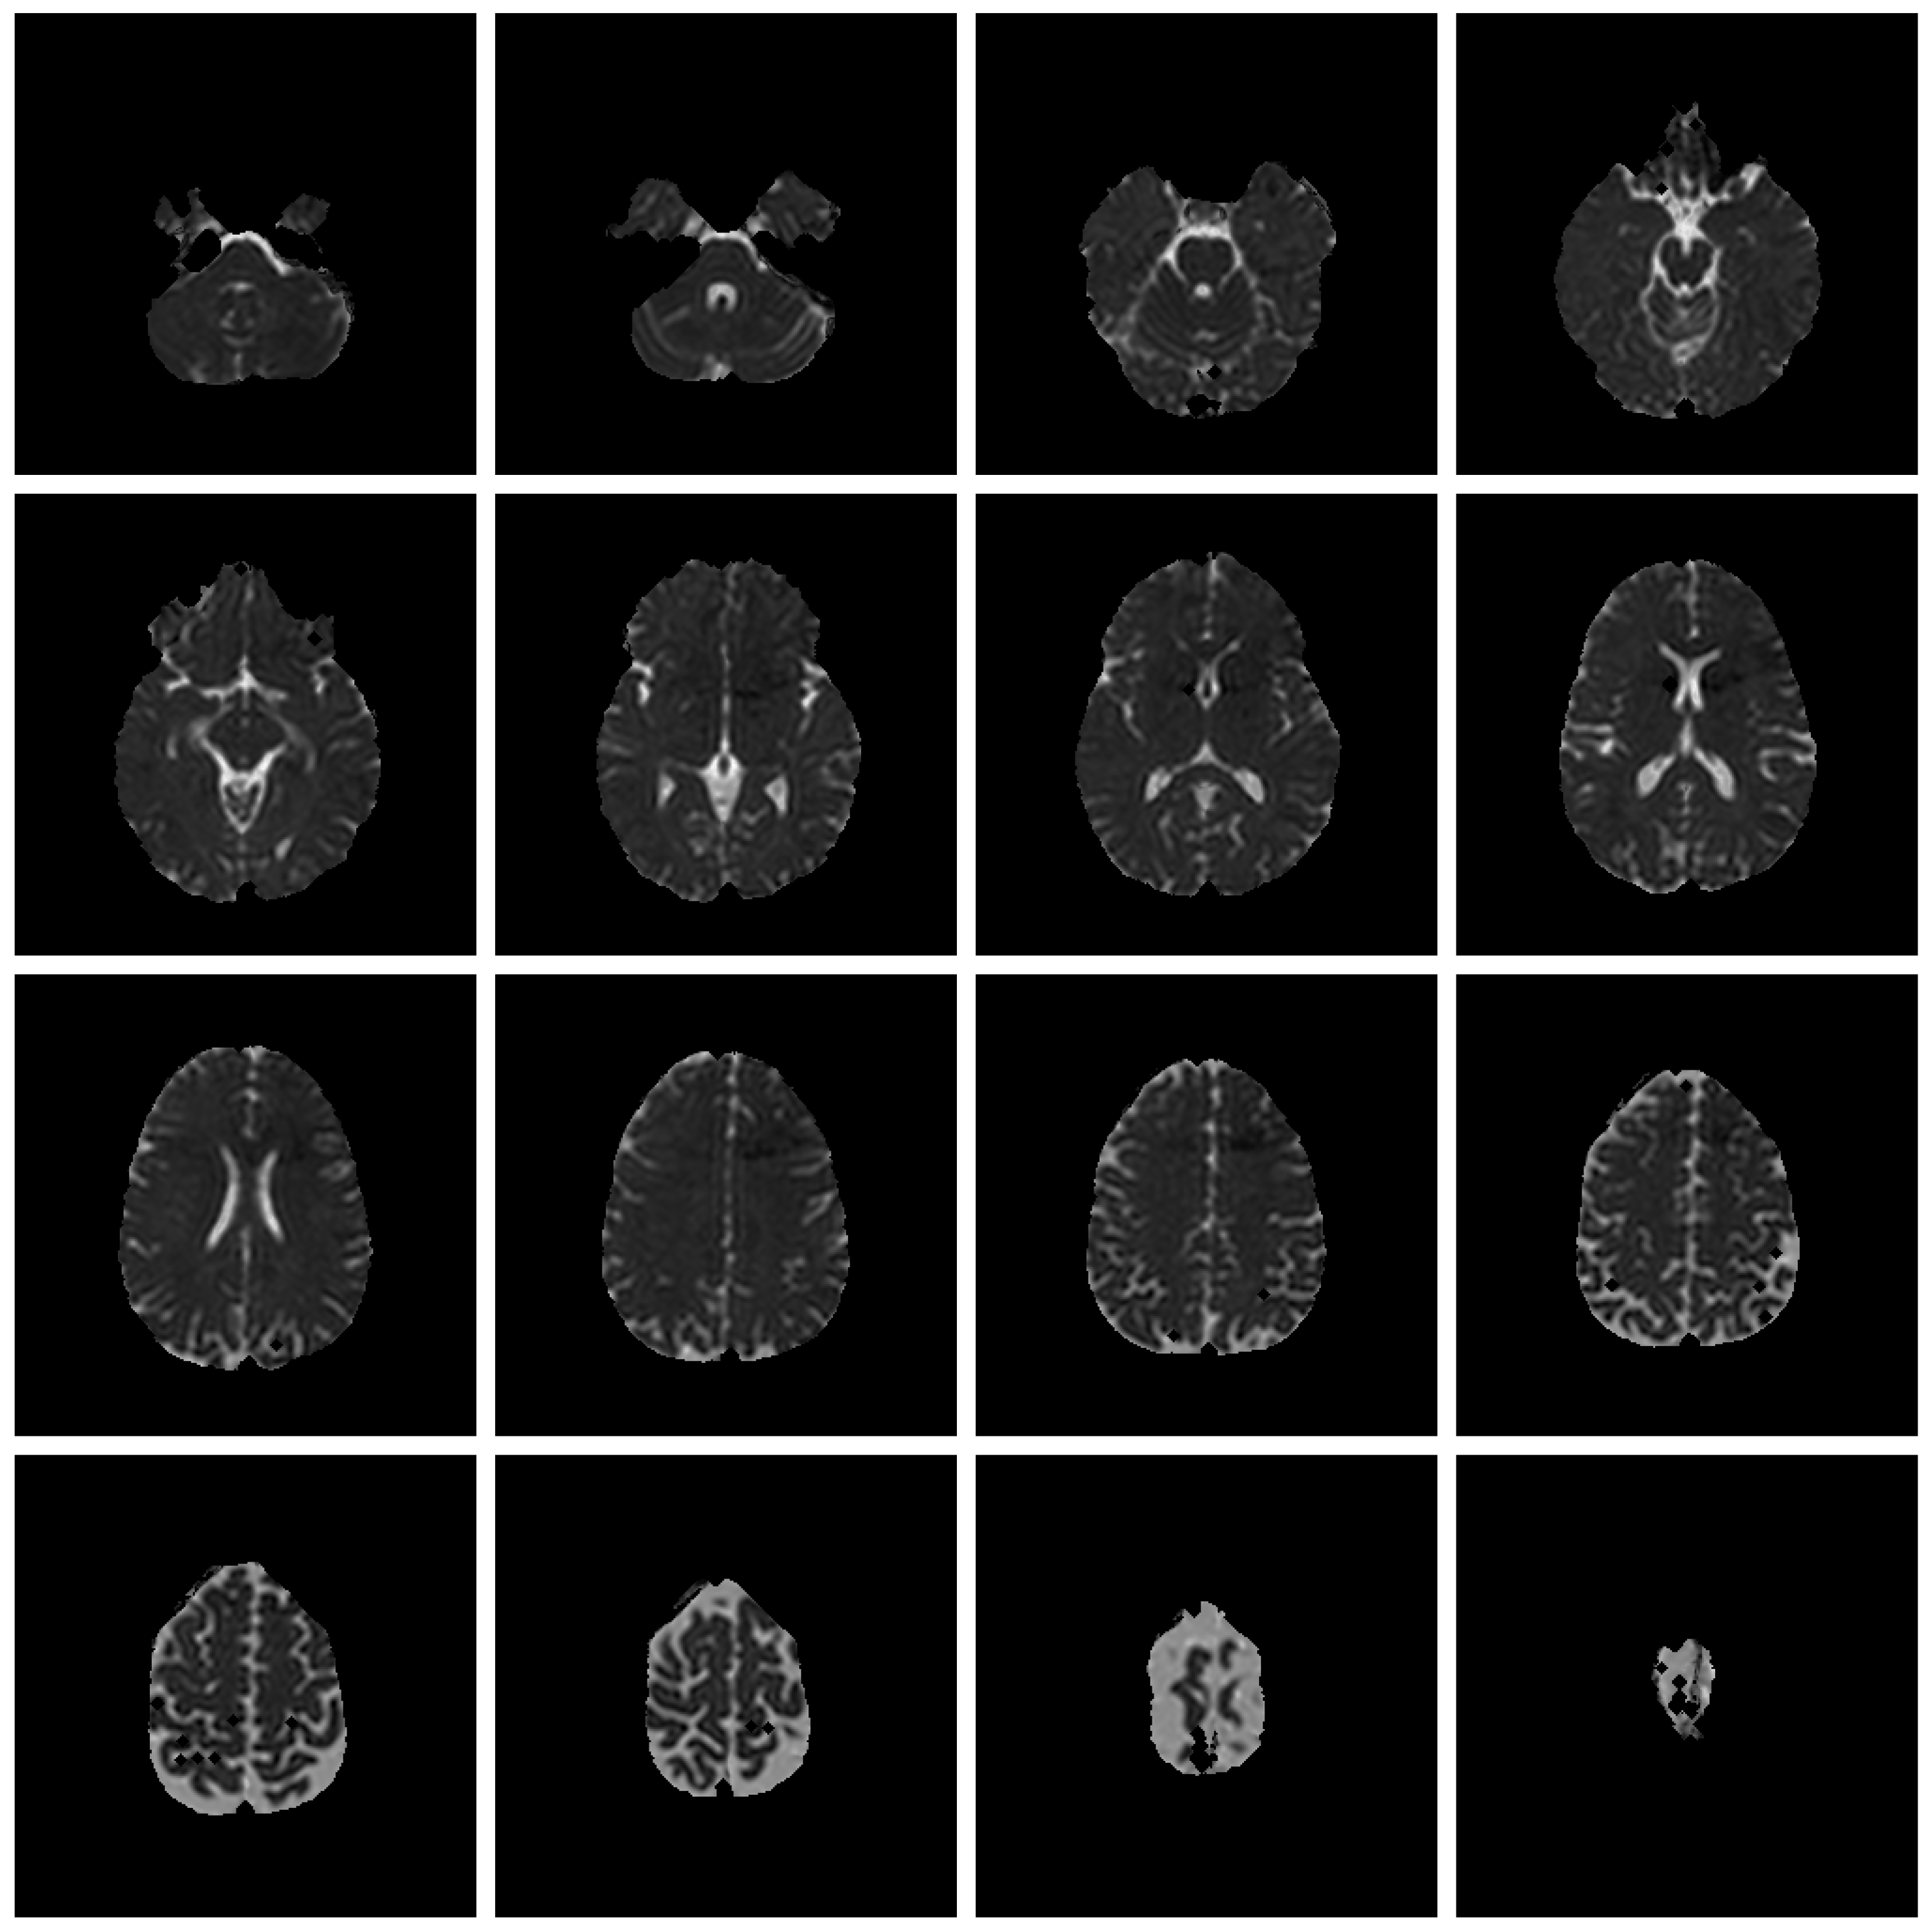
Figure 7.
Segmentation Utility Example (WM, GM and CSF).
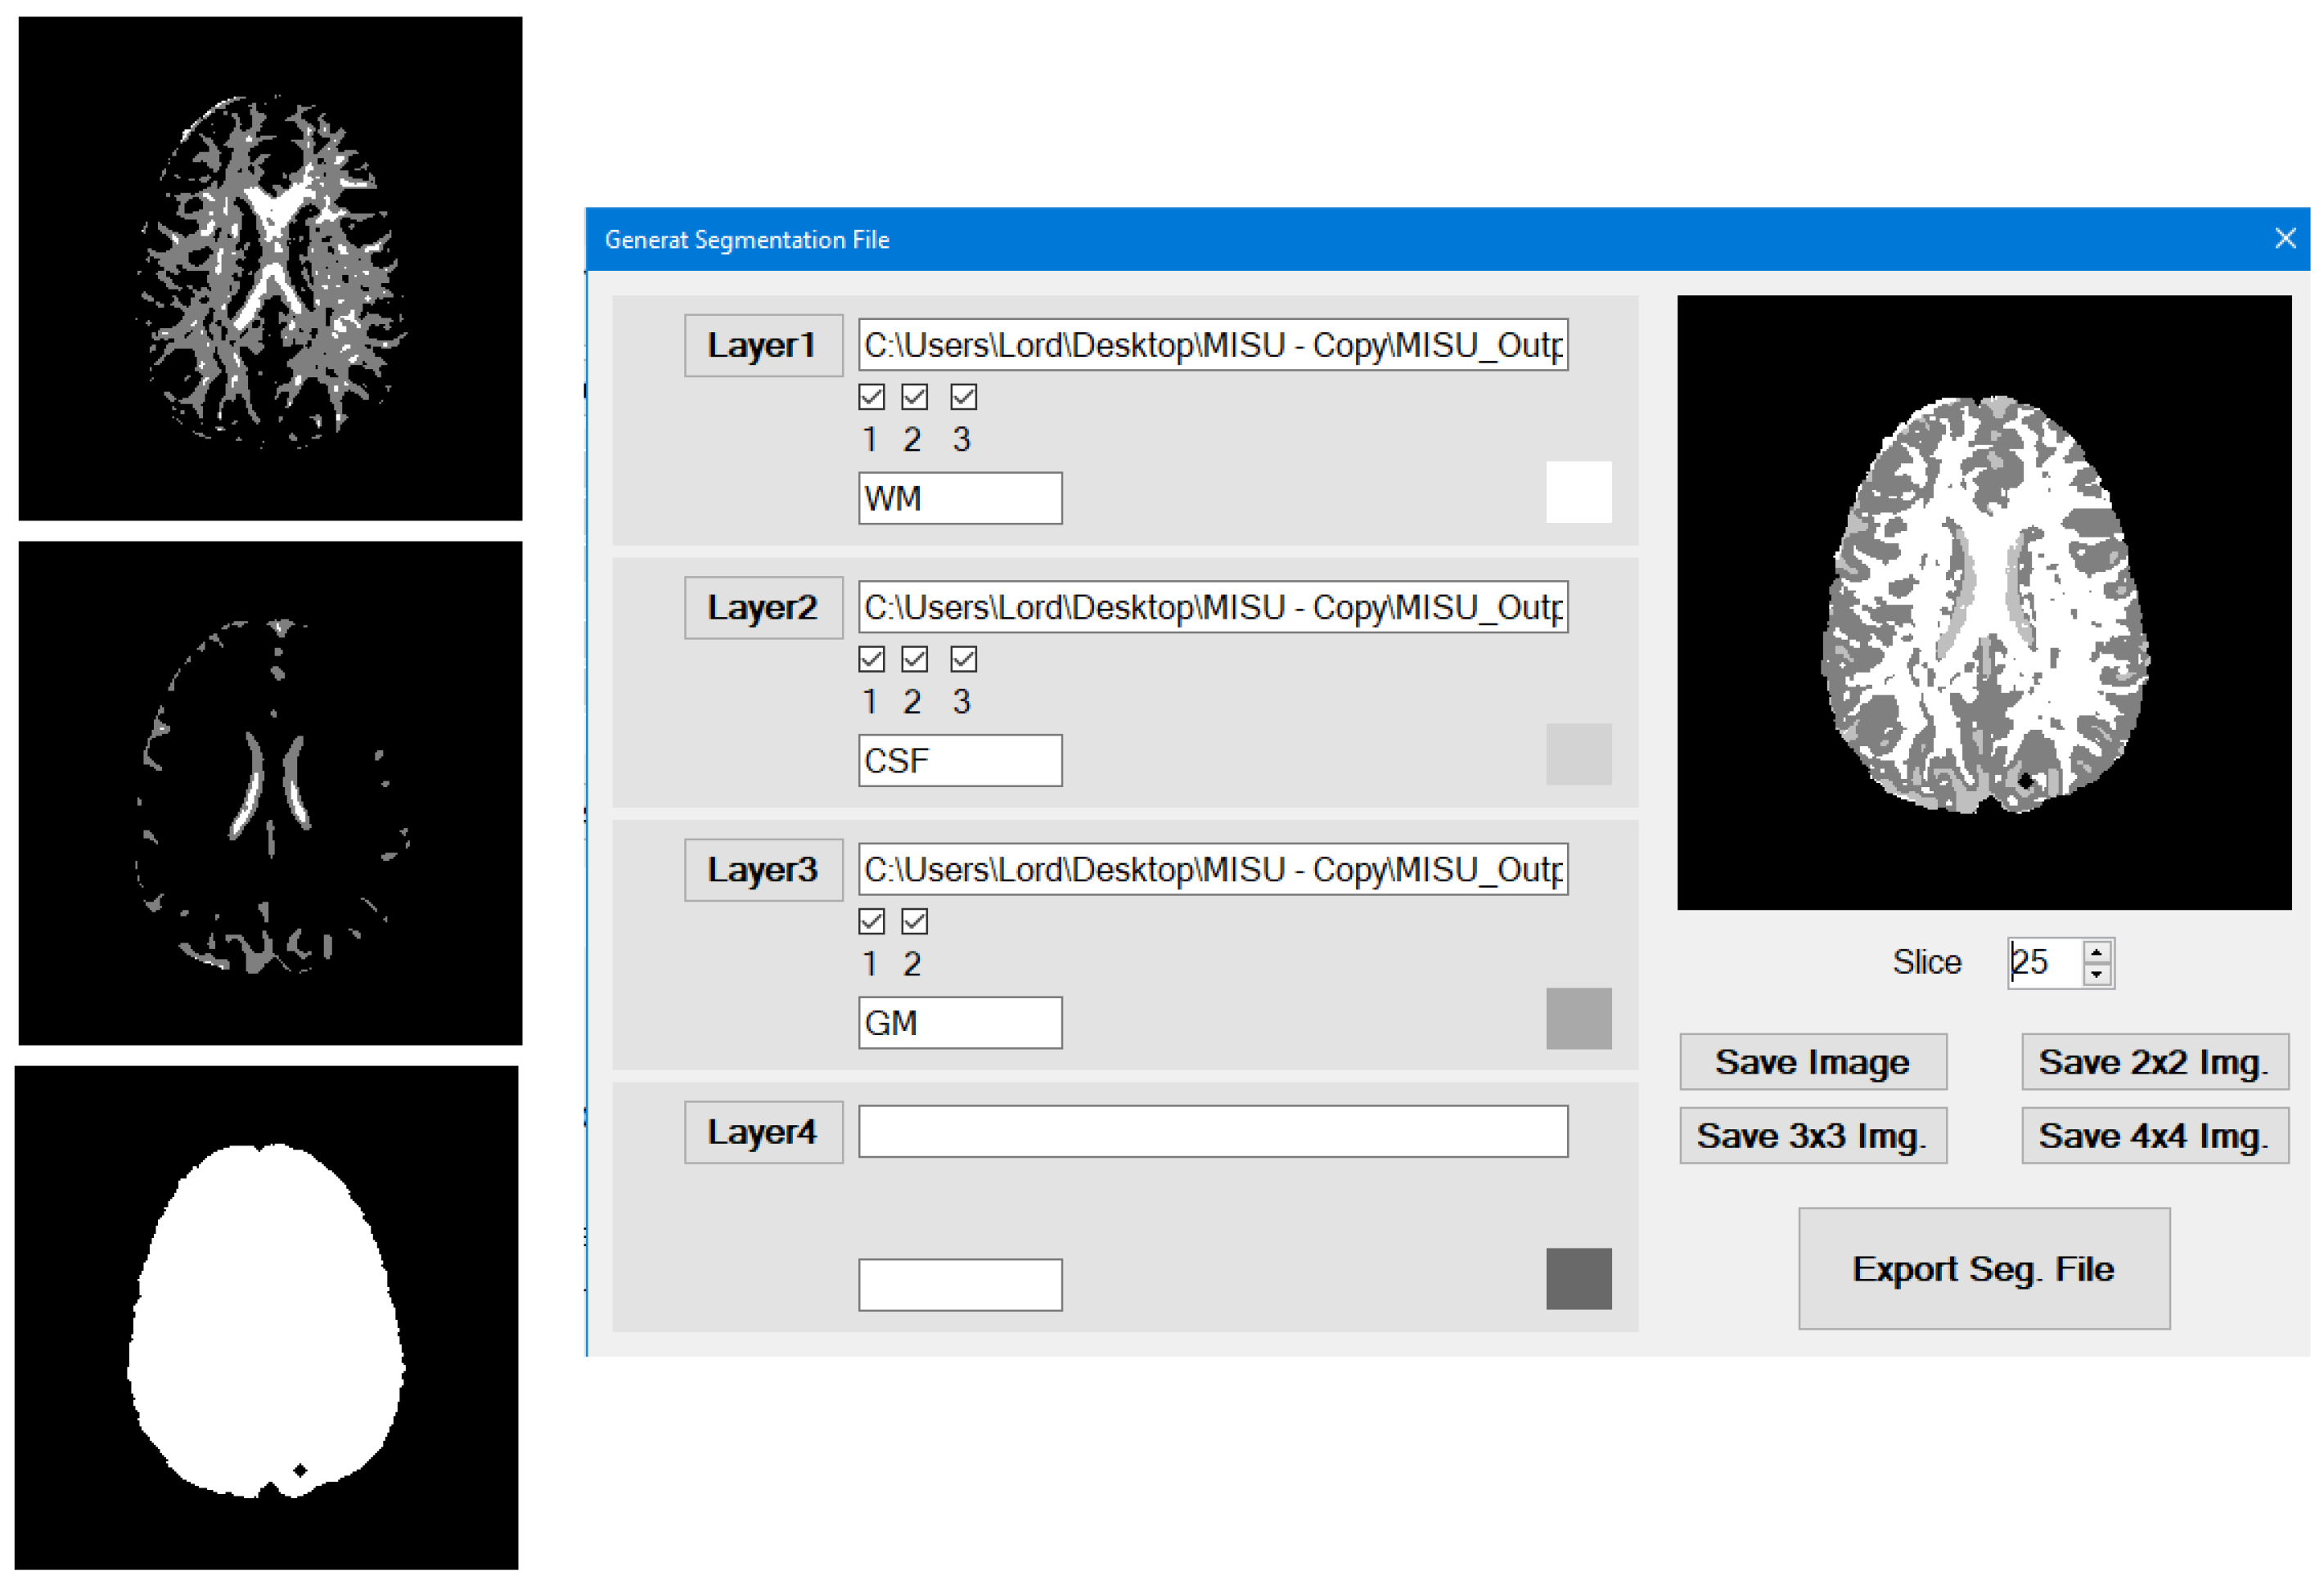
Figure 8.
Tensor-Valued Modality Exporter Interface.
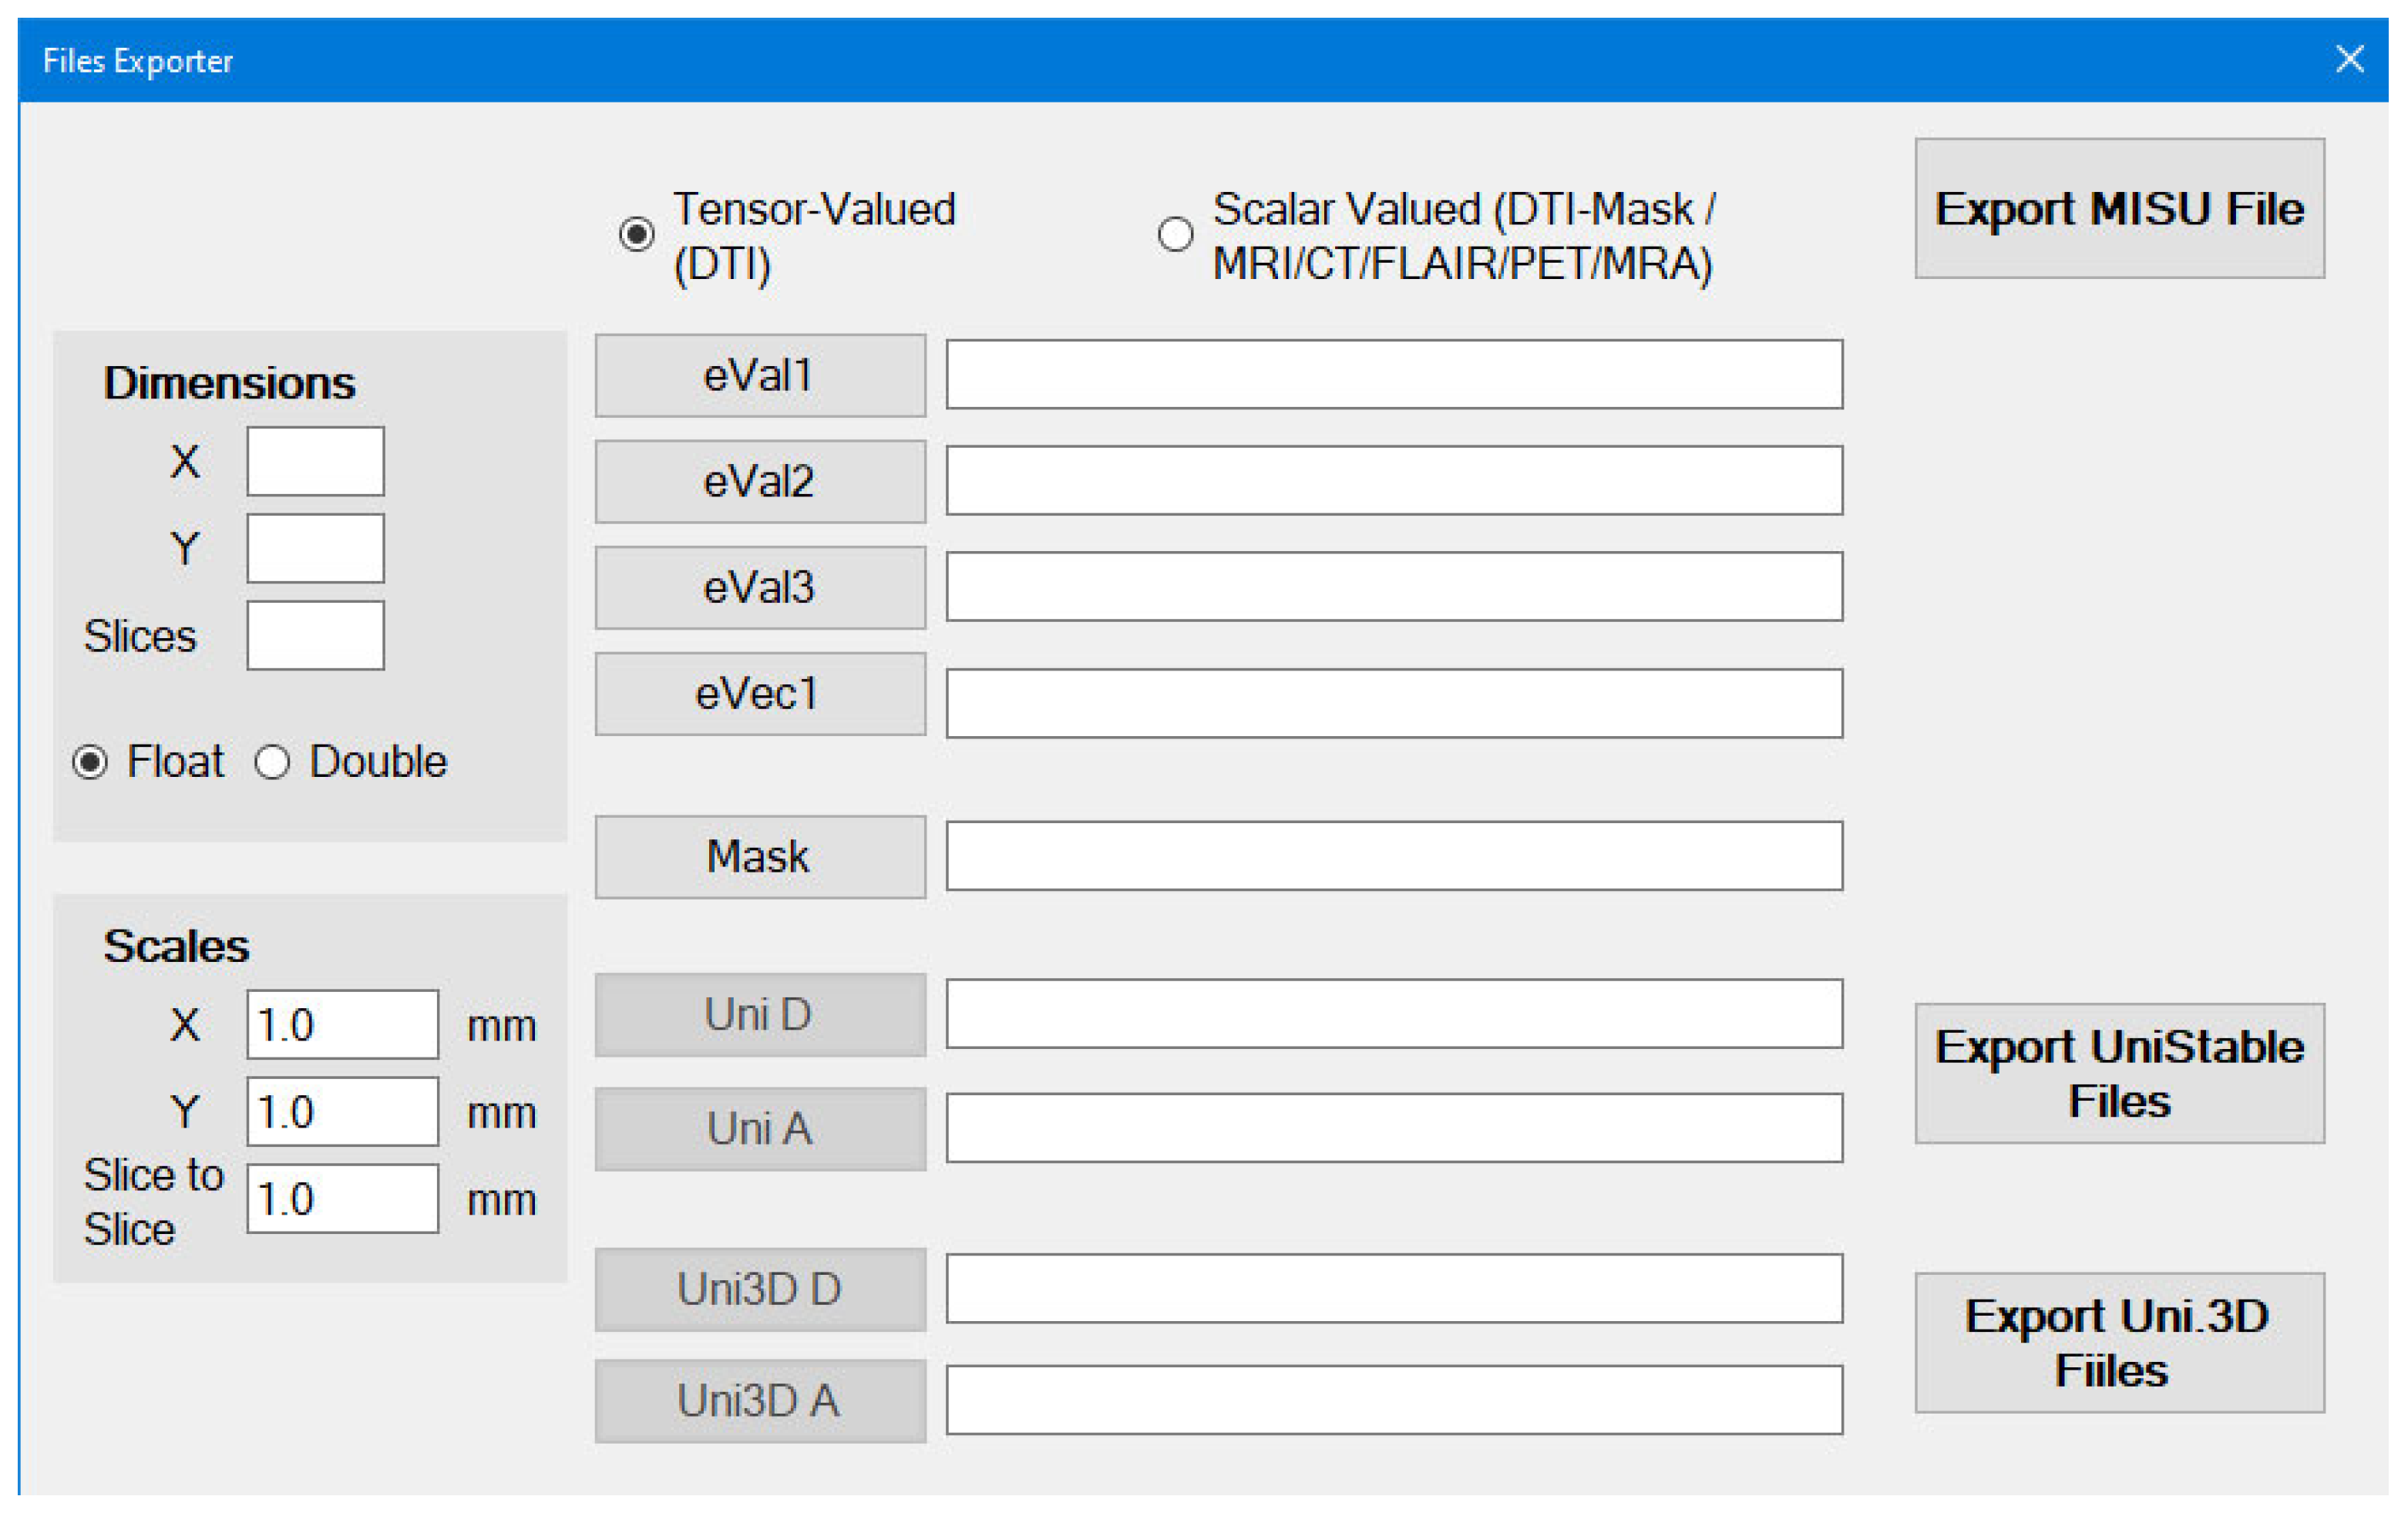
Figure 9.
Scalar-Valued Modality Exporter Interface.
Disclaimer/Publisher’s Note: The statements, opinions and data contained in all publications are solely those of the individual author(s) and contributor(s) and not of MDPI and/or the editor(s). MDPI and/or the editor(s) disclaim responsibility for any injury to people or property resulting from any ideas, methods, instructions or products referred to in the content. |
© 2025 by the authors. Licensee MDPI, Basel, Switzerland. This article is an open access article distributed under the terms and conditions of the Creative Commons Attribution (CC BY) license (http://creativecommons.org/licenses/by/4.0/).
Copyright: This open access article is published under a Creative Commons CC BY 4.0 license, which permit the free download, distribution, and reuse, provided that the author and preprint are cited in any reuse.


