
Submitted:
25 June 2025
Posted:
25 June 2025
You are already at the latest version
Preprints on COVID-19 and SARS-CoV-2
Abstract
Background & Objectives: SARS-CoV2 infection initiates at mucosal surfaces and mucosal immunity may influence the nature and severity of infection. Little is known about their induction by vaccination in COVID-19 convalescents. Methods: Sera from 205 healthcare workers was collected one-month after first Covishield vaccination and 1/3/6-months after second vaccination, while paired sera and stimulated whole mouth fluid (SWMF) was collected 1/3/6-months after third vaccination (N=10) and at 0/30/90-days after a COVID-19 episode (N=8). All were tested for anti-SARS-CoV2 spike antibodies by ECLIA/ELISA and cytokines by ELISA/CBA. Results: One-month post-second-vaccination, serum antibodies had increased significantly (6-fold) in the COVID-19-naïve group (CNG), but declined (1.5-fold) in the previously COVID-19-exposed group (CEG), who already had high antibody titres. The serum regulatory cytokine IL-10 levels were higher after three antigen exposures (p=0.0002). New infections or reinfections occurred in 44% of CNG and 27% of CEG (p< 0.01). The mucosal cytokine IL-17 levels were significantly higher in the CEG. Salivary IgG/IgA and secretory IgA antibodies were detectable both after vaccination and COVID-19. Adaptive immunity cytokines after three vaccinations were barely detectable. Innate cytokines (MIG, MCP-1, IL-8, IL-1β) were higher and sustained in SWMF in contrast to serum. Conclusions: Two vaccinations in CNG resulted in an expected antibody boost, but that a second vaccination in CEG induced antibody anergy. Rapidly declining serum antibodies and minimal T cell cytokines raise concerns over their durability in subsequent virus exposures. Sustained innate cytokines and IgA antibodies emanating from the oral mucosa may result in early virus clearance and impact morbidity.
Keywords:
SARS‐CoV2
; anti‐SARS‐CoV2 spike antibodies
; Covishield vaccine
; cytokines
; secretory IgA
; mucosal immunity
1. Introduction
Vaccines confer protection by inducing certain host effector mechanisms including antibodies, cytokines and chemokines produced by B cells, CD8+ T cells and CD4+ T cells. The CD4+ helper T cells (Th cells) mediate protection through cytokines and contribute to the generation and maintenance of B cells and CD8+ T cells. CD4+ effector T cells that play a major role in vaccine induced protection include the follicular helper T cells (Tfh cells), Th17 cells and regulatory T cells (Tregs). Tfh cells are primarily positioned in the local lymph nodes where they mediate B cell activation, differentiation, somatic hypermutation and class switching. They directly control the antibody responses and mediate adjuvanticity. Th17 cells promote a local pro-inflammatory response and contribute largely to mucosal immunity. These effector T cells are controlled by the Tregs. The cytokines (IL-17, IL-21, IL-10, IL-7, IL-15) produced by these effector and regulatory T cells contribute to the effectiveness of a vaccine [1].
The predominantly administered COVID-19 vaccine in India is the Covishield vaccine, which is identical to Astra Zeneca’s ChAdOx1, and manufactured under license. It is a chimpanzee adenoviral vector vaccine carrying the genetic material coding for the SARS-CoV2 spike protein. Studies from India on vaccine efficacy have reported that the Covishield vaccine reduces the incidence rate of infection, transmission rate, mortality rate and rate of hospitalization compared with unvaccinated controls [2,3,4,5].
Although these large cohort studies have shown the effectiveness of this vaccine, there is little knowledge about the T cell responses elicited. Robust T effector and memory cell responses are important for the activation of B cells and maintenance of memory B cells. Studies have demonstrated differential humoral and in vitro cell-mediated immune responses in COVID-19-naïve groups (CNG) compared with COVID-19-exposed groups (CEG) after two vaccinations with BNT162b2 and after one vaccination with Ad25.CoV2.S [6,7]. Since these studies were performed in vitro upon stimulation of lymphocytes with specific peptides, these findings do not necessarily correlate with in vivo reduction of antigen burden. In addition, there is very little data on the induction of mucosal immunity by Covishield vaccination. Mucosal immunity represents both innate and adaptive immunity at all mucosal surfaces, and can differ substantially from systemic immunity in the local production of antibodies, lymphocyte distribution and cytokines. It may be the primary defense against pathogens.
Therefore, in this study we proposed to determine the antibody responses and the pro-inflammatory and memory T cell responses in Covishield vaccinees in the serum and the mucosal secretion, stimulated whole mouth fluid (SWMF) samples up to six months after a third vaccination. We also elucidated the mucosal immunity in a sub-group who developed COVID-19 after vaccination. We compared B cell and T cell responses to Covishield up to six months after two vaccinations in CEG and CNG with those in people who developed COVID-19 after vaccination. The innate and adaptive immunity cytokines in paired serum and SWMF samples were also determined one and 3-6 months after the third vaccination.
2. Materials & Methods
2.1. Patients and Samples
The study was approved by the VHS-Institutional Ethics Committee (Proposal# VHS-IEC/72-2020 and VHS-IEC/75-2021). Healthcare workers (HCWs; n=220) from three different hospitals in Chennai, India were recruited one month after first vaccination of Covishield (identical to ChAdOx1 and manufactured in India) after obtaining written informed consent. Blood (by venipuncture) was collected at recruitment. Demographic details, past COVID-19 exposure and vaccination dates were collated. The second and third vaccination time points were compliant with the Indian government vaccination policies (initially one month gap, then three months, subsequently 6-9 months based on vaccine availability). After the second vaccination, blood samples were collected at one month, three months and six months. After the third vaccination, concomitant blood and stimulated whole mouth fluid (SWMF) samples were collected at one month, three months and six months. In a small subset of eight HCWs who developed mild COVID-19, additional blood and SWMF samples were collected at the onset of disease, one month and three months after onset of disease. Of these eight HCWs, 2 (25%) developed COVID-19 for the first time post-vaccination, 4 (50%) developed a second COVID-19 episode and 2 (25%) developed COVID-19 for the third time.
For SWMF samples, the participants were requested to chew a sterile inert paraffin wax for five minutes and drool the collected saliva during that period into a sterile wide-mouthed container. SWMF samples were refrigerated and processed within six hours as previously described [8]. Sera and SWMF supernatant samples were separated immediately by centrifugation (serum: 3500rpm for 25 minutes; SWMF: 1500rpm for 10 minutes) and stored at -80ºC until further use. HCWs lost to follow up beyond one month after the first vaccination (n=15) were excluded from the study. Additionally, SWMF samples were collected from 11 unvaccinated COVID-19-naïve healthy controls (selection criteria included having had no known clinical symptoms of COVID-19 and being negative for anti-SARS-CoV2 nucleoprotein antibodies).
2.2. Anti-SARS-CoV2 Spike and Nucleoprotein Antibodies
Anti-SARS-CoV2 spike and/or nucleoprotein antibodies (non-isotype specific but mainly IgG as per the manufacturer) were detected by electrochemiluminescence assay (ECLIA) using Cobas e411 automated analyzer (Roche, Germany). Values <1 cut-off index (COI; lower limit of detection was 0.4 COI) were considered negative for the anti-nucleoprotein antibody kit. Values <1 U/ml (lower limit of detection was 0.4 U/ml) were considered negative for the anti-spike Ig antibody assay. Samples with values >250 U/ml (analytical measurement range is 0.4-250 U/ml) were serially diluted to 1:400 with Dulbecco’s phosphate buffered saline (PBS; HiMedia, India) and the final antibody concentration was determined.
2.3. SARS-CoV-2 Spike Specific IgG ELISA
Sera (dilution 1:2 to 1:32000) and SWMF (dilution 1:2 to 1:400) samples were tested for anti-SARS-CoV-2 spike IgG by the commercially available Human SARS-CoV-2 Spike (trimer) IgG ELISA Kit (Invitrogen, USA) according to the manufacturer’s instructions. Samples were diluted until the OD values fell onto the linear part of the standard curve.
2.4. SARS-CoV-2 Spike Specific Total IgA ELISA
Sera (dilution 1:2000 to 1:16000) and SWMF (dilution 1:20 to 1:160) samples were tested for anti-SARS-CoV-2 spike RBD total IgA using an in-house ELISA. High-binding microtiter plates (R&D Systems, USA) were coated with 0.5 μg/ml rSARS-CoV-2 spike RBD His tag antigen (R&D Systems, USA). Plates were incubated overnight at room temperature (RT). After washing with 1x PBS (HiMedia, India) containing 0.05% Tween 20 (PBST; Merck, USA) the pates were blocked for 1 hour with 1% milk in PBS. Four serial dilutions of the samples were added and incubated for 2 hours at RT. After washing with PBST, goat anti-human IgA (α chain) antibody-biotin conjugate (0.2 μg/ml GOXHU IgA Bio, Invitrogen, USA) was added and incubated for 2 hours at RT. After washing with PBST, Streptavidin-HRP-A (R&D systems, USA) was added for 20 minutes at RT. The plates were washed with PBST and 3.3′,5.5′-Tetramethylbenzidine (TMB; R&D Systems, USA) was added 20 minutes at RT, the reaction was stopped with 2N Sulphuric acid (R&D Systems, USA) and the OD values were measured at a wavelength of 450 nm and a reference wavelength of 550 nm.
Four high positive sera were chosen and pooled to generate the standard curve. Seven serial 2-fold dilutions were made in duplicates for the standard curve from 1:1000 of the pooled sera. The highest concentration of the standard curve was assigned an arbitrary value of 1000 U/ml. Seven standard concentrations made by 2-fold serial dilution were used in duplicates to generate the standard curve. Baseline cut-off OD values of 0.2 for sera and 0.1 for SWMF samples were established using CRP-negative serum samples from healthy controls, and SARS-CoV2 RT-PCR negative SWMF samples, respectively. An average of the replicates for each of the samples that were within the linear part of the standard curve was used as the final value in U/ml.
2.5. SARS-CoV-2 Spike Specific Secretory IgA (sIgA) ELISA
SWMF (dilution 1:2 to 1:16) samples were tested for anti-SARS-CoV-2 spike RBD sIgA using an in-house ELISA. High-binding microtiter plates (R&D Systems, USA) were coated with 0.5 μg/ml rSARS-CoV-2 spike RBD His tag antigen (R&D Systems, USA) overnight at RT. After washing and blocking as stated above, four serial dilutions for each of the samples were added and incubated for 2 hours at RT. The plates were washed and mouse anti-human secretory IgA monoclonal antibody (2.5 μg/ml; MC29-12, Invitrogen, USA) was added and incubated for 2 hours at RT. After washing, goat anti-mouse IgG (H+L) secondary antibody-biotin conjugate (0.065 μg/ml, Invitrogen, USA) was added and incubated for 2 hours at RT and the plates were then treated as above.
Four high positive SWMF were chosen and pooled to generate the standard curve. Seven serial 2-fold dilutions were made in duplicates for the standard curve from 1:2 of the pooled SWMF sample. The highest concentration of the standard curve was assigned an arbitrary value of 500 U/ml. Seven standard concentrations made by 2-fold serial dilution were used in duplicates to generate the standard curve. Baseline cut-off OD value of 0.05 was established using the same SARS-CoV2 RT-PCR negative SWMF samples used for total IgA assay above. An average of the replicates for each of the samples that were within the linear part of the standard curve (generated for total IgA) was used as the final value in U/ml.
The antibody levels (IgG, IgA, sIgA) in the SWMF samples were normalized over the salivary flow rate of the corresponding samples and expressed as U/ml/min.
2.6. Cytokine Assays
IL-17, IL-21 and IL-10 levels were tested at one month after each vaccination, while the levels of memory cytokines IL-7 and IL-15 were tested at 3-6 months after the second vaccination. IL-21, IL-7, IL-10 and IL-15 were determined by enzyme linked immunosorbent assay (ELISA), according to the manufacturer’s instructions (R&D systems, USA). Cytokine bead arrays (CBA) were performed on the paired serum and SWMF samples collected from 18 HCWs after three antigen challenges (either by vaccination and/or natural infection) using flow cytometry and the BD CBA flex beads for IL-2, IL-4, IL-12p70, IFN-γ, MIG, MCP-1, IL-8, TNF-α, IL-6, IL-1β, and IL-17 as per the manufacturer’s instructions. (BD FACS Lyric, BD Biosciences, USA). For SWMF samples, the total protein content was determined by the pyrogallol red molybdate method (Dimension Xpand, Siemens Healthcare, USA) to normalize the cytokines and chemokines in the SWMF samples. The cytokine levels (pg/ml) in the SWMF samples were divided by the total protein concentration (mg/ml) in the SWMF and expressed as pg/mg of total protein.
2.7. Statistical Analysis
The mean, median, standard deviation and quartile values were calculated using Microsoft Excel and Graphpad Prism 8.0. The statistical significance between the groups was calculated using Graphpad Prism 8.0 and the free online calculators from Social Science Statistics or Vassar Stats. Gender and age comparisons were performed using Chi-square tests and comparisons of independent means and paired means by t-test or Anova test. Comparisons of the medians in the box and whiskers plots were performed using the Mann-Whitney U test.
3. Results
Of the 205 cases analyzed in this study, 111 (54%) were CNG and 94 (46%) were CEG prior to vaccination. Demographic details of the 205 cases are shown in Table 1. The number of females recruited in the study was almost three times that of the males. There were no significant gender or age differences between CNG and CEG. However, a higher percentage of breakthrough infections (BTI; p=0.007) or re-infections (RI; p=0.008) was found in males compared with the females (Table 1).
3.1. Antibody Anergy in Previously COVID-19 Exposed Vaccinees but Not in Previously Vaccinated COVID-19 Patients
Among CNG, 78/111 (70%) developed serum anti-SARS-CoV2 spike Ig antibodies detectable at one month after their first vaccination and 104/111 (94%) at one month after the second vaccination. The median serum antibody response at one month after the first vaccination in CEG (median: 10152 U/ml) was significantly greater than CNG (median: 84 U/ml; p<0.0001; Figure 1A; Table 2). The serum antibody response in CNG at one month after the second vaccination (median: 856 U/ml) was still significantly lower than the antibody response in CEG at one month after the first vaccination (median: 10152 U/ml; p<0.0001; figure 1A; Table 2). The serum antibody response in CNG showed a statistically significant 6-fold increase at one month after the second vaccination (Figure 1A; Table 2) compared with the first vaccination (p<0.0001). In contrast, the median antibody level in CEG showed a statistically significant decline at one month after the second vaccination (median: 6986 U/ml; Figure 1A; Table 2) compared with the first vaccination (p=0.02).These findings suggest that the second vaccine dose boosts the antibody response in CNG, while it causes antibody anergy in CEG; and a natural SARS-CoV2 infection results in higher antibody response than vaccination.
Among CNG, 49/111 (44%) had developed BTI that were either mildly symptomatic (RT-PCR or RAT positive using nasopharyngeal swabs) or had had asymptomatic infection (had become anti-SARS-CoV2 nucleoprotein antibody positive at six months in the absence of symptoms). Among the vaccinated CEG, 25/94 (27%) developed RI that were either mildly symptomatic (RT-PCR or RAT positive) or asymptomatic. The number of BTI in CNG were significantly greater than the RI in CEG (p=0.01; Chi-square test with Yates correction for continuity). Longitudinal serum samples 3-6 months prior to the onset and after onset of BTI or RI were available for analysis of anti-SARS-CoV2 spike-specific antibody levels in 29 CNG and 20 CEG, respectively. The median antibody level in the BTI group prior to onset was 840 U/ml and after onset was 11800 U/ml (p=0.0007). In the RI group, the median antibody level prior to onset was 7924 U/ml and after onset was 26920 U/ml. (p=0.0004; Figure 1B). This suggests that a SARS-CoV2 infection in COVID-19 vaccinated individuals result in an increase in specific antibody response.
IL-10 is a regulatory cytokine that decreases T cell mediated proinflammatory response. Figure 1C shows that the IL-10 levels increase with every antigen challenge (infection or injection). The mean serum IL-10 level at one month after the first vaccination (1d-1m; Figure 1C) was greater in CEG (mean: 20pg/ml) compared with CNG (mean: 11pg/ml). At one month after the second vaccination (2d-1m), the IL-10 levels in CNG (mean: 24pg/ml) had increased 2-folds from 1d-1m and were now similar to those of CEG at 1d-1m time point. In the CEG, the IL-10 levels at 2d-1m (mean: 36pg/ml) increased markedly from 1d-1m (p=0.04; Anova test). Additionally, the IL-10 levels in the CEG at 2d-1m after three antigen challenges was statistically higher than CNG 1d-1m (p=0.0002; Anova test). Thus, an incrementing T cell regulatory response is evident with every antigen challenge.
3.2. Antibody Memory to SARS-CoV2 and Protection
A subset of 10/205 HCWs who were vaccinated for the third time were tested for serum and mucosal anti-SARS-CoV2 spike antibodies (Figure 2). The median serum Ig antibody titre at one month after the third vaccination (3d-1m; median: 13760 U/ml) was similar to the Ig antibody levels in CEG at 1d-1m (median: 10152 U/ml) suggesting a boost in antibody responses. Serum antibodies declined by 3-6 months (Figure 2A) after the third vaccination. The trends of the rise and decline of the serum antibodies after three vaccinations were similar to that after two vaccinations. Taken together, the data suggests that there is an antibody memory in the host immune system that gets activated upon subsequent exposures and the antibody levels are short lived.
3.3. Mucosal Antibodies Elicited by Vaccination/Natural Infection
We next measured the mucosal IgA (monomer + dimer) and the secretory IgA (sIgA; dimer) antibodies against SARS-CoV2 spike protein in SWMF samples of the 10 HCWs who took the third vaccination at one month and six months. IgA (Figure 2B) and sIgA antibodies (Figure 2C) were detectable at both the time points tested and declined in most of the HCWs by six months.
Additionally, we followed 5/205 vaccinated HCWs through an episode of COVID-19 up to three months from disease onset. Anti-SARS-CoV2 spike IgG, IgA and sIgA antibodies were tested in serum and SWMF at onset, one month and three months, which was 11-12 months, 12-13 months and 14-15 months correspondingly, from the time of their first COVID vaccination. Both serum IgG (Figure 3A) and serum IgA (Figure 3C) antibodies showed a similar trend of rise in levels by 12-13 months and then a decline by 14-15 months in the majority (Figure 3). SWMF IgG (Figure 3B) and IgA (Figure 3D) antibody levels were lower than their concomitant serum samples by almost 2-3 orders of magnitude. The majority showed a similar pattern of a rise in SWMF sIgA antibody at one month and a fall at two months (Figure 3E).
We analyzed the relationship between the anti-SARS-CoV2 spike antibodies in serum and SWMF samples in 15 HCWs for IgG, IgA and sIgA antibodies post vaccination with or without COVID-19 exposure (Figure 4).Statistically significant correlations were seen between the serum and SWMF IgG antibodies (Figure 4A) and IgA (Figure 4B) antibodies. The Spearman rank correlation and p values are given in figure 4F as a table inset. There were negative correlations between IgG (Figure 4C) and IgA (Figure 4D) antibodies in both the serum and SWMF, but these were not statistically significant. IgA and sIgA antibodies in SWMF showed a statistically significant direct correlation (Figure 4E). Thus, transudation of serum IgG and IgA antibodies into the oral cavity as well as local sIgA antibody production was evidenced.
3.4. Cytokines Indicate Sustained Innate Mucosal Immunity
We additionally determined the cytokines (IL-17, IL-21, IL-7 and IL-15) that are known to be secreted upon the activation of CD4+ helper T cells that are generally involved in the activation and maintenance of B cells. Low levels of serum IL-17 were detected in 106/192 (55%) vaccinees tested at one month after the first vaccination (Figure 5). CEG elicited significantly higher levels of IL-17 compared with CNG, both after the first (p=0.005; Anova test) and second (p=0.0004; Anova test) vaccinations. This increase in IL-17 (a key player in mucosal immunity) levels with every antigen challenge (either from the vaccine or the natural infection) suggests a potential role for trained mucosal immunity.
Low levels of serum IL-21 were detected in 104/190 (55%) vaccinees at one month after the first (1d-1m) and second (2d-1m) vaccinations with no significant difference between CNG and CEG (Table 2). The mean IL-7 and IL-15 levels were also only marginally elevated in the vaccinees irrespective of the COVID-19 exposure before or after the vaccination (Table 2).
Lastly, we analysed the levels of selected innate and adaptive immunity mediators in the paired serum and SWMF samples from 18 HCWs after the three antigen challenges (vaccinations and/or natural infections). IL-2, IL-4, IL-12p70, IL-17, IFN-γ and TNF-α were not detected in serum and SWMF samples at one and 3-6 months post last vaccination. Cytokines and chemokines primarily secreted by monocytes and macrophages – MIG, MCP-1, IL-6, IL-8 and IL-1β were detected in both serum and SWMF samples (Figure 6). The mean levels of these cytokine/chemokine were significantly higher in SWMF than serum for MIG (1m: serum-74pg/ml; SWMF-417pg/mg; p=0.02; 3-6m: serum-90pg/ml; SWMF-580pg/mg; p=0.0007; Figure 6A), MCP-1 (1m: serum-137pg/ml; SWMF-224pg/mg; 3-6m: serum-61pg/ml; SWMF-344pg/mg; p=0.01; Figure 6D), IL-8 (1m: serum-910pg/ml; SWMF-1262pg/mg; 3-6m: serum-189pg/ml; SWMF-1653pg/mg; p=0.0004; Figure 6J) and IL-1β (1m: serum-28pg/ml; SWMF-491pg/mg; p=0.0003; 3-6m: serum-2pg/ml; SWMF-439pg/mg; p=0.0007; Figure 6M). In contrast, IL-6 levels were significantly higher in serum than SWMF at one month (1m: serum-510pg/ml; SWMF-22pg/mg; p=0.01; 3-6m: serum-19pg/ml; SWMF-28pg/mg; Figure 6G), but by 3-6 months the serum levels had declined significantly.
Additionally, a sustained trend in the SWMF samples between the first month and 3-6 months was found. (Figure 6). In contrast to serum where levels of MCP, IL-6, IL-8, and IL-1β all fell over this period, those in SWMF were all maintained. IL-10 and IL-21 levels were detectable but values were low (data not shown). Taken together, this preliminary study on a subset of 18 HCWs suggest an innate immune response involvement, which lasts longer in the oral mucosa than the periphery. Considering that SWMF is swallowed and renewed, this suggests the continuing presence of local active immune processes post infection/vaccination.
4. Discussion
COVID-19 has provided great opportunities for understanding the immune responses to the disease with and without the context of vaccination. In this study, we were able to analyze the antibody responses in both serum and mucosal secretions and relate them to the subsequent susceptibility to SARS-CoV2 infections. The findings suggested that antibody levels in both fluids were directly related to protection from disease severity, and further that longer lived mucosal cytokine responses may also contribute to protection.
This study has found that two vaccinations in CNG result in a systemic antibody boost and that a second vaccination in CEG induces systemic antibody anergy as demonstrated by a significant decline in the serum antibody levels after the second vaccination and increasing IL-10 levels. A similar anergic effect was shown by Lozano-Ojalvo et al where the antibody responses in the previously infected vaccinees plateaued after the first vaccination [6]. Thus an antigen boost at the time of higher circulating antibodies causes antibody anergy. If the degree of protection is directly related to antibody titre, then determination of circulating antibody levels before a vaccine boost may be beneficial. However, this antibody anergy was not evident when natural infection occurred after vaccination. During a natural infection acquired post-vaccination, a range of functionally active antibodies against the invading virus are produced, whereas vaccinations activate only targeted B cell repertoires. This could potentially explain antibody anergy during vaccination post natural infection but not vice-versa.
Rapidly declining serum antibodies with minimal T cell cytokines raises concerns over their durability in subsequent virus exposures. The nature and extent of the antibodies induced by the Covishield vaccine in our study is similar to other studies with the Astra Zeneca vaccine as well as other mRNA vaccines [6,9,10]. The antibody responses elicited by a natural infection was significantly higher than those elicited by vaccination as shown in CEG, BTI and RI. The serum antibody response elicited in CNG after two vaccinations indicates a prime-boost response. This booster response was evidenced after each subsequent vaccination. The antibodies also declined proportionately by 3-6 months. Our findings corroborate with the finding of poor germinal centre formation shown at the tissue level in autopsy samples of COVID-19 patients [11]. However, studies have shown that T cells and B cells from vaccine primed individuals can be induced in vitro by SARS-CoV2 spike peptides [6,7,12], suggesting the presence of memory T cell and B cell pools. Our findings of a robust rise in antibody levels at the onset of COVID-19 in vaccinees reiterate the presence of a T cell/B cell memory pool; however, the circulating antibodies are short-lived in the host, raising concerns over a number of host factors that govern robust humoral immunity. These include inducing long lasting antibody titres that are durable and highly avid, isotype changes and protective effect of serum antibody titres at the mucosal surfaces. B cells are activated to elicit a humoral response both by the antigen itself as well as by the antigen-specific T cells. Only a T cell dependent B cell response can provide a long lasting immunity with a robust memory pool [1].
Natural SARS-CoV2 infection elicited a higher antibody response post-vaccination. Similarly, vaccination post-SARS-COV2 infection boosted significantly high antibody levels. A recent study by Garziano et al [13] has shown that the neutralizing activity of the antibodies is higher in vaccinees exposed to natural infection and that these antibodies neutralize OC43, another human coronavirus within the first three months of exposure [13]. Thus the breadth and magnitude of the antibody responses after a natural infection are higher than that of vaccination. This could be attributed to the exposure to a larger repertoire of antigenic epitopes and to a longer stimulus due to potential biological amplification of the virus in the host.
Higher class switching to IgA antibodies, presence of IgA and sIgA antibodies in the oral mucosa and sustained innate cytokines emanating from the oral mucosa may result in earlier virus clearance and influence quicker remission. A rise and decline antibody pattern in concomitant serum and SWMF samples in eight vaccinees after the third vaccine dose suggests that there is a transudation of the antibodies into the oral cavity, probably through the crevicular spaces in the teeth pockets, which would confer local protection during subsequent virus exposures. In both natural and acquired infections there was a minimal elicitation of IL-17, an important cytokine responsible for mucosal immunity. Even though the IL-17 levels were quite minimal, there was a statistically higher response in CEG compared to CNG. Overall mucosal immunity may be very relevant in protection against infection and the presence of anti-SARS-CoV2 antibodies (especially sIgA) in the SWMF samples found in this study could contribute to such protection at the mucosal surfaces. However, a small sample size poses limitations for firm conclusions. Utilizing the SWMF samples to understand the role of mucosal immunity against SARS-CoV2 may be productive and also suggestive of a role for trained mucosal immunity [8].
In conclusion, two vaccinations in CNG results in a systemic antibody boost but a second vaccination in CEG induces systemic antibody anergy; while a BTI or RI in vaccinees boosts antibody levels probably due to the immunogenic effects of an active virus infection. The specific antibody responses are short lived probably due to the minimal elicitation of T cell / B cell cytokine responses. However, the marked antibody rise after every exposure suggests an underlying T cell / B cell memory pool. The short-lived immunity suggests the need for frequent boosters in order to maintain circulating antibodies that could confer protection against disease severity. Vaccine boosters should be spaced at least six months after a natural infection to avoid antibody anergy.
Increasing serum IL-17 levels with subsequent exposures and the presence of IgA/sIgA antibodies specific to the spike protein as well as sustained innate immunity cytokines in the oral cavity indicate a robust mucosal immune response, which probably contributes to the reduction in morbidity/mortality during subsequent SARS-CoV2 infections. The observation that complete protection was not achieved in some individuals could be attributed to viral factors such as mutations of the structural proteins or host factors including changes in the titre, avidity or isotype of the antibodies, or that antibodies are not present in sufficient amounts at the mucosal sites of infection. Further in-depth explorations of the mucosal innate immune response at various stages of the disease may be informative.
Author Contributions
Conceptualization – PK, SJC; Methodology – PK, SJC; Formal analysis – PK; Investigation – MLE, PM, AG; Resources – MLE, PM, AG; Data curation – PK, SJC; Writing (original draft preparation, review and editing) – PK, SJC; Visualization – PK, SJC; Supervision – PK, NK; Project administration – PK; Fund acquisition – PK.
Funding
This work was supported by Intramural GPR funds [VHS/RG/2021/003], The Voluntary Health Services, Chennai, India and Indo-UK Collaborative project [BT/IN/Indo-UK/02/PK/2021-22 (Computer No. 13580)], Department of Biotechnology, Government of India, New Delhi, India.
Declaration
Authors have no conflict of interest.
References
- Siegrist, C.A. Vaccine Immunology. In: Plotkin’s Vaccines 2018; pp.16-34.e7. [CrossRef]
- Agarwal, S., Sakre, M., Ravi, R. et al. COVID-19 19 vaccination: saviour or unfounded reliance? A cross sectional study among the air warriors. Med. J. Armed Forces India 77(S2) (2021) S502-S504. [CrossRef]
- Bobdey, S., Kaushik, S.K., Sahu, R. et al. Effectiveness of ChAdOx1 nCoV-19 vaccine: experience of a tertiary care institute. Med. J. Armed Forces India 77(S2) (2021) S271-S277. [CrossRef]
- Ghosh, S., Shankar, S., Chatterjee, K. et al. Covishield (AZD1222) vaccine effectiveness among healthcare and frontline workers of Indian Armed Forces: interim results of VIN-WIN cohort study. Med. J. Armed Forces India 77(S2) (2021) S264-S270. [CrossRef]
- Muthukrishnan, J., Vardhan, V., Mangalesh, S. et al. Vaccination status and COVID-19 related mortality: a hospital based cross sectional study. Med. J. Armed Forces 77(S2) (2021) S278-S282. [CrossRef]
- Lozano-Ojalvo, D., Camara, C., Lopez-Granados, E. et al. Differential effects of the second SARS-CoV2 mRNA vaccination on T cell immunity in naïve and COVID-19 recovered individuals. Cell Rep. 36 (2021) 109570. [CrossRef]
- Stephenson, K.E., Le Gars, M., Sadoff, J. et al. Immunogenicity of the Ad26.COV2.S vaccine for COVID-19. JAMA 325 (15) (2021) 1535-1544. [CrossRef]
- Nasab, S. D. S. , Eniya, M. L., Judith, A., et al. Detection and consistency of mucosal fluid T lymphocyte phenotypes and their relationship with blood, age and gender. J Immunol Methods. 2024; 532: 113731. [CrossRef] [PubMed]
- Shrotri, M. Shrotri, M., Navaratnam, A.M.D., Nguyen, V. et al. Spike-antibody waning after second vaccination of BNT162b2 or ChAdOx1. Lancet 2021. [CrossRef]
- Hall, V.J., Foulkes, S., Saci, A. et al. COVID-19 vaccine coverage in health-care workers in England and effectiveness of BNT162b2 mRNA vaccine against infection (SIREN): a prospective, multicentre, cohort study. Lancet 397 (2021) 1725-35.
- Kaneko, N., Kuo, H., Boucau, J. et al. Loss of Bcl-6-expressing T follicular helper cells and germinal centers in COVID-19. Cell 183 (2021) 143-157. [CrossRef]
- Haralambieva, I. H., Monroe, J. M., Ovsyannikova, I. G. et al. Distinct homologous and variant-specific memory B-cell and antibody response over time after severe acute respiratory syndrome coronavirus 2 messenger RNA vaccination. J. Infect. Dis. 26(1) (2022) 23-31. [CrossRef]
- Garziano, M., Fiestas, M. C., Vanetti, C. et al. SARS-CoV2 natural infection but not vaccine-induced immunity elicits cross-reactivity to OC43. Heliyon. 10 (2024) e37928. [CrossRef]
Figure 1.
Serum anti-SARS-CoV2 spike Ig antibodies and IL-10 levels in COVID-19-naïve (CNG) and COVID-19-exposed (CEG) groups.n is the number of samples in each group A: Antibodies at one month after the first and second vaccinations. Y-axis denotes logarithmic concentration of the antibodies (U/ml).The box denotes 10th-90th percentile values of each group.Symbols denote the minimum and maximum values.The p values by Mann-Whitney U test.B: Serum anti-SARS-CoV2 spike Ig antibody responses prior to and at onset of BTI and RI.Y-axis denotes logarithmic concentration of the antibodies (U/ml).The box denotes 10th-90th percentile values of each group.Symbols denote the minimum and maximum values.The p values by paired t-test. C: Levels of IL-10 in CNG and CEG.Black circles - CNG; black squares – CEG.Y-axis denotes concentration of serum IL-10 (pg/ml). The p values paired t-test.Mean±SD.
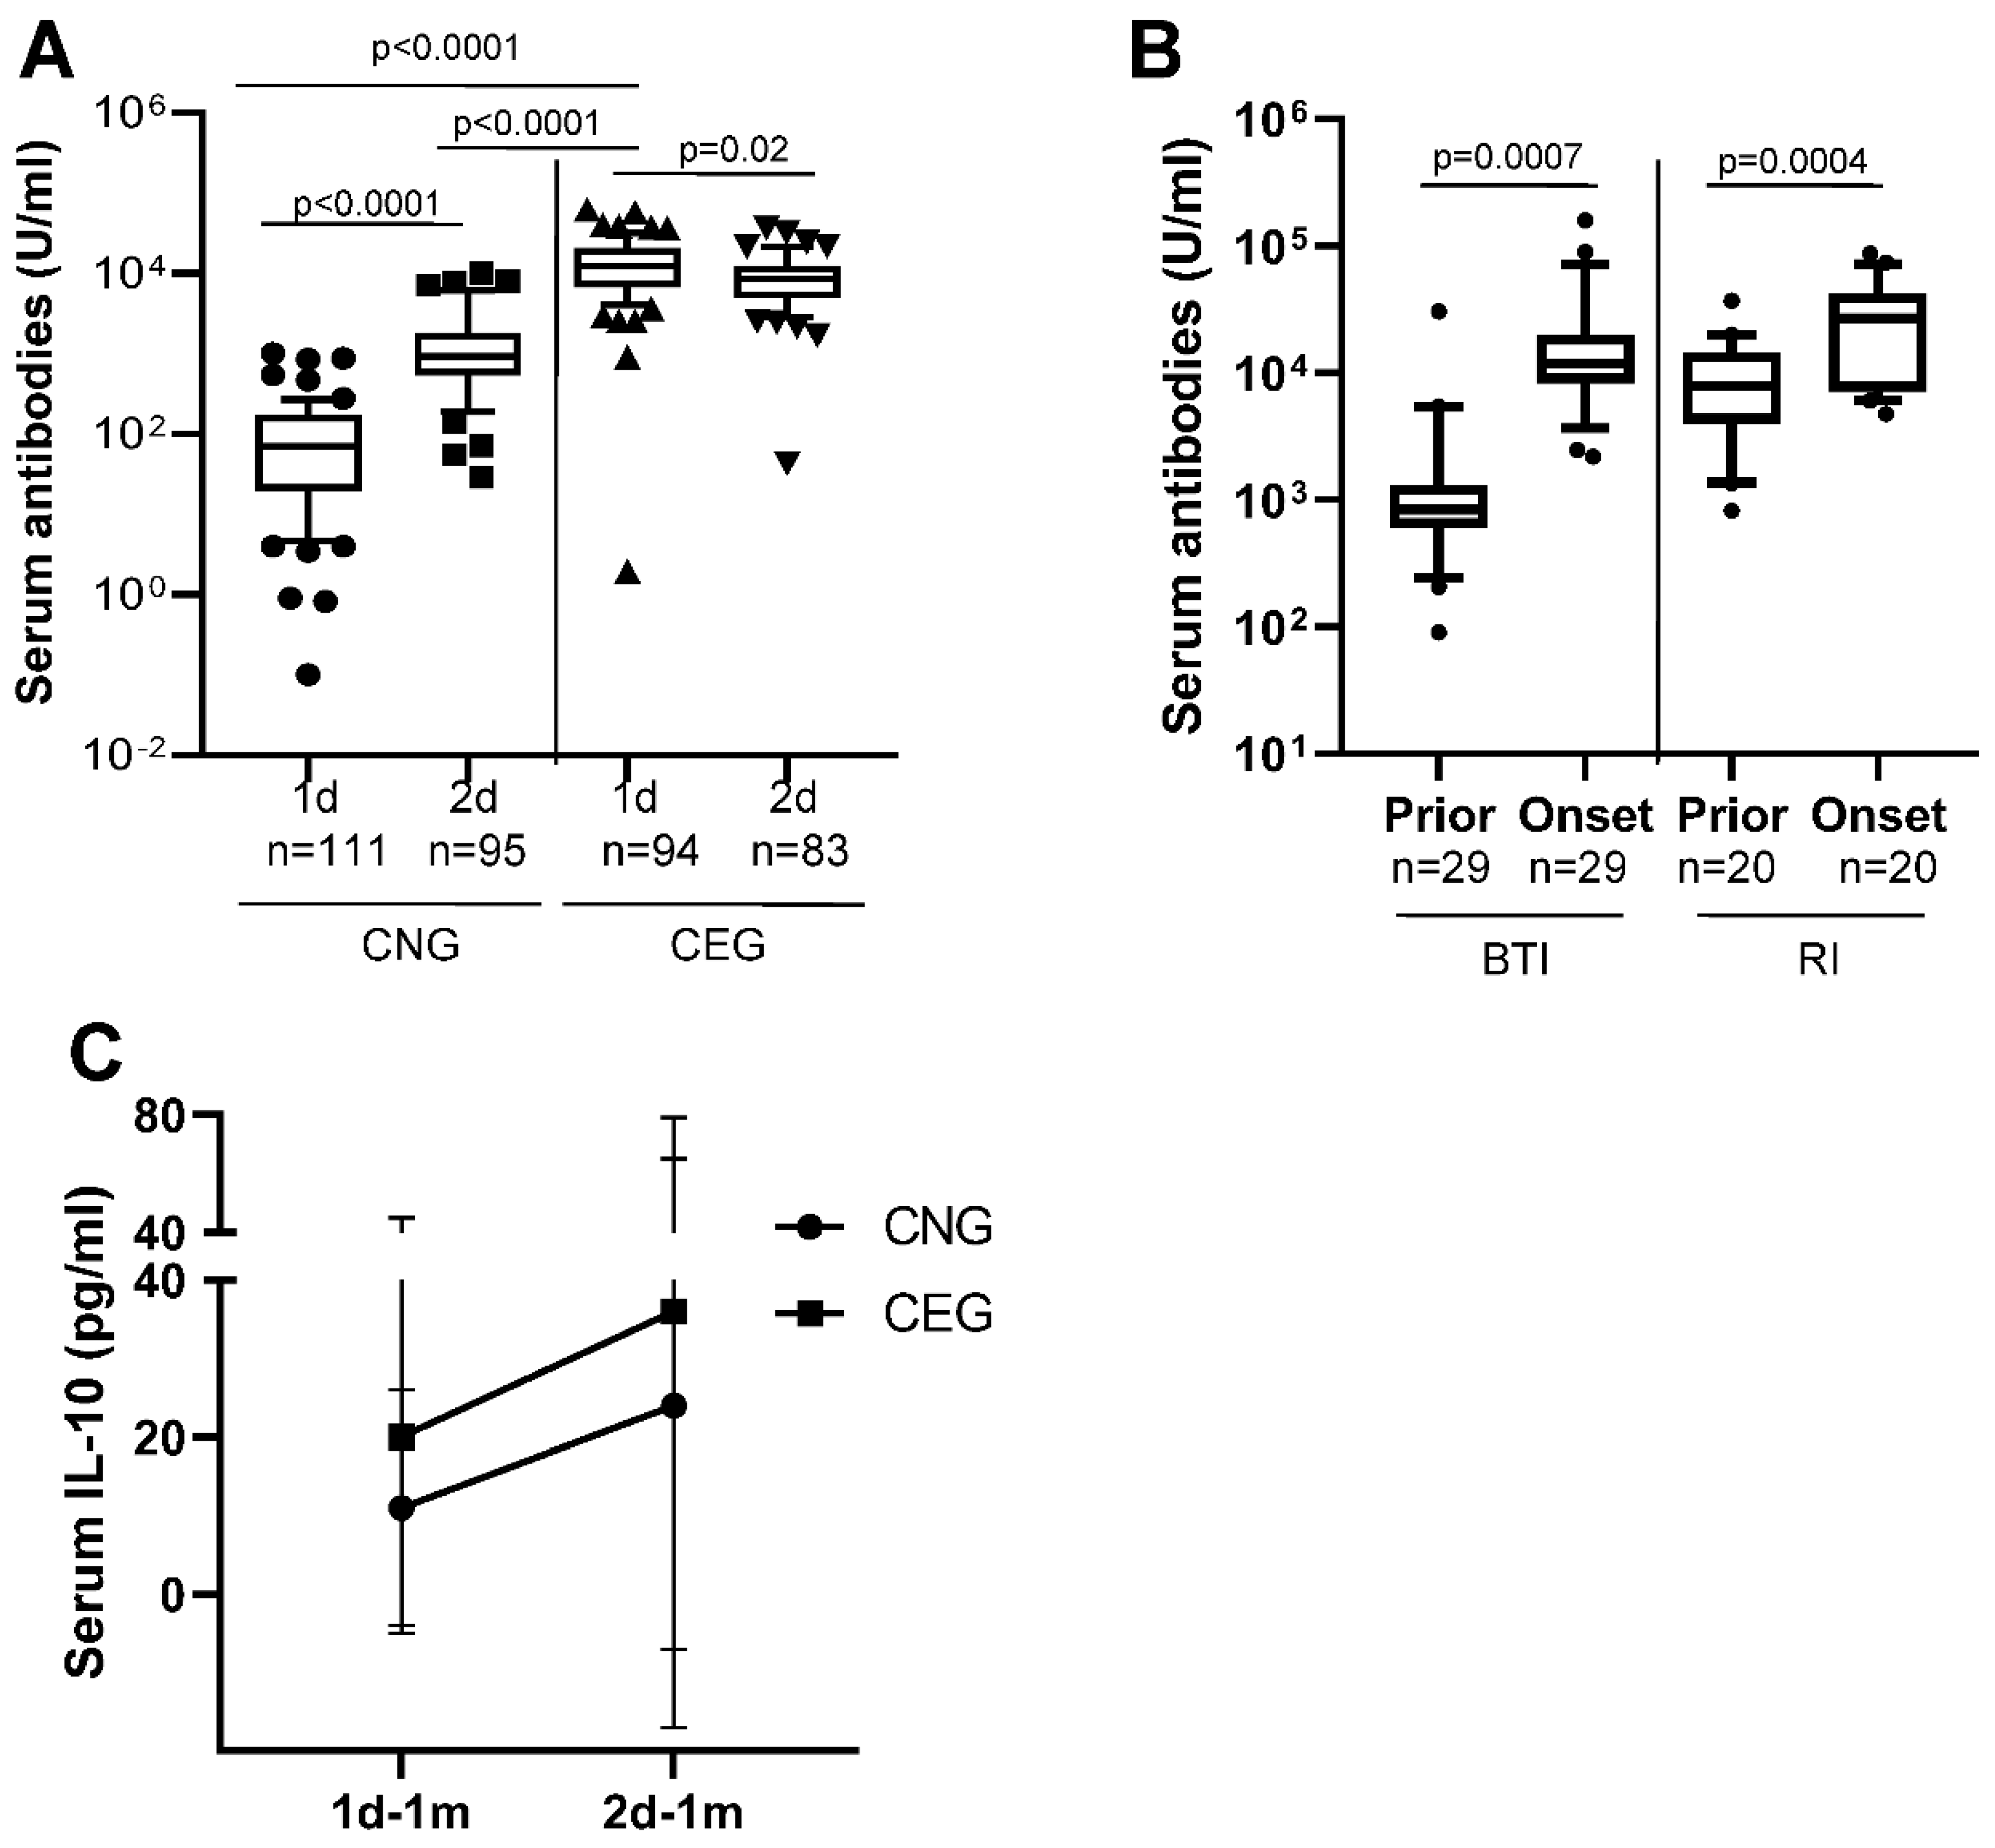
Figure 2.
Anti-SARS-CoV2 spike antibody elicitation in SWMF after COVID-19 vaccination. N = number of samples in each group, d denotes vaccination dose and m denotes months A: Anti-SARS-CoV2 spike Ig antibodies after third vaccination in serum. Y-axis denotes the concentration of the antibodies (U/ml). The box denotes 10th-90th percentile values of each group. Symbols denote the minimum and maximum values. B: Anti-SARS-CoV2 spike IgA antibodies in SWMF samples. Each HCW is denoted by a different symbol. C: Anti-SARS-CoV2 spike sIgA antibodies in SWMF samples. Each HCW is denoted by a different symbol.
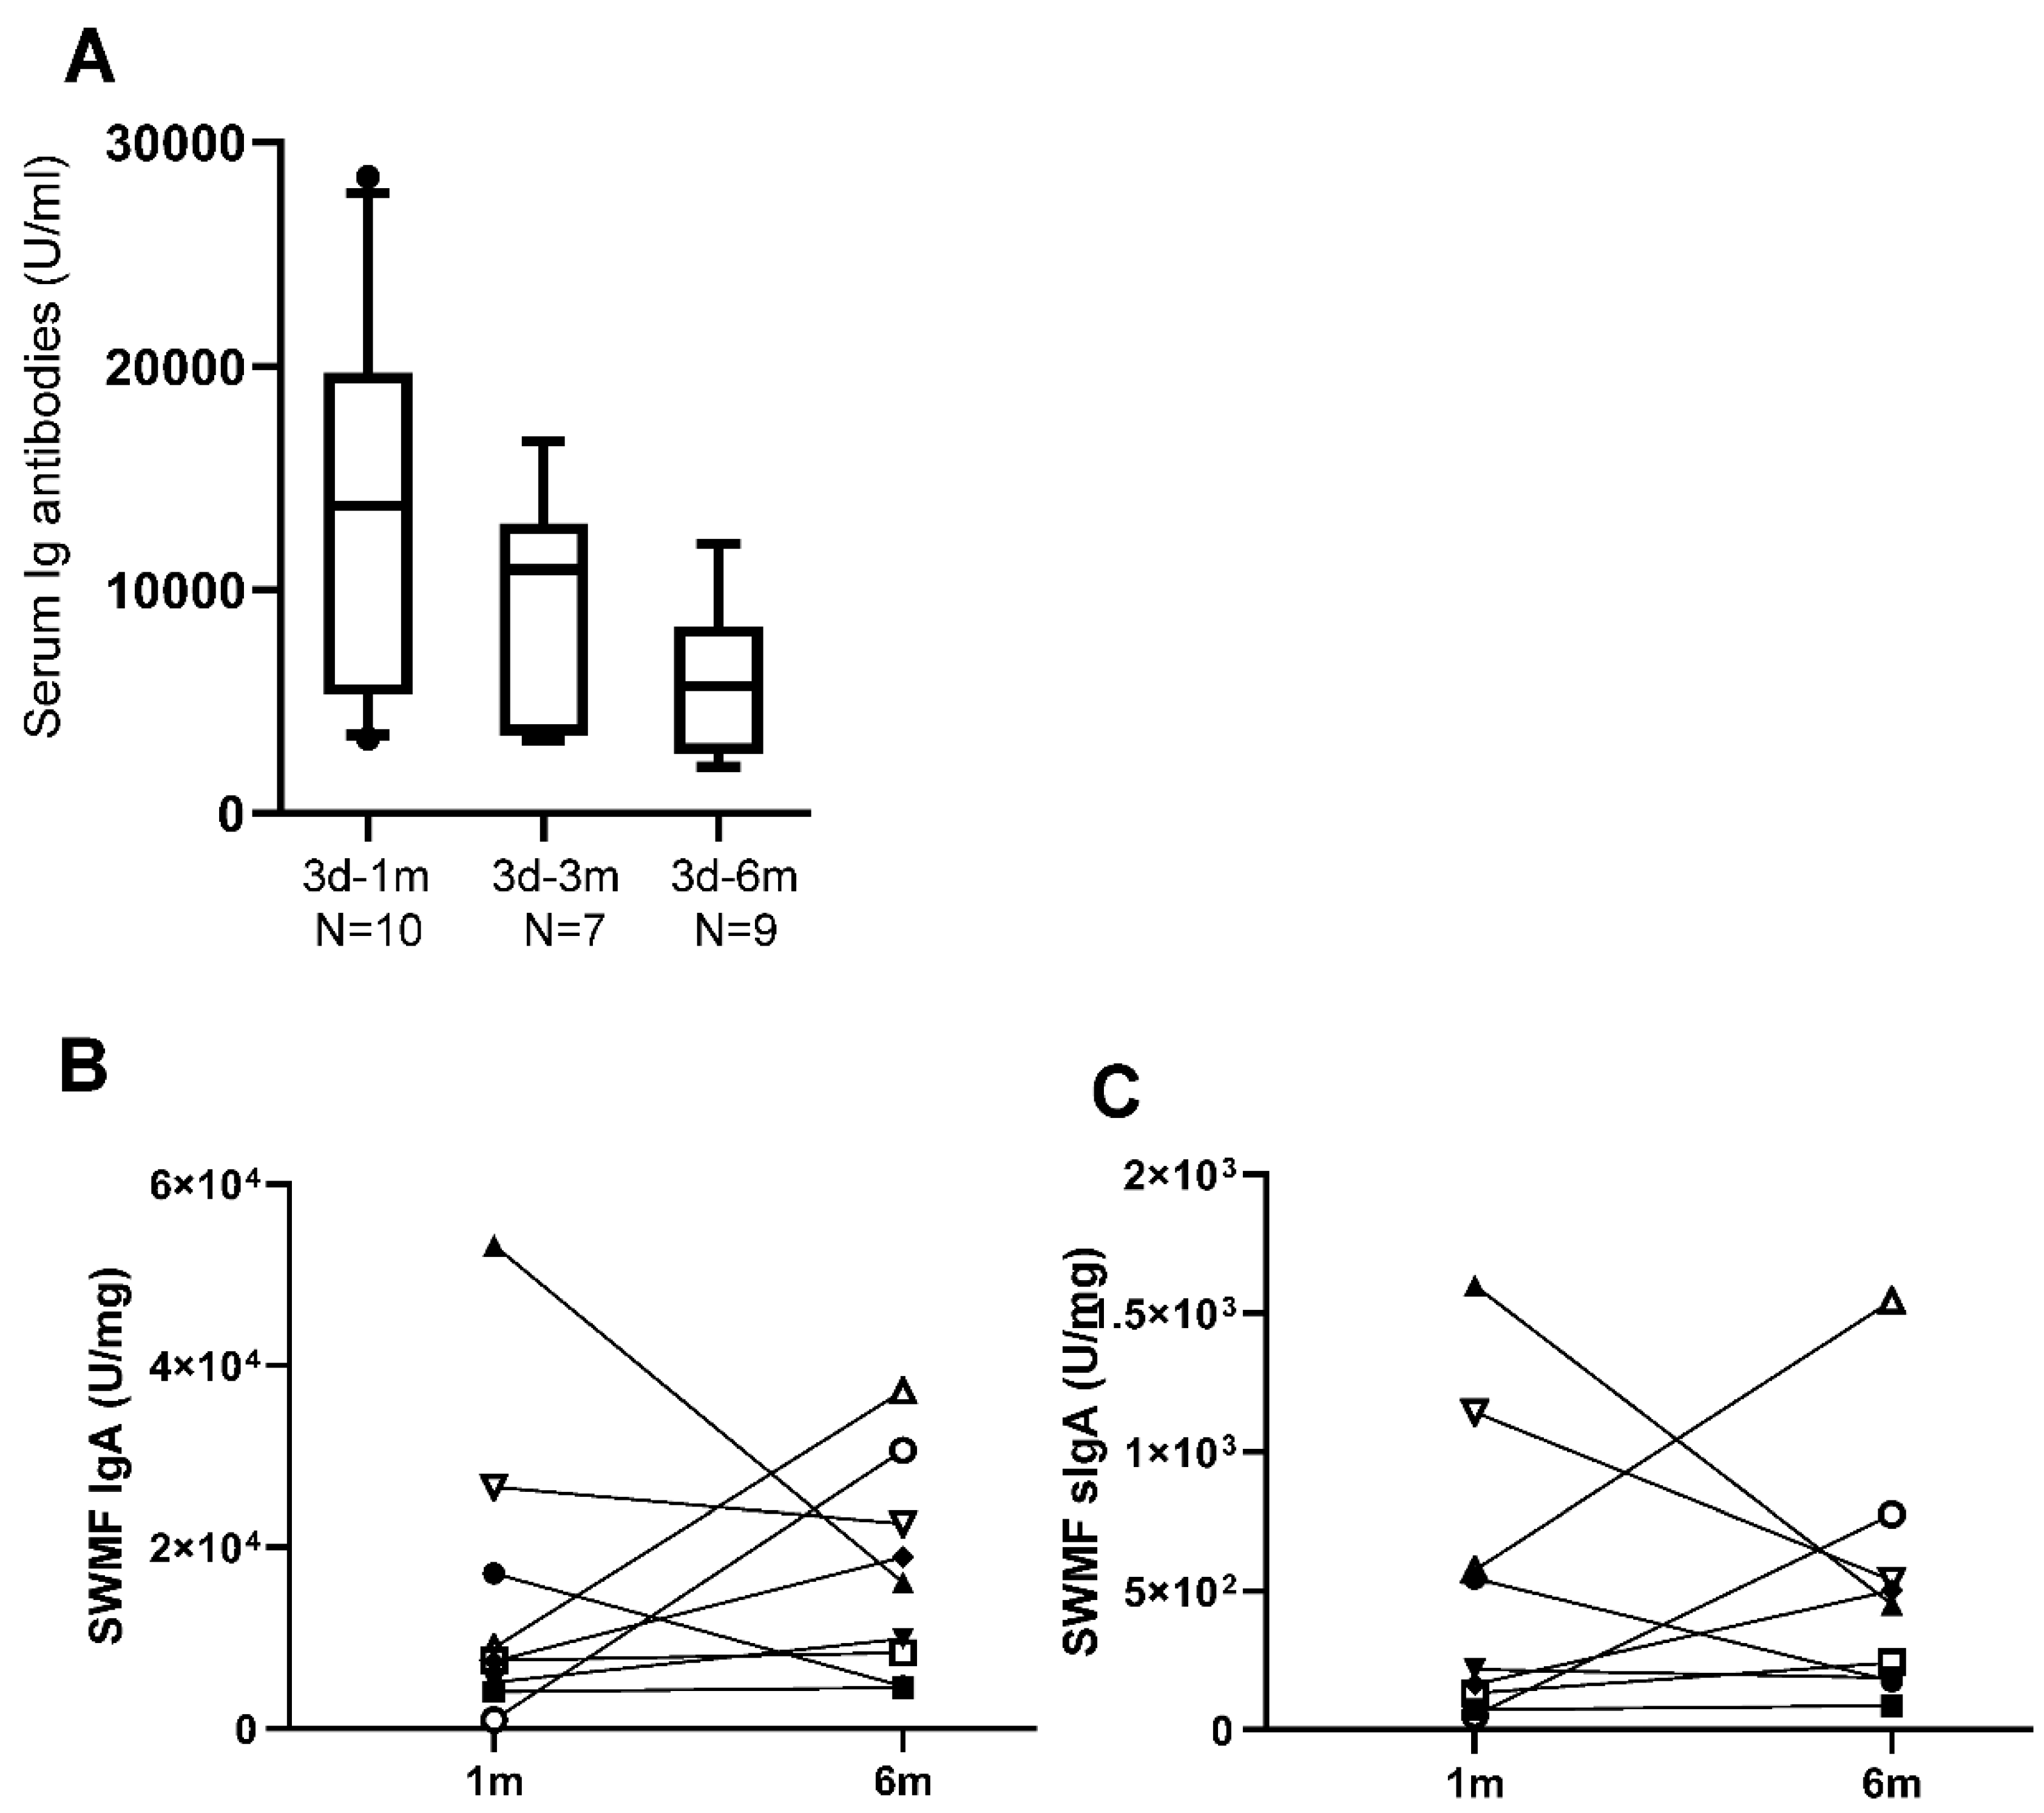
Figure 3.
Longitudinal trends of IgG, IgA and sIgA antibodies in serum and SWMF of five vaccinated HCWs after an episode of COVID-19. Each HCW is denoted by a different symbol. m denotes months. A: Serum IgG antibodies. B: SWMF IgG antibodies. C: Serum IgA antibodies. D: SWMF IgA antibodies. E: SWMF sIgA antibodies.
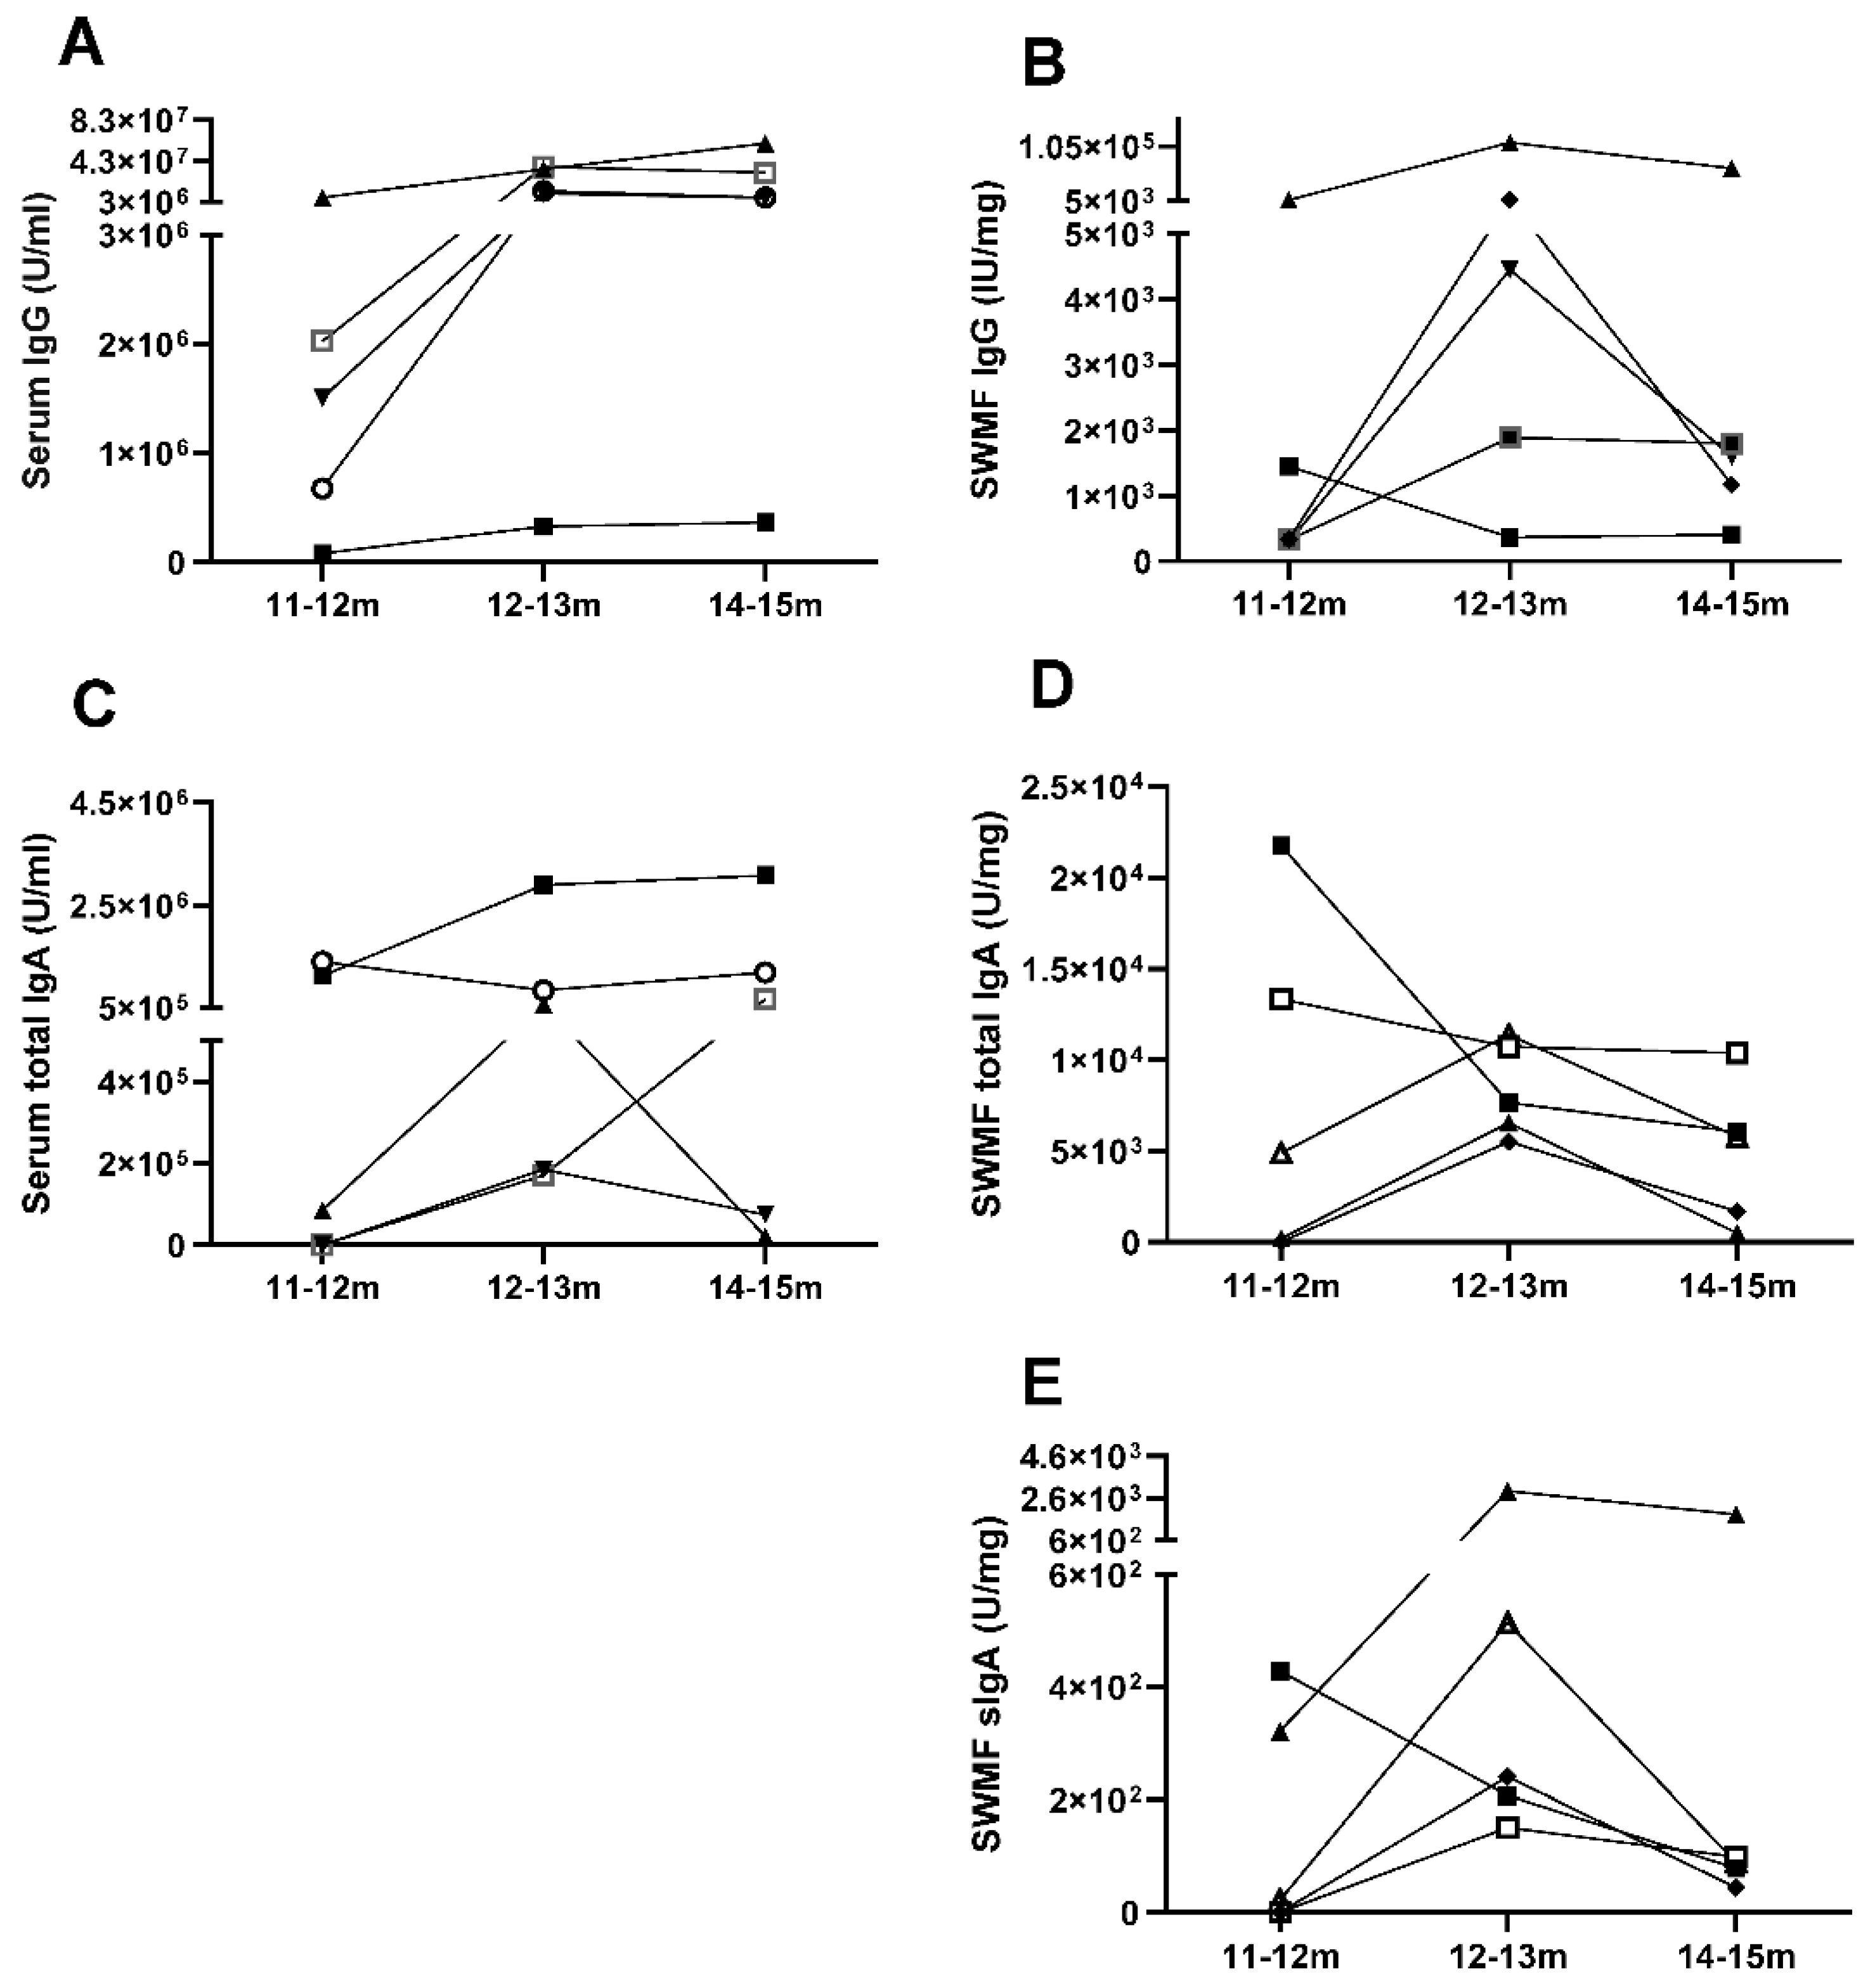
Figure 4.
Correlation of anti-SARS-CoV2 spike IgG, IgA and sIgA antibodies in concomitant serum and SWMF samples. A: Serum IgG vs SWMF IgG. B: Serum IgA vs SWMF IgA. C: Serum IgG vs Serum IgA. D: SWMF IgG vs SWMF IgA. E: SWMF IgA vs SWMF sIgA. F: Table inset shows the Spearman rank correlation values. N is the number of samples; r is the correlation co-efficient and p is the p-value.
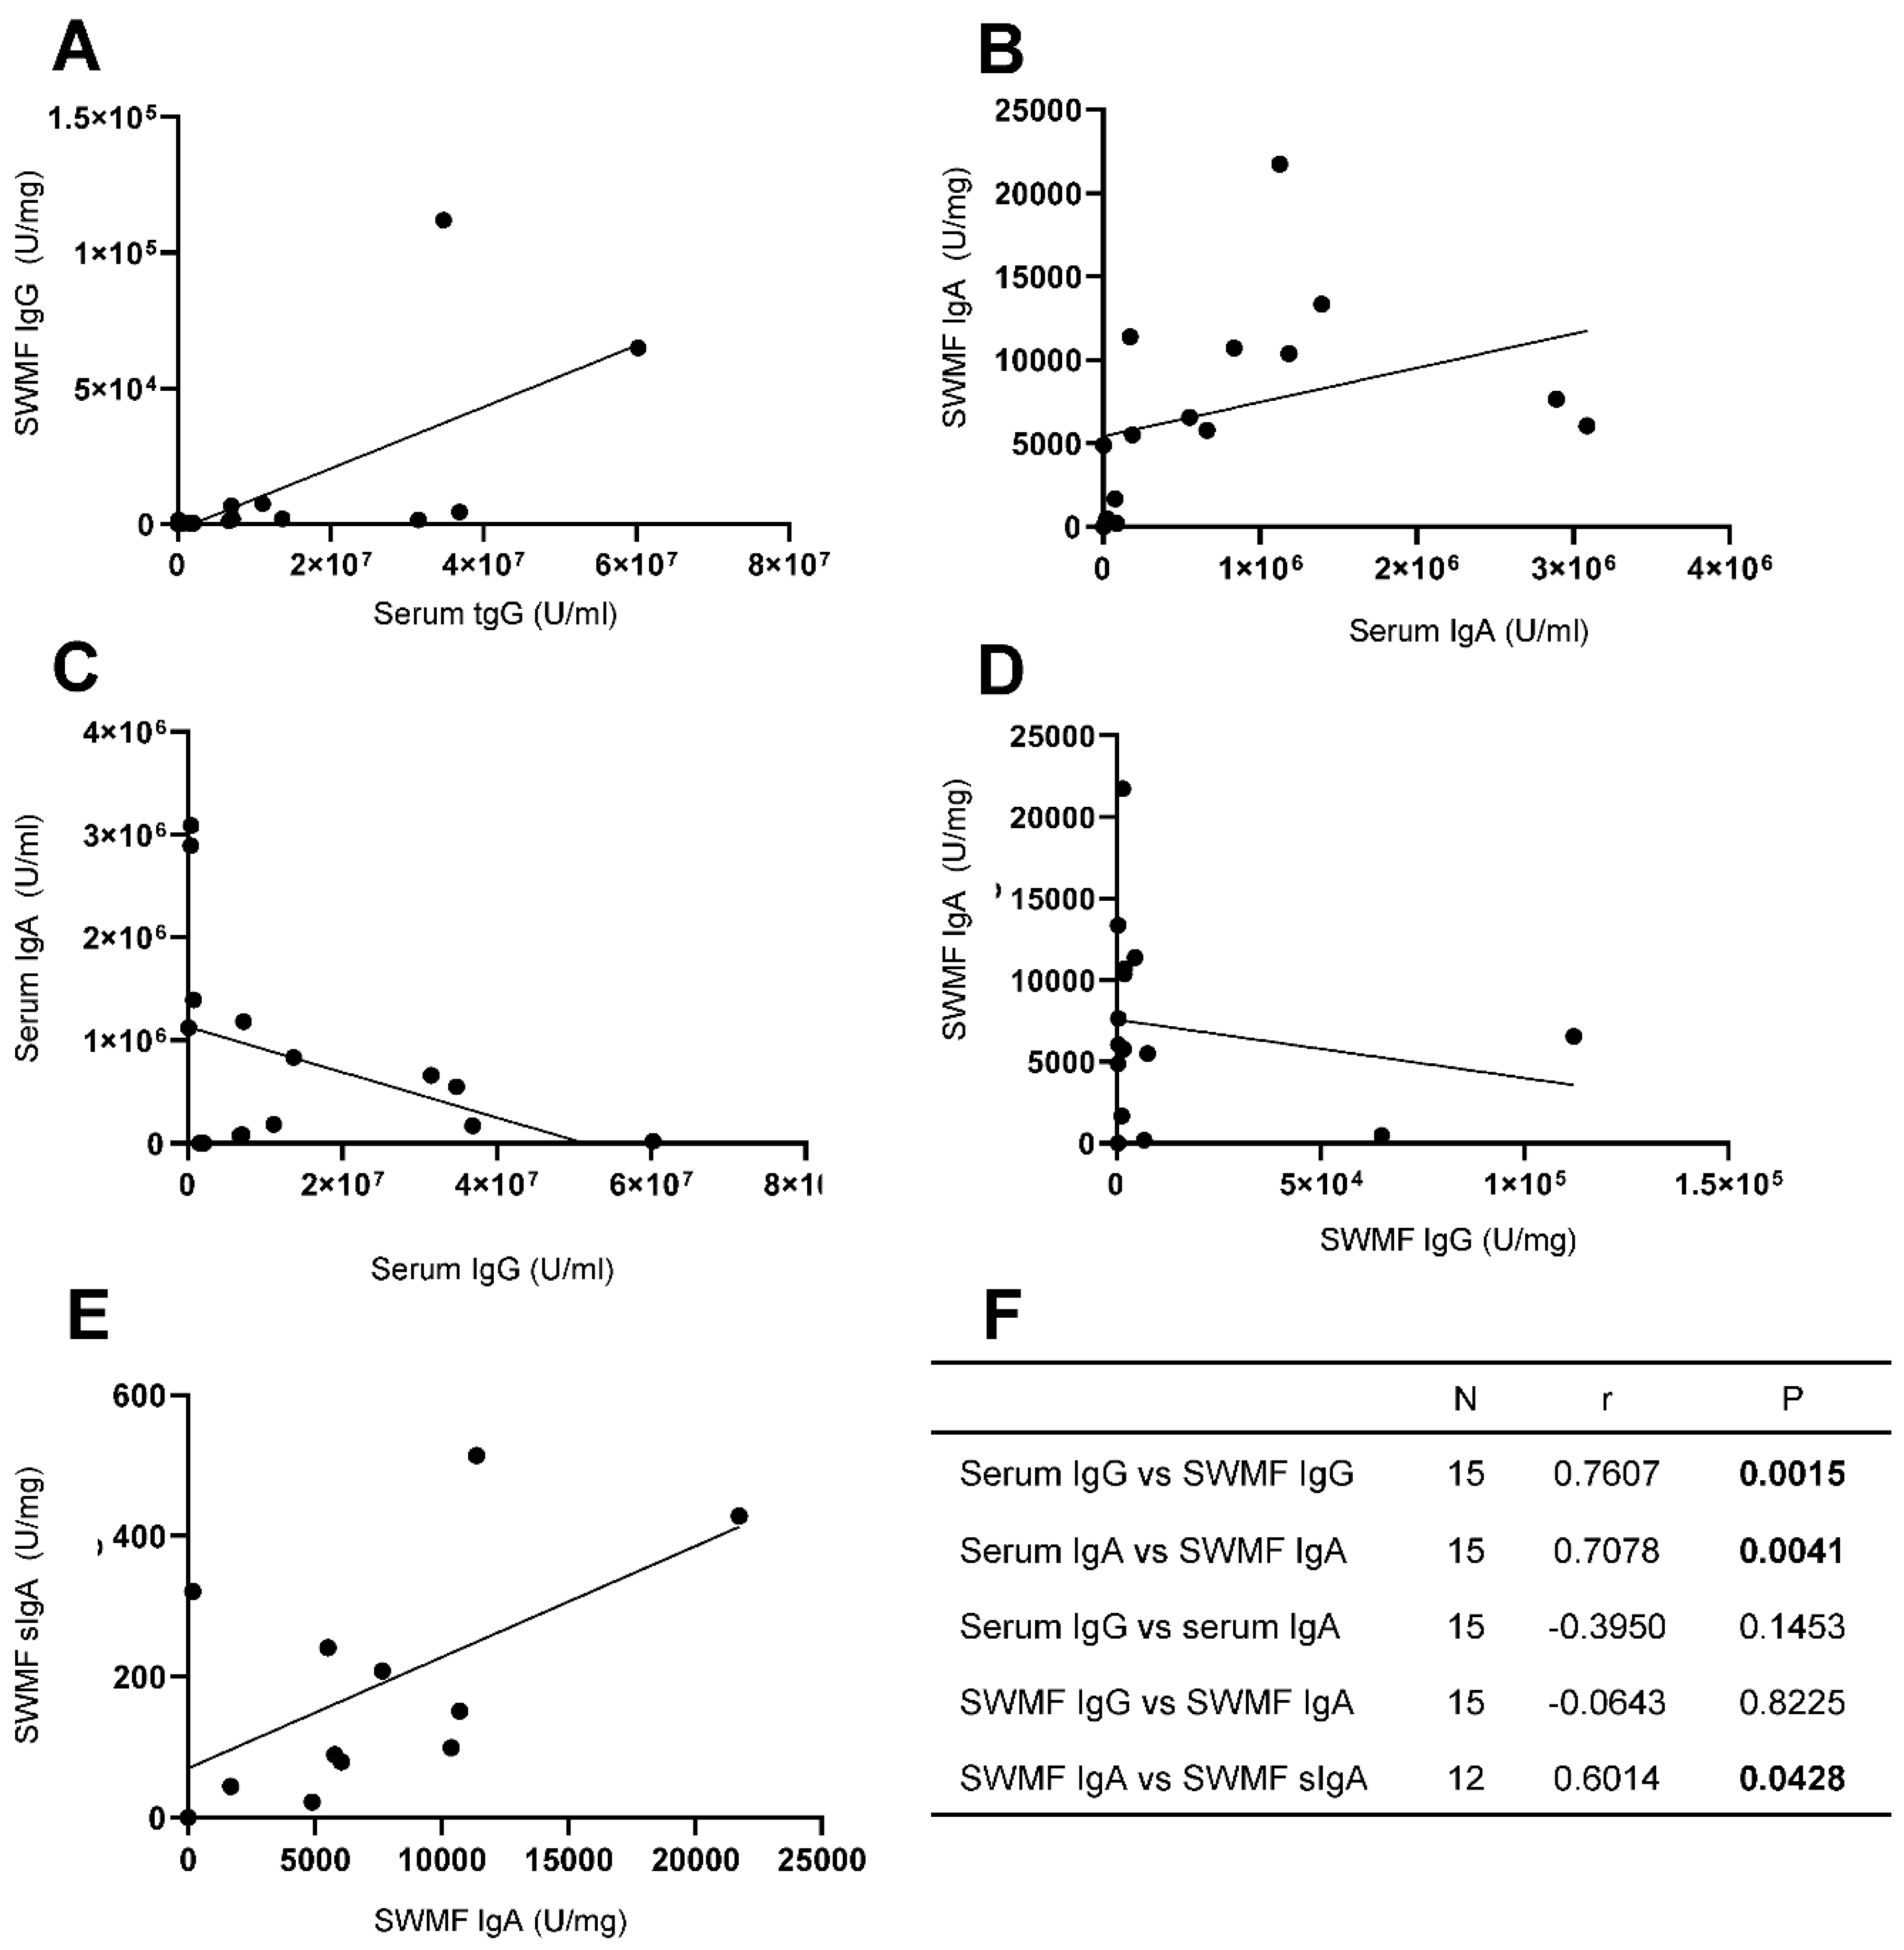
Figure 5.
Levels of serum IL-17 detected in the COVID-19-naïve (CNG) and COVID-19-exposed (CEG) groups. The X-axis denotes the time points – 1d-1m: one month after the first vaccination; 2d-1m: one month after the second vaccination. n denotes the number of samples. Bars show the mean ± SD for each group. Y axis denotes the serum concentration of IL-17 in pg/ml. p values using Anova test for independent means.
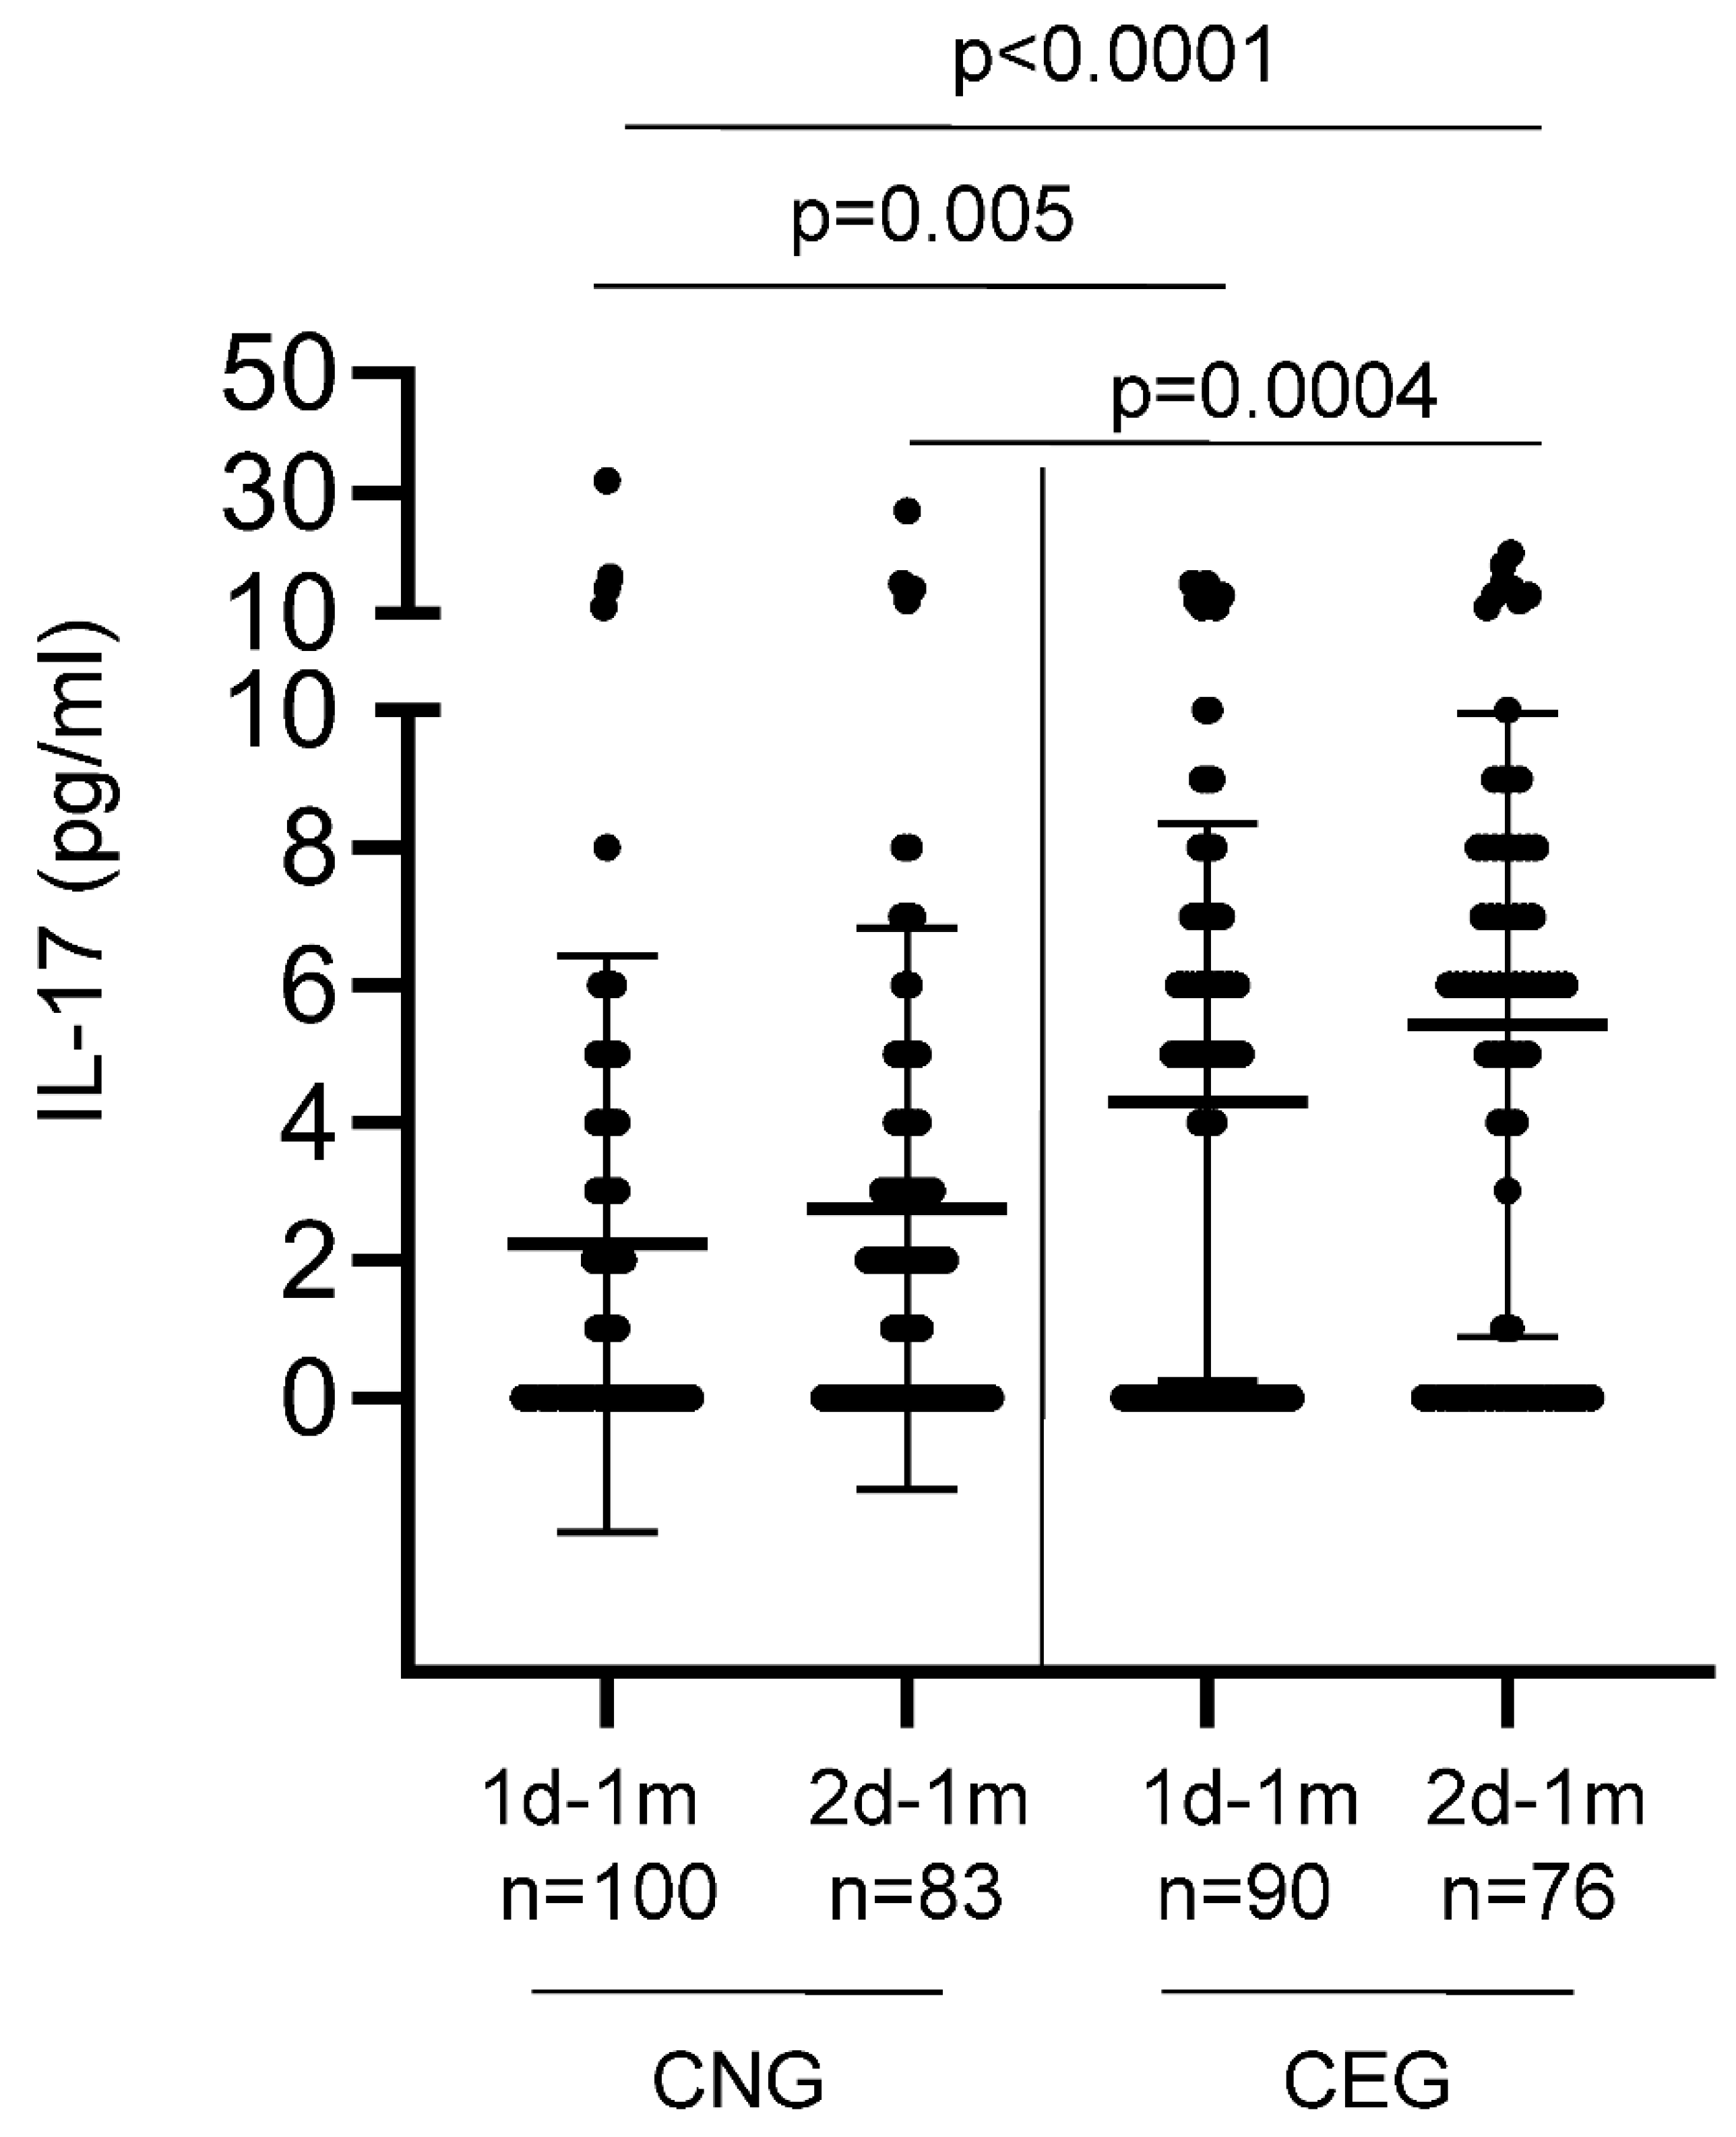
Figure 6.
Comparison of cytokines and chemokines in serum and SWMF samples in 18 HCWs at one month (1m) and 3-6 months (3-6m) after the three antigen challenges. Concentration of the cytokines/chemokines in serum (pg/ml) and SWMF samples (pg/mg of total protein). The first column of graphs for each cytokine represents the mean and SD values along with the p values calculated by Anova test at one month (1m) and 3-6 months (3-6m) in serum and SWMF samples. The second and third columns represent the longitudinal trends of the cytokines between 1m and 3-6m in serum and SWMF samples, respectively. Monokine in response to interferon gamma (MIG; A-C); Monocyte chemoattractant protein-1 (MCP-1; D-F); interleukin-6 (IL-6; G-I); interleukin-8 (IL-8; J-L); interleukin-1β (IL-1β; M-O).
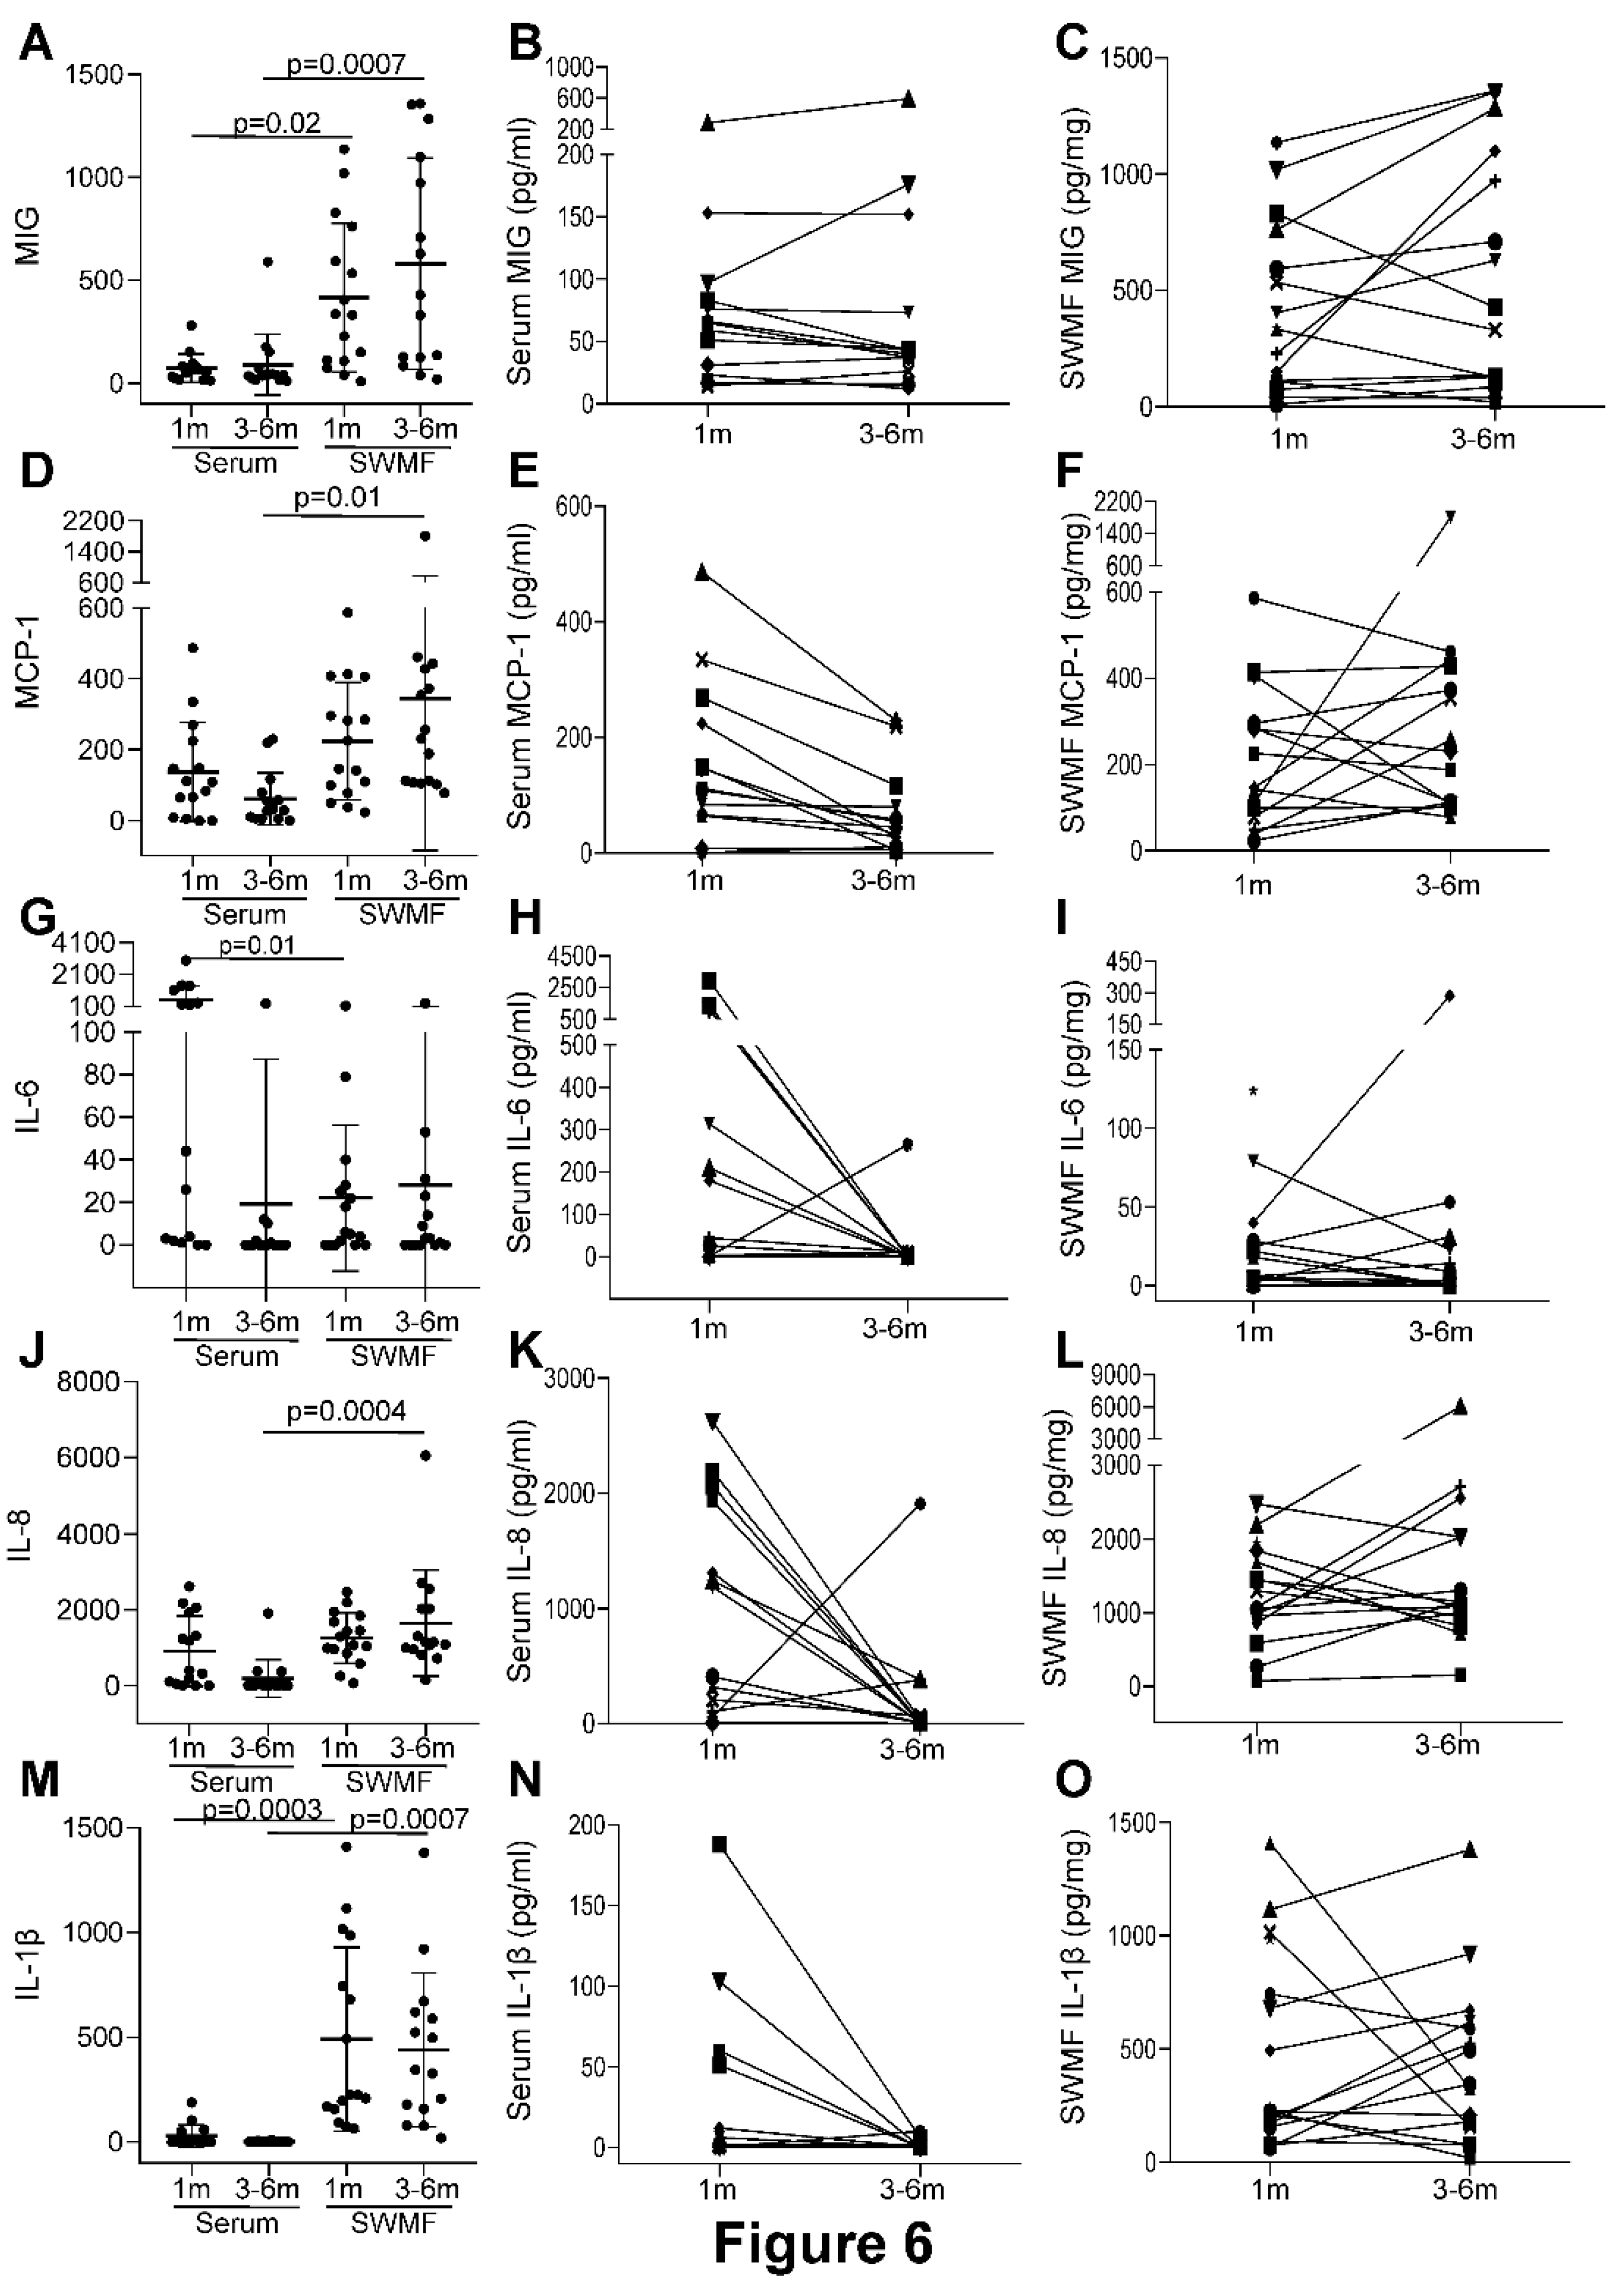

Table 1.
Gender and age demographics of COVID-19-naïve group (CNG) of vaccinees who developed breakthrough infections (BTI) and previously COVID-19-exposed group (CEG) of vaccinees who developed re-infections (RI).
Table 1.
Gender and age demographics of COVID-19-naïve group (CNG) of vaccinees who developed breakthrough infections (BTI) and previously COVID-19-exposed group (CEG) of vaccinees who developed re-infections (RI).
| COVID-19-naïve (CNG) | COVID-19-exposed (CEG) | CNG-Breakthrough infections (BTI) | CEG-Reinfections (RI) | |
|---|---|---|---|---|
| Overall (N=205) | 111 (54) | 94 (46) | 49 (44) | 25 (27) |
| Gender | ||||
| Males (N=56) | 33 (59) | 23 (41) | 21 (64) | 11 (48) |
| Females (N=149) | 78 (52) | 71 (48) | 28 (36) | 14 (20) |
| p value | 0.4 | 0.007 | 0.008 | |
| Age (years) | ||||
| 20-44 (N=140) | 75 (54) | 65 (46) | 33 (44) | 13 (20) |
| 45-60 (N=51) | 28 (55) | 23 (45) | 12 (43) | 9 (39) |
| ≥ 61 (N=14) | 8 (57) | 6 (43) | 4 (50) | 3 (50) |
| p value | 1.0 | 0.9 | 0.08 | |
p values were calculated by Chi-square tests. Numbers in parenthesis denote percentages. Percentages of CNG and CEG columns were calculated over the corresponding N values given in the first column. Percentages of BTI were calculated over the numbers in the CNG column. Percentages of RI were calculated over the numbers in the CEG column.
Table 2.
Median antibody levels and mean cytokine levels in sera from COVID-19 vaccinees.
| Time points | CNG | CEG | BTI | RI |
|---|---|---|---|---|
| Median anti-SARS-CoV2 spike Ig antibodies (U/ml) | ||||
| 1d-1m | 84 | 10152 | ND | ND |
| 2d-1m | 856 | 6986 | ND | ND |
| 2d-3m | 341 | 5372 | 4258 | 7188 |
| 2d-6m | 153 | 3056 | 2386 | 11096 |
| Mean IL-10 (pg/ml) | ||||
| 1d-1m | 11 | 20 | ND | ND |
| 2d-1m | 24 | 36 | ND | ND |
| Mean IL-17 (pg/ml) | ||||
| 1d-1m | 2.24 | 4.30 | ND | ND |
| 2d-1m | 2.75 | 5.42 | ND | ND |
| Mean IL-21 (pg/ml) | ||||
| 1d-1m | 39 | 60 | ND | ND |
| 2d-1m | 46 | 53 | ND | ND |
| 3-6 months after second vaccine dose | ||||
| Mean IL-7 (pg/ml) | 10 | 12 | 18 | 14 |
| Mean IL-15 (pg/ml) | 21 | 19 | 23 | 12 |
ND – not done. U – units; pg – picogram; ml – millilitre; d – vaccine dose; m - month.
Disclaimer/Publisher’s Note: The statements, opinions and data contained in all publications are solely those of the individual author(s) and contributor(s) and not of MDPI and/or the editor(s). MDPI and/or the editor(s) disclaim responsibility for any injury to people or property resulting from any ideas, methods, instructions or products referred to in the content. |
© 2025 by the authors. Licensee MDPI, Basel, Switzerland. This article is an open access article distributed under the terms and conditions of the Creative Commons Attribution (CC BY) license (http://creativecommons.org/licenses/by/4.0/).
Copyright: This open access article is published under a Creative Commons CC BY 4.0 license, which permit the free download, distribution, and reuse, provided that the author and preprint are cited in any reuse.


