Submitted:
24 June 2025
Posted:
25 June 2025
You are already at the latest version
Preprints on COVID-19 and SARS-CoV-2
Abstract
Background: Earlier studies suggested that coronavirus disease 2019 (COVID-19) mortality may vary by the day of the week, possibly due to healthcare system workflows or reporting delays. This study aimed to assess whether such day-of-week effects exist in U.S. COVID-19 death data from 2020 to 2023. Methods: We extracted nationwide US COVID-19 mortality data from the CDC WONDER database, grouping deaths by weekday for each year from 2020 to 2023. A one-way ANOVA (Analysis of Variance) and Tukey’s HSD (Honest Significant Difference) test were used to assess differences in daily death counts. Additional comparisons were made between aggregated weekday (Monday–Friday) and weekend (Saturday–Sunday) totals. Results: No statistically significant differences were observed in the number of deaths across individual weekdays in any year analyzed (p= 1.000 for all years combined). Post-hoc testing confirmed that all pairwise comparisons between weekdays were non-significant. Sub-analyses of early (2020–2021) and late (2022–2023) pandemic periods also showed no significant variation (all p-values > 0.05). In the weekday-versus-weekend analysis, average deaths were slightly higher on weekdays during 2020–2021 and marginally higher on weekends during 2022–2023, but none the combined difference failed to reach statistical significance (p=0.969). Conclusions: Official COVID-19 mortality data from 2020 to 2023 in the US show no evidence of a “weekend effect,” indicating that day of the week did not significantly influence reported deaths.
Keywords:
coronavirus disease 2019
; COVID-19
; SARS-COV-2
; mortality
; weekend effeect
1. Introduction
Understanding the temporal distribution of coronavirus disease 2019 (COVID-19) mortality is critical for effective public health planning and response [1]. Throughout the pandemic, epidemiologists and health authorities have relied extensively on mortality data to track the progression of disease, allocate healthcare resources, and evaluate the impact of interventions such as vaccination campaigns and preventive (even restrictive) measures [2]. However, fluctuations in reported deaths are shaped not only by the biological course of COVID-19, but also by administrative practices and the timing of data collection and reporting. Consequently, it is essential to determine whether observed trends in mortality reflect genuine epidemiological patterns or are artifacts of reporting and operational cycles [3].
One frequently examined aspect is the influence of the day of the week on reported COVID-19 deaths. Although viral transmission is not expected to follow a weekly rhythm, healthcare and reporting systems often do. Many hospitals and public health institutions operate with reduced staffing levels during weekends, which may delay diagnoses, treatments, and increase mortality. This operational pattern has been associated with the so-called “weekend effect”—a phenomenon where patients admitted during weekends experience worse outcomes, potentially due to limited access to specialized care, diagnostics, or senior medical staff. A meta-analysis published by Honeyford et al. in 2018, encompassing 39 studies and 57 separate analyses, found a 7% increased risk of death for weekend admissions (odds ratio [OR]: 1.07; 95% confidence interval [CI]: 1.03–1.12) [4]. Similarly, a subsequent meta-analysis by Chen et al. in 2019, which included 68 studies and over 640 million hospital admissions, reported an even greater weekend-associated mortality risk of 16% (OR: 1.16; 95% CI: 1.10–1.23), with the highest effect observed among patients undergoing elective surgical procedures (OR: 1.70; 95% CI: 1.08–2.52) [5].
In the context of COVID-19, delays in care-seeking behavior during weekends could exacerbate disease outcomes, contributing to variations in mortality data. Evaluating whether such temporal effects are observable at a population level can offer insights for optimizing healthcare delivery and preparedness in future pandemics. Accordingly, this study aimed to assess whether statistically significant differences exist in the number of reported COVID-19 deaths by day of the week—including distinctions between weekdays and weekends—in the US, between 2020 and 2023.
2. Materials and Methods
Mortality data for COVID-19 were obtained from the US Centers for Disease Control and Prevention, National Center for Health Statistics. National Vital Statistics System, Mortality 2018–2023 on CDC WONDER (Wide-Ranging, Online Data for Epidemiologic Research) Online Database, released in 2024 [6]. These data were extracted from the latest available Multiple Cause of Death Files at the time of our search (years 2018–2023), as compiled from records provided by 57 vital statistics jurisdictions through the Vital Statistics Cooperative Program. Data extraction was performed on June 20, 2025. The search criteria used for this analysis included selecting the “Multiple Cause of Death, 1999–2023” database and filtering for the underlying cause of death coded as U07.1, corresponding to COVID-19. The data were grouped by year and weekday to capture the total number of deaths recorded on each day of the week—Monday through Sunday—for the years 2020, 2021, 2022, and 2023. No age adjustment or demographic stratification was applied, as such variables are not available in the dataset when mortality data are grouped by day of the week. The extracted results provided raw death counts.
To evaluate differences in the total number of deaths across individual weekdays, a one-way analysis of variance (ANOVA) was conducted for each year, after verification of normal data distribution by Shapiro-Wilk test. Tukey’s Honest Significant Difference (HSD) test was used as a post-hoc method to assess pairwise differences between all weekday combinations. Additionally, a separate ANOVA and Tukey HSD test were performed to compare aggregate weekday data (Monday through Friday) against weekend data (Saturday and Sunday), to assess broader temporal patterns.
All statistical analyses were performed using the scipy.stats and statsmodels libraries in Python Version 3.11 (Python Software Foundation, Wilmington, USA). As the CDC WONDER is a publicly available, anonymized, and freely searchable database, this study was exempt from Ethical Committee approval.
3. Results
The total number of COVID-19 deaths recorded on each day of the week across the first four pandemic years is summarized in Table 1. Visual inspection suggests relatively consistent totals across weekdays in each year. No obvious or systematic peak or flex is apparent on any specific day, even in years with higher overall deaths (e.g., 2020 and 2021). While there was a slight trend toward reduced death counts on weekends (Saturday and Sunday), this pattern was neither pronounced nor consistent across years.
An improved visualization of data, showing the proportion of weekday deaths relative to the total weekly deaths for each year, expressed as percentages, is provided in Figure 1.
To assess whether any day of the week was significantly associated with different death totals compared to others, a one-way ANOVA test was applied to weekday totals for each year. The ANOVA test yielded the following statistics: F-statistic = 0.003, p-value = 1.000. Although the ANOVA did not reveal significant differences, Tukey HSD test was performed to explore potential pairwise differences between individual weekdays. Test results confirmed that none of the day-to-day comparisons were statistically significant as all pairwise comparisons yielded adjusted p-values well above the threshold of 0.05, and no confidence intervals for mean differences excluded zero. The largest observed mean difference (e.g., between Fridays and Sundays) was neither statistically meaningful. Notably. A sub-analysis limited to weekly data on monthly basis of the individual pandemic years also yielded non-statistically significant difference across the different days of the week, as follows: 2020: F-statistic = 0.022 (p-value = 1.000); 2021: F-statistic = 0.018 (p-value = 1.000); 2022: F-statistic = 0.000 (p-value = 1.000) and 2023: F-statistic = 0.006 (p-value = 1.000).
In a secondary analysis, total deaths were averaged across weekdays (Monday through Friday) and weekends (Saturday and Sunday) to explore broader temporal contrasts (Table 2).
The data reveals that the weekdays were generally associated with slightly higher average deaths in 2020 and 2021, while weekends appeared marginally higher in 2022 and 2023. However, these differences were minimal and non-statistically significant as confirmed by the ANOVA comparing these two groups across the four-year period, which yielded the following results: F-statistic = 0.002, p-value = 0.959.
A sub-analysis limited to monthly data of the individual pandemic years also yielded non-statistically significant difference between weekdays and weekends, as follows: 2020: F-statistic = 0.035 (p-value = 0.853); 2021: F-statistic = 0.011 (p-value = 0.917); 2022: F-statistic = 0.000 (p-value = 0.989) and 2023: F-statistic = 0.001 (p-value = 0.974). A visual comparison of annual death counts occurring on weekdays and weekends expressed as percentages of weekly total deaths on monthly basis is shown in Figure 2.
4. Discussion
The results of our study, encompassing both a detailed weekday-level analysis and a comparative assessment between weekdays and weekends, reveal no statistically significant differences in the total number of COVID-19 deaths by day of the week for any pandemic year analyzed (2020–2023). These findings suggest that, despite potential variations in healthcare resource availability, institutional workflows or potential reporting delays, the temporal pattern of COVID-19 mortality has remained consistent across weekdays and weekends in the US across the first four years of the pandemic. This consistency supports the hypothesis that the day of the week may not have meaningful impact on COVID-19 mortality rates.
Our results do not align with those reported by Manzoor and Redelmeier [7], who analyzed COVID-19 mortality data from the World Health Organization (WHO) database between March 7, 2020 and March 7, 2022, across ten countries. Their analysis identified a modest but significantly higher average daily death count on weekends (Saturdays and Sundays) compared to weekdays (8,532 vs. 8,083; p<0.001), corresponding to an approximately 6% relative increase. The largest absolute differences were observed in the US (+22%) and Brazil (+29%), with such “weekend effect” persisting throughout various pandemic phases. Consistent with these findings, Aly surveyed COVID-19-related deaths in the US using Worldometer data between March through October 2020 [8], also showing that COVID-19 mortality was lower on weekends (Saturdays and Sundays), compared to the rest of the week (Z = 3.527, p = 0.0004). However, these findings are challenged by data published by Bergman et al. [9], who demonstrated that the apparent oscillations in U.S. COVID-19 mortality may have substantially stemmed from reporting artifacts in several studies. In their analysis, in fact, the “weekend effect” disappeared when COVID-19 death data were organized by episode rather than report date, thus confirming the potential influence of uncontrolled confounding factors in COVID-19 epidemiology [10]. An additional retrospective observational study by González-Gancedo et al. [11] investigated nearly 2,000 COVID-19 patients admitted to the emergency departments of a private Spanish hospital network between February and April 2020. While this study reported a significant association between day of admission and survival—indicating lower survival rates for patients admitted on weekends—the authors defined the weekend to include Friday, which is not conventionally considered a weekend day. Consequently, their findings are not directly comparable to those of other studies, as the definition of “weekend” was different.
5. Conclusions
This nationwide analysis of COVID-19 mortality data from 2020 to 2023 in the US reveals no statistically significant differences in death counts by the day of the week, nor between weekdays and weekends. Despite prior studies suggesting a “weekend effect,” our findings indicate a consistent mortality pattern across weekdays and weekends, even during peak pandemic periods. These results support the interpretation that temporal fluctuations in reported deaths are not indicative of systematic disparities in care or outcome, but are more likely attributable to reporting logistics. Our work aligns with prior analyses [9] identifying reporting artifacts as important drivers of perceived mortality variation, underscoring the importance of methodological rigor in epidemiological surveillance. Future analyses should prioritize episode-based datasets and carefully account for administrative confounders when evaluating temporal patterns in health outcomes.
Author Contributions
Conceptualization, C.M. and G.L.; software, G.L.; formal analysis, G.L.; data curation, G.L.; writing—original draft preparation, C.M.; writing—review and editing, G.L. All authors have read and agreed to the published version of the manuscript.
Funding
This research received no external funding.
Institutional Review Board Statement
The NCHS WONDER is a publicly available, anonymized, and freely searchable database, so this study was exempt from Ethical Committee approval.
Informed Consent Statement
Not applicable.
Data Availability Statement
The original data presented in the study are openly available in CDC WONDER Online Database at http://wonder.cdc.gov/ucd-icd10-expanded.html.
Acknowledgments
The authors wish to disclose that ChatGPT 3.5 was used for enhancing the clarity and coherence of the manuscript writing. The tool was only used for language refinement purposes, ensuring the text was clear and coherent without altering the scientific content or generating any new text. The authors have reviewed and edited the output and take full responsibility for the content of this publication.
Conflicts of Interest
The authors declare no conflicts of interest.
Abbreviations
The following abbreviations are used in this manuscript:
| COVID-19 | Coronavirus disease 2019 |
| ANOVA | ANOVA (Analysis of Variance) |
| HSD | Honest Significant Difference |
| WONDER | Wide-Ranging, Online Data for Epidemiologic Research |
| WHO | World Health Organization |
References
- Mattiuzzi C, Lippi G. Which lessons shall we learn from the 2019 novel coronavirus outbreak? Ann Transl Med. 2020 Feb;8(3):48. [CrossRef]
- Mattiuzzi C, Lippi G. COVID-19: Lessons from the Past to Inform the Future of Healthcare. COVID. 2025; 5(1):4. [CrossRef]
- Maccaro A, Audia C, Stokes K, Masud H, Sekalala S, Pecchia L, Piaggio D. Pandemic Preparedness: A Scoping Review of Best and Worst Practices from COVID-19. Healthcare (Basel). 2023 Sep 18;11(18):2572. [CrossRef]
- Honeyford K, Cecil E, Lo M, Bottle A, Aylin P. The weekend effect: does hospital mortality differ by day of the week? A systematic review and meta-analysis. BMC Health Serv Res. 2018 Nov 20;18(1):870. [CrossRef]
- Chen YF, Armoiry X, Higenbottam C, Cowley N, Basra R, Watson SI, Tarrant C, Boyal A, Sutton E, Wu CW, Aldridge CP, Gosling A, Lilford R, Bion J. Magnitude and modifiers of the weekend effect in hospital admissions: a systematic review and meta-analysis. BMJ Open. 2019 Jun 4;9(6):e025764. Erratum in: BMJ Open. 2019 Jun 27;9(6):e025764corr1, doi: 10.1136/bmjopen-2018-025764corr1. [CrossRef]
- Centers for Disease Control and Prevention, National Center for Health Statistics. National Vital Statistics System, Mortality 2018-2023 on CDC WONDER Online Database, released in 2024. Data are from the Multiple Cause of Death Files, 2018-2023, as compiled from data provided by the 57 vital statistics jurisdictions through the Vital Statistics Cooperative Program. Accessed at http://wonder.cdc.gov/ucd-icd10-expanded.html on Jun 20, 2025.
- Manzoor F, Redelmeier DA. COVID-19 deaths on weekends. BMC Public Health. 2023 Aug 22;23(1):1596. [CrossRef]
- Aly H. A closer look at the weekend effect and COVID-19 mortalities. J Neonatal Perinatal Med. 2021;14(1):7-8. [CrossRef]
- Bergman A, Sella Y, Agre P, Casadevall A. Oscillations in U.S. COVID-19 Incidence and Mortality Data Reflect Diagnostic and Reporting Factors. mSystems. 2020 Jul 14;5(4):e00544-20. [CrossRef]
- Lippi G, Mattiuzzi C, Henry BM. Uncontrolled confounding in COVID-19 epidemiology. Diagnosis (Berl). 2022 Dec 7;10(2):200-202. [CrossRef]
- González-Gancedo J, Morales-Cané I, Rodríguez-Muñoz PM, Hidalgo-Lopezosa P, Del Rocío Valverde-León M, Fernández-Martínez ME, Fabbian F, Rodríguez-Borrego MA, López-Soto PJ. Mortality and critical conditions in COVID-19 patients at private hospitals: weekend effect? Eur Rev Med Pharmacol Sci. 2021 Apr;25(8):3377-3385. [CrossRef]
Figure 1.
Coronavirus disease 2019 (COVID-19) deaths (% of all weekly deaths) recorded on each day of the week across the first four pandemic years in the US.
Figure 1.
Coronavirus disease 2019 (COVID-19) deaths (% of all weekly deaths) recorded on each day of the week across the first four pandemic years in the US.
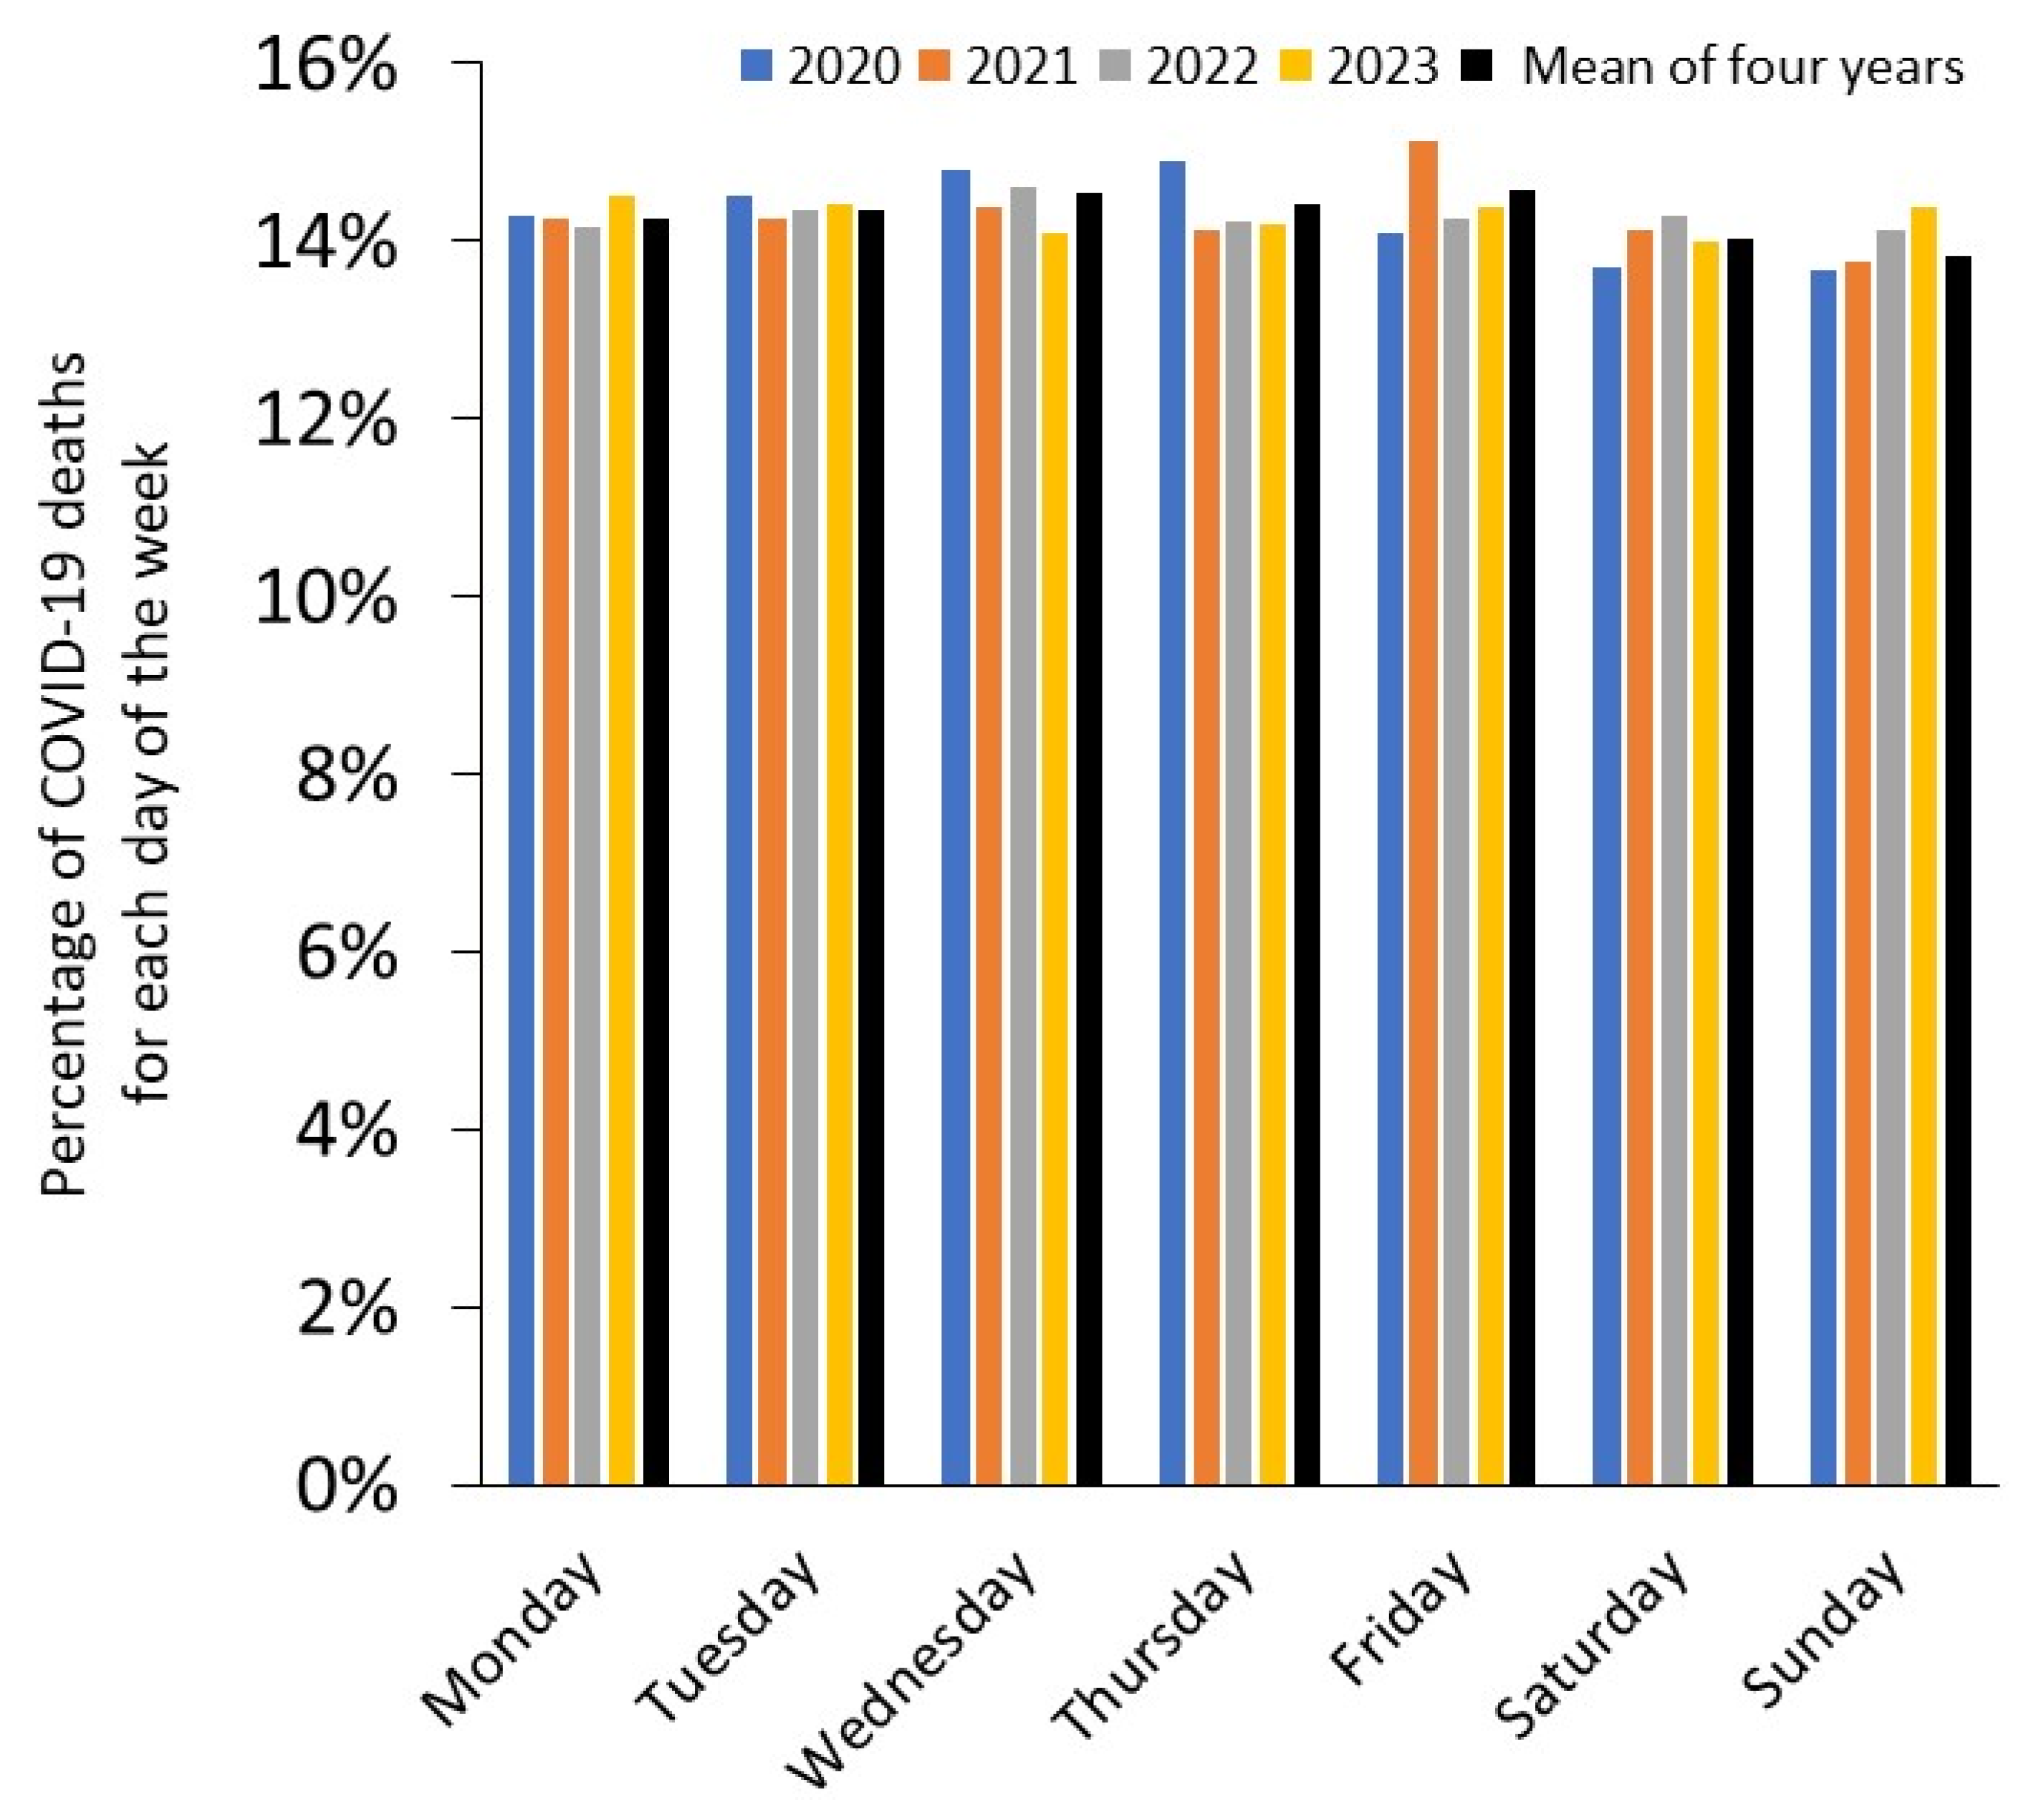
Figure 2.
Coronavirus disease 2019 (COVID-19) deaths (% of all weekly deaths) recorded during weekdays or weekends across the first four pandemic years in the US.
Figure 2.
Coronavirus disease 2019 (COVID-19) deaths (% of all weekly deaths) recorded during weekdays or weekends across the first four pandemic years in the US.
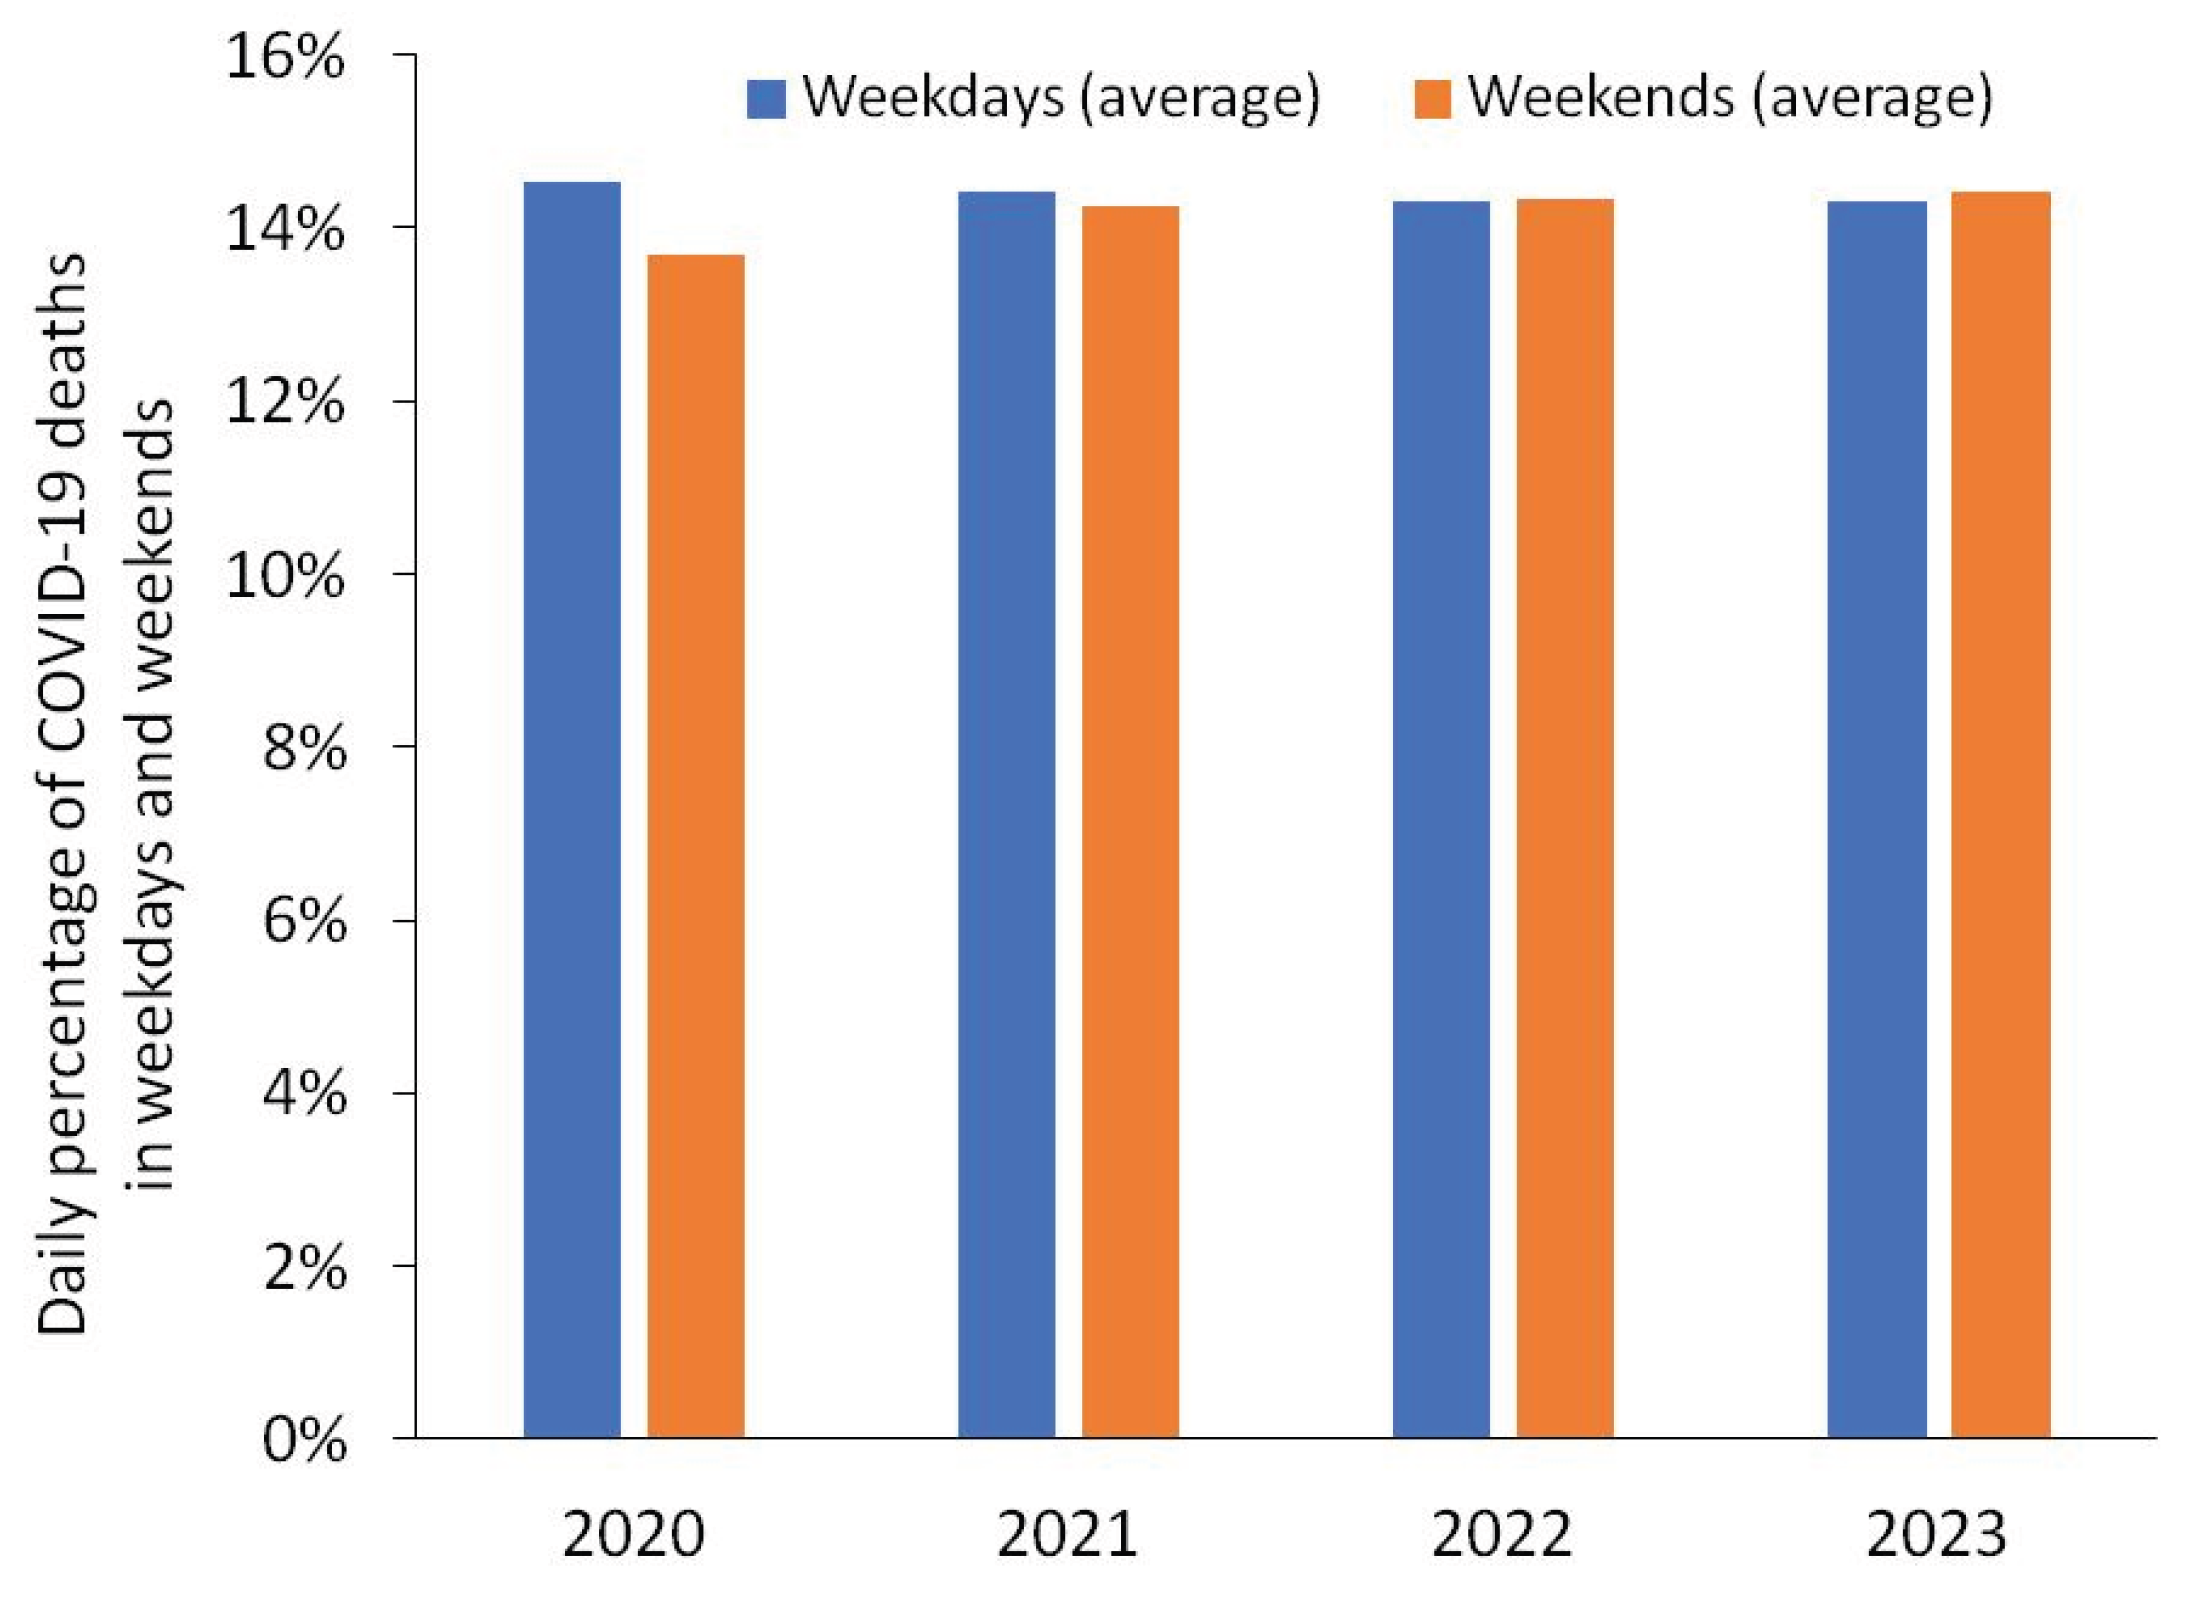

Table 1.
Total number of coronavirus disease 2019 (COVID-19) deaths recorded on each day of the week across the first four pandemic years in the US.
Table 1.
Total number of coronavirus disease 2019 (COVID-19) deaths recorded on each day of the week across the first four pandemic years in the US.
| Year | Monday | Tuesday | Wednesday | Thursday | Friday | Saturday | Sunday |
| 2020 | 50,156 | 50,922 | 51,973 | 52,255 | 49,476 | 48,127 | 47,922 |
| 2021 | 59,353 | 59,359 | 59,890 | 58,928 | 62,998 | 58,922 | 57,441 |
| 2022 | 26,433 | 26,760 | 27,244 | 26,512 | 26,590 | 26,668 | 26,345 |
| 2023 | 7,239 | 7,203 | 7,041 | 7,083 | 7,183 | 6,995 | 7,188 |
| Total | 143,181 | 144,244 | 146,148 | 144,778 | 146,247 | 140,712 | 138,896 |
Table 2.
Total coronavirus disease 2019 (COVID-19) deaths averaged across weekdays (Monday through Friday) and weekends (Saturday and Sunday).
Table 2.
Total coronavirus disease 2019 (COVID-19) deaths averaged across weekdays (Monday through Friday) and weekends (Saturday and Sunday).
| Year | Weekdays (average) | Weekends (average) |
| 2020 | 50,956 | 48,024 |
| 2021 | 60,106 | 59,359 |
| 2022 | 26,708 | 26,760 |
| 2023 | 7,145 | 7,203 |
| Total | 144,920 | 141,347 |
Disclaimer/Publisher’s Note: The statements, opinions and data contained in all publications are solely those of the individual author(s) and contributor(s) and not of MDPI and/or the editor(s). MDPI and/or the editor(s) disclaim responsibility for any injury to people or property resulting from any ideas, methods, instructions or products referred to in the content. |
© 2025 by the authors. Licensee MDPI, Basel, Switzerland. This article is an open access article distributed under the terms and conditions of the Creative Commons Attribution (CC BY) license (http://creativecommons.org/licenses/by/4.0/).
Copyright: This open access article is published under a Creative Commons CC BY 4.0 license, which permit the free download, distribution, and reuse, provided that the author and preprint are cited in any reuse.


