
Submitted:
21 June 2025
Posted:
23 June 2025
You are already at the latest version
Abstract
The research presented in this paper is based on the need for personalized medical implants, whose serial production is impossible, so the need for production process adjustments is inevitable. Conventional production technologies usually set geometrical limitations and generate a lot of waste material, which leads to large expenses, especially when the material used for production is expensive Ti-alloy. Additive technologies offer a possibility to produce a product almost without waste material and geometrical limitations. Nevertheless, the methods developed for additive production using metal powder are not significantly used in biomedicine because there is insufficient data published regarding the properties of additively produced parts, especially from the fatigue and fracture standpoint. The aim of this research is experimental determination of fracture mechanics properties of additively produced parts and their comparison with the properties of parts produced by conventional technologies. Drawing is the first production process in comparison, and the second one is selective laser melting (SLM). Ti-alloy Ti-6Al-7Nb used for medical implants is selected for this research. Experimental testing has been performed in order to determine ΔKth, fracture mechanics parameters and resistance curves according to ASTM E1820. Test specimens dimensioning and the experiments are carried out according to the respective standards.
Keywords:
fracture toughness
; crack growth curve
; resistance curve
; additive technologies
; powder metallurgy
; selective laser melting
; Ti-6Al-7Nb
1. Introduction
Additive manufacturing (AM) has become very interesting due to its advantages to conventional technologies. It has found its place in various fields of industry. Biomedicine is the field whose development is supported by technology. The increasing need for patient-specific biomedical implants has driven rapid advancements in both conventional and additive manufacturing of titanium alloys, with Ti-6Al-7Nb recognized for its biocompatibility [1], corrosion resistance, and mechanical strength, making it a preferred material for orthopedic and dental applications [2,3,4,5]. It is a α+β alloy which, when produced by conventional production processes, has good overall mechanical properties [6] with Young’s elasticity modulus E = 110000 MPa, and tensile strength Rm = 1050 MPa. In addition to their mechanical strength and biocompatibility, Ti-6Al-7Nb alloys exhibit favorable tribological properties, making them suitable for load-bearing biomedical implants such as hip prostheses [7].
Conventional processing techniques such as drawing remain the standard for mechanical reliability and ductility but are limited in design by geometry and produce significant material waste, which is particularly problematic for complex implant geometries and high-cost materials [8]. Additive manufacturing, especially SLM, a production process which uses laser beam to melt the metal powder [9], has emerged as an alternative, enabling the freedom of design and production of customized implants with minimal waste [5,10]. However, concerns still exist regarding the fatigue and fracture performance of SLM-produced Ti-6Al-7Nb due to its well-known porosity [1], heterogenous microstructure, and residual stresses, which can significantly affect durability of the produced components [3,4,11].
Recent studies have demonstrated that SLM components exhibit higher crack growth rates and lower fracture toughness compared to their conventionally processed counterparts, primarily due to the presence of large grains and α’ martensite plates that promote crack initiation and propagation [3,4]. Comparative investigations of SLM produced and drawn Ti-6Al-7Nb report that while ultimate tensile strength and hardness can be similar across production technologies, fatigue life and fracture resistance are significantly impacted by internal defects and grain structure, with wrought alloys displaying more predictable and superior crack propagation resistance, as well as more stable mechanical performance [2,3,4]. This shows the importance of obtaining comparable fracture mechanics data, including threshold stress intensity factors, growth curves, and resistance curves, for both production processes.
Despite recent progress, there remains a lack of experimentally obtained data to support the design of load-bearing implants, particularly regarding the prediction of service life under cyclic loading, which is critical for any application. This study addresses this gap by experimentally determining and comparing key fracture mechanics parameters for Ti-6Al-7Nb fabricated by drawing and SLM, thereby providing essential data to guide material selection and engineering design of the biomedical implants and supporting the development of computational models for prediction of cycles-to-failure [2,3,4].
2. Materials and Methods
This paper presents the experimental results of several experiments conducted to obtain the values of fracture mechanics parameters. Values obtained are threshold stress intensity factors, fracture toughness and resistance curves. As mentioned earlier, experiments have been conducted on test specimens produced by two different production technologies. Test specimens representing conventional technologies are made from drawn rod with 12 mm diameter procured from Dentaurum GmbH, and for selective laser melting using Ti-6Al-7Nb metal powder procured from TLS Technik Spezialpulver. Production of the test specimens made from drawn rod was done on a standard turning and milling machine, while for SLM produced specimen an MCP Realizer II SLM-250 machine was used, produced by MCP-HEK. The powder is prepared by gas atomization, during which molten metal is dispersed into spherical particles with diameter between 20 and 63 µm. The production process takes place in a protective atmosphere inside a working chamber filled with argon to a level that ensures an oxygen content of less than 0.8%. The process parameters used for production of the test specimens are: laser power 160 W, laser scanning speed 400 mm/s, layer thickness 0.05 mm and a hatch distance: 0.12 mm.
The dimensions of the specimens for threshold stress intensity factor determination were taken according to the ISO 148-1:2009 standard [12]. The standard distinguishes two types of notches for the specimen, U and V notches. The U notch is intended for testing brittle materials, while the V notch is for tough materials. Since titanium alloys are generally tough, the V-type notch was selected. The standard defines the specimen dimensions as length L = 55 mm, height H = 10 mm, and width W = 10 mm. Length and height values are fixed, while the standard allows three additional width sizes for reduced cross-sections: 7.5 mm, 5 mm, and 2.5 mm. As previously mentioned, the specimen dimensions in this research are limited by the diameter of the drawn rod, so the largest feasible width is 5 mm. Therefore, the dimensions of the specimens are length L = 55 mm, height H = 10 mm and width W = 5 mm. The specimen with indicated dimensions and tolerances is shown on Figure 1.
For the fracture toughness determination, a three-point bending test is required, for which the same test specimen was used with knives subsequently glued on to hold the crack mouth opening displacement (CMOD) measuring instrument. The height of the knife glued to the specimen is 2 mm. The dimensions of this specimen with the knife positions are shown on Figure 2.
In addition to the test specimens described above, round specimens for fracture toughness testing were also used and dimensioned according to ASTM E466-96. Those specimens were prepared for fracture toughness testing by subsequently machining the ring-shaped notch shown as detail A on Figure 3, which shows a cylindrical specimen for experimental fracture toughness testing.
The value representing the crack propagation threshold, which determines whether a crack formed under cyclic loading will continue to propagate until final fracture, is called the threshold stress intensity factor range, and can be calculated according to the expression
where is the initial crack length and
If the value of ΔK exceeds ΔKth, crack propagation will begin. Experimental determination of ΔKth involves measuring crack growth rate per cycle da/dN as a function of ΔK, typically plotted in logarithmic coordinates as shown on Figure 4.
Crack propagation is initially accelerated, which is visible in region I, then it transitions into a phase of stable growth (region II) and finally enters the phase of critical crack propagation leading to accelerated fracture (region III). The initial value of region I corresponds to the threshold stress intensity factor range ΔKth. The critical value of the stress intensity factor range ΔKc, at which final fracture occurs (da/dN → ∞), represents the critical value calculated according to equation (3)
where Kc is the critical value of the stress intensity factor, known as fracture toughness. This value represents one of the most important constants in fracture mechanics. From the above relation, the critical crack length ac at the moment of fracture can be calculated for a known fracture toughness, and vice versa. In region II, the crack growth rate increases linearly and can be described by an equation
which, in logarithmic coordinates, represents a straight line with a slope coefficient n. This relationship is known as Paris’ law, in which C and n are material constants determined experimentally. This is the law most used in engineering practice to determine the remaining service life of machine and structural elements, based on the measured crack length or the allowable crack length for the predicted service life. By integrating Paris’ law, the service life until fracture can be expressed in terms of the number of cycles to failure, as described in standard fracture mechanics literature [13,14,15,16].
The stress intensity factor threshold values and the crack growth curve was determined experimentally for Ti-6Al-7Nb alloy produced by both production processes. The devices used for this experiment were Rumul Cracktronic and Rumul Fractomat, which enable monitoring of crack growth. For this type of testing, rectangular test specimens described above were used. Crack growth was monitored on one side of the specimen where the measuring tape was positioned as presented on Figure 5.
Using the Rumul Cracktronic device, the range of stress intensity factor (ΔK) for dynamic loading of the test specimen is defined. This range is software-controlled via the bending moment range (ΔM) and the mean bending moment (Mm). Initial moment values applied to the specimen are defined and then reduced during crack growth. The ratio of the minimum to maximum moment, which represents the stress ratio, is held constant at R = 0.1. The frequency is also held constant at approx. 72 Hz. As the bending moment decreases, crack growth slows down. Crack growth is tracked via measurement tape, while recording the number of load cycles, stress intensity factor range, total crack depth, bending moment range, mean bending moment and the frequency. The ΔKth is determined by measuring crack depth increment over a specific number of cycles. When the crack growth for a given ΔK is less than 0.001 mm per 1,000,000 cycles, that ΔK value is defined as the threshold stress intensity factor range (ΔKth), representing the maximum load a component can withstand without crack propagation. Significant parameters recorded during this experiment are presented in Table 1 for test specimens made from drawn rod and in Table 2 for test specimens produced by SLM.
After threshold stress intensity factor determination, the first and the second region of the crack growth curve was determined experimentally as well. When determining the crack growth curve, the approach is opposite to that used for determining ΔKth. The initial ΔK value is slightly higher than ΔKth and increases during crack growth. The time required for this phase of testing is shorter compared to determining ΔKth because during the first phase, the load for each subsequent step is lower than the previous one. Since a plastic zone forms in front of the crack through which it must propagate, reducing the load on the first part of the experiment results in a higher number of cycles required for crack propagation, which means more required time to conduct the experiment.
Above mentioned rectangular test specimens were used for determination of fracture toughness and resistance curves as well. This experiment was conducted according to [17]. To achieve faster crack initiation, a straight notch was cut using wire saw K.D. Unipress Saw WS-22. Measuring scale was drawn on both polished sides of test specimens in the crack growth direction to enable easier monitoring of crack growth. Two microscope cameras were used for monitoring and measuring crack growth on both sides of the specimen as presented on Figure 6 and Figure 7, and the mean crack growth value was calculated.
Specimen loading in this experiment consists of three steps, initial fatigue loading, stable crack growth and final fatigue loading of the specimen. Fatigue loading prior to and after stable crack growth were done on Rumul Cracktronic device. Maximal bending moment was defined for first fatigue loading using a criterion that the ratio of maximal stress intensity factor to elasticity modulus Kmax/E must not exceed 1.5x10⁻⁴ m0.5 [18]. After the first loading step, knives for CMOD gauge were glued on the notched side of test specimens as presented earlier and a stable crack growth step is performed. For this step, universal testing machine Instron 1255 was used. The test specimen was positioned for a three-point bending test, as presented on Figure 8.
The crack mouth opening displacement extensometer was calibrated and mounted onto pre-glued knives to measure the CMOD. The load increases continuously until the maximum force value is reached, at which point loading stops and unloading begins representing the final part of this step of the experiment. This process ensures that the data is recorded during stable crack growth. The purpose of this experiment is to determine the force vs. crack mouth opening displacement (F–CMOD) and force vs. load line displacement (F–LLD) relationships, which serve as input data for determination of resistance curves.
Following the first fatigue phase and stable crack growth, the third and final part of the experiment involves a second fatigue loading of the test specimen. This phase continues until the specimen fractures. The aim is to clearly identify the fracture surface area associated with stable crack growth and simplify the measurement of its dimension. The fracture surface from stable crack growth differs visually from the fatigue-induced crack growth zone. Consequently, the stable crack growth region is distinctly visible between two fatigue crack zones. This distinction is critical, as standardized protocols require fracture surface measurements at nine precise locations along the upper and lower boundaries, i.e., the start and end lines of stable crack growth as presented on Figure 9.
As previously mentioned, the primary result of this experiment is a series of data representing the relationship between force and displacement in terms of crack mouth opening displacement or load line displacement, i.e., the F–CMOD and F–LLD diagrams. In addition to this data, measurements of the fracture surface and monitoring of crack propagation provided information on the depths of the fatigue crack and the dimensions of the stable crack growth zone. All the aforementioned data serve as input for the calculation procedure and construction of the resistance curves according to the ASTM E1820 standard [17].
Aside from rectangular test specimens, round test specimens are also used for fracture toughness measurement. According to the expression (5) [19]:
where:
KI – stress intensity factor, MPam0.5
D – test specimen outer diameter, m
d – diameter of the test specimen notch root after failure, mm
F – tensile force applied to test specimen, N
using the maximum force applied to the test specimen, it is possible to calculate the fracture toughness value of the material, i.e., for F = Fmax, KI = Kc. This experiment was performed on Instron 1255 universal testing machine. The fracture surfaces of the specimens were observed using a microscope at 20x magnification, and the notch root diameters were measured after fracture, as presented in the results chapter.
3. Results
The following paragraphs present the results obtained from the experimental testing procedures described in the previous section. All values reported in this chapter correspond to specimens produced using both manufacturing processes. The data provided offers a direct comparison of the fracture mechanics behavior observed across these production processes, enabling a comprehensive analysis of their respective characteristics.
3.1. Threshold Stress Intensity Factor
For test specimen produced from drawn rod starting bending moment range was set at ΔM = 20.61 Nm, with medium bending moment value of Mm = 12.6 Nm, and ending with ΔM = 2.58 Nm, with Mm = 1.58 Nm. Measured crack growth was 1.774 mm. Threshold stress intensity factor was measured ΔKth = 3.84 MPam0.5. For SLM produced test specimen starting bending moment range was ΔM = 13.79 Nm, with Mm = 8.43 Nm, while ending was ΔM = 3.85 Nm, with Mm = 2.35 Nm, and crack growth of 0.872 mm. Threshold stress intensity factor was measured ΔKth = 4.53 MPam0.5. The curves representing first part of typical crack growth curve for Ti-6Al-7Nb are drawn and presented on Figure 10.
The second part of the crack growth curve is defined by equation (4) as mentioned in chapter 3. Using experimental data, values C and n are determined, and the relations can be written as follows:
for test specimen produced from drawn rod with R² = 0.9629, and
for SLM produced test specimen with R² = 0.8948.
This study reveals manufacturing-driven disparities in Paris’ law parameters. Lower factor C = 8.555×10⁻¹⁴ of the alloy produced by drawing and its higher exponent n = 5.077 reflects its homogeneous microstructure, which resists early crack propagation but becomes highly sensitive to stress intensity increases. In contrast, SLM produced alloy exhibits two orders of magnitude greater C value due to known porosity issue, accelerating low-ΔK growth, while its reduced exponent means that cracks are less sensitive to increases in ΔK compared to drawn alloy. This is consistent with observed R-curve behavior in additively manufactured metals, where internal defects can paradoxically increase fracture toughness at high ΔK by approximately 15–20% [20]. Regime-specific analyses show higher growth rates across a large range of ΔK values (0.1 – 30 MPam0.5) for SLM produced alloy, with 250× faster propagation at ΔK = 0.1 MPam0.5and 16× faster rates at ΔK = 30 MPam0.5, though the drawn rod’s steeper curve indicates greater high-stress vulnerability. These findings show that drawn rod suits high-cycle fatigue applications requiring threshold performance, while SLM’s geometric flexibility benefits complex parts (e.g., biomedical implants).
3.2. Fracture Toughness and Resistance Curves According to ASTM E1820 [17]
Experimental determination of fracture toughness regarding criteria set by the standard was valid on three test specimens, two of which are produced from drawn rod, and one by selective laser melting. Values obtained by experiments are presented in Table 3.
The drawn Ti-6Al-7Nb shows significantly higher fracture toughness than the SLM-produced specimen. This large difference highlights the superior resistance to crack propagation in the drawn material, while the lower value for SLM is likely due to internal defects and microstructural inhomogeneity typical of additive manufacturing.
For drawn test specimens resistance curves J-R and CTOD-R are constructed according to the same standard. These curves are nearly identical for both drawn test specimens used in the experiment. J-R resistance curve is presented on Figure 11, while CTOD-R resistance curve is presented on Figure 12.
The J-R and CTOD-R curves for drawn specimens exhibit nearly identical rising trends, confirming predictable ductile fracture behavior and stable crack growth under increasing ΔK. Their overlapping trajectories validate the consistent mechanical response of Ti-6Al-7Nb produced by conventional production processes. The absence of curve plateaus suggests no sudden fracture instability, making the material suitable for applications requiring damage-tolerant design.
3.3. Fracture Toughness According to [19]
Fracture toughness was also determined according to [19] using a cylindrical test specimen with ring-shaped notch. The fracture surfaces of the specimens produced by both production processes were observed using a microscope at 20x magnification, and the outer diameters, as well as the notch root diameters after fracture were measured, as presented on Figure 13. Fracture toughness values were calculated using equation (5), and the results obtained are presented in Table 4.
Using the measured values of both diameters and the force values with equation (5), the fracture toughness values were calculated for Ti-6Al-7Nb alloy produced by both production processes.
While the absolute values differ slightly between two methods for determining fracture toughness, both experiments consistently show a higher value in drawn rod specimens compared to SLM-produced material. This confirms the fundamental trend that traditional manufacturing yields superior fracture resistance in Ti-6Al-7Nb, likely due to reduced defect density and optimized microstructure. The variations between methods are visible, and the manufacturing driven differences remains statistically significant.
4. Discussion
The experimental evaluation of fracture mechanics parameters for Ti-6Al-7Nb alloy produced by drawing and selective laser melting confirmed that there are critical differences in crack initiation and propagation behavior. Test specimens are produced by both production processes according to ISO 148-1:2009 [12] and ASTM E466-96 [21] standards, with rectangular specimens featuring V-notches and cylindrical specimens with ring-shaped notches
Threshold stress intensity factor measurements showed SLM-produced specimens exhibited higher initial resistance to crack initiation than the drawn alloy. However, Paris' law analysis revealed fundamental differences as SLM material demonstrated two orders of magnitude greater factor C as well as a lower exponent n, indicating accelerated low-ΔK crack growth rates despite reduced sensitivity to stress intensity increases at higher loads. This can be attributed to well-known porosity issue for SLM produced parts and large grain structure, which create preferential crack paths, while drawn material's homogeneous α+β microstructure ensures more uniform deformation [22].
Fracture toughness values obtained by circular test specimens [19] differ from the values obtained by ASTM E1820 [17] standard but present the same difference between production processes in favor of drawn alloy. Values of bending moment range and medium bending moment used for threshold stress intensity factor determination indicate a higher fracture toughness of drawn Ti-6Al-7Nb alloy. This can be concluded since the higher value of bending moment had to be applied on drawn specimen in order to initiate the crack.
The drawn alloy's favorable performance was further confirmed by stable J-R and CTOD-R resistance curves, whereas SLM specimens failed to produce valid curves. Crack growth dynamics showed process-dependent characteristics since SLM produced alloy exhibits two orders of a magnitude faster propagation rates at ΔK = 0.1 MPam0.5, decreasing to an order of magnitude at ΔK = 30 MPam0.5, while drawn alloy demonstrated greater high-ΔK sensitivity. These trends are in favor of test specimens produced from drawn rod making them preferable for load-bearing implants despite SLM's geometric advantages.
Author Contributions
Conceptualization, D.K. and N.G.; methodology, D.K. and I.G.; validation, T.V., N.G. and I.G.; investigation, I.G.; data curation, T.V.; writing—original draft preparation, I.G.; writing—review and editing, P.K. and M.K.; visualization, I.G.; supervision, P.K. and M.K. All authors have read and agreed to the published version of the manuscript.
Funding
This research received no external funding
Acknowledgments
The research was performed with the equipment of the Fakulteta za Strojništvo Univerze v Mariboru, to whom the authors extend their gratitude.
Conflicts of Interest
The authors declare no conflicts of interest
Statement: This article is a revised and expanded version of a paper entitled Comparative Analysis of Fracture Mechanics Parameters for Wrought and SLM Produced Ti-6Al-7Nb Alloy, which was presented at the conference New trends in fatigue and fracture - NT2F19, Tucson, Arizona –USA, October 8-10, 2019.
Abbreviations
The following abbreviations are used in this manuscript:
| SLM | Selective Laser Melting |
| AM | Additive Manufacturing |
| ISO | International Organization for Standardization |
| ASTM | American Society for Testing and Materials |
| CMOD | Crack Mouth Opening Displacement |
| LLD | Load Line Displacement |
References
- C. Cosmin, I. Drstvensek, P. Berce, S. Prunean, S. Legutko, C. Popa and N. Balc, "Physical–Mechanical Characteristics and Microstructure of Ti6Al7Nb Lattice Structures Manufactured by Selective Laser Melting," Materials, vol. 13, no. 18, p. 4123, 2020. [CrossRef]
- M. Delshadmanesh, "Fatigue investigations of metallic biomaterials based on Ti-Nb and Co-Cr," 01 11 2018. Available online: https://repositum.tuwien.at/ handle/20.500.12708/7333. (Accessed 02 06 2025).
- M. Hein, D. Kokalj, N. F. Lopes Dias, D. Stangier, H. Oltmanns, S. Pramanik, M. Kietzmann, K.-P. Hoyer, J. Meißner, W. Tillman and M. Schaper, "Low Cycle Fatigue Performance of Additively Processed and Heat-Treated Ti-6Al-7Nb Alloy for Biomedical Applications," Metals, vol. 12, no. 1, p. 122, 2022. [CrossRef]
- D. Laskowska, B. Bałasz and W. Zawadka, "Microstructure and Mechanical Properties of As-Built Ti-6Al-4V and Ti-6Al-7Nb Alloys Produced by Selective Laser Melting Technology," Materials, vol. 17, no. 18, p. 4604, 2024. [CrossRef]
- Y. Gür, "Deformation Behaviour and Energy Absorption of 3D Printed Polymeric Gyroid Structures," Tehnički vjesnik - Technical Gazette, vol. 31, no. 5, pp. 1582-1588, 2024. [CrossRef]
- T. S. Pinheiro, J. Gallego, C. Bolfarini, C. S. Kiminami and A. M. J. Junior, "Microstructural Evolution of Ti-6Al-7Nb Alloy During High Pressure Torsion," Materials Research, vol. 15, no. 5, pp. 792-795, 2012. [CrossRef]
- M. Fellah, M. labaïZ, O. Assala, L. Dekhil, A. Taleb, H. Rezzag and I. Alain, "Tribological behavior of Ti-6Al-4V and Ti-6Al-7Nb Alloys for Total Hip Prosthesis," Advances in Tribology, vol. 2014, p. 13, 21 07 2014. [CrossRef]
- L. Squillaci, M. Neikter, T. Hansson, R. Pederson and J. Moverare, "Microstructure and mechanical properties of Ti-6Al-4V alloy fabricated using powder bed fusion – laser beam additive manufacturing process: Effect of hot isostatic pressing," Materials Science and Engineering: A, vol. 931, p. 19, 06 2025. [CrossRef]
- T. Sidambe, "Biocompatibility of Advanced Manufactured Titanium Implants—A Review," Materials, vol. 7, no. 12, pp. 8168-8188, 2014. [CrossRef]
- R. Novak, F. Valjak, N. Bojčetić and M. Šercer, "Design Principle for Additive Manufacturing: Direct Metal Sintering," Tehnički vjesnik - Technical Gazette, vol. 30, no. 3, pp. 937-944, 2023. [CrossRef]
- B. Wu, Z. Pan, D. Ding, D. Cuiuri and H. Li, "Effects of Heat Accumulation on Microstructure and Mechanical Properties of Ti6Al4V Alloy Deposited by Wire Arc Additive Manufacturing," Additive Manufacturing, vol. 23, pp. 151-160, 08 2018. [CrossRef]
- International Organization for Standardization, ISO 148-1:2009. Metallic materials—Charpy pendulum impact test—Part 1: Test method, Geneva, Switzerland, 2009.
- D. Jelaska, "Osnovi mehanike loma, 2. Dio: širenje pukotine”. Available online: https://bib.irb.hr/datoteka/121375.Cl-MehLoma2.pdf. (accessed 02 06 2025).
- P. Paris and F. Erdogan, "A Critical Analysis of Crack Propagation Laws," Journal of Basic Engineering, vol. 85, no. 4, p. 6, 1963. [CrossRef]
- T. L. Anderson, Fracture Mechanics: Fundamentals and Applications, Boca Raton: CRC Press, 2017.
- D. Broek, Elementary Engineering Fracture Mechanics, Dodrecht: Martinus Nijhoff Publishers, 1986. [CrossRef]
- ASTM International, ASTM E1820. Standard Test Method for Measurement of Fracture Toughness, West Conshohocken, Pennsylvania, 2019.
- K. Schwalbe, B. Neal and J. Heerens, The GKSS Test Procedure for Determining the Fracture Behaviour of Materials, Geesthacht: GKSS Forschungszentrum Geesthacht GmbH, 1994.
- N. Gubeljak, Mehanika loma, Maribor: Fakulteta za strojništvo, 2008.
- J. J. Lewandowski and M. Seifi, "Metal Additive Manufacturing: A Review of Mechanical Properties," Annual Review of Materials Science, vol. 46, no. 1, pp. 151-186, 07 2016. [CrossRef]
- ASTM International, ASTM E466-96. Standard Practice for Conducting Force Controlled Constant Amplitude Axial Fatigue Tests of Metallic Materials, West Conshohocken, Pennsylvania, 2021.
- Riemer, S. Leuders, M. Thöne, H. A. Richard, T. Tröster and T. Niendorf, "On the fatigue crack growth behavior in 316L stainless steel manufactured by selective laser melting," Engineering Fracture Mechanics, vol. 120, pp. 15-25, 04 2014. [CrossRef]
- P. Taherzadeh, K. Kelleci and S. Özer, "Biomechanical Effects of the Implant Designed for Posterior Dynamic Stabilization of the Lumbar Spine (L4-L5): A Finite Element Analysis Study," vol. 31, no. 1, pp. 193-199, 2024. [CrossRef]
- Gelo I.; Kozak D.; Gubeljak N.; Vuherer T. Comparative Analysis of Fracture Mechanics Parameters for Wrought and SLM Produced Ti-6Al-7Nb Alloy. New trends in fatigue and fracture - NT2F19, Tucson, Arizona –USA, October 8-10, 2019.
Figure 1.
Test specimen dimensions.
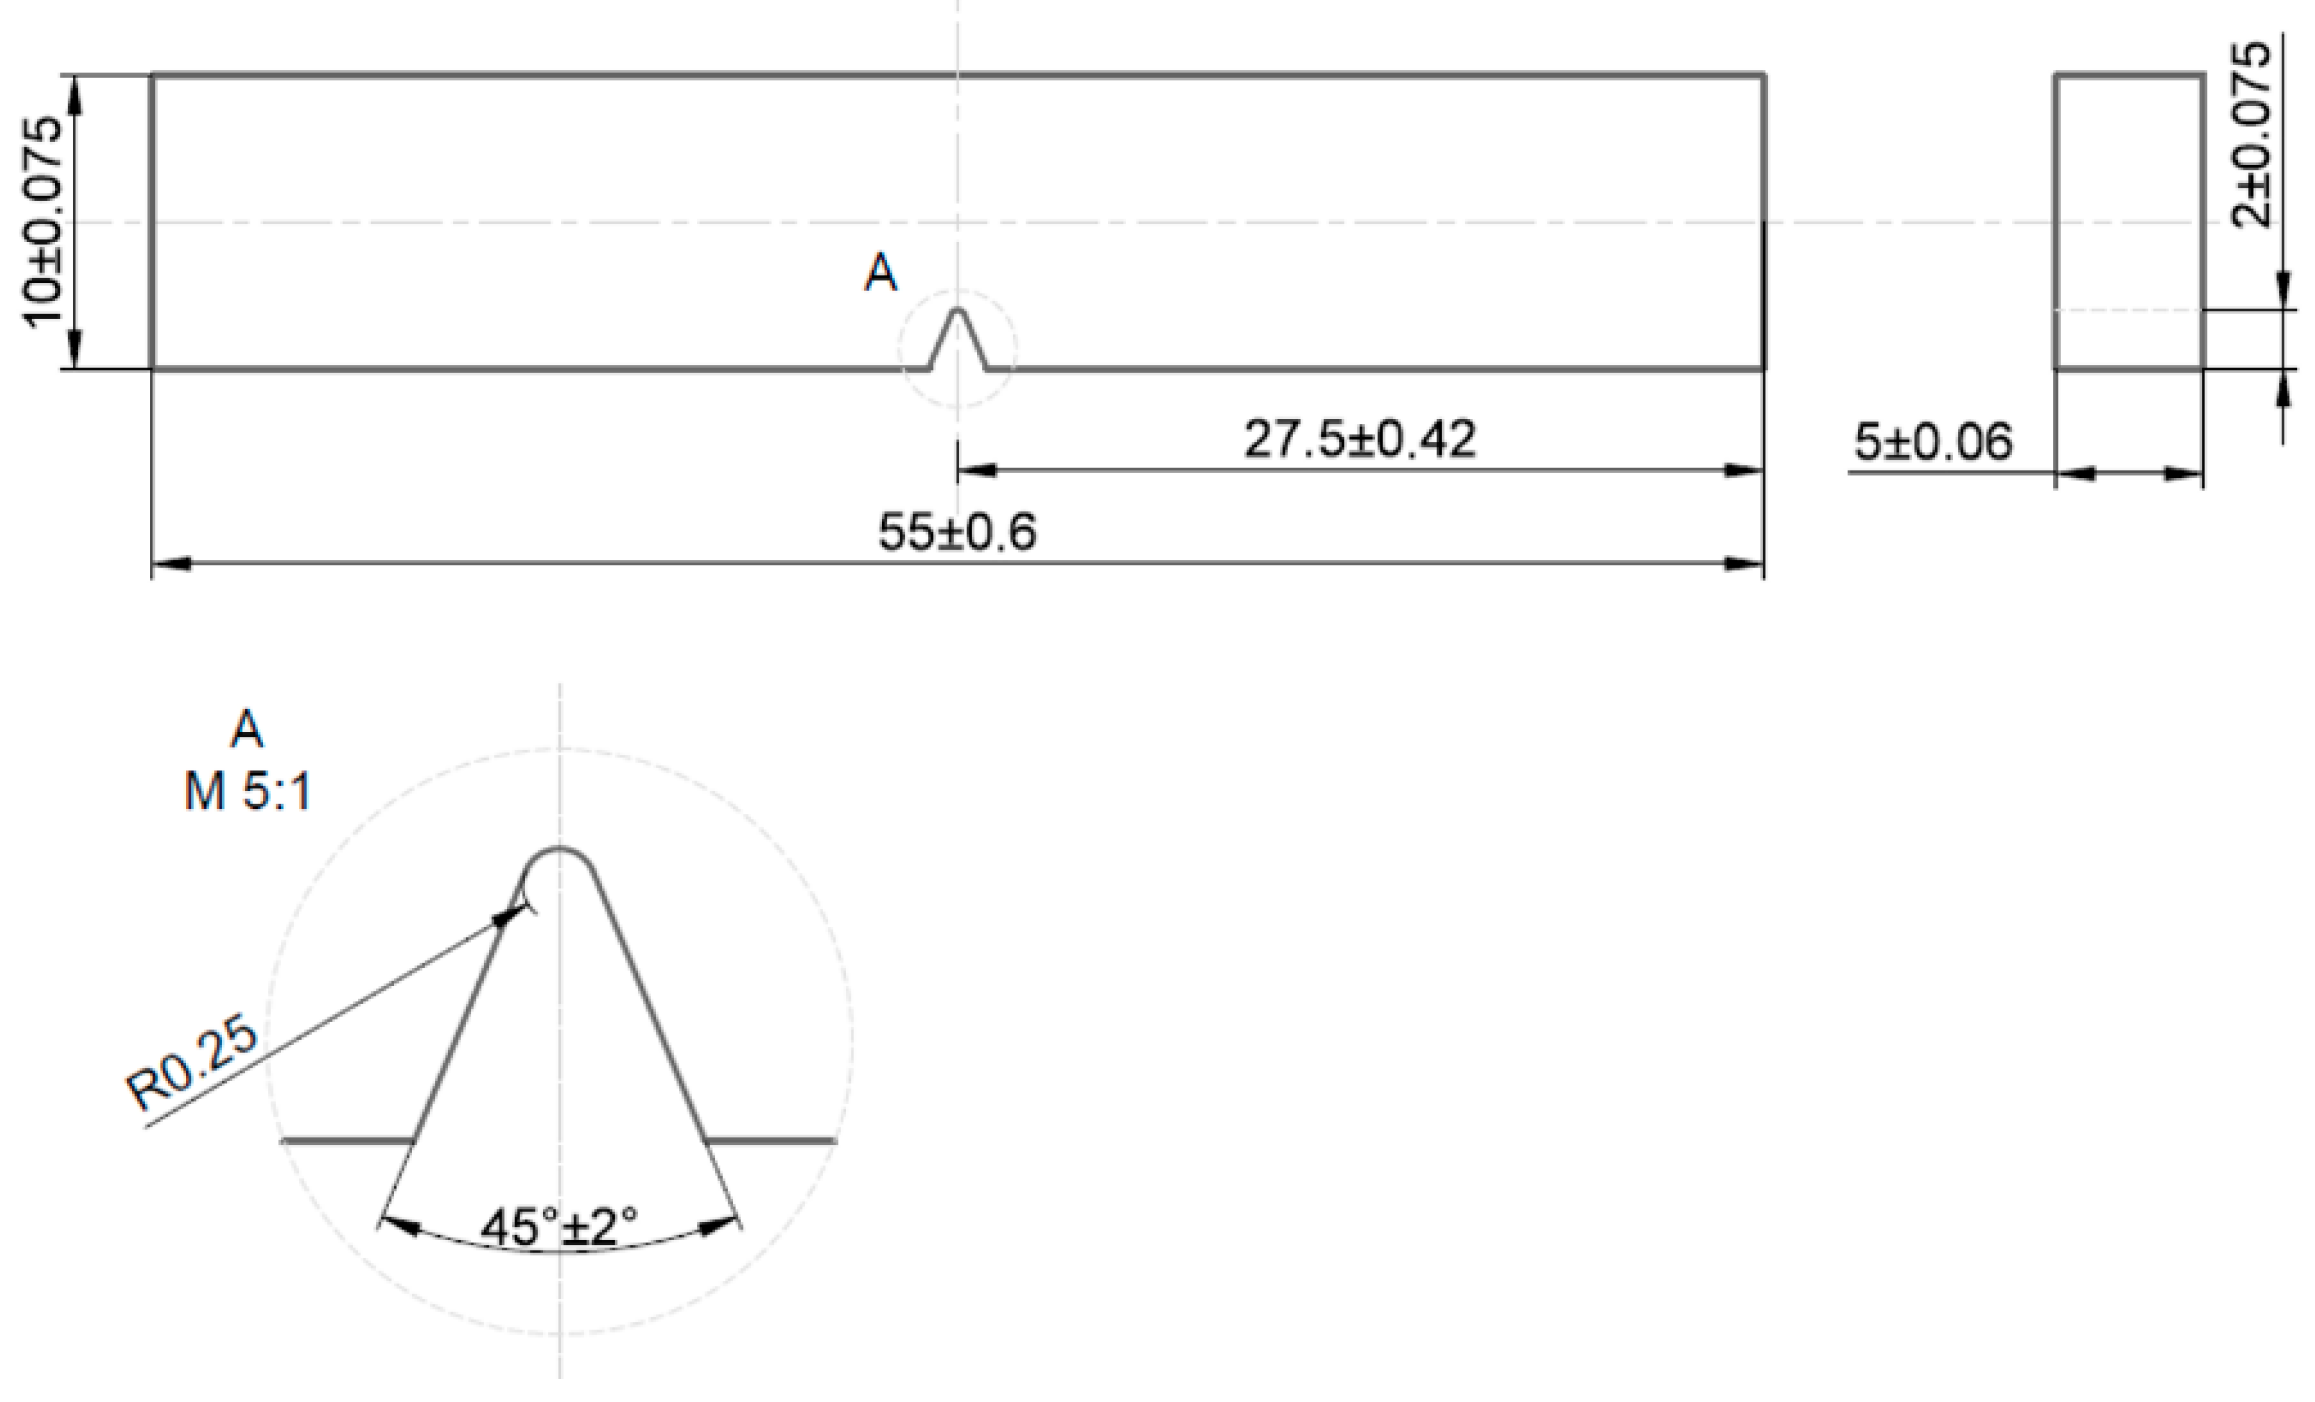
Figure 2.
Test specimen adjustment for three-point bending test.
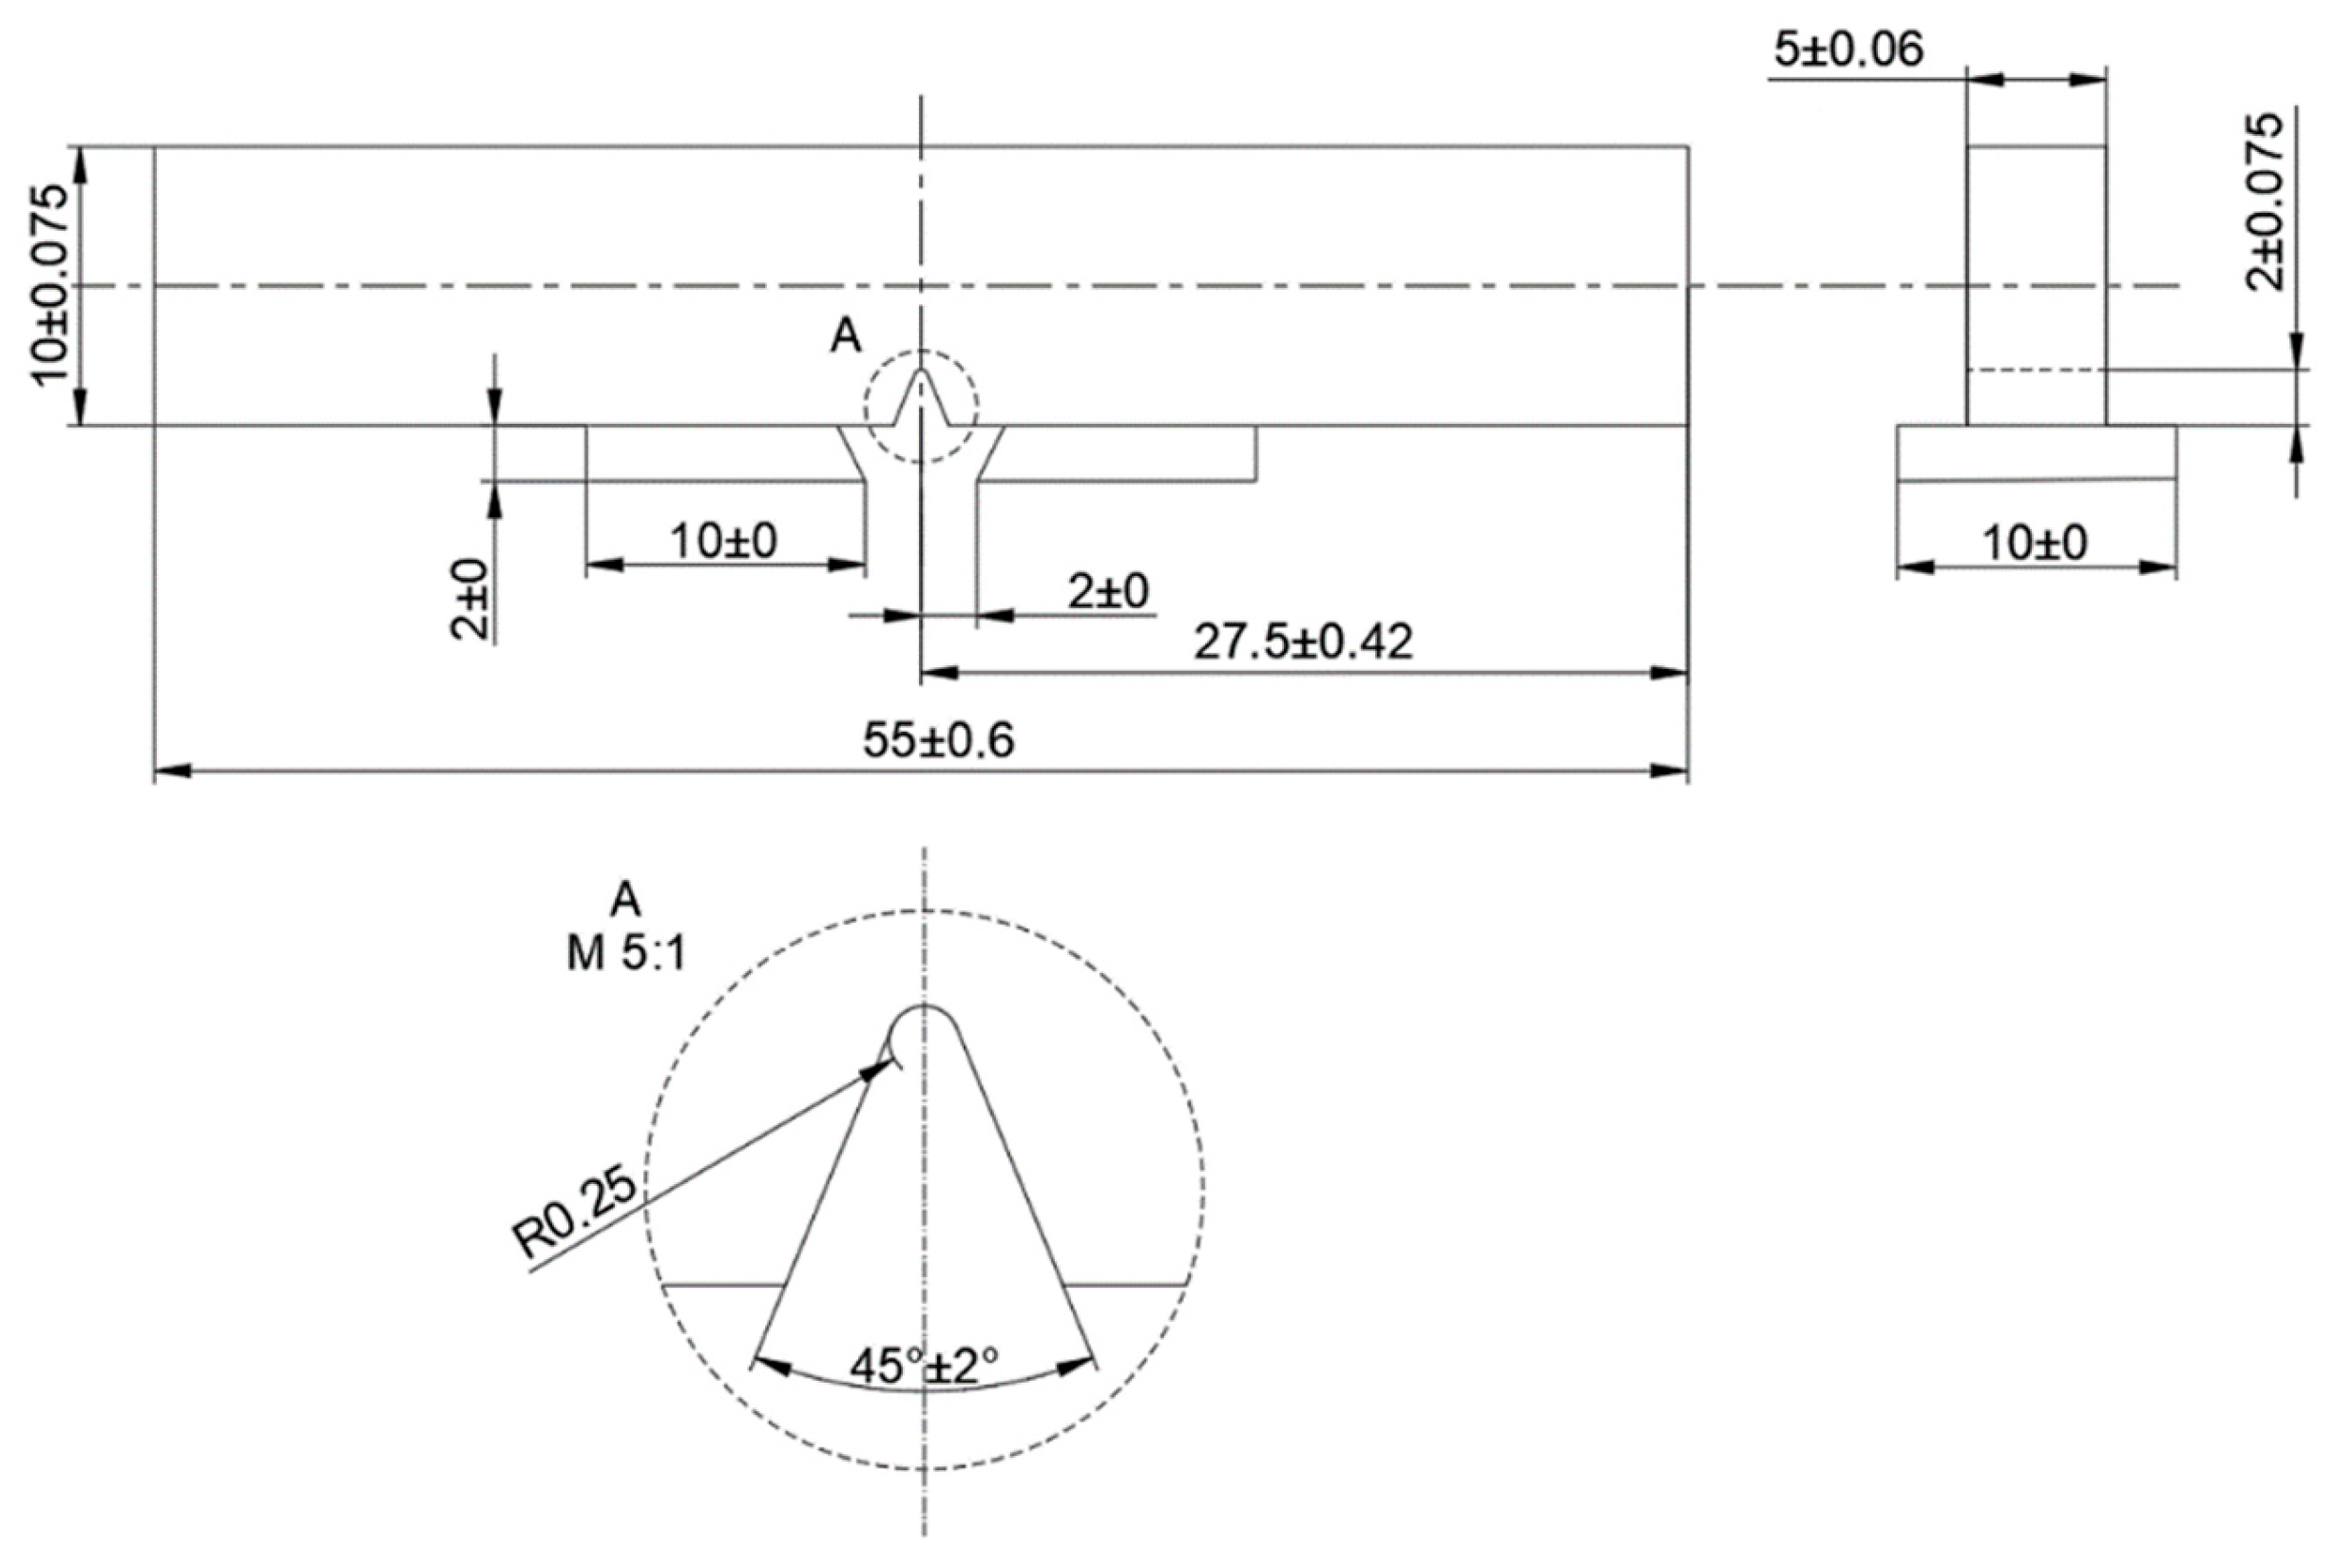
Figure 3.
Cylindrical test specimen dimensions.
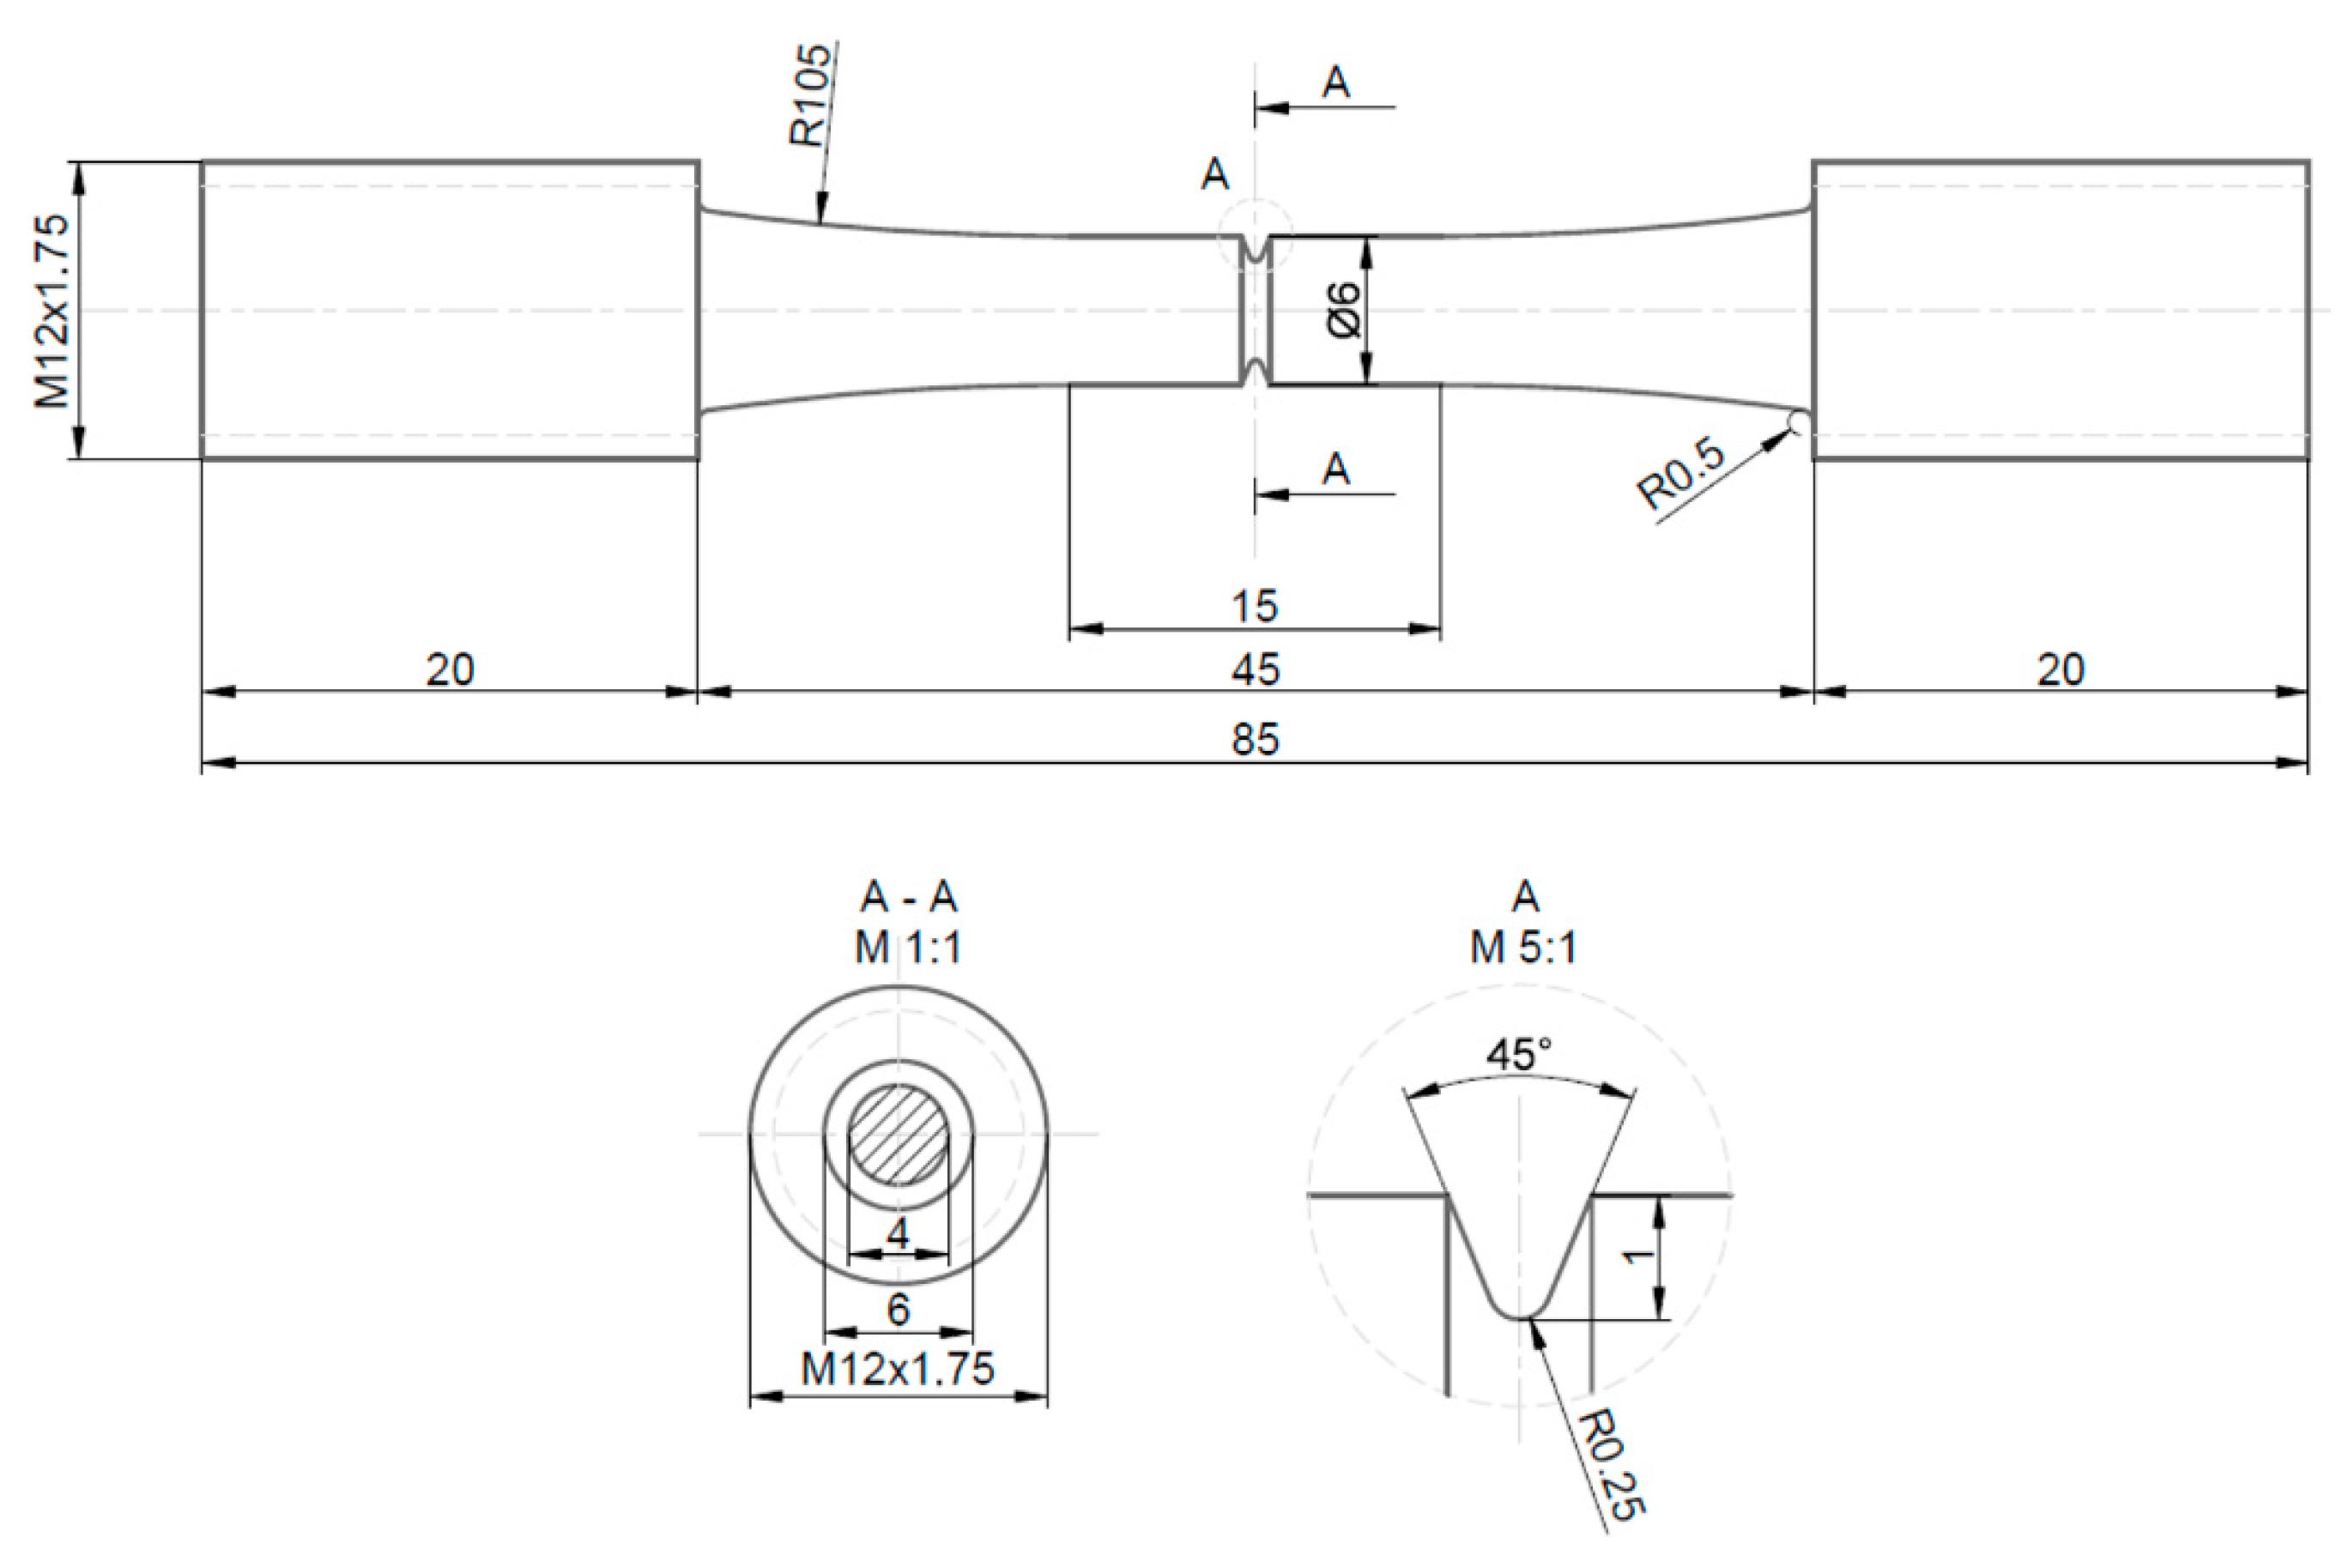
Figure 4.
Typical crack growth curve for metals [13].
Figure 4.
Typical crack growth curve for metals [13].
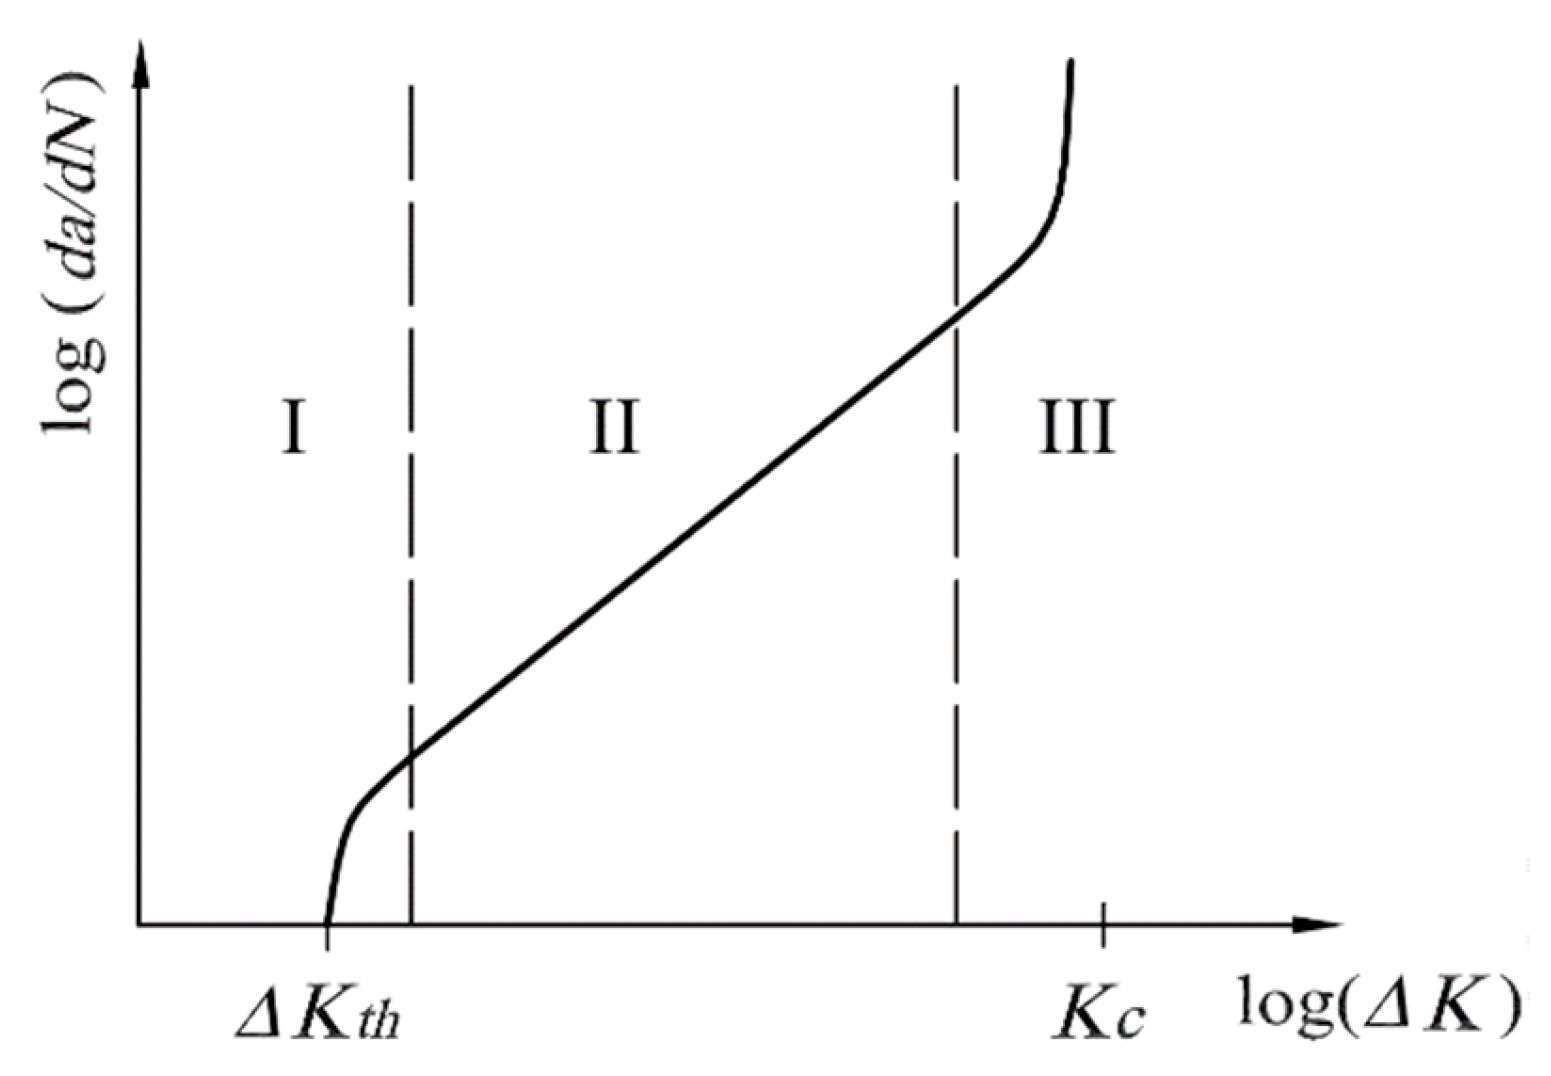
Figure 5.
Test specimen with measuring tape.
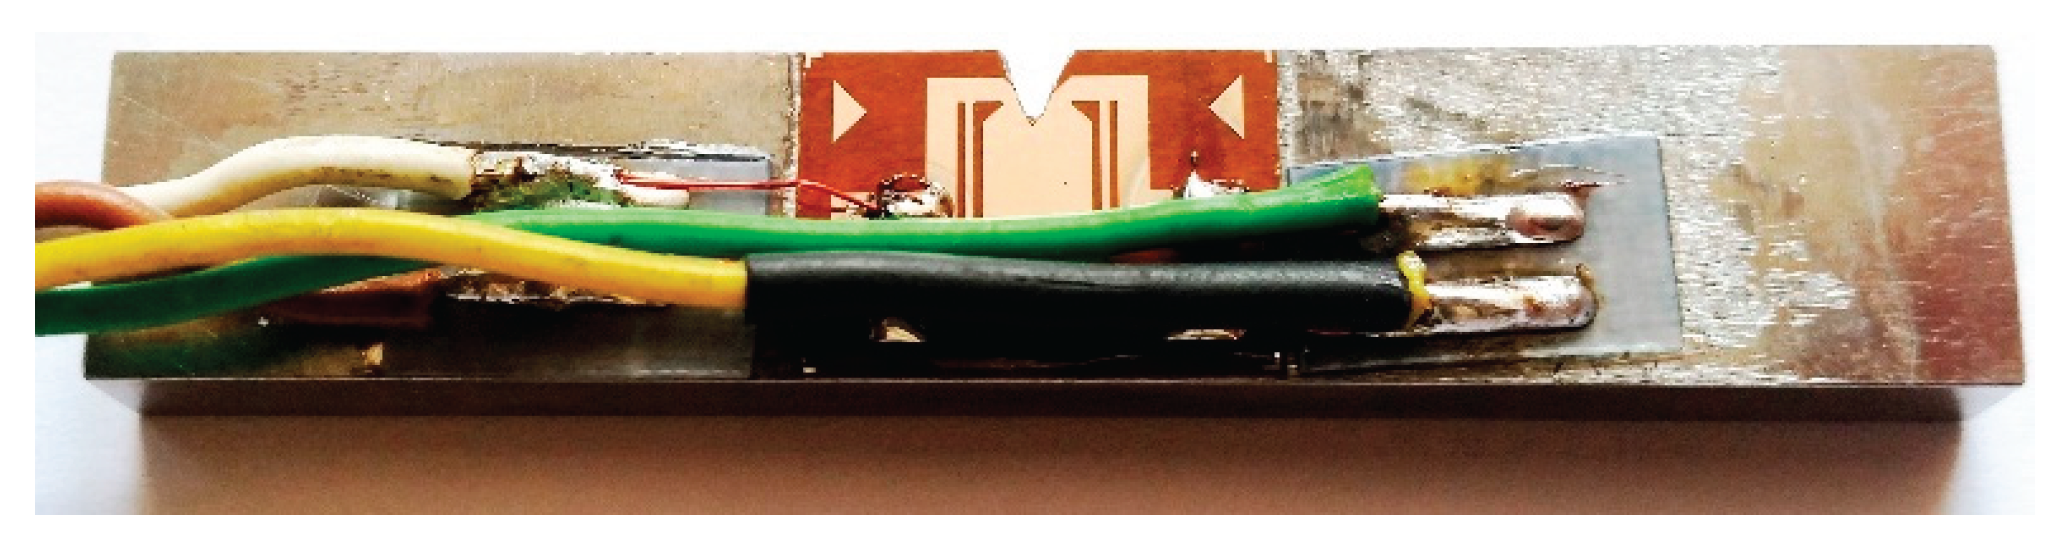
Figure 6.
Monitoring and measurement of crack growth using two microscopes.
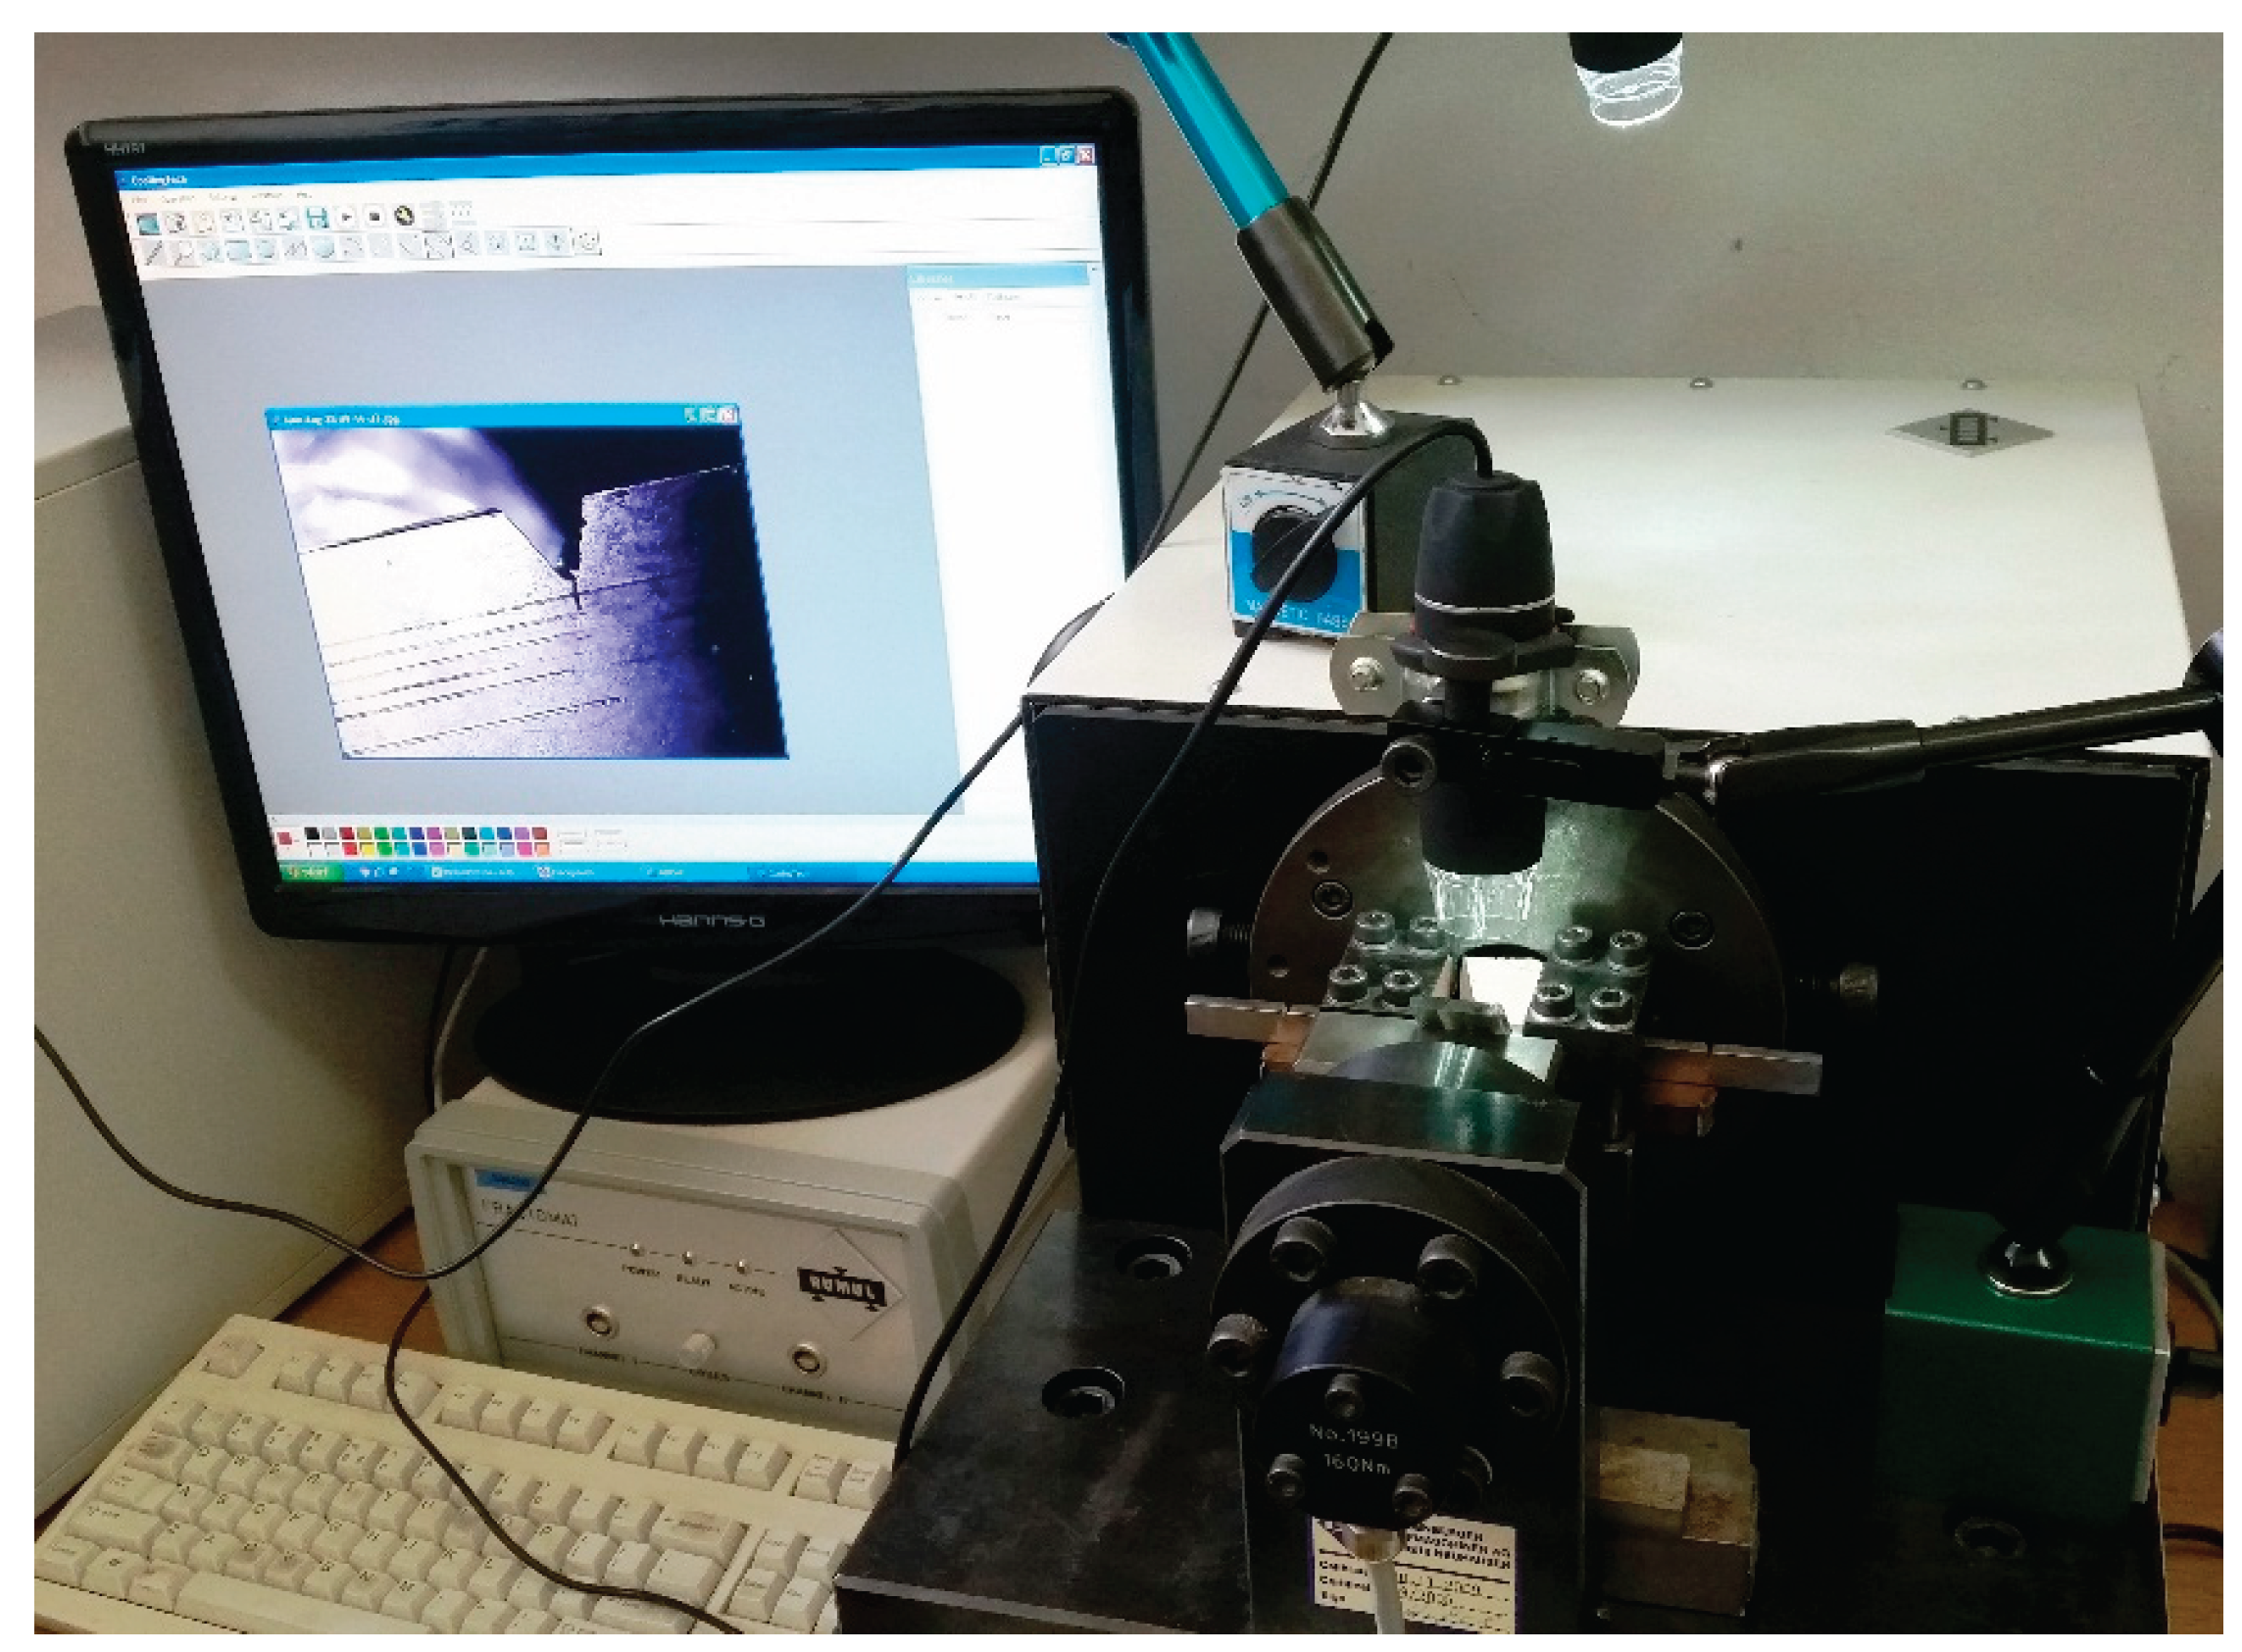
Figure 7.
Microscopic view of the crack on a test specimen with measurement scale.
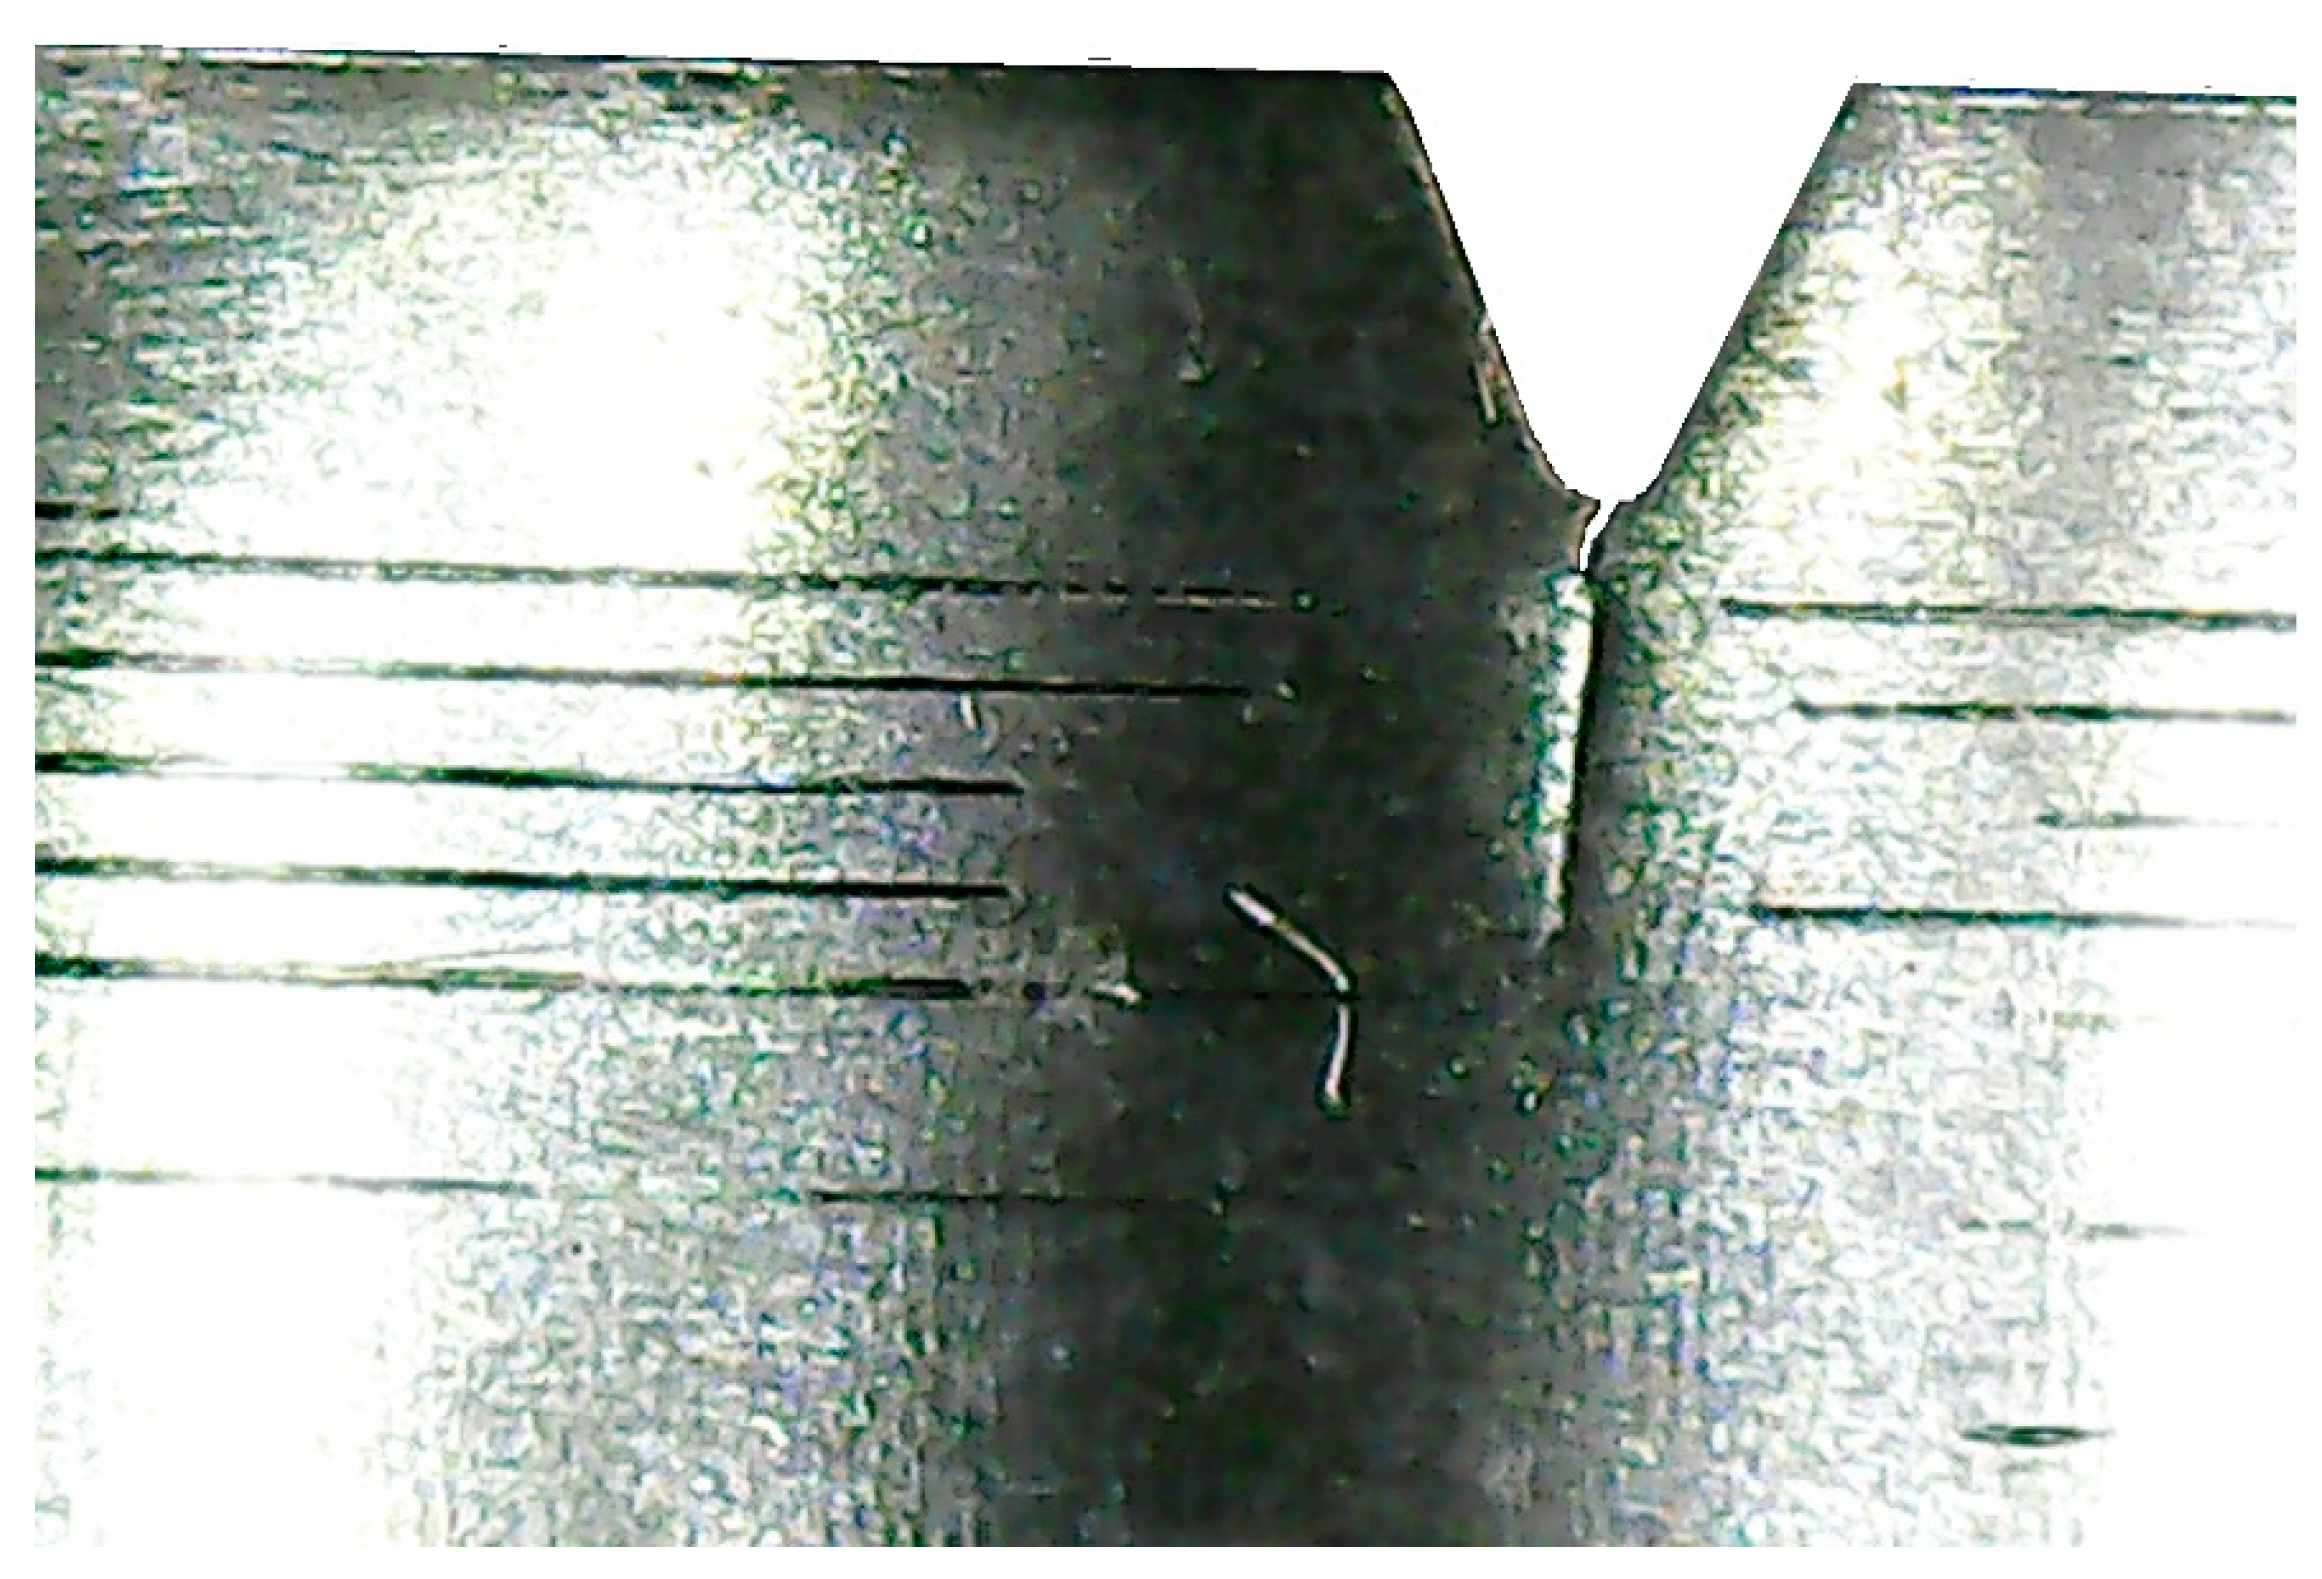
Figure 8.
Three point bending test setup with CMOD gauge.
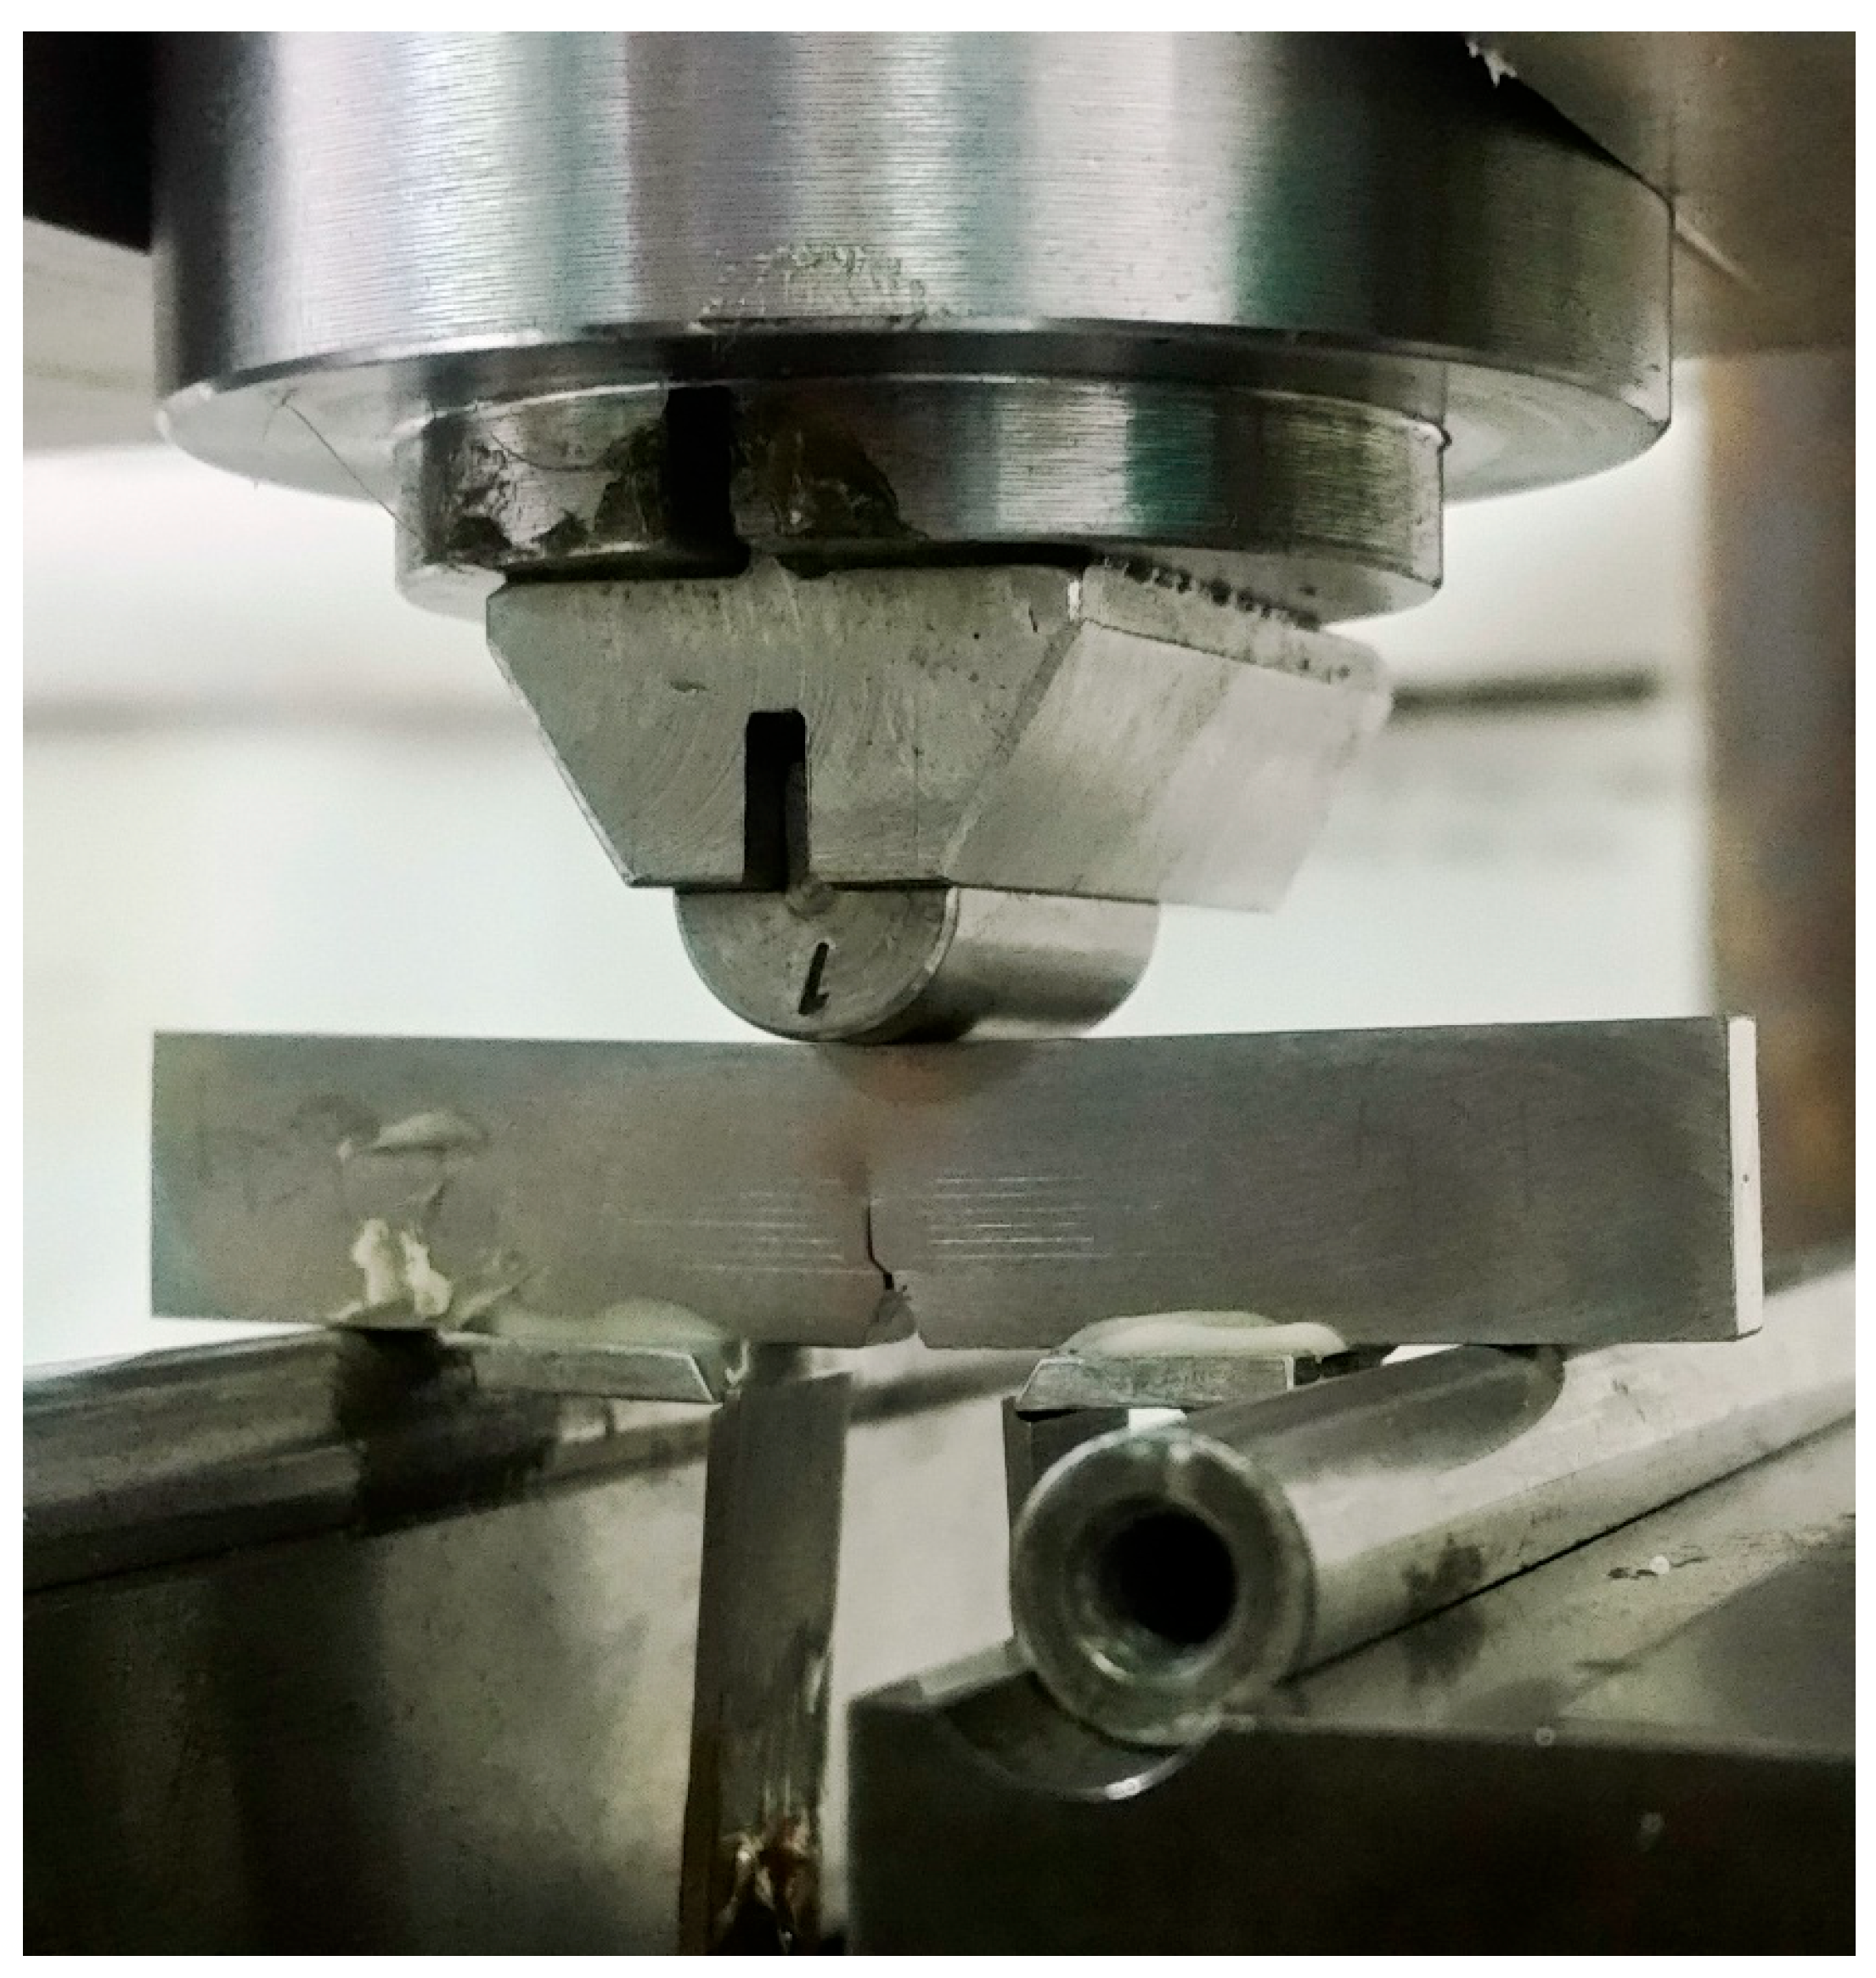
Figure 9.
a) Fractured surface of test specimen used for fracture toughness determination and b) presentation of measurement positions for measuring stable crack growth zone
Figure 9.
a) Fractured surface of test specimen used for fracture toughness determination and b) presentation of measurement positions for measuring stable crack growth zone
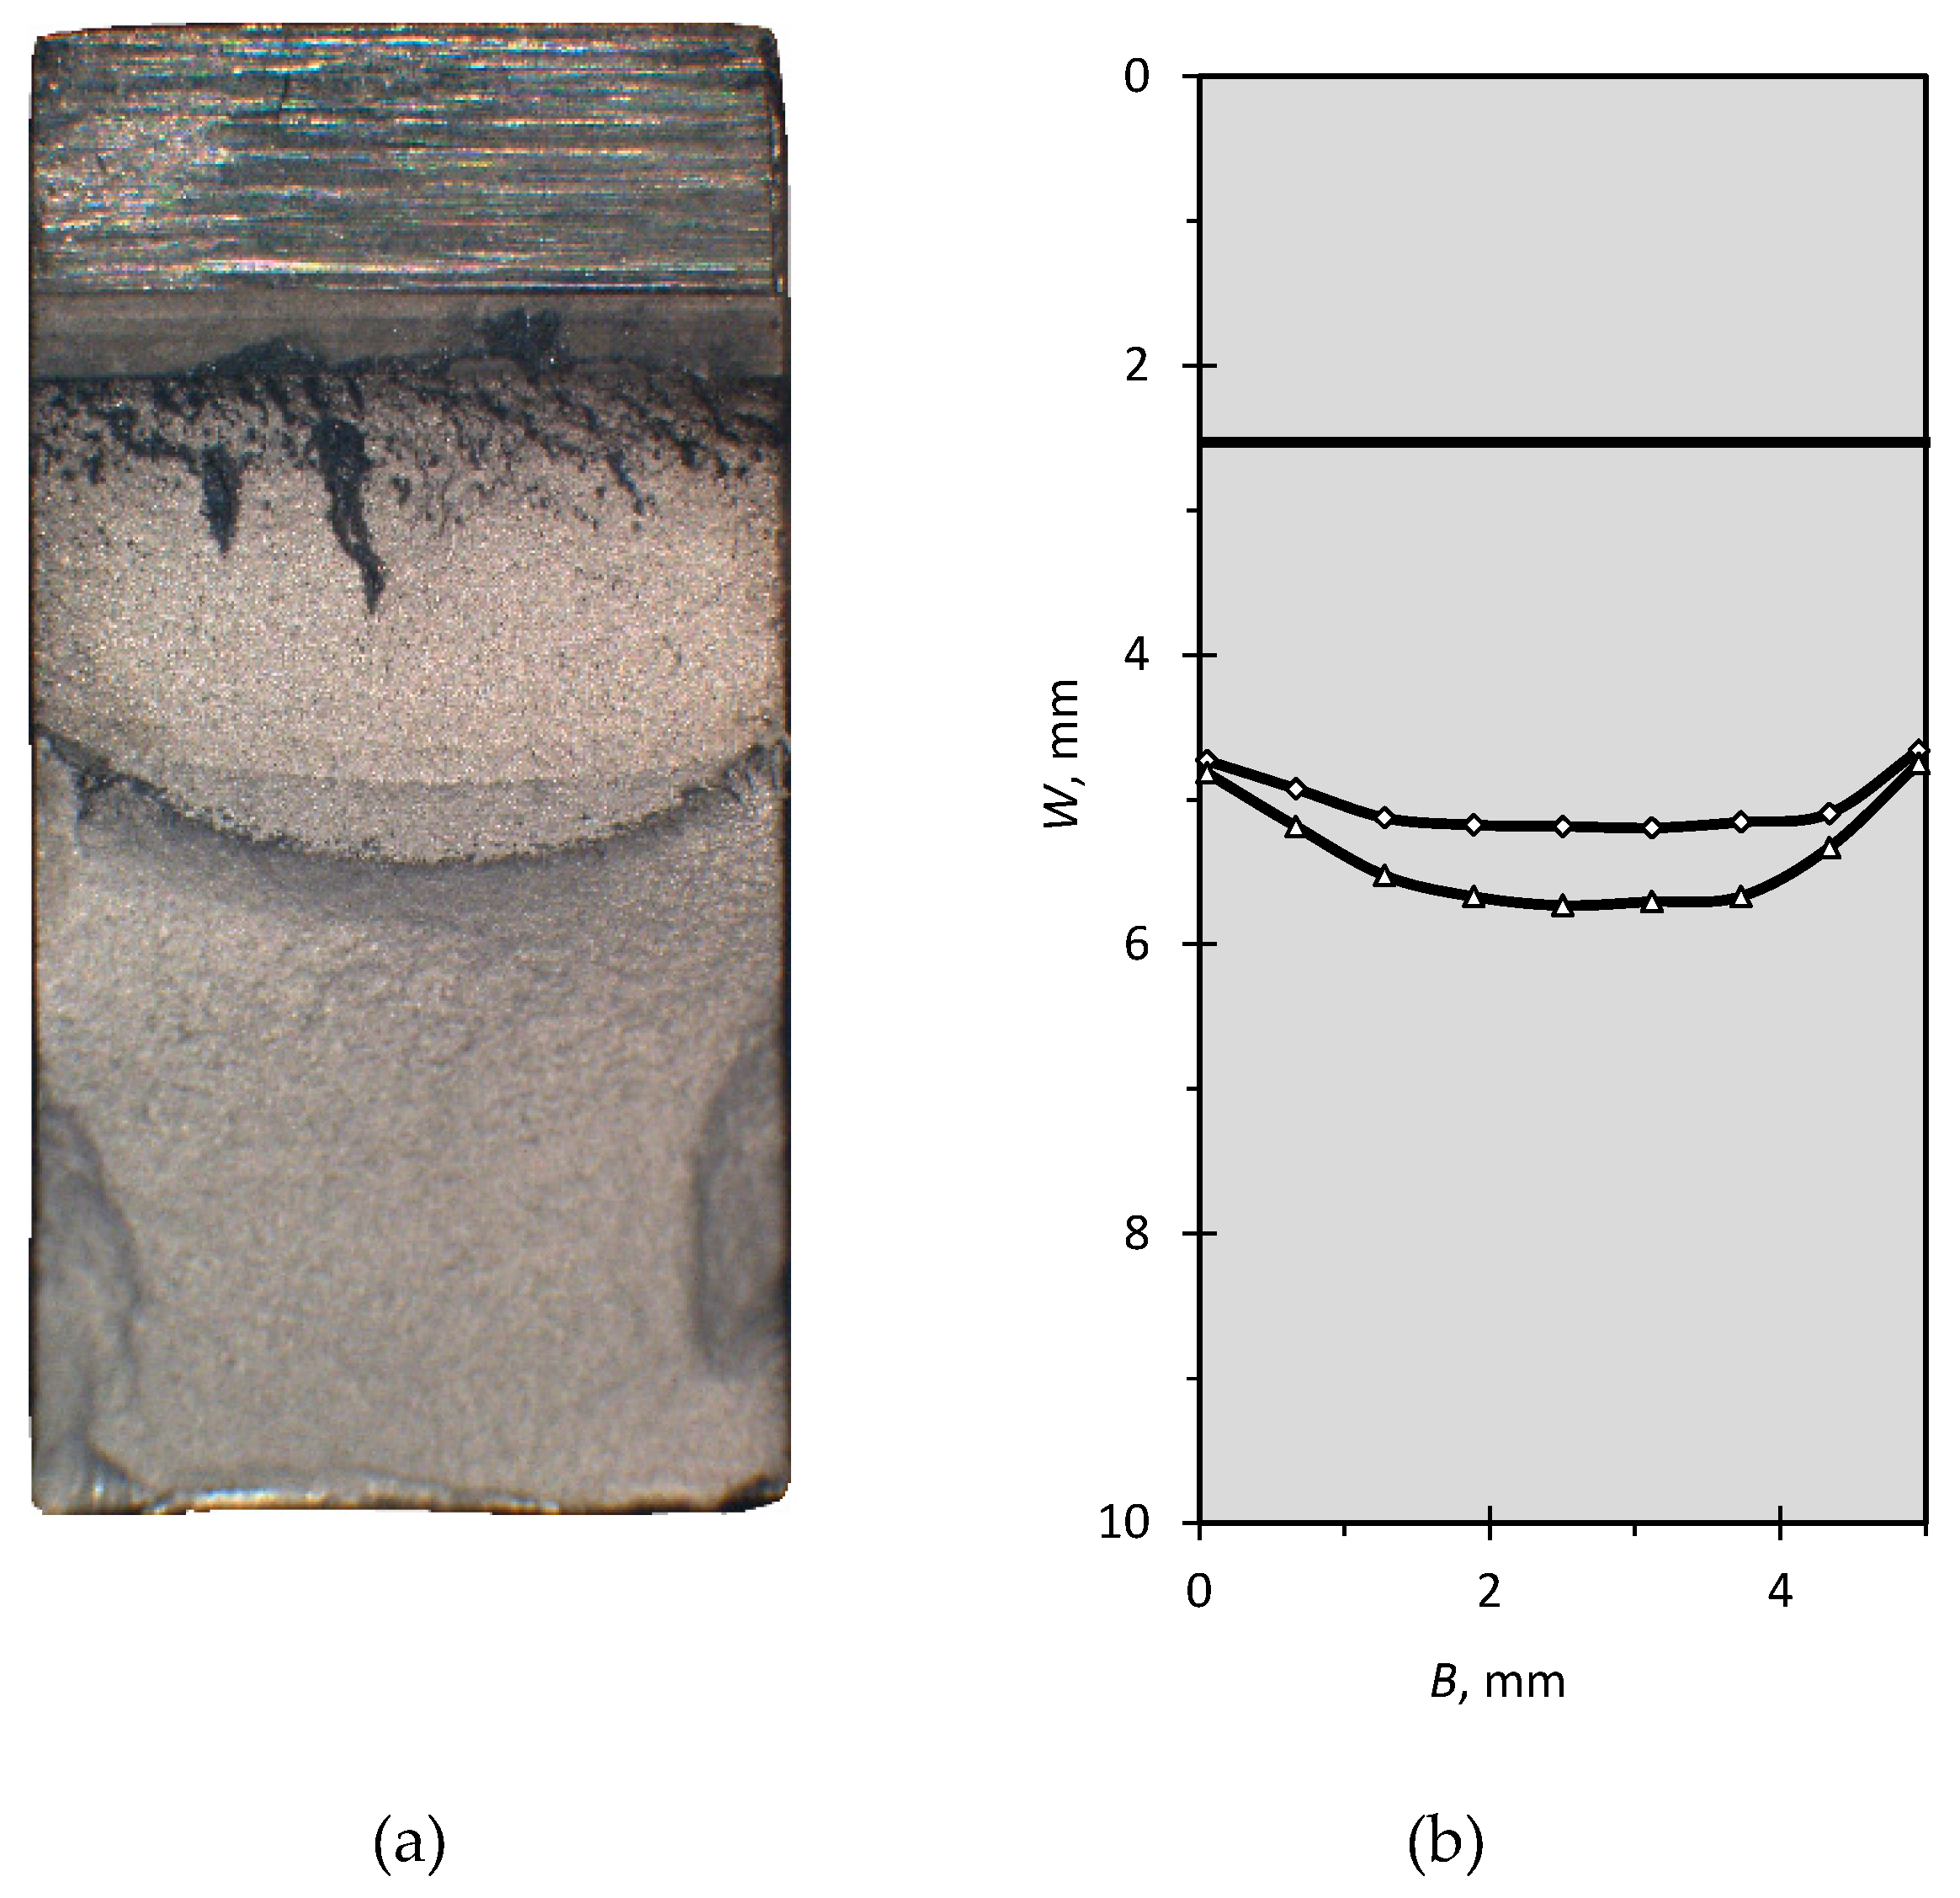
Figure 10.
First part of the crack growth curve for Ti-6Al-7Nb for a) test specimen produced out of drawn rod and b) test specimen produced by SLM process.
Figure 10.
First part of the crack growth curve for Ti-6Al-7Nb for a) test specimen produced out of drawn rod and b) test specimen produced by SLM process.
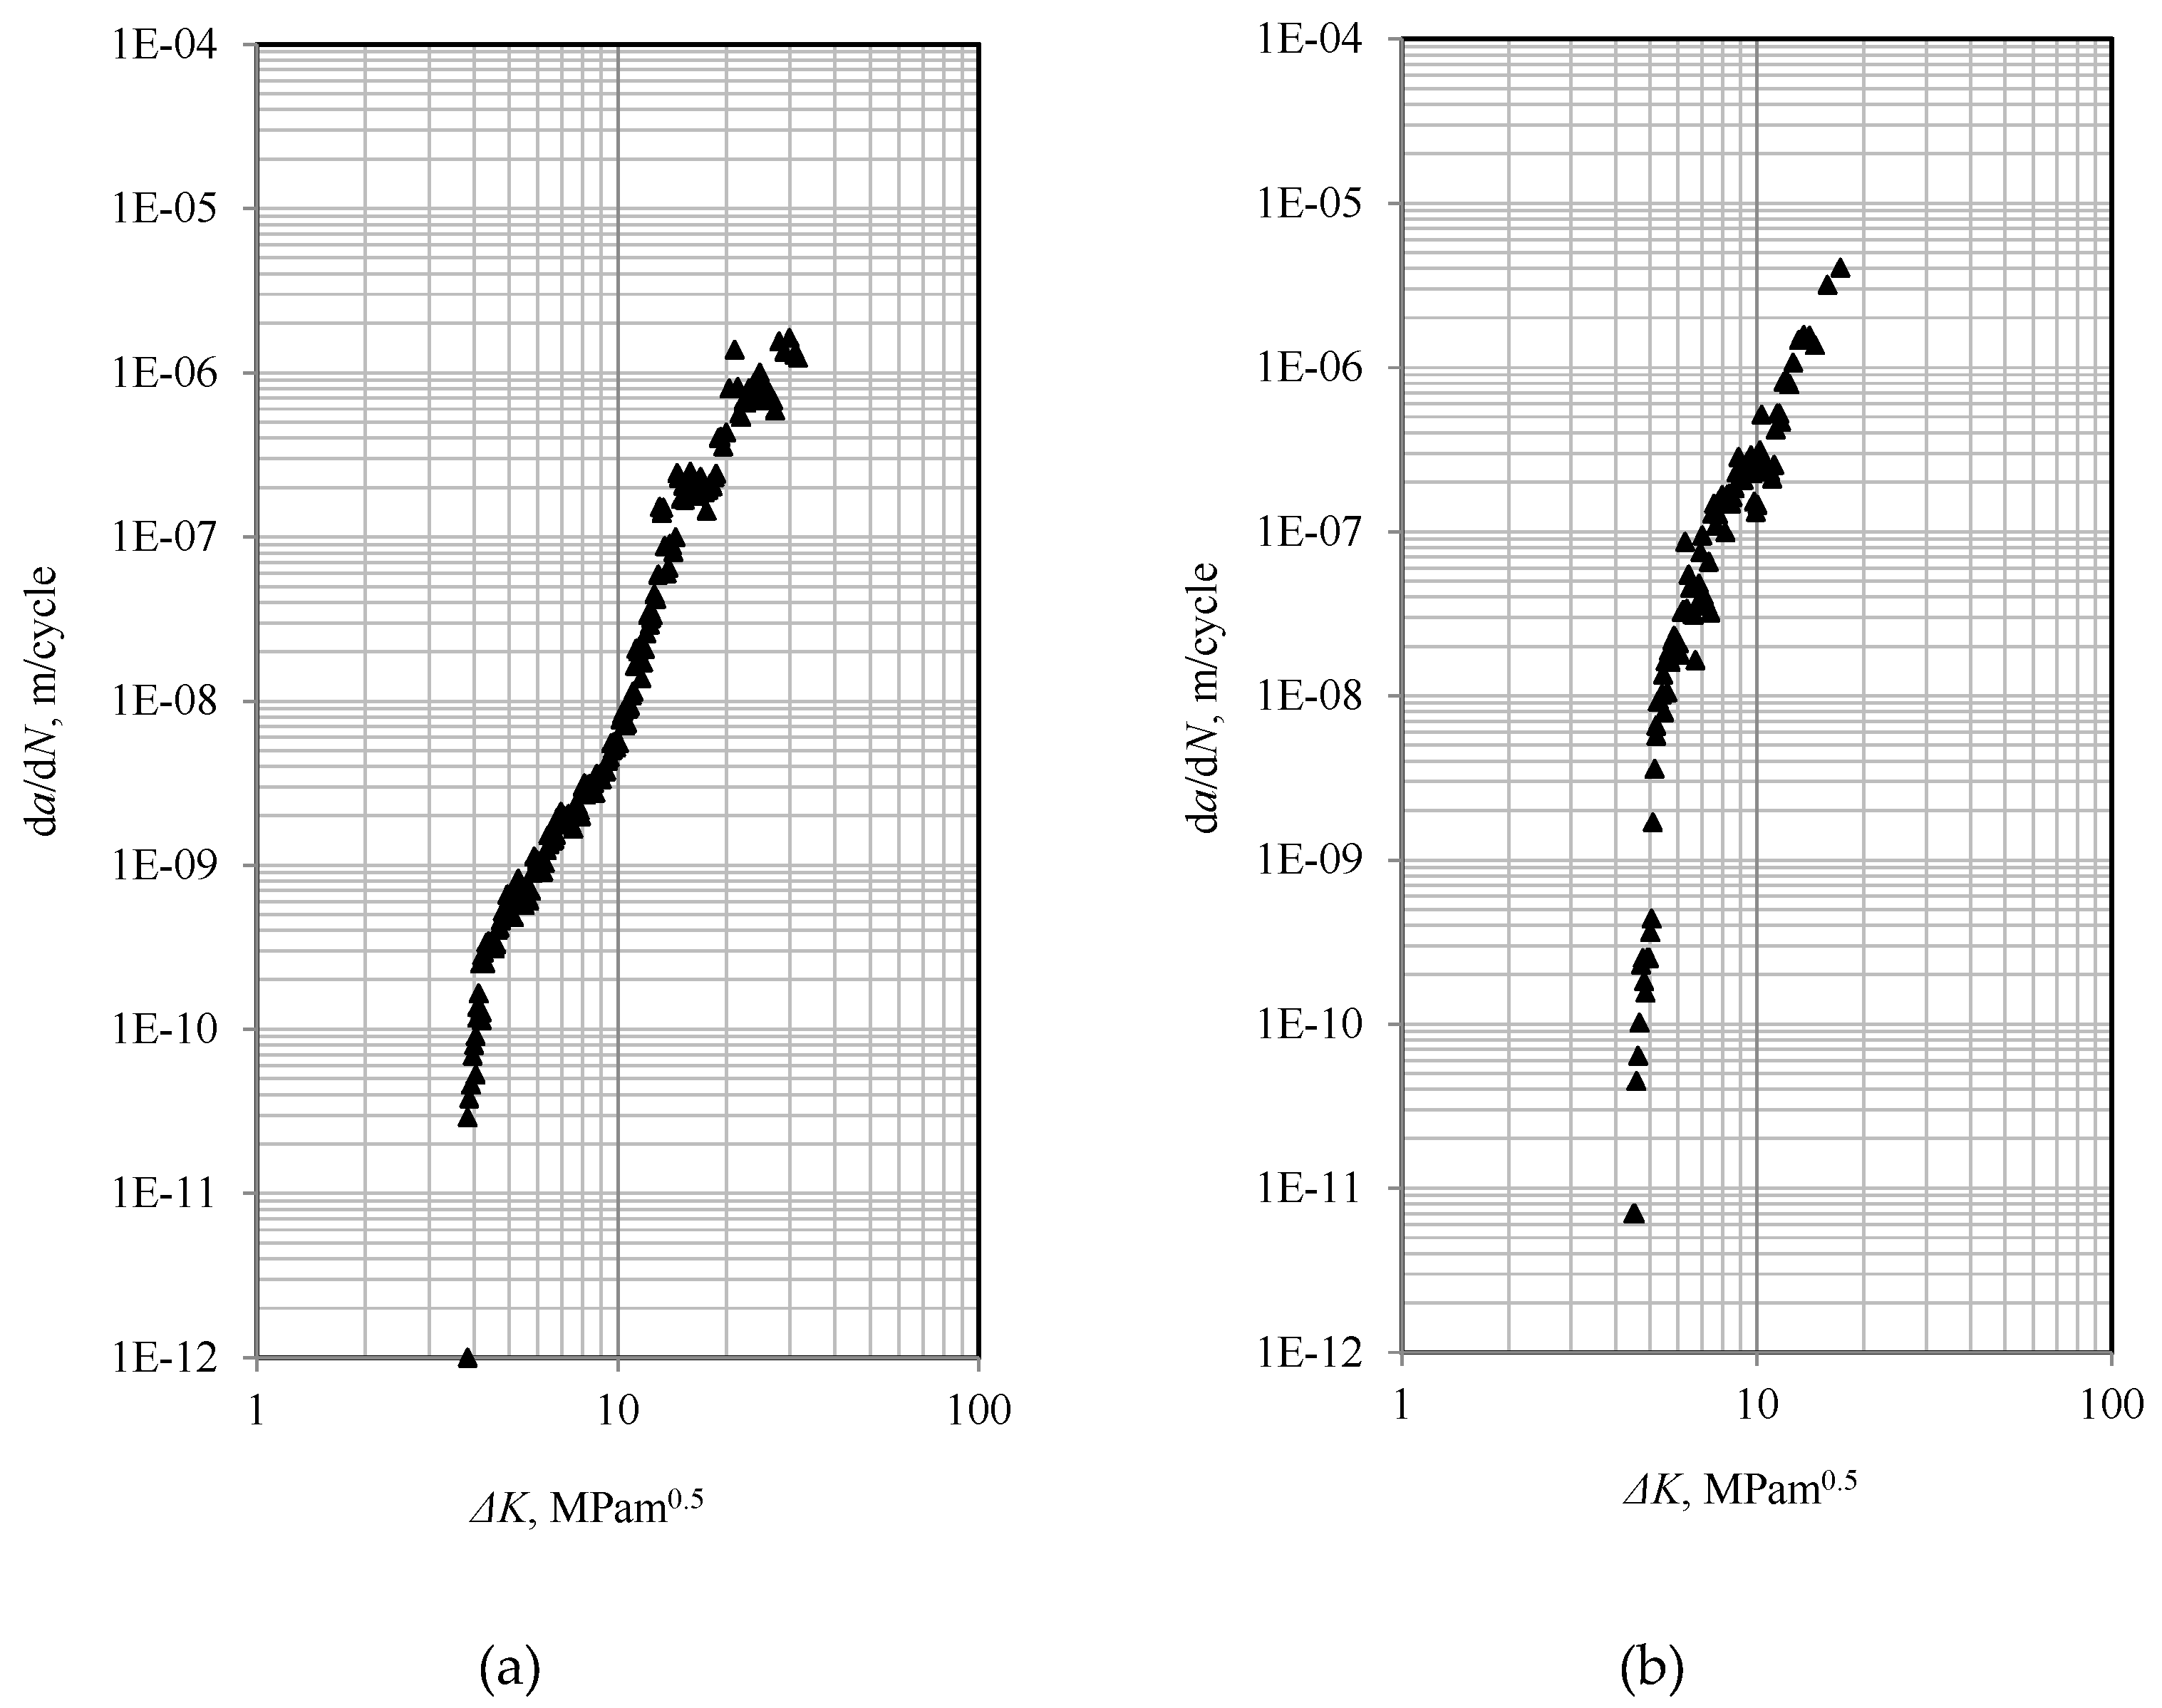
Figure 11.
J-R resistance curve for Ti-6Al-7Nb produced by drawing.
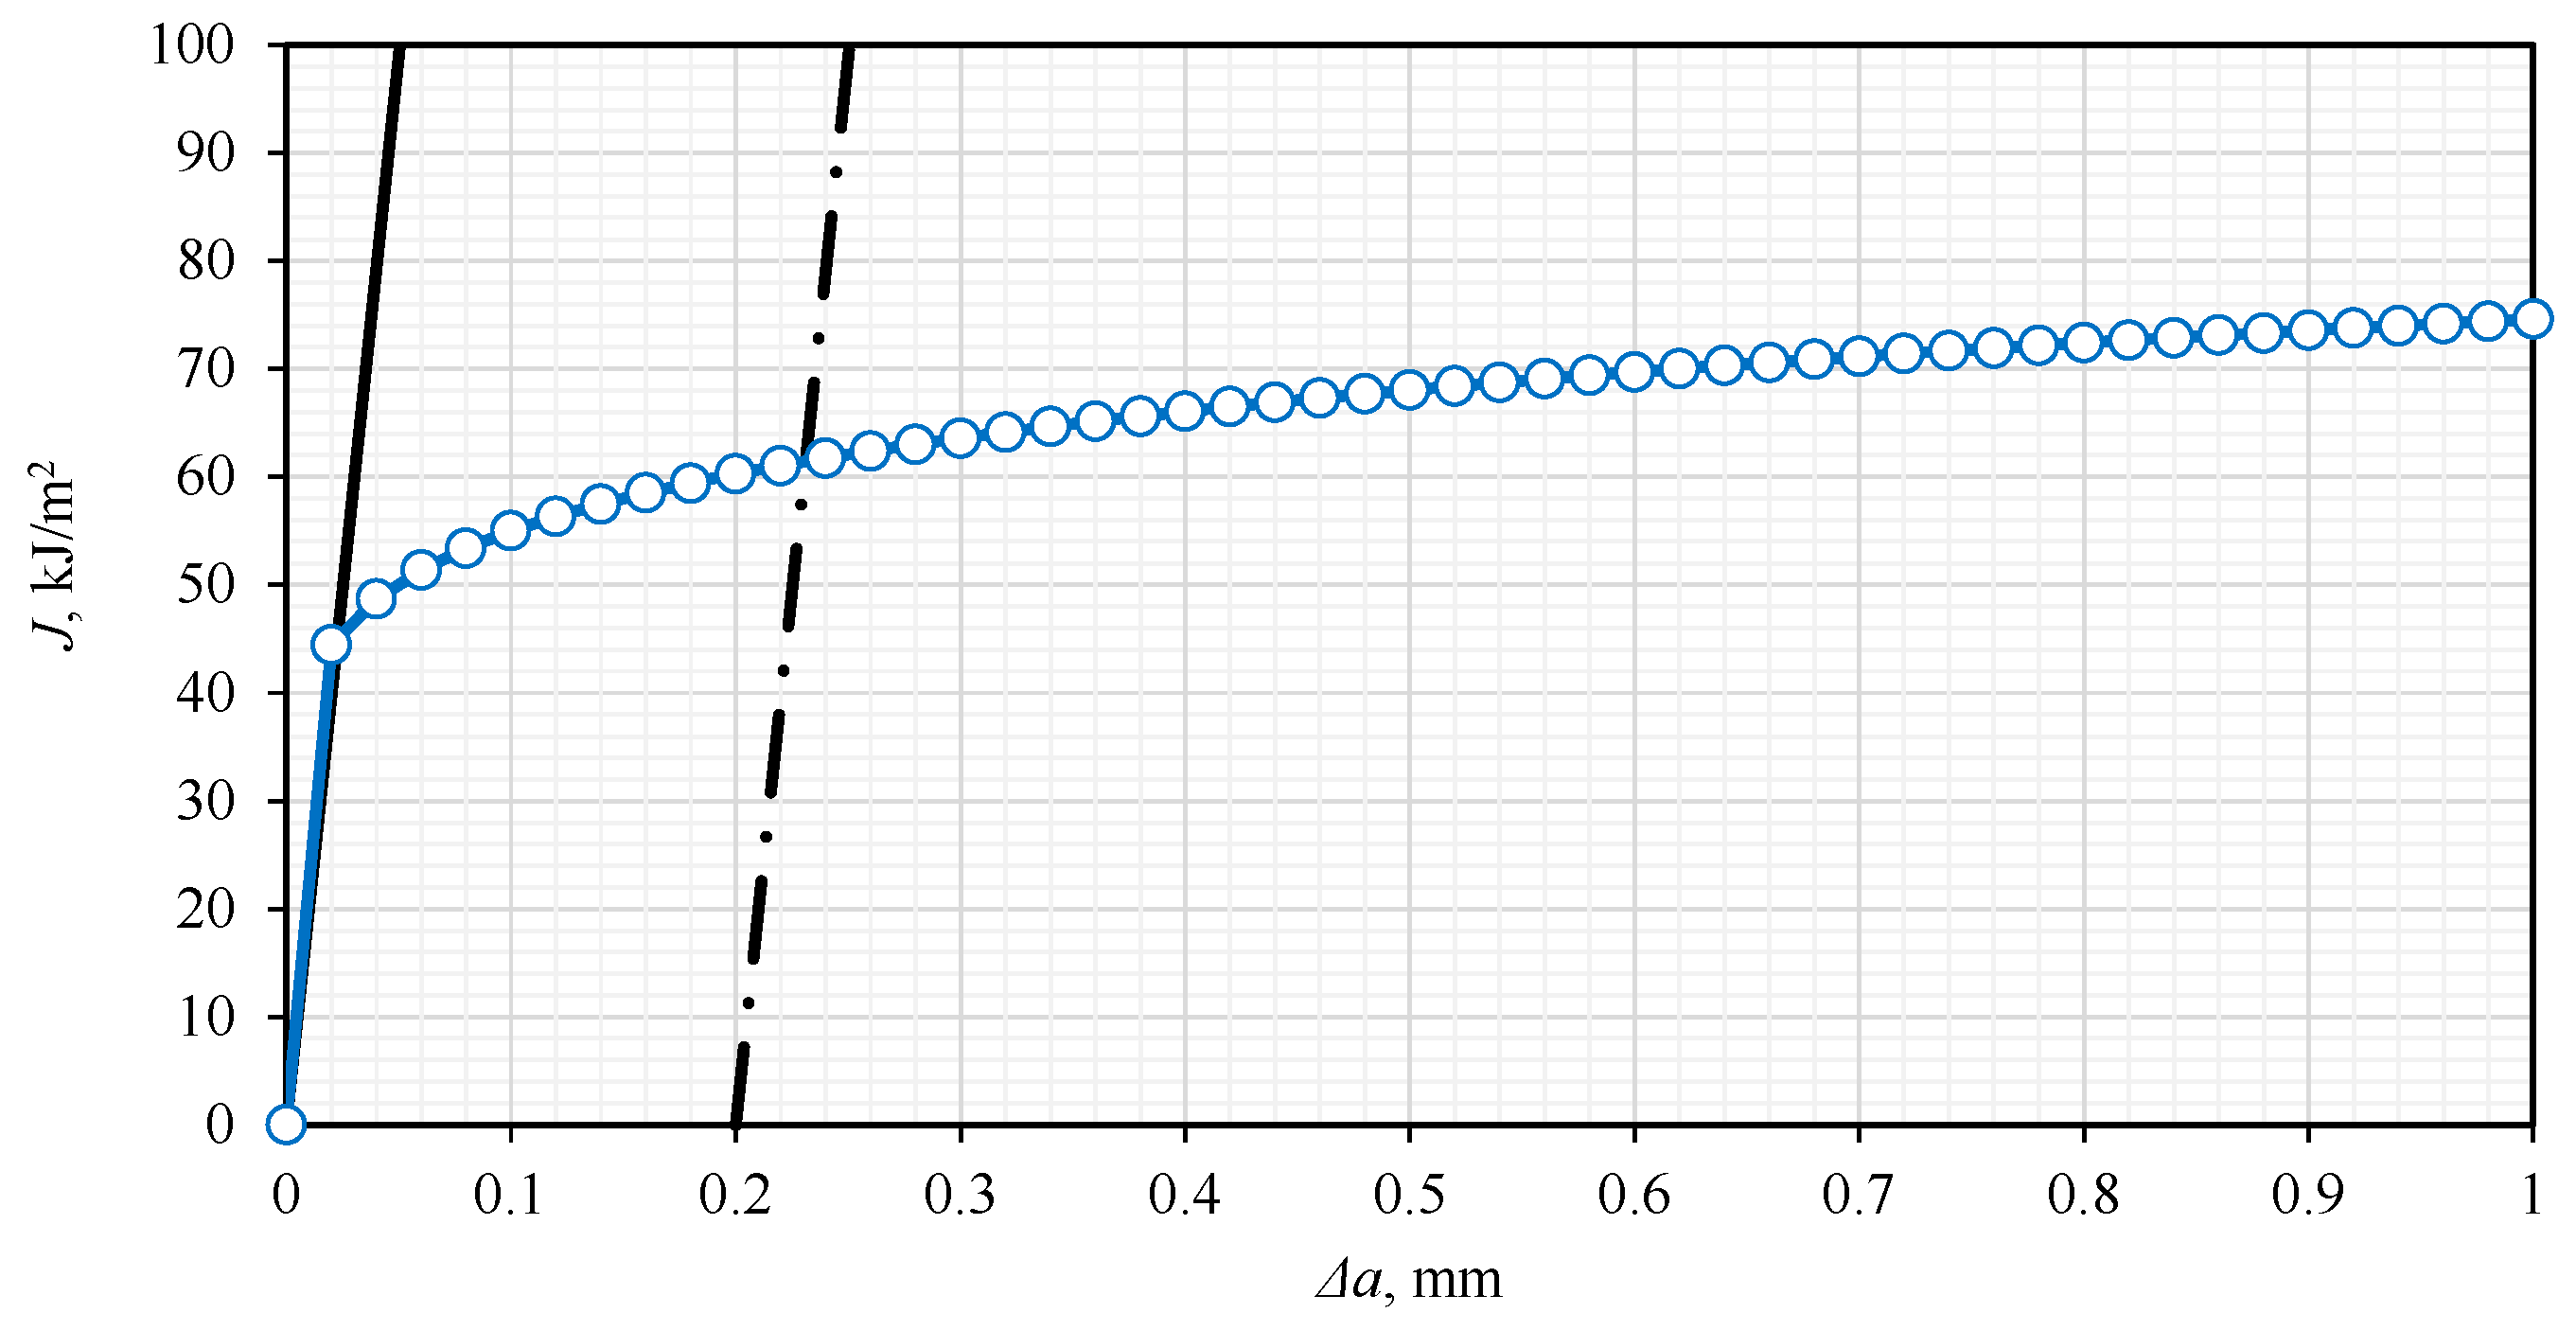
Figure 12.
CTOD-R resistance curve for Ti-6Al-7Nb produced by drawing.
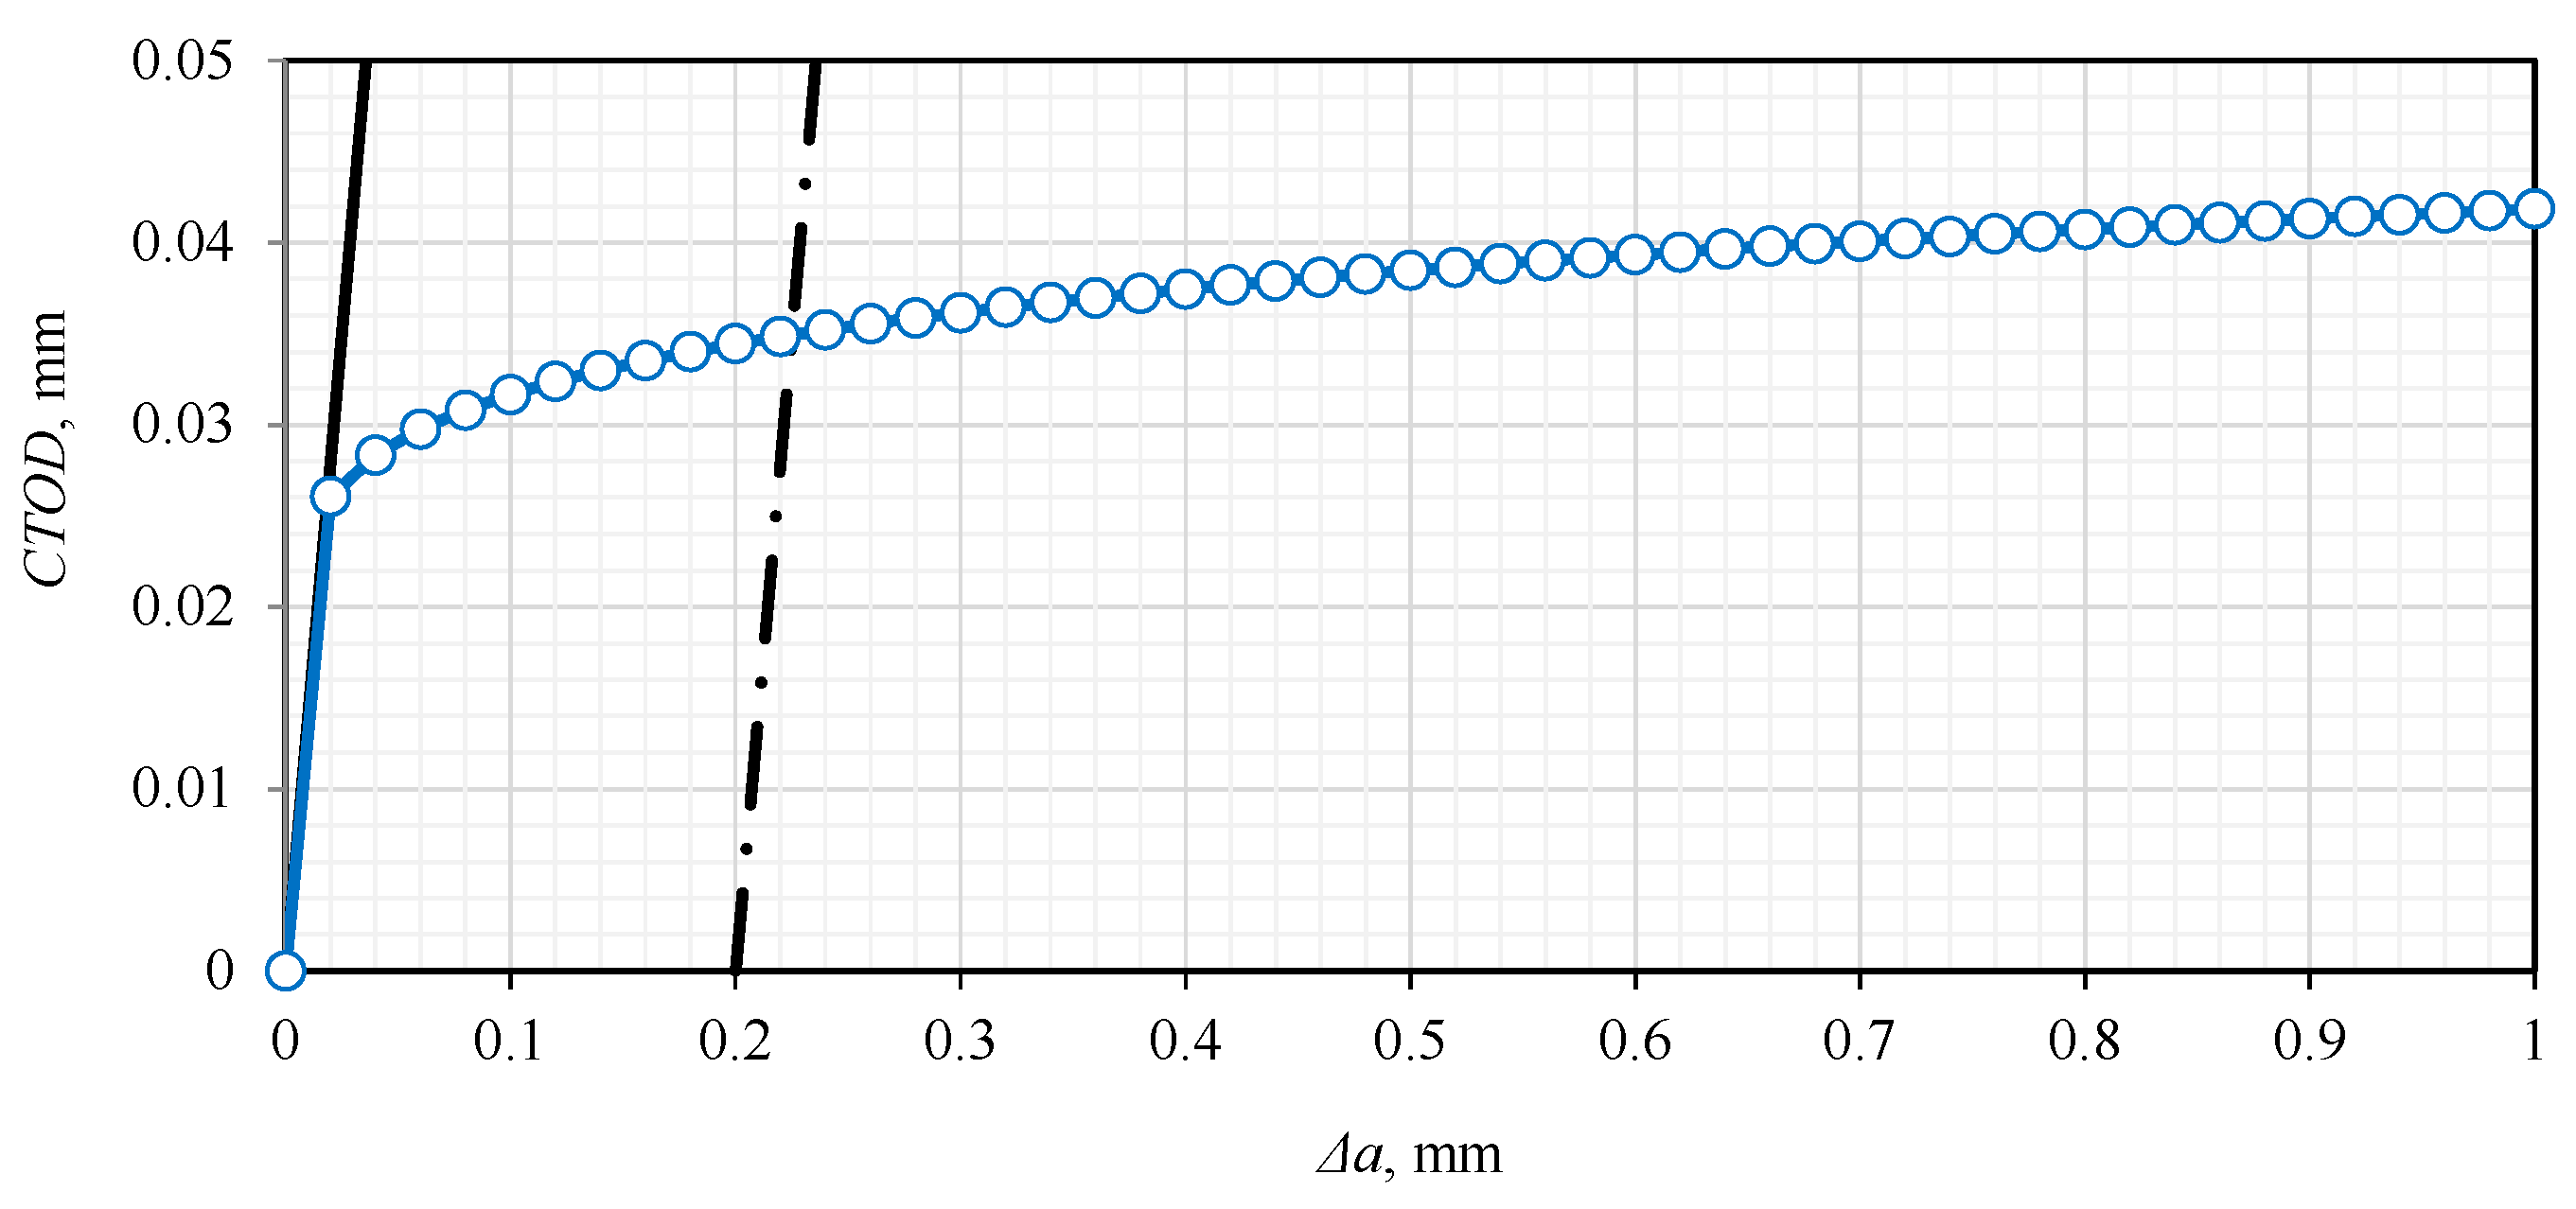
Figure 13.
Fracture surface of the cylindrical test specimen after fracture with measurements D and d for a) test specimen produced out of drawn rod and b) test specimen produced by SLM process.
Figure 13.
Fracture surface of the cylindrical test specimen after fracture with measurements D and d for a) test specimen produced out of drawn rod and b) test specimen produced by SLM process.
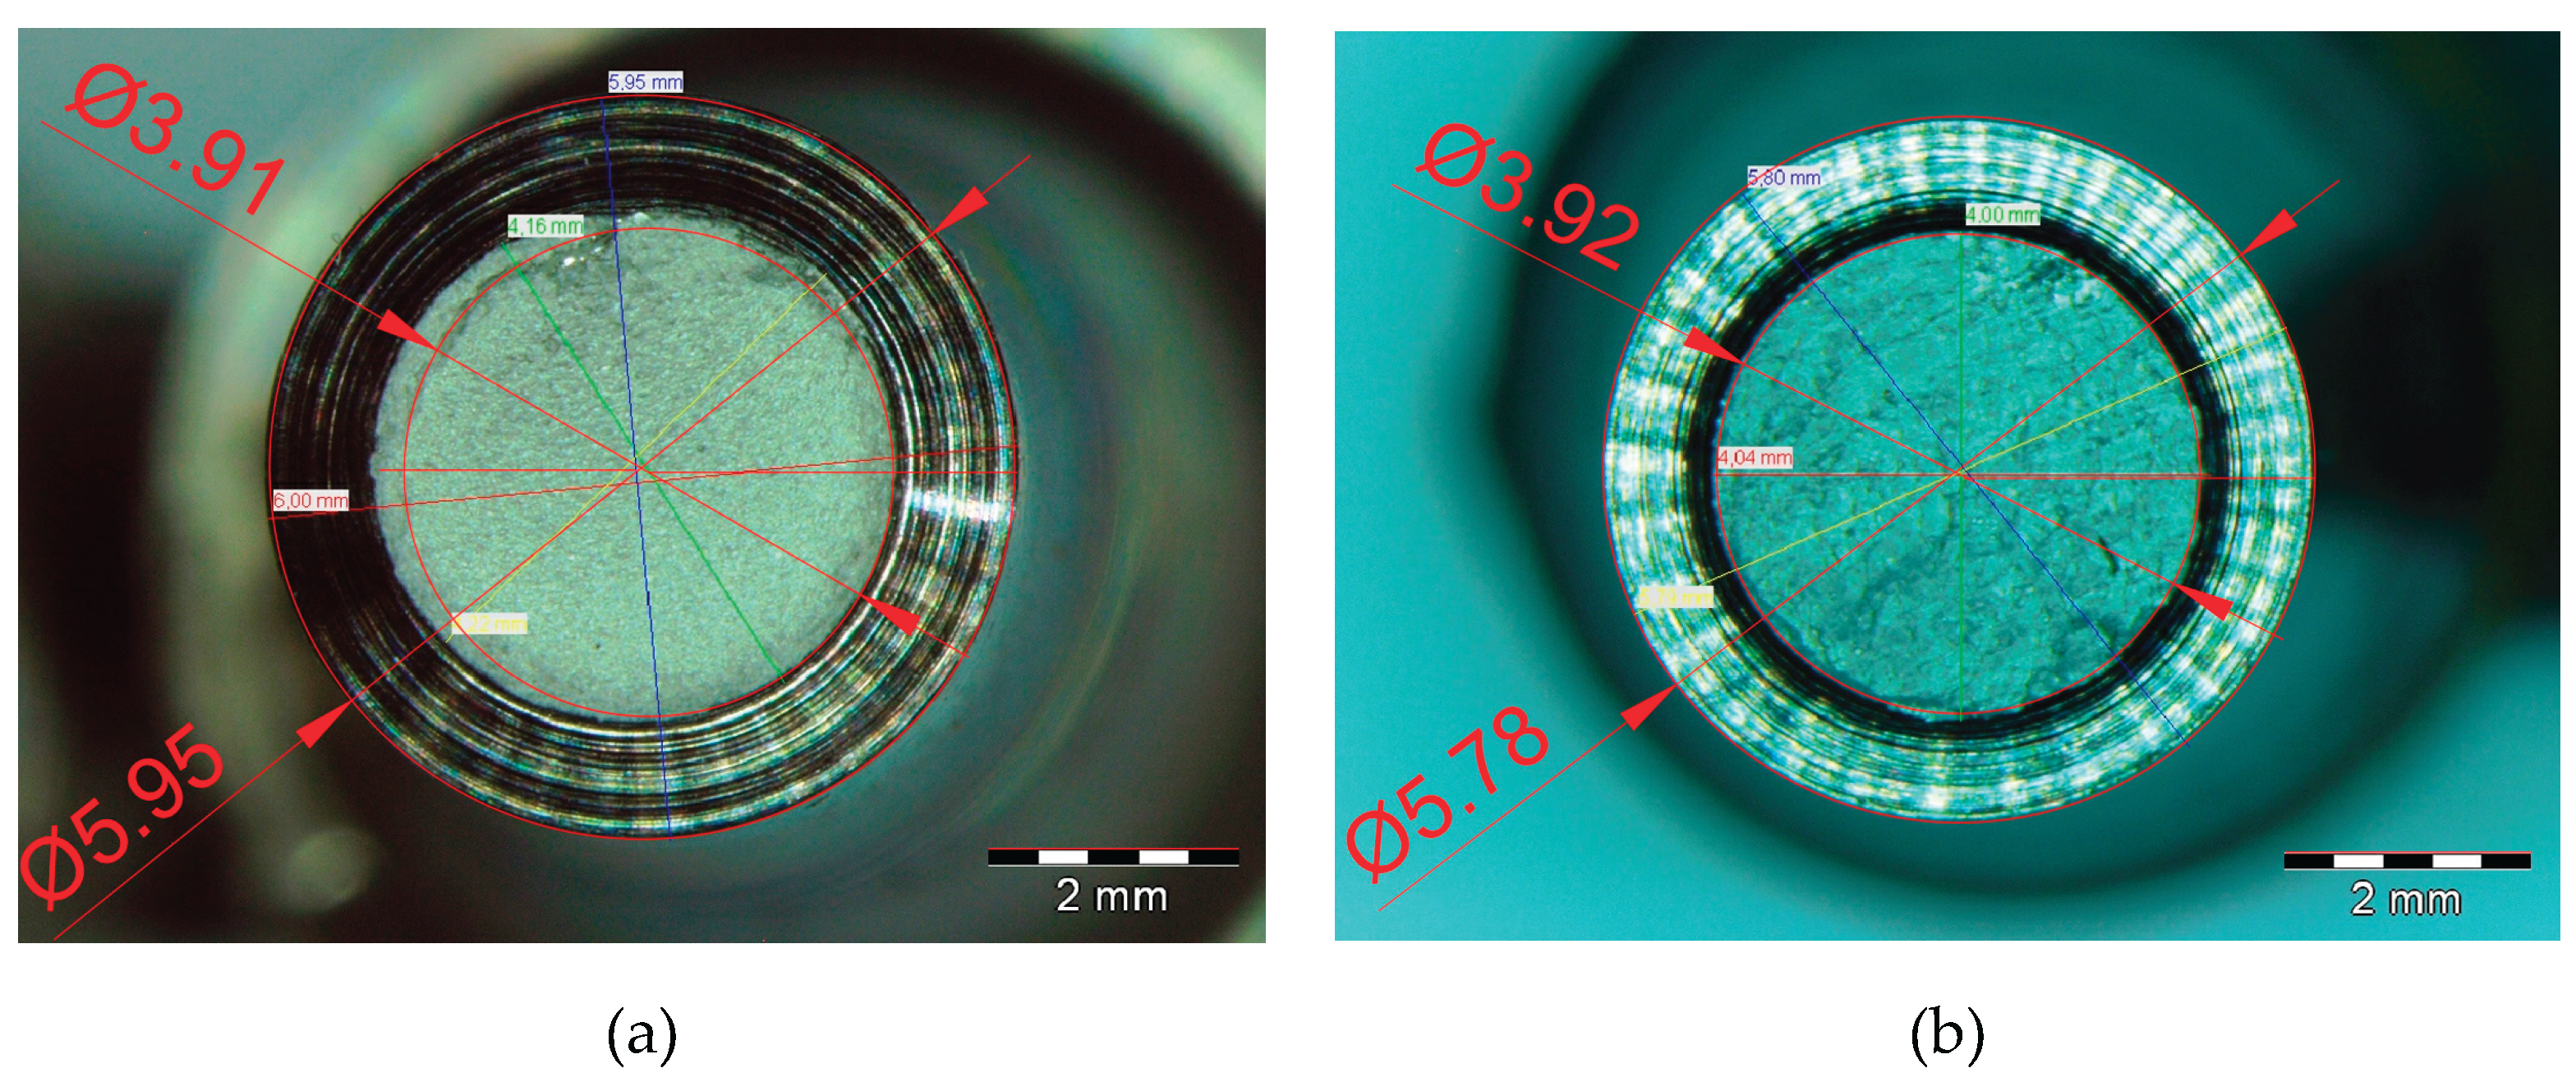

Table 1.
Parameters recorded during the ΔKth determination for drawn alloy.
|
ΔK, MPam0.5 |
da/dN, nm/cycle |
a, mm | N, - | R, - | ΔM, Nm | Mm, Nm |
| 20 | 0 | 2.12 | 367294 | 0.1 | 20.61 | 12.60 |
| 18.99 | 130.517 | 2.171 | 404365 | 0.1 | 19.31 | 11.80 |
| 18.76 | 122.77 | 2.184 | 404466 | 0.1 | 19.01 | 11.62 |
| ... | ... | ... | ... | ... | ... | ... |
| 15 | 150.081 | 2.407 | 405952 | 0.1 | 14.35 | 8.77 |
| 14.84 | 155.135 | 2.418 | 406025 | 0.1 | 14.14 | 8.64 |
| 14.68 | 129.771 | 2.429 | 406108 | 0.1 | 13.95 | 8.53 |
| ... | ... | ... | ... | ... | ... | ... |
| 10.02 | 87.253 | 2.811 | 411791 | 0.1 | 8.64 | 5.28 |
| 9.91 | 31.133 | 2.822 | 412137 | 0.1 | 8.52 | 5.21 |
| 9.81 | 42.583 | 2.832 | 412388 | 0.1 | 8.41 | 5.14 |
| ... | ... | ... | ... | ... | ... | ... |
| 6.6 | 1.235 | 3.228 | 517276 | 0.1 | 5.11 | 3.12 |
| 6.53 | 0.901 | 3.238 | 528412 | 0.1 | 5.05 | 3.09 |
| 6.47 | 0.919 | 3.248 | 539289 | 0.1 | 4.99 | 3.05 |
| ... | ... | ... | ... | ... | ... | ... |
| 4.55 | 0.205 | 3.599 | 1528913 | 0.1 | 3.2 | 1.96 |
| 4.51 | 0.194 | 3.609 | 1580407 | 0.1 | 3.16 | 1.93 |
| 4.46 | 0.16 | 3.619 | 1642995 | 0.1 | 3.12 | 1.91 |
| ... | ... | ... | ... | ... | ... | ... |
| 3.88 | 0.038 | 3.762 | 3202639 | 0.1 | 2.61 | 1.60 |
| 3.84 | 0.029 | 3.772 | 3547316 | 0.1 | 2.58 | 1.58 |
| 3.84 | 0.001 | 3.774 | 6106690 | 0.1 | 2.58 | 1.58 |
Table 2.
Parameters recorded during the ΔKth determination for SLM produced alloy.
|
ΔK, MPam0.5 |
da/dN, nm/cycle |
a, mm | N, - | R, - | ΔM, Nm | Mm, Nm |
| 13 | 0 | 2.011 | 12542 | 0.1 | 13.79 | 8.43 |
| 12.54 | 804.794 | 2.047 | 27878 | 0.1 | 13.17 | 8.05 |
| 12.34 | 618.045 | 2.063 | 27904 | 0.1 | 12.9 | 7.88 |
| 12.05 | 418.945 | 2.087 | 27949 | 0.1 | 12.53 | 7.66 |
| ... | ... | ... | ... | ... | ... | ... |
| 9.34 | 93.277 | 2.267 | 30997 | 0.1 | 9.26 | 5.66 |
| 9.24 | 73.037 | 2.278 | 31148 | 0.1 | 9.13 | 5.58 |
| 9.14 | 47.136 | 2.289 | 31375 | 0.1 | 9.01 | 5.51 |
| ... | ... | ... | ... | ... | ... | ... |
| 7.38 | 10.214 | 2.382 | 44671 | 0.1 | 7.1 | 4.34 |
| 7.3 | 14.362 | 2.392 | 45372 | 0.1 | 7.01 | 4.28 |
| 7.23 | 8.162 | 2.402 | 46611 | 0.1 | 6.92 | 4.23 |
| ... | ... | ... | ... | ... | ... | ... |
| 5.42 | 1.392 | 2.691 | 185318 | 0.1 | 4.82 | 2.95 |
| 5.36 | 0.907 | 2.702 | 197320 | 0.1 | 4.75 | 2.9 |
| 5.31 | 0.801 | 2.712 | 209809 | 0.1 | 4.7 | 2.87 |
| ... | ... | ... | ... | ... | ... | ... |
| 4.63 | 0.064 | 2.852 | 866415 | 0.1 | 3.95 | 2.41 |
| 4.58 | 0.045 | 2.862 | 1089085 | 0.1 | 3.9 | 2.38 |
| 4.53 | 0.001 | 2.872 | 2460570 | 0.1 | 3.85 | 2.35 |
Table 3.
Fracture toughness values determined according to ASTM E1820 [17].
Table 3.
Fracture toughness values determined according to ASTM E1820 [17].
| Production process | Kc, MPam0.5 |
| Drawing (specimen 1) | 84 |
| Drawing (specimen 2) | 83.5 |
| Selective Laser Melting | 21.9 |
Table 4.
Fracture toughness values determined according to [19].
Table 4.
Fracture toughness values determined according to [19].
| Production process | F, N | D, mm | D, mm | Kc, MPam0.5 |
| Drawing | 23114 | 5.95 | 3.91 | 61.34 |
| Selective laser melting | 9468 | 5.78 | 3.92 | 24.64 |
Disclaimer/Publisher’s Note: The statements, opinions and data contained in all publications are solely those of the individual author(s) and contributor(s) and not of MDPI and/or the editor(s). MDPI and/or the editor(s) disclaim responsibility for any injury to people or property resulting from any ideas, methods, instructions or products referred to in the content. |
© 2025 by the authors. Licensee MDPI, Basel, Switzerland. This article is an open access article distributed under the terms and conditions of the Creative Commons Attribution (CC BY) license (http://creativecommons.org/licenses/by/4.0/).
Copyright: This open access article is published under a Creative Commons CC BY 4.0 license, which permit the free download, distribution, and reuse, provided that the author and preprint are cited in any reuse.


