
Submitted:
20 June 2025
Posted:
23 June 2025
You are already at the latest version
Abstract
Quality assurance in a clinical laboratory is essential to ensure reliable, accurate and precise laboratory test results all the time. A hemostasis laboratory is an important part of a clinical laboratory setting in a hospital or a healthcare center, and clinical laborato-ry tests play a crucial role in diagnosis and management of conditions related to bleed-ing or clotting of diseased individuals. This review discusses all aspects of coagulation laboratory testing from pre-analytical, analytical and post-analytical variables as part of daily quality assurance processes undertaken as well as the quality management pro-cess of assay validation and implementation in a laboratory prior to patient testing. The internal and external quality processes that drive a hemostasis laboratory will be dis-cussed that shows a rigorous process in assurance of testing that is reliable and accurate every time, at all times.
Keywords:
quality
; hemostasis
; coagulation
1. Introduction
In laboratory medicine, quality is defined as the ability to provide accurate, reliable and reproducible assay results that offer clinical information which helps a healthcare provider in diagnosis of a patient [1,2]. Quality is ensured by all laboratory professionals which is a combination of quality assurance (QA) and quality management (QM) in the clinical laboratory. In a hemostasis laboratory the QA and QM processes ensure quality throughout each step in coagulation testing procedures by performing quality control, detect problems in hemostasis laboratory systems and identify opportunities for overall system improvement. QM helps in proper monitoring of analyzer performance on a daily, weekly and monthly basis ensuring hemostasis analyzer performance over the course of the life of the analyzer.
QA processes encompass pre-analytical, analytical, and post-analytical variables. Quality control processes employed in a hemostasis laboratory help to document, review and better manage the validity, accuracy, and precision of an assay, including external quality assessment (EQA) by proficiency testing, determination of reference intervals (RIs) and therapeutic ranges (when applicable), and assay lot-to-lot validation for both reagent and QC lots.
In this review, the importance of pre-analytical variables and their impact on hemostasis testing will be highlighted. QA and QM processes encompassing validation procedures will be discussed in detail. The methods described for QA and QM processes are standardized processes across hemostasis clinical laboratories.
2. Phases of Coagulation Testing
2.1. Pre-Analytical Variables
Pre-analytical variables are the foremost critical component for hemostasis testing. Non-compliance with pre-analytical procedures affects the quality of testing and is a major contributor to diagnostic errors. Approximately 70% of diagnostic errors in the clinical laboratory occur in the preanalytical phase [3], because of lack of standardization across laboratories. QA processes should therefore be initiated prior to the pre-analytical phase at the pre-pre-analytical phase, where a clinician makes the decision of ordering coagulation tests for diagnosis of a bleeding or thrombotic condition of a patient, prior to blood collection [4].
Blood collection from patients who are recommended for hemostasis testing are screened for age, gender, health status, blood group, and any pre-existing conditions noted at time of blood collection (Table 1). These recommendations are mentioned in the CLSI guidelines H21-ED6 [4].
The pre-analytical variables critical for the hemostasis/coagulation laboratory can be further divided into 3 parts – specimen collection, specimen transport and stability, and specimen processing and storage [5].
2.1.1. Specimen Collection
Specimen collection requires proper patient identification for hemostasis testing, before blood sample is collected:
- ✓
- A minimum of 2 patient identifiers: name and date of birth (DOB).
- ✓
- Verbal acknowledgement from patients required by most facilities prior to blood collection.
- ✓
- atients with significant trauma who are not in a state to verify their name or DOB may be referred to as ‘John Doe’; for example, trauma patients, patients suffering from cardiac arrest, patients with dementia– in these cases, the information of patient(s) can be obtained from the relatives or from any previous existing patient history.
- ✓
- Patients with the same last name (e.g., twin newborns) require unique identifiers; twins may be identified as Boy/Girl A and Boy/Girl B.
- ✓
- Phlebotomist affixes label after blood collection, which is then required by the patient to confirm.
Venipuncture of patients for collection of blood samples for hemostasis testing is generally done in 3.2% sodium citrate (light blue top) tubes. When additional tubes are required for the same patient, it is necessary to collect the tubes in proper order (Table 2) to avoid any unnecessary carryover [6].
Blood collection from patients for hemostasis testing should follow the CLSI guidelines as stated [4,5] and described below:
- ✓
- 19-22 gauge needles should be used for venipuncture procedure from adult patients; 23-25 gauge needles should be used for pediatric patients or patients with difficult venous access.
- ✓
- Tourniquet application should be less than 1 minute – prolonged application results in hemoconcentration and decreased blood flow, which ultimately affects test results of assays such as Factor VIII, VWF assay, leading to falsely elevated results.
- ✓
- Arterial or intravenous line collections from patient bedside requires flushing of first 10 mL of blood or six dead spaces of the vascular access device (VAD) employing the two-syringe technique generally performed by a nurse.
- ✓
- Blood collection using a butterfly or winged collection set requires use of a discard tube (this can be a blue top tube or any other tube) to remove the air in the tubing of the butterfly needle and fill its dead space, prior to collection in the 3.2% sodium citrate blue top tube. This step prevents inadequate filling of the blue top tube.
- ✓
- Proper filling of blue-top tubes is required, avoiding under or overfilling of tubes, to maintain the 9:1 blood to anticoagulant ratio.
- ✓
- Gentle inversion (5-6 times) after collection is recommended for proper mixing of blood with the sodium citrate anticoagulant.
- ✓
- Patients with elevated hematocrits (>55%) require tubes for blood collection with adjusted volume of sodium citrate.
2.1.2. Specimen Transport and Storage
Transport of patient specimens collected for hemostasis testing and maintaining their integrity during the transport process is a critical pre-analytical variable:
- ✓
- Specimens should not be transported or stored on ice
- ✓
-
Sample stability is assay specific:
- ○
- Whole blood sample for PT is stable at 18-25oC for 24 hours from time of blood draw [4].
- ○
- For APTT, whole blood sample is stable for 6-8 hours at 18-25oC [4].
- ○
- For heparin monitoring by APTT, whole blood samples are stable for 1 hour at 18-25oC; after 1 hour there is false decrease in APTT values due to heparin neutralization by PF4 (high affinity heparin neutralizing protein). After centrifugation of the whole blood samples, the analysis of the plasma sample needs to be completed within 4 hours of collection [4].
- ○
- Other assays, stability at 18-25oC is defined as shown in the CLSI H21-Ed 6 guideline [4].
- ✓
- Specimens for platelet function tests should be maintained at 18-25oC and should not be transported via pneumatic transport tube systems to ensure sample agitation is kept at a minimum.
- ✓
-
Specimens that cannot be processed within the designated stability hours, should be centrifuged and processed for platelet poor plasma (PPP) and frozen in a -80oC freezer.
- ○
- Frozen specimens should be transported on dry ice to maintain specimen stability and integrity.
- ○
- Storage of frozen specimens at -20oC is allowed for two weeks in a non-frost-free freezer.
- ✓
- Stability of plasma samples after centrifugation and their long-term storage in frozen conditions prior to testing is defined in Appendix D of the CLSI H21-Ed 6 guideline [4].
2.1.3. Specimen Processing
All coagulation specimens, except those that are required for point of care testing (POCT) and platelet function, are required to be adequately processed for generation of suitable plasma specimens. Hemostasis laboratories should have a validated procedure to yield PPP with a platelet count of <10,000/ul using a proper centrifugation procedure [4,6]:
- ✓
- The centrifuge should be maintained at 18-25oC.
- ✓
- ✓
- The centrifuge must be annually verified for yielding proper PPP.
- ✓
- All sample specimens must be centrifuged 2x (double centrifugation) prior to freezing.
- ✓
- If more than one blue top tube is drawn from a single patient, the samples should not be pooled together after processing and prior to freezing.
- ✓
- Use of micropore filters to remove platelets is not recommended – this leads to loss of Factors V, VIII, IX, XII and VWF.
2.1.4. Hemolysis, Icterus, Lipemia (HIL)
A key aspect of hemostasis testing is the integrity of the patient plasma. Hemolysis, lipemia and icterus are key considerations that may affect accurate testing of patient plasma notably in optical hemostasis analyzers. In-vitro hemolysis of patient plasma may be observed where a sample was not collected using proper phlebotomy techniques, or in patients with sepsis or toxicosis at the time of collection. In-vivo hemolysis is associated with very high levels of lactate dehydrogenase (LDH) and can occur in a variety of conditions. In a hemolyzed sample, overlap between two light emission spectra occurs in an optical hemostasis analyzer, that causes a spectral overlap and affects coagulation assay results. Although PT is not affected by hemolysis, APTT can either be falsely elevated or shortened, and a false decrease in fibrinogen and antithrombin (AT) may be observed while a falsely elevated D-Dimer may be observed [7,9,10].
Results from lipemic or icteric plasma should be interpreted with caution when tested on optical hemostasis analyzers [11]. Lipid particles in a sample may cause abnormal light scatter in optical analyzers producing erroneous results. Patients who are on anesthetic drugs like propofol may show lipemic-like effect causing major interferences with APTT testing when measured in an optical analyzer at 405 nm wavelength [12,13]. Icteric samples affect chromogenic assays; however, this may be overcome by optical analyzers which can automatically shift to higher optical wavelengths of > 650 nm to accurately analyze these samples [6]. Mechanical detection-based hemostasis analyzers are also affected by HIL for some assays [14].
2.2. Analytical Variables
The analytical phase of hemostasis testing starts with validation and/or verification studies that encompass several processes. These processes define the QA and QM process of the laboratory prior to implementation of an assay and testing of patient specimens:
- ✓
- Validation of assay calibration (proof of accuracy) and internal quality control ranges (establishment shows proof of assay precision).
- ✓
- Validation of reference intervals and analytical measurement ranges (AMR).
- ✓
- Validation of therapeutic ranges (if applicable; for example – heparin therapeutic range).
- ✓
- Validation of inter-analyzer comparisons; each individual analyzer and test systems require their own evaluation and approval.
- ✓
- Verification of analyzer and IPU/ laboratory Information System (LIS) system.
- ✓
- Additional studies if required for any laboratory developed test (LDT), i.e., analytical sensitivity and specificity, specimen and reagent stability, reagent carryover [15].
- ✓
- All validation studies are summarized and evaluated by the designated laboratory director prior to implementation and reporting of patient results.
- ✓
- Routine maintenance of analyzers and document of all function and error checks.
- ✓
- Manual verification of all critical results and other LIS un-validated test results, for example, a patient sample tested for Lupus screening.
2.2.1. Proof of Accuracy
In a hemostasis laboratory, accuracy is established by using assay calibrators where the calibrator is used to validate a new assay or an established assay and comparing these assay results with the manufacturer published results in the reagent table of assigned value sheet (TAV) [16]. The manufacturer-assigned values are typically provided in the package insert for the specific calibrator material for the specific assay, and the calibrator spans the entire range of assay linearity.
Prior to calibration of an assay, reagent and calibrator material(s) (or calibrator set) are loaded onto the hemostasis analyzer, and the calibrator target value(s) provided by the manufacturer is entered. After completion of the calibration run, the results can be observed on the analyzer and compared to the manufacturer-defined results to determine validity of the calibration curve (Figure 1).
The accuracy of a newly calibrated assay can be determined by several statistical methods. Commonly, linear regression analysis and the Bland-Altman difference plot are used in a hemostasis laboratory. Linear regression compares the reference method (or current lot of reagent) with the newly calibrated method (or new lot of same reagent) to identify any differences between the two methods that is termed as random error, whereas, Bland-Altman indicates percent or absolute bias between the two methods [17]. These methods can be performed on the CLIA validated software program EP evaluator that is routinely used for statistical validation and verification of assays in a clinical laboratory.
2.2.2. Proof of Assay Precision
Precision in a hemostasis laboratory is defined as repeatability (within-run) or within-laboratory performance of an assay or assay systems. Repeatability is achieved when multiple replicate measurements of an assay is performed under the same exact conditions for several days or within a single run of a procedure. This process helps to assess variation between replicate measurements and evaluate distribution of random errors [17]. It can be further elaborated as follows:
- ✓
- Precision is performed on different assays using a single specimen or Quality control (QC) material; typically, normal and abnormal QC material is assessed.
- ✓
- Studies are designed to assess within-day and between-day variation (random error) around the target/mean value of a QC or calibrator material.
- ✓
- Within-day and between-day precision may be assessed by 2 levels of QC x 5 days x 5 replicates/run x 1 runs/day x 1 instrument [19].
- ✓
- Patient specimens are used for reproducibility of results using normal and abnormal specimens.
- ✓
- Between-day (day-to-day) precision evaluates the effect different operators, laboratory conditions and reagent lots have on results.
- ✓
-
Within-day and between-day data are evaluated by standard deviation (SD) and coefficient of variation in percent (%CV).
- ○
- The %CV gives a measure of dispersion/random error generated by the assay – determines the stability and quality of an assay.
- ○
- If the calculated SD and %CV of the precision data is less than stated by the manufacturer application or insert document, then the laboratory has shown valid proof of assay precision that satisfies the manufacturer’s claim.
Since %CV is the unit of measure for precision assessment, it signifies the accuracy of the assay that is being assayed.
2.2.3. Determination of Assay Linearity
In a hemostasis laboratory assay linearity is confirmed with calibration of an assay where multiple dilutions of the calibrator are assessed by an automated coagulation analyzer. The linear range can be confirmed by inserting the data obtained for the assayed and computed values in a CLSI approved data analysis software like the EP evaluator. The assayed values should correlate with the computed values for accurate determination of concentration or activity of an analyte. The acceptable range for linearity is established as being immediately above the highest and lowest calibration points, where the assay deviates from a linear curve. Examples of calibrated hemostasis assays are antithrombin, D-Dimer and fibrinogen, etc. An example of D-Dimer linearity using linearity standards is shown in Figure 2. The different levels show the linearity values near low, normal, mid and high abnormal data points that gives information at critical check points, which may also be referred to as medical decision points/levels (MDLs). At these MDLs, the performance of the assay is determined by statistical evaluation of %CV, bias and other QA metrics by the laboratory [20].
Patient specimens with results falling above the linearity are diluted and re-assayed and the result output includes multiplication with the dilution factor; these calculations are preprogrammed in all automated coagulation analyzers. In case of hemostasis factor assays, like factors VIII and IX, the lower limits are diagnostically significant as any assay values below the linearity threshold of these assays hints towards a patient suffering from a form of hemophilia. Hence, the lower limits are important for proper diagnosis and to evaluate treatment options for factor deficient patients.
2.2.4. Verification of Analytical Measurement Range (AMR)
The AMR verification spans the entirety of medical decision level points and lends validity to the linearity of a calibrated assay. AMR defines the upper and lower limits of the assayed values from linearity. Patient results below or above the AMR are reported as less than (<) the lower limit or greater than (>) the higher limit of that particular assay. For example, if the AMR of antithrombin assay is 9-150 % activity of normal, then a value < 9% would be reported as < 9% activity.
2.2.5. Analytical Sensitivity and Specificity
Analytical sensitivity and specificity studies are not routinely performed in a clinical laboratory. They are performed by the vendor or manufacturer of reagents and/or coagulation analyzers in compliance with the CLSI guidelines and the necessary information is provided in the reagent package inserts.
Analytical sensitivity assays are performed to analyze the detection capability of the hemostasis analyzer, namely, limit of blank (LoB), limit of detection (LoD) and limit of quantitation (LoQ) [21]. Analytical specificity studies determine the effect of interference from endogenous substances such as hemolysis, icterus or lipemia, and exogenous substances such as an oral anticoagulant in a patient sample [22]. In case of a laboratory developed test (LDT), it is necessary for the clinical laboratory to perform these studies before bringing the test on board for patient testing.
2.2.6. Establishment or Verification of Reference Interval (RI)
The RI verification process differentiates a normal from an abnormal patient by virtue of the assay’s test results. A hemostasis laboratory determines RI of a test or an assay by:
- ✓
- Recruitment of healthy donors that are representative of the local population the laboratory is serving.
- ✓
- Informed consent obtained from these healthy individuals that are recruited for the RI studies – the consent form clearly outlines what specimens will be obtained, amount required and how the specimens will be used by the hemostasis laboratory.
- ✓
-
Inclusion and exclusion criteria for the studies are clearly defined by the laboratory.
- ○
- Generally, the hemostasis laboratory will prepare a questionnaire that captures the information of the blood donor to determine the health status of the subject, as well as demographics such as age, gender, ethnicity and if the patient is on any current medications.
- ○
- Individuals such as smokers, and women on drugs/oral contraceptives are likely to be excluded from the healthy donor population.
- ✓
-
An equal number of healthy male and female donors are ideal for RI verification studies – for multiple assay RI verification purposes, multiple blue-top tubes may be collected and frozen at -80oC for later use.
- ○
- To establish RI for a new assay – a minimum of 120 normal healthy donors are required as per CLSI guidelines. This may be difficult, and, in most cases, the laboratory can verify the assay ranges provided in the package insert by recruiting 20-40 consented healthy donors. This process of RI verification is referred to as transference.
- ○
- ✓
- For routine assays such as PT and APTT – hemostasis laboratories may prefer verification of published RI values.
- ✓
- For special coagulation assays – frozen aliquots of normal healthy donor specimens stored at -80oC may be used and can be purchased from third party manufacturers of commercial plasmas to validate the evaluated RI for specific assays [16].
It is assumed that the dataset obtained from the consented healthy donor specimens will provide a frequency distribution that represents a Gaussian distribution as shown in Figure 3.
The dataset shown in Figure 3 is an example of the RI dataset of APTT from a hemostasis laboratory. The gaussian distribution of the dataset represents the Mean at the center of the data, as shown here at 30 seconds. This assumes that the dataset from 22-30 sec and 30-38 sec are equally dispersed on both sides of the Mean, and 95% of the values represent the confidence interval (CI) of the dataset. This 95% CI is employed in all clinical laboratories, including hemostasis laboratories, for establishment or verification of RI of an assay.
In a hemostasis laboratory, RI may vary with lot changes which is quite typical with lot changes of PT and APTT reagents. These 2 assays are also used for monitoring anticoagulants. PT/INR is used for monitoring patients taking vitamin K antagonists such as warfarin [25]. The therapeutic range of INR is between 2-3 [26], which is considered universal and does not require establishment by the hemostasis laboratory.
On the contrary, the heparin therapeutic range for APTT that is used in some medical centers for monitoring of unfractionated heparin (UFH) administered to a patient who is admitted to a hospital, requires establishment by the hemostasis laboratory by comparing the APTT assay against the chromogenic anti-Xa assay specific for UFH [27]. The therapeutic range of the UFH assay is typically established at 0.3-0.7 International heparin Units (IU) [28]. The establishment of the APTT heparin therapeutic range is critical with each lot change of APTT reagent as the range may vary with APTT reagent lot sensitivity against the anti-Xa assay.
2.2.7. Quality Control in the Hemostasis Laboratory
2.2.7.1. Internal Quality Control and Assessment
Quality control is an important component of a clinical laboratory, and it is an important measure for laboratories to monitor systematic errors [29]. Quality control (QC) reagents used in the laboratory monitor internal quality control and quality assurance by:
- ✓
- Assessing change in the analytical measurement process.
- ✓
-
Detecting a decrease in quality of the calibrated assay/ calibration curve.
- ○
- QC assay keeps in check the calibration verification of an assay.
- ✓
- Confirming reproducibility of testing – precision and accuracy.
Routine hemostasis QC materials are generally lyophilized, however, some special coagulation assays may have QC materials that comes frozen with added preservatives, for example, lupus QC materials [30]. Hemostasis QC assays may be ‘assayed’ or ‘unassayed’ [31]. For assayed QC, the manufacturer provides targets and QC ranges are verified by the laboratory, while for unassayed QC, the hemostasis laboratory validates and verified its own ranges specific for that assay. QC ranges are established by running it for 20 days and after establishment, the results should fall within these established limits, which is typically ±2SD. Hemostasis laboratories typically run 2 sets of QC – normal and abnormal every 8 hours across 3 shifts on a daily basis. Many modern automated hemostasis analyzers are equipped with automatic QC functionality that can help standardize the performance of QC analysis in a hemostasis laboratory. Table 4 shows the various QC reagents that are used in routine and special coagulation assays in a hemostasis laboratory.
For hemostasis point of care (POC) instruments such as activated clotting time (ACT) instruments, thromboelastography methods, and platelet function instruments, the requirement for performing QC varies and so does the monitoring of QA. These instruments may use combinations of automated electronic QC and liquid QC measurements that are assayed at different time intervals for validation of QC performance [33,34,35,36].
All QC data is stored in the hemostasis analyzer’s database. In general, a monthly cumulative report of all QC parameters run on all assays on each hemostasis analyzer is printed and reviewed by the supervisor or director of the hemostasis laboratory. This report should include the mean, standard deviation (SD) and %CV (percent coefficient of variation) for each assay.
In cases of any QC failures, the hemostasis laboratory follows the steps in a sequential manner as outlined in Table 5.
Manufactures of hemostasis analyzers and reagents often provide a peer group report among hemostasis laboratories for comparison of peer group statistics, when these laboratories are using the same instrument, same lot of reagents and same lot of QC material. Laboratories maintain a strict protocol to compare these peer group statistics and monitor any changes, particularly in QC ranges, as part of their quality management procedures. These can be summarized as follows:
- Each month, peer group reports on the hemostasis analyzer controls for routine tests like PT, APTT and fibrinogen are received that provide a general overview of statistics (i.e. Mean, SD and %CV).
- A consistent difference between the laboratory’s Mean and the group’s Mean, or a consistent mean difference over several months of data will be an indicator of possible instrument bias, which would result in instrument performance needing to be verified.
- If the laboratory’s QC limits and target value is within the specified Inter-Laboratory Q.C. Programs limit for acceptability for all parameters, then no action needs to be taken.
- If the laboratory’s QC limits and target value is outside the specified Inter-Laboratory Q.C. Programs limit for acceptability for any parameter, then corrective action is taken by the laboratory.
- %CV is always compared to the previous month %CV and current month’s group %CV. The group %CV is a cumulative of all participating laboratories in the peer review program. If the current month’s %CV has increased from the previous month, but is still lower than the group %CV, then this will not be considered statistically significant. If the current month’s %CV has increased from the previous month and is also higher than the group %CV, this is then investigated by the laboratory.
Laboratories develop an action plan in these scenarios whereby patient testing is put on hold when QC results are consistently outside of the allowable limits or show significant deviations from peer group performance. Testing is resumed once QC errors are fixed and all corrective actions have been appropriately documented by the laboratory.
2.2.7.2. External Quality Control (EQA) and Assessment
EQA assessment helps in evaluating long term performance of a hemostasis laboratory, commonly referred to as proficiency testing. Proficiency testing helps to:
- ✓
- Confirm that each test parameter (for example, PT, APTT, FVIII) is performing accurately over a period of time by comparing the data with peer groups across different laboratories – using specimens distributed by EQA, at definite time intervals of each year.
- ✓
- Target values are assigned for different assays, taking into account assay methods, reagents and differences in hemostasis instruments manufactured by different vendors.
- ✓
- EQA specimens are assessed in the same manner as patient specimens.
- ✓
- Submitted results are evaluated against the designated target values – statistical methods are used by the EQA assessment agencies to assign assay performance reports that are distributed to the laboratories.
- ✓
-
Comments are generated for tests that deviate significantly from target values/ allowable limits of error (commonly < or > than ± 2SD).
- ○
- Consecutive failures in proficiency testing results in an assay being taken out of service, necessitating a thorough investigation by the laboratory identifying the root cause of failures, prior to returning it back to the provided test menu.
Participation in an EQA program is a requirement for obtaining and maintaining laboratory accreditation to perform an assay in the laboratory. Laboratory accreditation is necessary for Medicare reimbursements. This assessment determines a laboratory’s quality and capability of precise and accurate work at all times that provides optimum patient care leading to correct diagnoses [37,38]. In the United States, there are several regulatory authorities that provide hemostasis proficiency testing samples to the clinical laboratories and assess the quality of the laboratory:
- ✓
- College of American Pathologists (CAP)
- ✓
- American Proficiency Institute (API)
- ✓
- North American Specialized Coagulation Laboratory Association (NASCOLA) in affiliation with External Quality Control of Diagnostic Assays and Tests (ECAT)
- ✓
- State Health agencies like Wisconsin State Laboratory Hygiene (WSLH) Proficiency testing
2.2.8. Diagnostic Efficacy of an Assay
A clinical laboratory test besides satisfying all criteria for laboratory related validation procedures like precision, accuracy, validation of its reference interval is also tested for its effectiveness in diagnosis of a disease. Diagnostic efficacy of an assay determines whether it accurately helps in interpreting a disease that results in benefit to a patient [39]. When a new diagnostic assay is assessed in the clinical laboratory, the assay performance is measured by analyzing samples of healthy blood donors and comparing them against patients suffering from a disease. The assay performance is then analyzed as shown in Table 6.
The 2x2 table shows that false positive results are generated when the assay incorrectly gives a positive result suggesting a disease condition in a healthy subject, whereas the false negative results suggest the assay could not positively identify patients with the disease condition. False positive results may lead to ordering unnecessary follow up testing and unwanted patient anxiety. On the contrary, a false negative result can be life threatening for a patient.
Assay sensitivity is defined as a positive result in a diseased subject –assays with high sensitivity are generally used as screening tests in the clinical laboratory. Assay specificity is defined by a negative result in a healthy population and highly specific assays are generally used as a confirmatory test in the clinical laboratory [40].
Prevalence and incidence, terms coined by epidemiologists, also play a key role in diagnostic efficacy of a laboratory test. Prevalence is defined as the number of persons who are suffering from a particular disease in the entire population, whereas, incidence is defined as identifying a definite number of individuals who are suffering from a disease at a specific time from previously identified subset of people who were considered at risk of developing the disease [41].
For example, in a hemostasis laboratory, the D-Dimer assay is used as a tool for exclusion of venous thromboembolism (VTE) in patients. The assay has a designated assay cut-off that is employed to distinguish between a positive and negative result. A negative result (below the assay cut-off) determines that a patient does not have a deep vein thrombosis or pulmonary embolism [42]. Another critical test used in a hemostasis laboratory is the heparin induced thrombocytopenia (HIT) assay, where the ELISA-based or chemiluminescent assays are used as a screening test as a means to exclude HIT in patients [43].
2.3. Post-Analytical Variables
The post-analytical phase is a key component of laboratory testing and a coagulation laboratory will maintain all the records as part of its quality management plan [44]. Although not an exhaustive list, a few important metrics that the laboratory monitors are listed below:
- ✓
- Turn round time (TAT) – daily TAT reports are checked specifically for all STAT ordered tests and stroke alert patients. In a coagulation laboratory a STAT order of PT and APTT is typically resulted within 15 minutes.
- ✓
- Semi-annual report of all the quality indices measured and observed in the laboratory.
- ✓
- Retention of all patient results that had a critical result reported, for example, a PT/INR result above 4.5 or an APTT result above 100 seconds.
- ✓
- An audit of autoverification rules and assay reference ranges programmed in the laboratory information system (LIS) are performed annually.
- ✓
- Review of all low factor VIII and factor IX results by the medical director, prior to releasing to the ordering physician. The coagulation laboratory keeps a record of these patients as known hemophilia A or hemophilia B patients, as it is likely that these patients will return for future treatments in the same facility.
- ✓
- Review of high INR results (generally greater than INR >8) by the medical director on a routine basis prior to its release to the ordering physician.
3. Integral Processes in a Laboratory to Assure Quality
The clinical supervisor, manager and medical director routinely review assay feasibility prior to implementation in a laboratory. This includes validation processes, labor costs, training of the medical laboratory scientists or technicians, cost of the LIS changes, requirements of a middleware and other essential laboratory related cost. The clinical laboratory manager of the hemostasis laboratory generally puts together a business plan highlighting all these aspects to decide whether it will be financially feasible to run the assay in the laboratory and also benefit the patients.
Quality assurance is maintained in the hemostasis laboratory by reagent and quality control lot comparisons when changing from old to new lots. If these lot changes are a requirement of a multi-site healthcare center, then a quality management system is in place to oversee that quality is maintained across the whole system. The laboratory tests competence of laboratory staff by rotating them through the coagulation bench, which is measured by internal annual tests and performance of these staff members in proficiency testing of hemostasis samples that are part of the EQA programs. The quality management system also has a comprehensive plan in place to adequately educate new hires and provide resources for continuing education of the staff members who work in the coagulation laboratory. Maintenance of all QC and QA records for a hemostasis laboratory are done for at least 2 years as per CLIA requirements [45].
4. Conclusions
QA in a hemostasis laboratory is critical at each and every step including pre-analytical, analytical and post-analytical steps. QC that includes assay validation through precision, accuracy, linearity, quality control measurements, generation of reference intervals, and addressing diagnostic efficacy of a test is integral for providing sensitive and beneficial assays for a patient who is tested for a bleeding or a clotting disorder. It is essential that each step of the quality control process is accurately performed, in order to assure the laboratory is providing valuable information to clinicians.
Quality and accuracy in patient testing are achieved through validated procedures, defined responsibilities of the clinical laboratory staff, maintaining of QA and QC procedures and addressing any failures with appropriate corrective actions, and validation of an assay by the laboratory following all the rules of good clinical practice.
Funding
This review article received no external funding.
Institutional Review Board Statement
IRB review of this work is not applicable as studies did not involve any human subjects.
Acknowledgments
I thank Krishna Ram for scientific inputs and discussion in preparation of the manuscript. I appreciate the help of Kimberly Kabb in editing and review of the manuscript.
Conflicts of Interest
The author declares no conflict of interest.
Abbreviations
The following abbreviations are used in this manuscript:
| QA | Quality assurance |
| QC | Quality control |
| QM | Quality management |
| EQA | External quality control and assessment |
| RI | Reference Interval |
| CLSI | Clinical and Laboratory Standards Institute |
| CLIA | Clinical Laboratory Improvement Amendments |
| LDH | Lactate dehydrogenase |
| AT | Antithrombin |
| RPM | Revolutions per minute |
| RCF | Relative centrifugal force |
| AMR | Analytical measurement range |
| LIS | Laboratory Information System |
| HIL | Hemolysis, icterus, lipemia |
| LDT | Laboratory developed test |
| IFU | Instruction for use |
| TAV | Table of assigned values |
| VWF | Von Willebrand factor |
References
- J. Westgard, Basic QC Practices: Training in Statistical Quality Control for Medical Laboratories. 4th Edition ISBN-13 978-1-886958-30-2, Westgard QC, Inc., 2016.
- J. O. Westgard, "A Total Quality-Control Plan with Right-Sized Statistical Quality-Control," vol. 37, pp. 137-150, 2017. [CrossRef]
- M. Plebani, "Quality Indicators to Detect Pre-Analytical Errors in Laboratory Testing," Clin Biochem Rev, vol. 33, pp. 85-88, 2012.
- D. A. Laposata M, "“Pre-pre” and “post-post” analytical error: high-incidence patient safety hazards involving the clinical laboratory," Clin Chem Lab Med, vol. 45, no. 6, pp. 712-719, 2007.
- CLSI, "H21-ED6: Collection, Transport and Processing of Blood Specimens for testing Plasma-Based Coagulation Assays and Molecular Hemostasis Assays; Approved Guideline-," Clinical and Laboratory Standards Institute, 2024.
- CLSI, "H21-ED6-QG: Collection, Handling, Transport and Storage for Hemostasis," Clinical and Laboratory Standards Institute, 2025.
- R. a. M. R. Gosselin, "Preanalytical Variables in Coagulation Testing: Setting the Stae for Accurate results," Semin Thromb Hemost, vol. 45, no. 5, pp. 433-448, 2019. [CrossRef]
- L. G. F. E. Adcock Funk DM, "Quality standards for sample processing, transportation, and storage in hemostasis testing," Semin Thromb Hemost, vol. 38, no. 6, pp. 576-585, 2012.
- G. V. C. T. A. V. S. D’Angela, "Evaluation of the main coagulation tests in the presence of hemolysis in healthy subjects and patients on oral anticoagulant therapy," Int J Lab Hematol, vol. 37, pp. 849-833, 2015.
- D. D. R. e. a. Kitchen S, "International Council for Standardization in Haematology (ICSH) recommendations for processing of blood samples for coagulation testing," Int J Lab Hematol, vol. 43, no. 6, pp. 1272-1283, 2021.
- R. L. D. A. Nagant C, "HIL Interferences on Three Hemostasis Analyzers and Contribution of a Preanalytical Module for Routine Coagulation Assays," Clinical Laboratory, vol. 62, no. 10, pp. 1979-1987, 2016.
- Y. L. L. L. H. A. Parsons L., "Propofol Interference in Coagulation Testing.," J Clin Pathol, vol. 138, p. A285, 2012.
- G. M. D. M. D. F. Feriel J, "Impact of Drugs Used in Intensive Care on Routine Coagulation Testing," Diagnostics (Basel), vol. 15, no. 7, p. 941, 2025.
- R. L. D. A. Nagant C, "HIL Interferences on Three Hemostasis Analyzers and Contribution ofa Preanalytical Module for Routine Coagulation Assays," Clin Lab, vol. 62, no. 10, pp. 1979-1987, 2016.
- D. A. E. M. e. a. Gardiner C, "International Committee for Standardization inHematology (ICSH) Guidance on the Validation ofLaboratory Developed Tests in Haemostasis," Int J Lab Hematol, vol. 0, pp. 1-13, 2025.
- M. a. F. G. Sarkar, "Quality assurance in Hematology and Hemostasis testing," in Rodak’s Hematology: Clinical Principles and Applications, Elsevier, 2024, pp. 18-42.
- CLSI, "H57-A, Protocol for the Evaluation, Validation, and Implementation of Coagulometers; Approved Guideline," Clinical and Laboratory Standards Institute, 2008.
- D. o. H. a. H. S. Centers for Medicare & Medicaid Services (CMS), "Clinical Laboratory Improvement Amendments of 1988 (CLIA) Proficiency Testing Regulations Related to Analytes and Acceptable Performance; 42 CFR Part 493 [CMS-3355-F]," 2022.
- CLSI, "CLSI EP15-Ed3-IG1. User Verification of Precision Implementation Guide. 1st ed.," Clinical and Laboratory Standards Institute, 2021.
- W. JO, "Westgard QC," [Online]. Available: https://westgard.com/resources/resources/decision.html. [Accessed 2 6 2025].
- CLSI, "EP17 ED21G:2021 Evaluation of Detection Capability Implementation Guide, 1st Edition," Clinical and Laboratory Standards Institute, 2021.
- CLSI, "EP07-ED3:2018 Interference Testing in Clinical Chemistry, 3rd Edition," Clinical and Laboratory Standards Institute, 2018.
- CLSI, "EP28 A3C: Defining, Establishing, and Verifying Reference Intervals in the Clinical Laboratory, 3rd Edition," Clinical and Laboratory Standards Institute, 2010.
- CLSI, "EP28 Ed3-IG: Verification of Reference Intervals in the Medical Laboratory Implementation Guide, 1st Edition," Clinical and Laboratory Standards Institute, 2022.
- V. R. Z. M. e. a. Shikdar S, "International Normalized Ratio: Assessment, Monitoring, and Clinical Implications.," StatPearls Publishing, 2025.
- B. R. C. B. O. P. S. A. Gallus AS, "Consensus guidelines for warfarin therapy. Recommendations from the Australasian Society of Thrombosis and Haemostasis.," Med J Aust, vol. 172, no. 12, pp. 600-605, 2000.
- G. J. J. M. H. J. Brill-Edwards P, "Establishing a therapeutic range for heparin therapy.," Ann Intern Med, vol. 119, no. 2, pp. 104-109, 1993.
- P. S. D. J. e. a. Baker P, "Measurement of heparin, direct oral anti-coagulants and other non-coumarin anti-coagulants and their effects on haemostasis assays: A British Society for Haematology Guideline," B J Haem, vol. 205, no. 4, pp. 1302-1318, 2024.
- W. S. Westgard JO, "Quality control review: implementing a scientifically based quality control system.," Ann Clin Biochem, vol. 53, no. Pt 1, pp. 32-50, 2016.
- PB, "Precision Biologic," Precision Biologic, 2025. [Online]. Available: https://precisionbiologic.com/content/user_files/2021/12/CRYOcheck-Lupus-Controls.pdf. [Accessed 28 5 2025].
- J. I. K. S. W. I. Reilly-Stitt C, "Internal Quality Control in Hemostasis Assays.," Semin Thromb Hemost, vol. 50, no. 8, pp. 1084-1090, 2024.
- F. E. A. D. Bonar R, "Quality in coagulation and haemostasis testing," Biochemia Medica, vol. 20, no. 2, pp. 184-199, 2010.
- P. M. O. P. e. a. Moilanen J, "Performance of Hemochron ACT-LR and ACT+ Test Cuvettes in Monitoring Low to Moderate Heparin Concentrations: An In Vitro Study," J Cardiothoracic Vasc Anesth, vol. 39, no. 2, pp. 447-452, 2025.
- G. T. V. F. Leadbetter NH, "Unique Approach to Quality Assurance in Viscoelastic Testing," J Appl Lab Med, vol. 5, no. 6, pp. 1228-1241, 2020.
- B. R. Favaloro EJ, "An update on quality control for the PFA-100/PFA-200," Platelets, vol. 29, no. 6, pp. 622-627, 2018.
- S. Medicine, "Practical-Haemostasis.com - A practical guide to haemostasis," [Online]. Available: https://practical-haemostasis.com/Platelets/VerifyNow%20Assay.html. [Accessed 5 6 2025].
- M. P. J. I. e. a. Marlar RA, "Consistent accuracy: a goal for thrombosis and hemostasis testing is accomplised using an external quality assurance program," Annals of Blood, vol. 5, no. 11, pp. 1-4, 2020.
- L. A. K. S. Montalvão SAL, "Advantages of external quality assessment-EQA programs," Haemophilia, vol. 28, no. 4, pp. 679-686, 2022.
- K. AG, "Evaluating the Effectiveness of Diagnostic Tests," JAMA, vol. 327, no. 14, pp. 1335-1336, 2022.
- S. P. E. M. Vetter TR, "Diagnostic Testing and Decision-Making: Beauty Is Not Just in the Eye of the Beholder," Anesthesia & Analgesia, vol. 127, no. 4, pp. 1085-1091, 2018.
- L. L. C. H. e. a. Murad MH, "The association of sensitivity and specificity with disease prevalence: analysis of 6909 studies of diagnostic test accuracy," CMAJ, vol. 195, no. 27, pp. 925-931, 2023.
- CLSI, "H59-A: Quantitative D-Dimer for the Exclusion of venous Thromboembolic Disease, 1st Edition," Clinical and Laboratory Standards Institute, 2011.
- W. TE, "Laboratory diagnosis of heparin-induced thrombocytopenia," Int J Lab Hematol, vol. 41, no. Suppl 1, pp. 15-25, 2019.
- E. S. D. T. Westgard JO, "CLIA Final Rules for Quality Systems: Quality Assessment Issues and Answers.," in Clinical Chemistry, vol. 51, 2005, pp. 1911-1912.
- D. o. H. a. H. Centers for Medicare & Medicaid Services, "Code of Federal Regulations, eCFR: 42 CFR 493.1105 Standard: Retention Requirements," 29 May 2025. [Online]. Available: https://www.ecfr.gov/current/title-42/chapter-IV/subchapter-G/part-493/subpart-J/section-493.1105. [Accessed 1 6 2025].
Figure 1.
An example of calibration assay results on a hemostasis analyzer. The calibration run is found to be accurate as shown by the coefficient of regression (r2) value of 1.000. The darkened regions are in compliance with guidelines upholding Instrument and Laboratory confidentiality.
Figure 1.
An example of calibration assay results on a hemostasis analyzer. The calibration run is found to be accurate as shown by the coefficient of regression (r2) value of 1.000. The darkened regions are in compliance with guidelines upholding Instrument and Laboratory confidentiality.
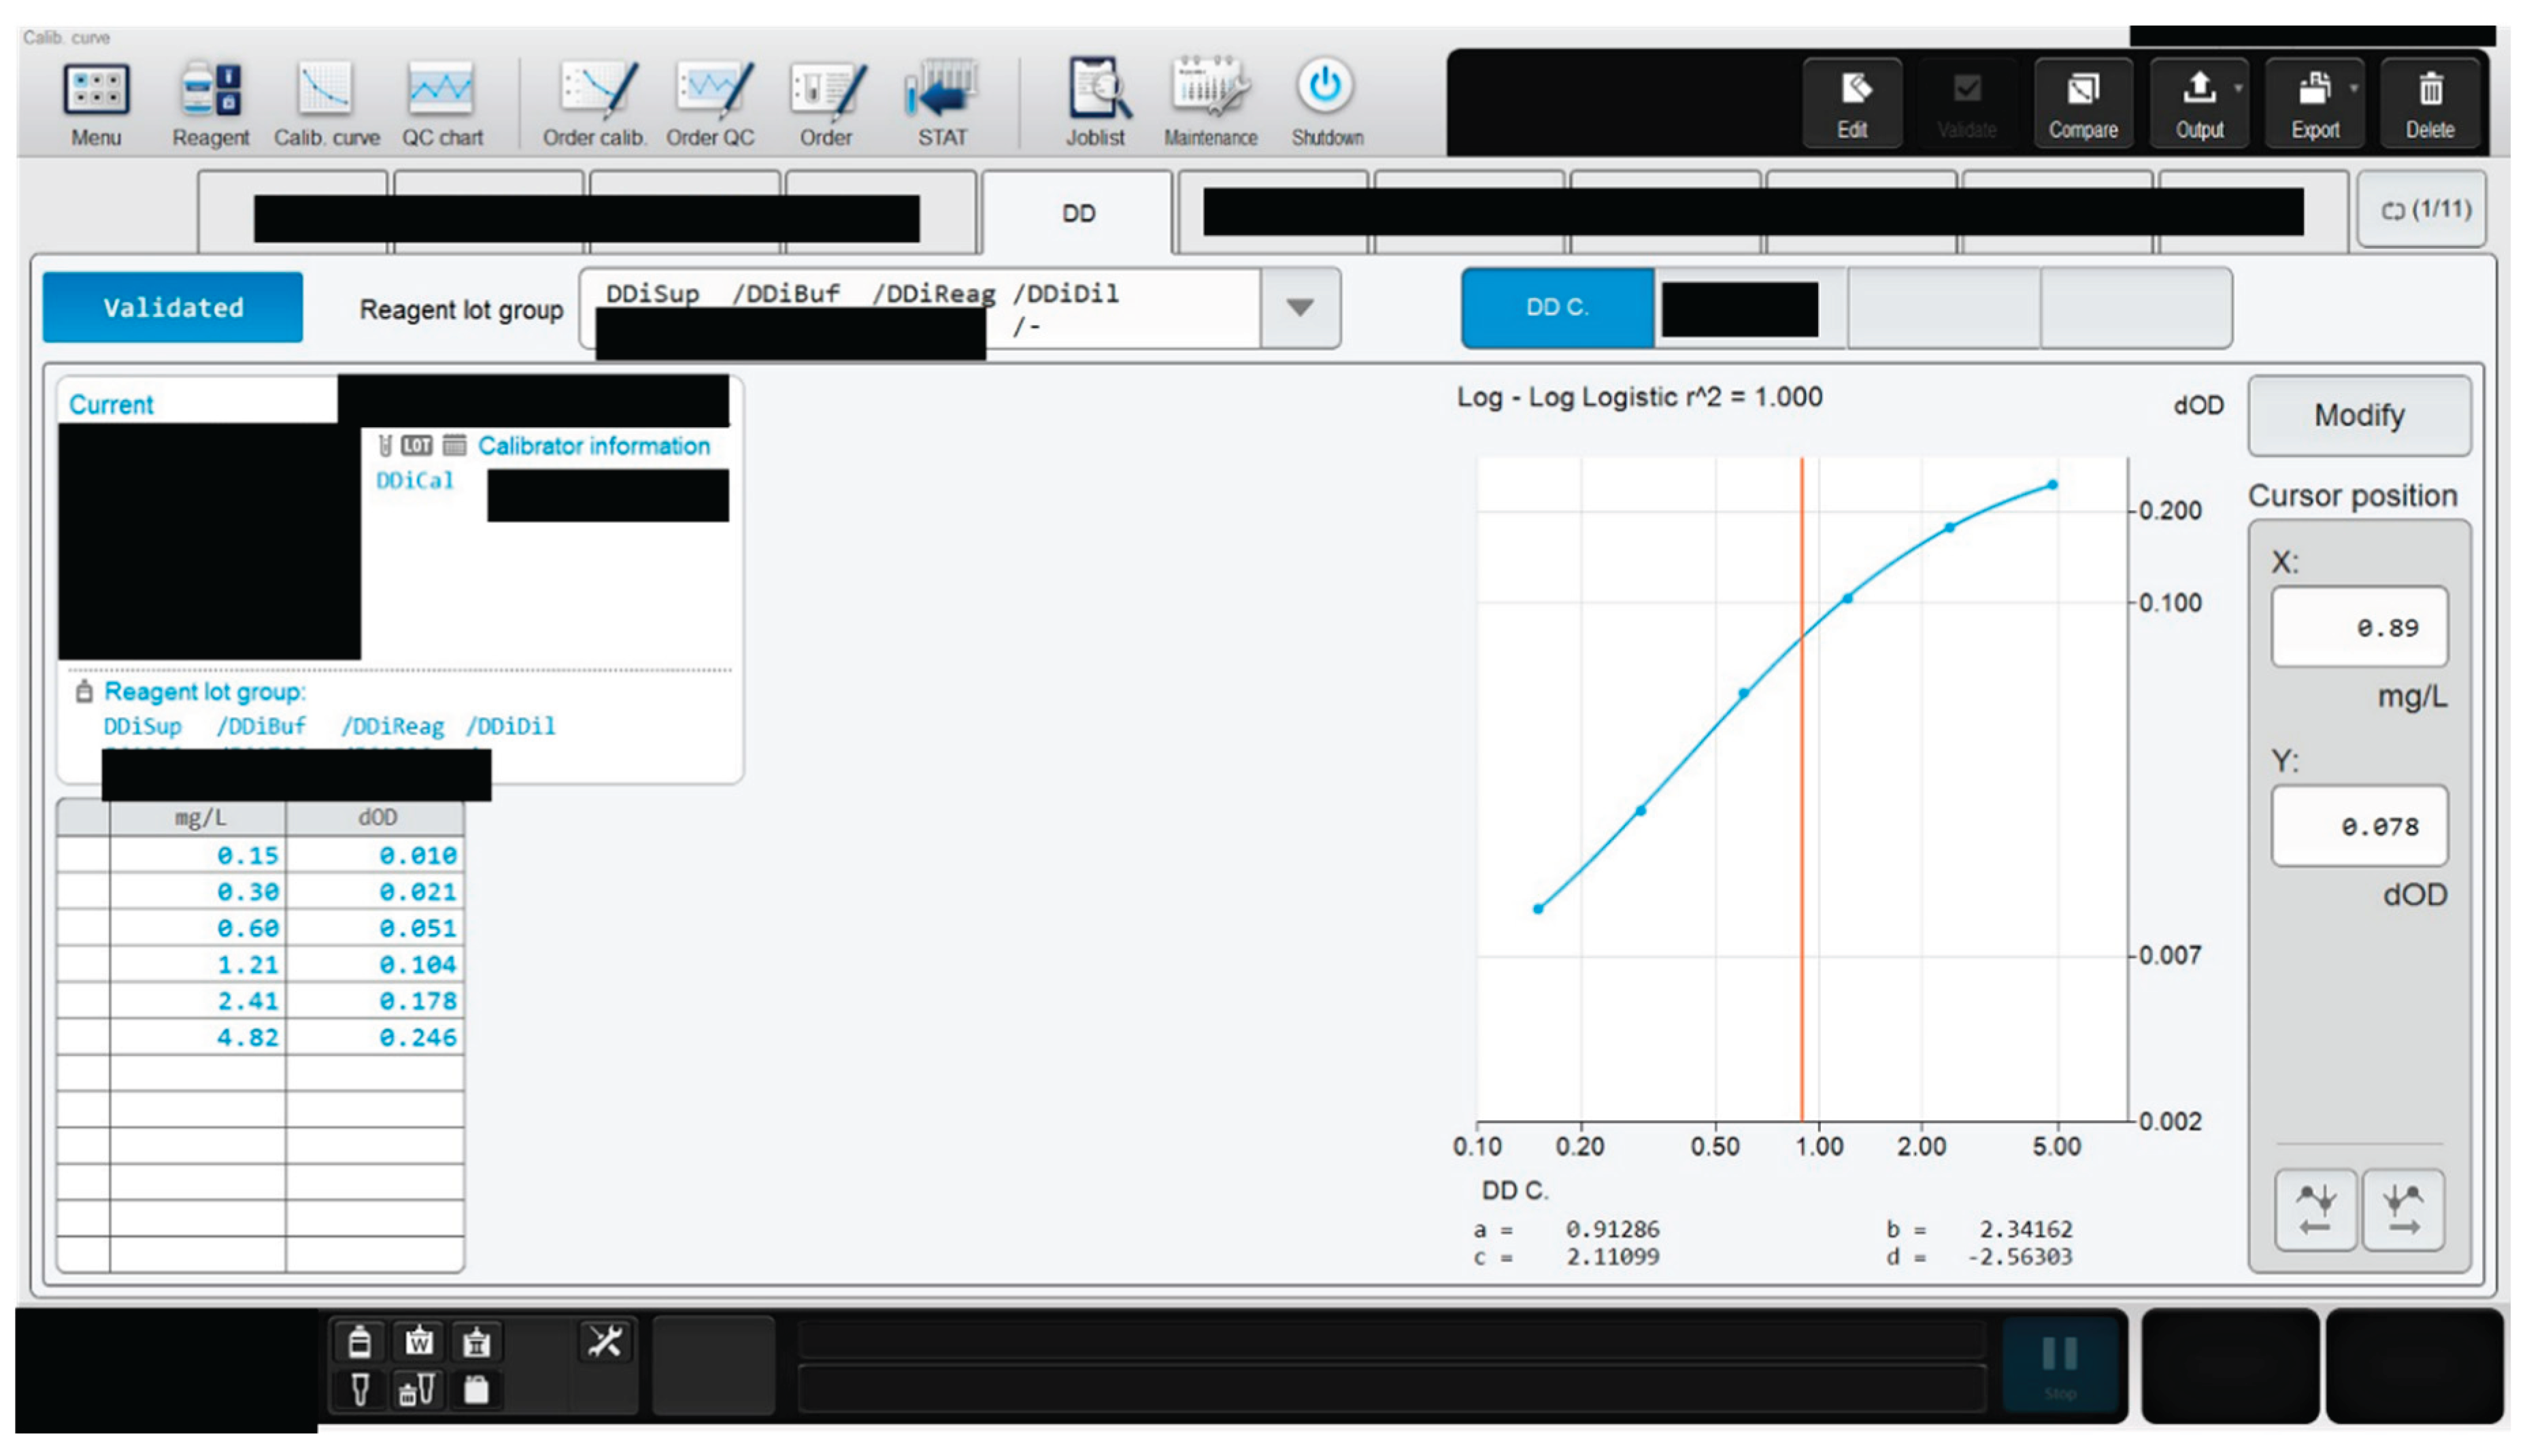
Figure 2.
Linearity of a D-Dimer assay in a hemostasis laboratory showing comparison between assayed versus computed values. The levels V-1 to V-5 define the different MDLs of the D-Dimer assay. Linearity of this assay is defined as 0.25-3.90 mg/L FEU, and below or above these values, non-linearity is observed.
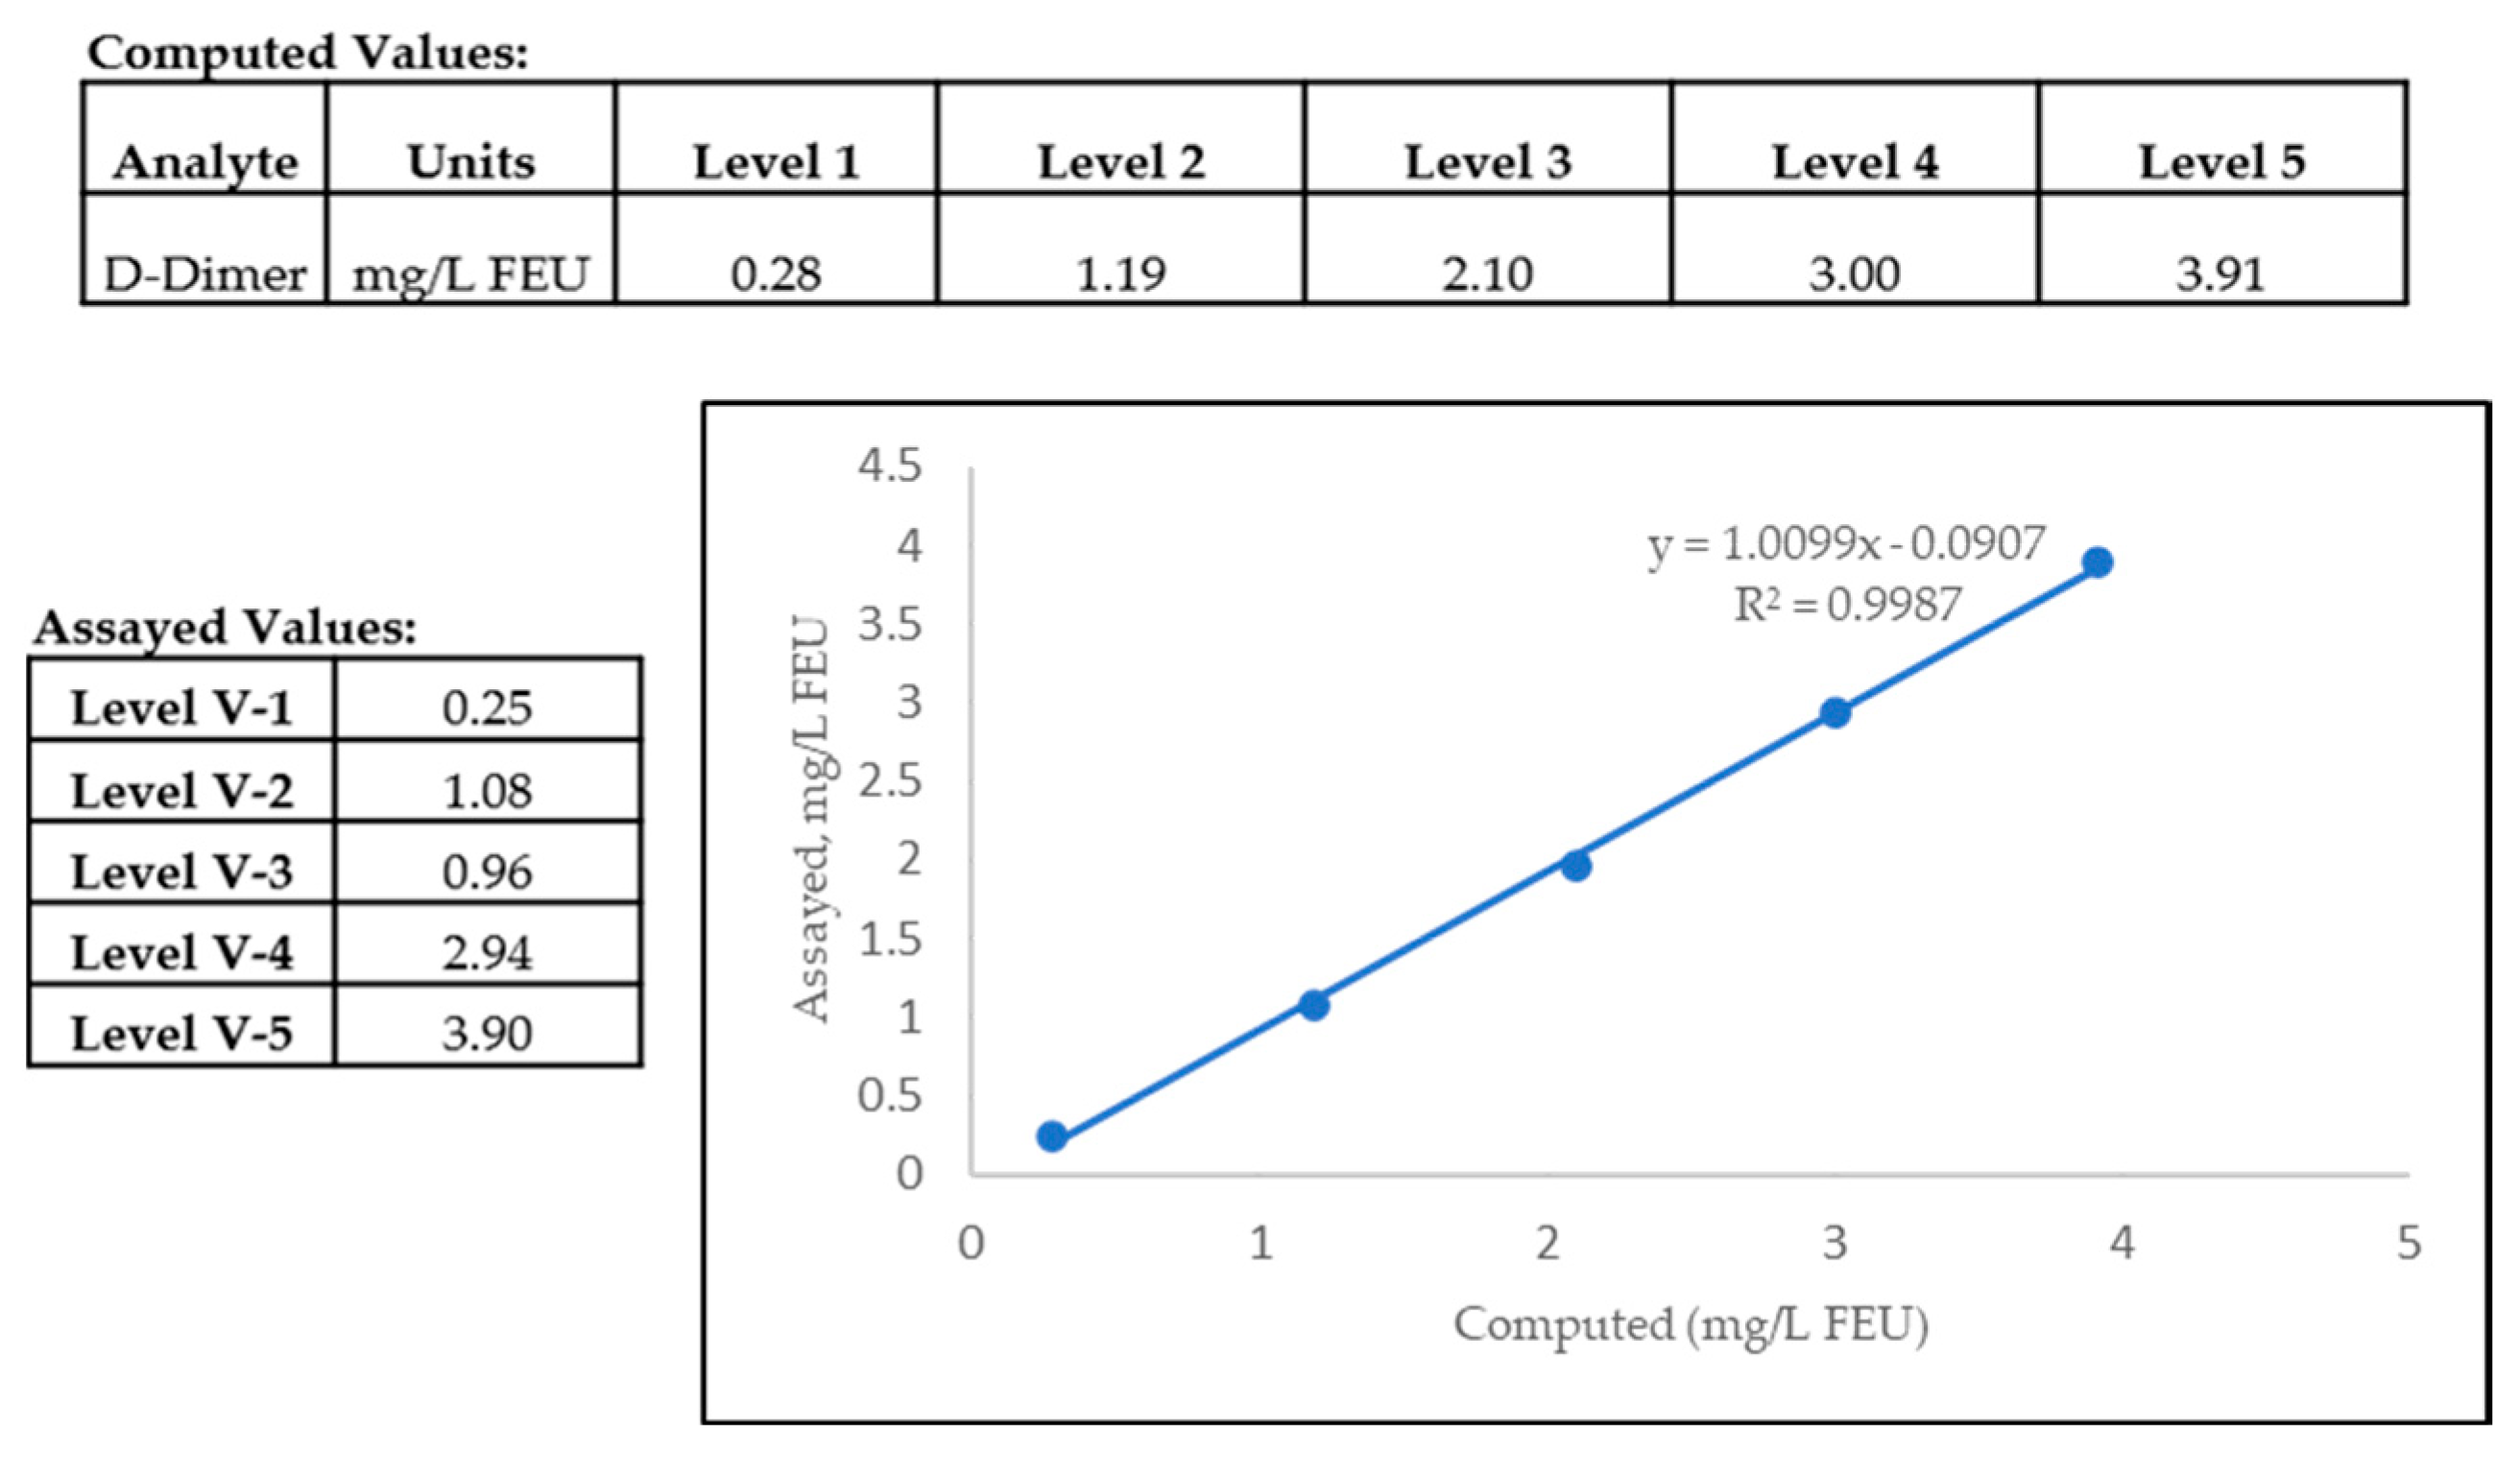
Figure 3.
Normal Gaussian distribution of a representative RI dataset. The +/- 2SD represents the 95% of the values that fall equally above and below the average or the mean of the observed datapoints.
Figure 3.
Normal Gaussian distribution of a representative RI dataset. The +/- 2SD represents the 95% of the values that fall equally above and below the average or the mean of the observed datapoints.
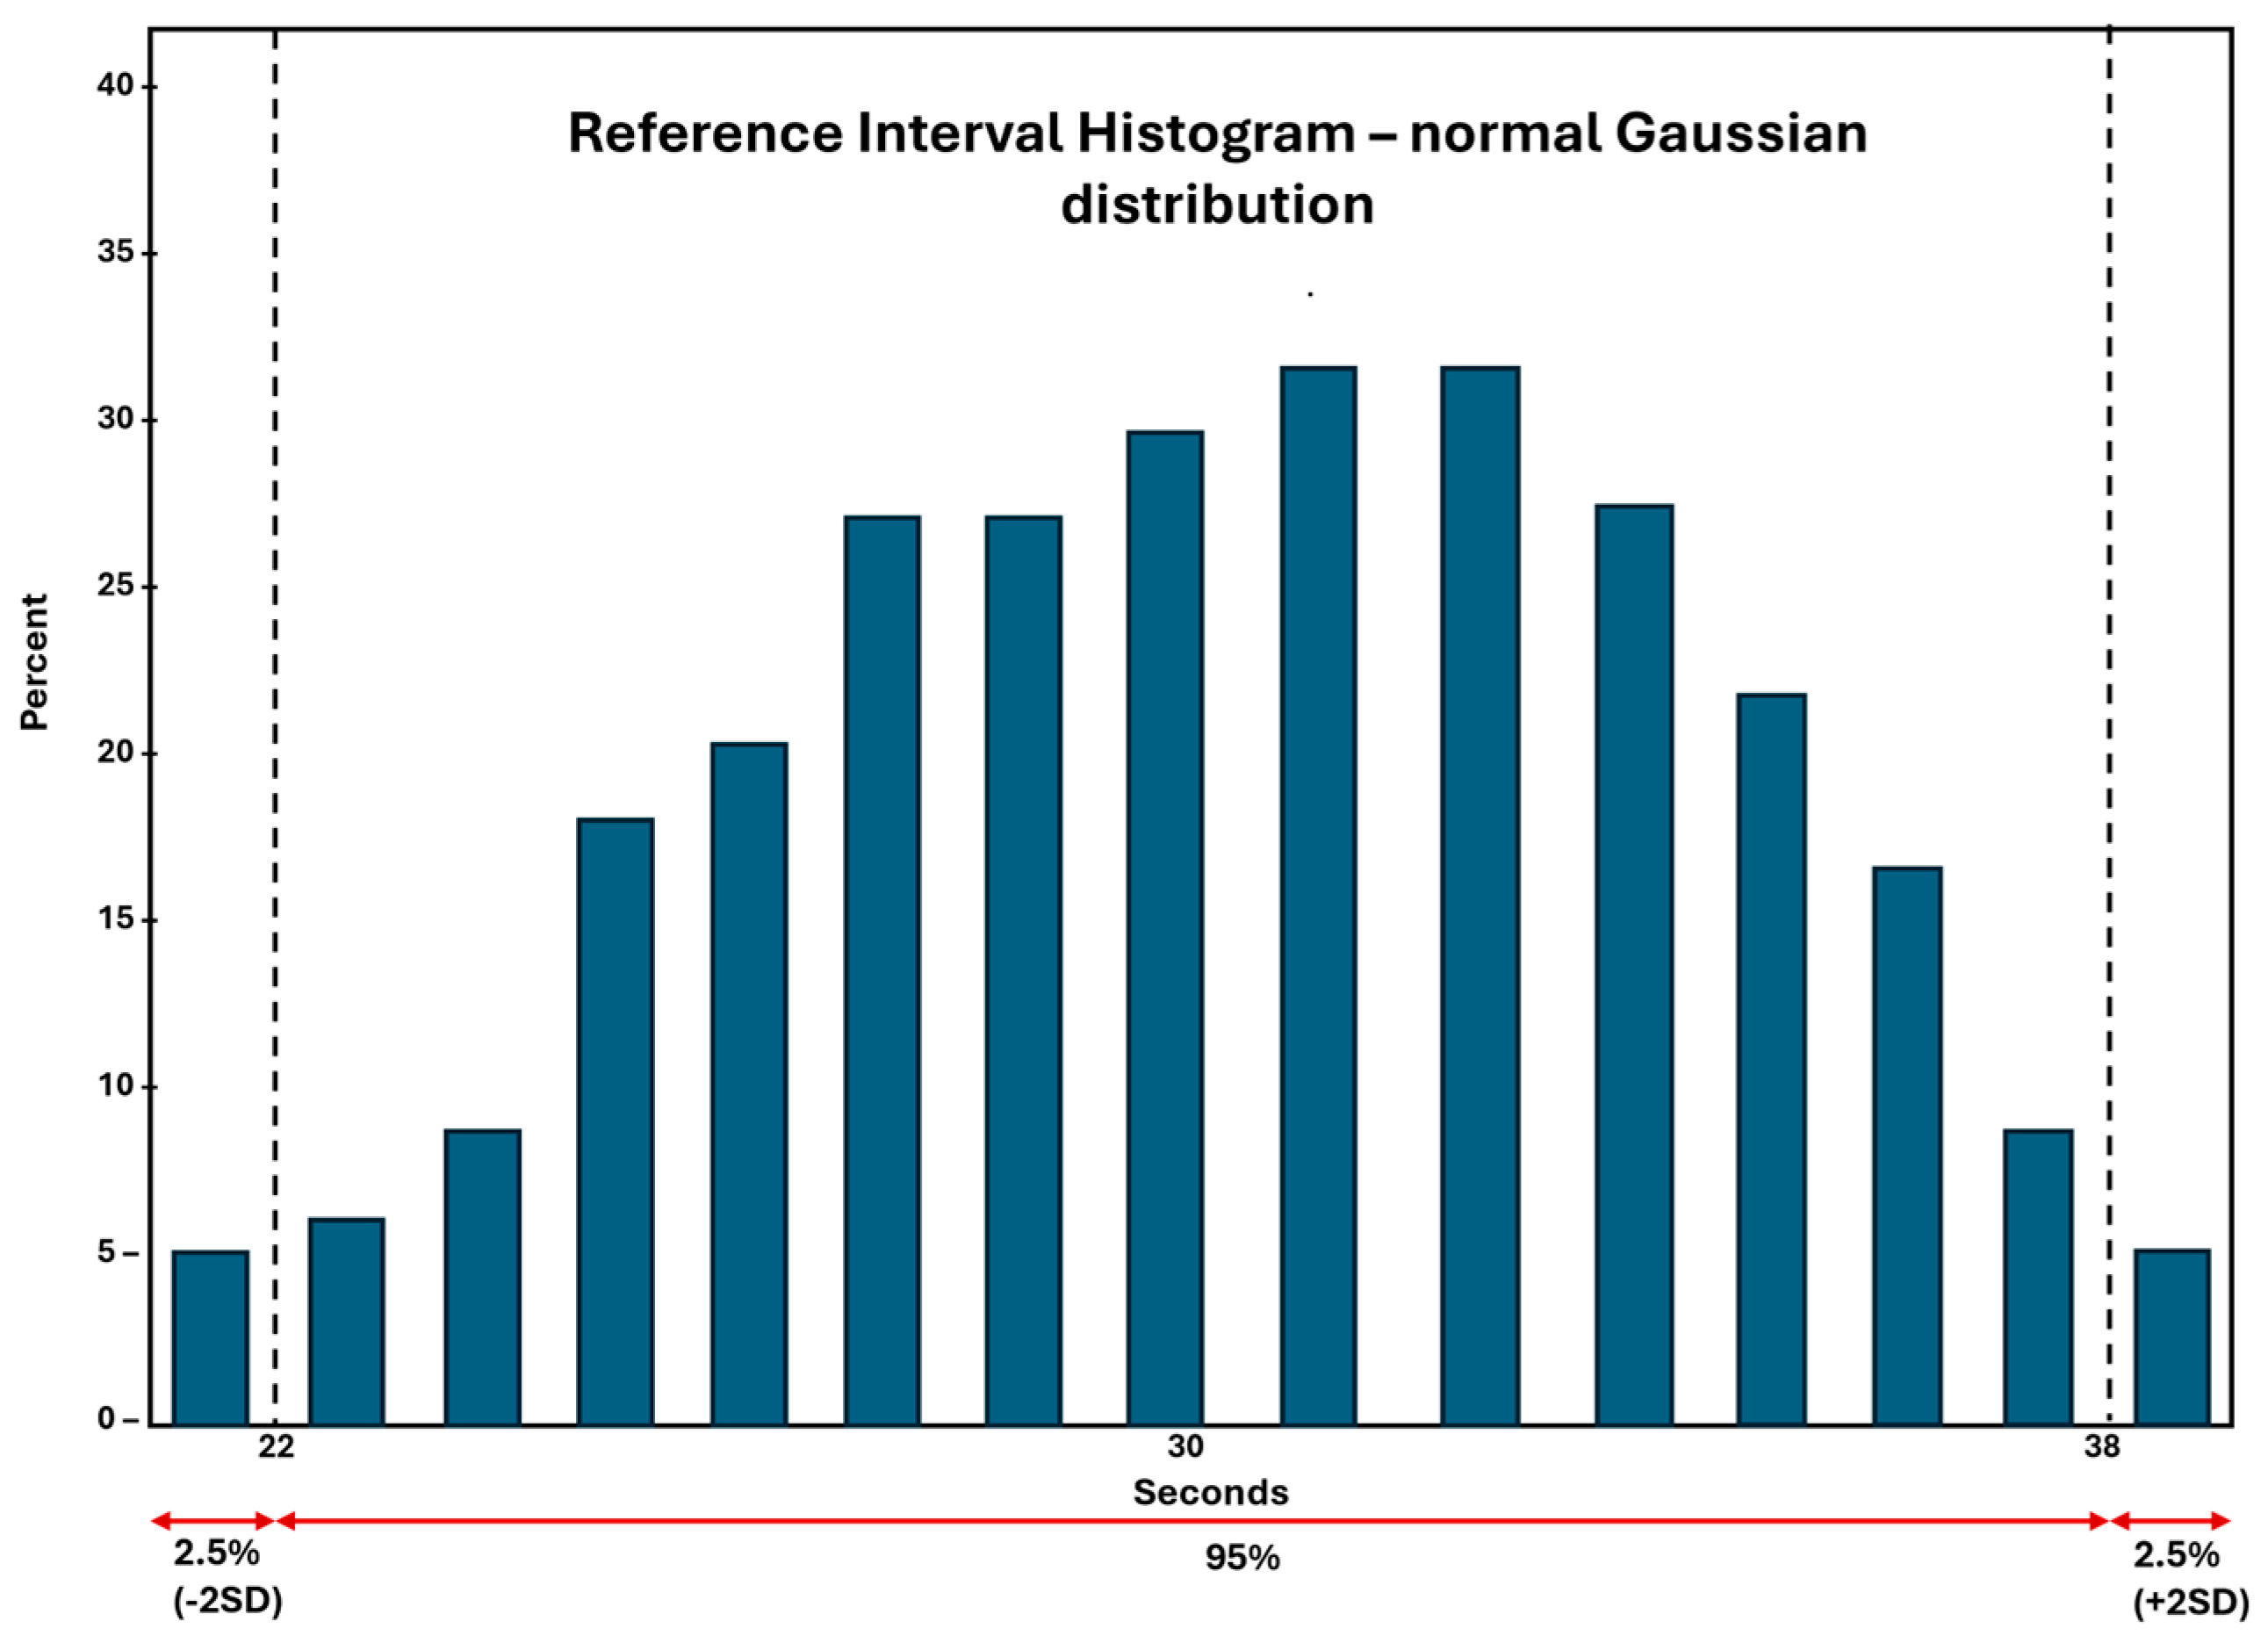

Table 1.
Pre-analytical variables for patient selection.
| Patient Variable | Patient Condition |
|---|---|
| Age | Neonatal, pediatric, adult – varying reference ranges; labs may employ a separate pediatric reference range in addition to the normal adult reference range for accurate interpretation of tests results and diagnosis |
| Gender | Male/ Female – coagulation factors vary according to patient gender |
| Health Status | Patients under psychological or physiological stress (for example, after strenuous exercise) may mask or suggest a coagulopathy |
| ABO blood group | Differences may be noted in von Willebrand factor (VWF) and factor VIII levels |
| Time of Blood Collection | Patients on oral anticoagulants, with inflammatory conditions, or post traumatic event – may affect platelet function testing, special coagulation tests like protein C, protein S and lupus anticoagulant testing |
Table 2.
Order of Draw for Vacutainer tubes in a Clinical Laboratory.
| Order of Draw | Vacutainer tube/ color of tube top/stopper |
|---|---|
| 1 | Blood culture tube – varying colored tube tops |
| 2 | 3.2% Sodium citrate – Light Blue top |
| 3 | Serum tube (glass or plastic) – Red top |
| 4 | SST – Gold or red/black or red top |
| 5 | Heparin (Sodium or Lithium) – Green top |
| 6 | EDTA – Lavender or Pink top |
| 7 | PPT, EDTA with gel – White top |
| 8 | Sodium fluoride – Gray top |
| 9 | Quantiferon – Gold top |
Table 3.
Assay and Criteria for Accuracy.
| Assay parameters | Acceptable criteria |
|---|---|
| Prothrombin time/ INR (PT/INR) | Target ± 15% |
| Partial Thromboplastin time (APTT) | Target ± 15% |
| Fibrinogen | Target ± 20% |
Table 4.
QC specifications for some routine and special hemostasis assays. Adapted with permission from Bonar et al [32].
Table 4.
QC specifications for some routine and special hemostasis assays. Adapted with permission from Bonar et al [32].
| Test (abbreviation) | Level 1 control target | Level 2 control target | Optional/ additional controls and comments |
|---|---|---|---|
| Routine coagulation | Midpoint of normal | Midpoint of therapeutic | High end of therapeutic or abnormal |
| tests (i.e., PT, INR, | reference range | (anticoagulant therapy) range | range |
| APTT, TT). | (high level) | ||
| Fibrinogen | Low end or midpoint of | Midpoint of abnormal (low level) | High end control if thrombosis-risk is |
| normal reference range | range | being assessed. | |
| D-dimer | Low end or midpoint of | Midpoint of abnormal (positive) | High end for quantitative assays, |
| normal (negative) reference | range (positive control) | especially if DIC is being ‘monitored’ | |
| range (negative control) | |||
| Factor assays | Low end or midpoint of | Midpoint of abnormal (low level) | Factor deficient plasma to identify |
| (FII, FV, FVII, FVIII, | normal reference range | range (i.e., 20–40%) | lower assay limit; high-end control |
| FIX, FX, FXI, FXII) | (i.e., 90–100%) | (≥150%) for quantitative assays if | |
| thrombosis-risk is being assessed. | |||
| FXIII | Normal plasma (negative | FXIII deficient plasma (positive | |
| control) | control) | ||
| VWF assays | Low end or midpoint of | Midpoint of abnormal (low level) | VWF deficient plasma to identify lower |
| normal reference range | range (i.e., 20–40%) | assay limit; high-end control (≥150%) for | |
| (i.e., 90–100%) | quantitative assays if thrombosis-risk | ||
| is being assessed; qualitative (Type 2 | |||
| VWD-like) control. | |||
| PC, PS, AT | Low end or midpoint of | Midpoint of abnormal (low level) | |
| normal reference range | range, or heterozygous pattern | ||
| control | |||
| APCR | Low end or midpoint of | Midpoint of abnormal (low level) | |
| normal reference range | range, or heterozygous pattern | ||
| control | |||
| LA | Negative control | Positive control (weak positive | Positive control (moderate or strong |
| near assay cut-off) | positive) |
Table 5.
Steps necessary to re-evaluate QC in case of QC failures.
| Step | Reasons for QC failures |
|---|---|
| 1. Re-test → If re-test still shows failure, then proceed to step 2 |
If results fall above or below the reference limit of ±2 SDs |
| 2. Prepare new control and re-test → If re-test still shows failure, then proceed to step 3 |
If QC run is within reference limits of ±2 SDs, then previous failure may have occurred due to deterioration of initial QC reagent. |
| 3. Prepare fresh reagents and re-test → If re-test still shows failure, then proceed to step 4 |
If QC run is within reference limits of ±2 SDs then the laboratory has identified an issue with the reagent on board the analyzer. At this time, a LOOK-BACK is necessary for the laboratory which is looking back at what point QC deviation beyond acceptable limits occurred with the previous reagent on board the analyzer. |
| 4. Recalibrate instrument → | Recalibration of instrument followed by validation of assay calibration with freshly prepared QC and reagents will be necessary. If recalibration also does not fix QC errors, then the Instrument will need to be taken out of service and may require repair by the manufacturer service engineer. |
Table 6.
Diagnostic testing accuracy: Sensitivity, Specificity and Predictive values.
| True positive | Assay correctly identifies a disease or condition in those who have the disease or condition. | |
| False positive | Assay incorrectly identifies disease or condition when none is present. | |
| True negative | Assay correctly excludes a disease or condition in those without it. | |
| False negative | Assay incorrectly excludes disease or condition when it is present. | |
| 2x2 table | Healthy subjects | Diseased subjects |
| Assay is negative | True negative | False negative |
| Assay is positive | False positive | True positive |
Disclaimer/Publisher’s Note: The statements, opinions and data contained in all publications are solely those of the individual author(s) and contributor(s) and not of MDPI and/or the editor(s). MDPI and/or the editor(s) disclaim responsibility for any injury to people or property resulting from any ideas, methods, instructions or products referred to in the content. |
© 2025 by the authors. Licensee MDPI, Basel, Switzerland. This article is an open access article distributed under the terms and conditions of the Creative Commons Attribution (CC BY) license (http://creativecommons.org/licenses/by/4.0/).
Copyright: This open access article is published under a Creative Commons CC BY 4.0 license, which permit the free download, distribution, and reuse, provided that the author and preprint are cited in any reuse.


