Submitted:
18 June 2025
Posted:
18 June 2025
You are already at the latest version
Abstract
With such illegal land use activities as gradually increasing within the restricted protected areas of the United States, it is urgent to carry out the efficient monitoring and management support for encroachment through remote sensing images and intelligent analysis. In this work, we develop a Semi-supervised Enhanced U-Net (SS-EU-Net) for remote sensing images in this article, with an ability to identify land encroachment areas, as well as to visualize spatially and analyze its time evolution behavior by means of the geographic information system (GIS). Inherited from the conventional U-Net, the model introduces two critical improvements: first, the method integrates self-supervised pre-training scheme and pseudo-label generation mechanism to improve the feature learning capability of the model on the unlabeled satellite images. Multi-scale attention fusion module was proposed to greatly enhance the segmentation performance on complex edge of ground objects. The model takes a remote sensing image with geographical coordinates as an input and then generates a pixel-level mask of encroachment based on GIS layer through coordinate registration, which accomplishes the refined monitoring for the temporal and spatial variations of encroachment as well as helps for the decision support. Experimental results demonstrate that SS-EU-Net enhances the IoU and F1 by 5.3% and 4.7% in remote sensing image data set of typical protected areas in USA than existing methods.
Keywords:
remote sensing imagery
; semi-supervised learning
; U-Net
; GIS integration
; land encroachment detection
1. Introduction
In recent years, threats to global ecotypes have become more and more severe, in particular, influenced by climate change and urban expansion, many of the society’s “restricted development” and “ecological redline” have been pillaged or destroyed. In the United States, extensive acreages of federal, state, and local woodlands, wetlands, and national parks are often threatened by invasive agriculture, road-building and development, and unlawful residential habitation. Such encroachment frequently happens in ecologically fragile margin zones, which can severely destruct the original habitat connections and hinder the migration course of wild animals and plants, thus significantly posing a threat to local ecological security, species diversity conservation, etc [1].
Specifically, in 2021, illegal encroachment into a number of the western US nature reserves elevated the danger of wildfire propagation, generating general public concern over our capacity to manage ecosystems [2]. Thus, the development of an automatic scheme to support remote sensing observation, spatial analysis and smart identification in order to realize the real-time and high-precision monitoring of illegal encroachments in protected areas becomes very appealing at this time.
As an Non-contact observation method, the remote sensing technique has played a significant role in monitoring the earth surface dynamic change. Remote sensing can obtain large-scale, time-series stable land surface image data by using multispectral or high-resolution sensors on board satellites or aerial platforms, which is extensively employed in land use classification, vegetation change detection, water monitoring and other applications [3]. When it comes to surveillance of protected areas, the advantage of remote sensing is that remote, manual or difficult-to-inspect areas are integrated and that the development of encroachment is available over various timespans.
There are also some open remote sensing image platforms in the United States such as Landsat, Sentinel, NAIP and so on supply covering multi-temporal observation data for decades, which have already been an important data data sources for the analysis of dynamic change and for the identification of ecological disturbance in protected areas [4]. In this context, remote sensing offers a cost-effective and high-frequency means to map micro-scale and incremental encroachment processes.
Geographic information system (GIS) provides a unified processing, analysis and expression platform for multi-source spatial data, which can integrate and manage heterogeneous information, such as remote sensing image, geographical boundary, geomorphology, policy partition. In the intrusion monitoring of protection area, GIS system is allowed not only to map the pixel-level intrusion mask generated by the model on space and finish the pre-design under the coordinate of geographic, but also, supported by GIS, to various more complicated space-time operations such as buffer analysis, neighborhood statistics and change trend analysis [5].
By superimposing and measuring the government’s protection red lines or historical management red lines, GIS can accurately identify spatial attribution and management degree for encroachment as well as the management authorities in charge [6]. Meanwhile, GIS visualization tools can also be applied to the evident demonstration of public opinion, ecological compensation evolution and policy optimization recommendation, which is a powerful means to support ecological intelligent governance.
2. Related Work
Gunawansa et al. [7] employed Sentinel-2 data and GIS technology in a protected region in Sri Lanka to reliably identify human-elephant conflict hotspots, primarily in the margins between forest and farmland through the NDVI time series analysis, kernel density estimation (KDE) of conflict incidents and the multi-factor overlay. Sharma et al. [8] analyzed the use cases of remote sensing and GIS tools or platforms (e.g., including GEE, ENVI, ERDAS, QGIS, etc.) in the management of natural resources and highlighted the importance of ground-based in-situ data on the validation and performance improvement of remote sensing/GIS model.
Mangewa et al. [9] used ground survey high-resolution images as training samples in Tanzania reserves, and used random forest and other algorithms to classify land cover on Sentinel-2 images, and obtained an Overall Accuracy of 94% and Kappa 0.92, which was better than the traditional Sentinel-2 classification. Wang et al. [10] constructed a combined GIS + UAV approach, first using GIS network analysis to evaluate cotton transportation pathways and environmental factors, and identified high-risk areas for volunteer cotton growth in 31 counties in southern Texas.
Lv et al. [11] constructed an efficient multi-source remote sensing forest swamp classification method for the Changbai Mountain Ecological Function Reserve, and designed a two-stage classification framework by integrating Sentinel-1/2, ALOS-2/PALSAR, Landsat-8, and environmental covariates such as topography and land surface temperature. Firstly, 94% of the artificial surface disturbances were eliminated by using the NDBI threshold, and then the optimized random forest classifierwas used to combine 42 features and generate a forest swamp map at 10 m resolution through ten-fold cross-validation. Nguyen et al. [12] used natural zoning information and remote sensing-GIS data to identify land use dynamics, and then realized short-term prediction through CA-Markov, and captured the nonlinear relationship between environmental and socioeconomic factors through the MOLUSCE module, which significantly improved the accuracy of future forest cover change simulation.
3. Methodologies
3.1. Semi-supervised pseudo-label optimization mechanism
In order to make full use of the large number of unlabeled samples in remote sensing images, we propose a semi-supervised training strategy based on pseudo-label generation and consistency constraints. The mechanism consists of three key steps: pseudo-label generation, consensus regularization, and finally joint optimization of the objective function.
Above all, the current model is used to predict the unlabeled sample to obtain the prediction probability graph , and then the pseudo-label is generated based on confidence threshold, as Equation 1:
where represents the prediction probability of the model at pixels , is the confidence threshold (e.g., 0.9), and the region below this threshold will be treated as an uncertainty region and ignored.
This pseudo-labeling strategy ensures that only high-confidence regions are used for semi-supervised training, avoiding pseudo-label propagation noise. The pseudo-label region is trained using the standard cross-entropy loss function , as shown in Equation 2:
where represents the trusted region of the pseudo-label, is the pseudo-label value, and is the corresponding predicted value.
In order to further enhance the robustness of the model, a consistency loss term is introduced to constrain the prediction results of the model to be consistent before and after image perturbation, as shown in Equation 3:
where Represents image perturbation operations, such as random flipping, rotation, or color perturbations. Structured similarity masks are further introduced, emphasizing consistency in the edge region, as shown in Equation 4:
where represents the weight of the edge structure (e.g., generated by the Sobel operator), which can enhance the consistent learning of the model at the edge position. Overall loss function integrates monitoring mechanisms, as Equation 5:
where is the supervised loss of the labeled image, and , , are the weighted hyperparameters of three regular terms.
3.2. Multi-scale attention fusion module
In order to improve the traditional U-Net recognition ability of complex ground object edges in remote sensing images, a multi-scale dilated convolution and spatial attention fusion module is introduced to enhance the segmentation ability from two aspects: feature diversity and spatial saliency. Dilated convolutions with different expansion rates are used to extract multi-scale context information, as Equation 6:
where denotes the dilated convolution with the expansion rate , is the input feature graph, is the number of scales, and is the learnable weight. Combined with global mean pooling and maximum pooling, the guided model focuses on the salient region, which is expressed as Equations 7 and 8:
where represents sigmoid activation, and represents element-by-element multiplication. This mechanism effectively enhances the response of the model to edge and weak features, and improves the segmentation accuracy.
The mask map of the final output of the model needs to be registered to the GIS spatial coordinate system for dynamic change analysis, as Equation 9:
where is the geographic coordinate of the upper left corner of the image, is the image resolution (e.g., 30 meters per pixel), and is the pixel index.
The Figure 1 shows the overall architecture of the semi-supervised enhanced U-Net (SS-EU-Net) model proposed in this paper, which mainly includes input remote sensing images, encoder module, self-supervised pre-training branch, multi-scale attention fusion module and decoder output. The input on the left side of model is a remote sensing image with geographic coordinates, and after multi-layer coding to extract features, enters module for scale fusion and saliency enhancement.
At the same time, the self-supervised branch at the top uses a convolutional neural network to model the structure information of the unlabeled image, and is used to generate pseudo-labels and consistency regularization loss, so as to enhance the stability of training. Finally, the decoder generates a pixel-level mask of the encroachment area, and improves the utilization rate of unlabeled data through the pseudo-label mechanism, so as to realize the automated.
4. Experiments
4.1. Experimental setup
In this section, we utilize Landsat 8 from USGS as the primary dataset to address the commonly ecological reserves in the United States. With a spatial resolution of 30m and abundant multispectral bands and multi-year time series information, the dataset can be used to monitor land cover change, illegal invasion, etc. According to the characteristics of different bands in remote sensing images, we conduct a systematic evaluation on the accuracy and robustness of the model for protected area encroachment detection by calculating the pixel-level masks of model output and the real labels visually. We selected four representative methods in the field of remote sensing semantic segmentation and semi-supervised learning as benchmarks:
- U-Net is a classical fully convolutional neural network structure, which is widely used in semantic segmentation tasks. It adopts an “encoder-decoder” symmetrical structure, and uses skip-connection to fuse low-level details with high-level semantic information.
- Mean Teacher is a mainstream semi-supervised learning framework, which constructs two structures: “student model” and “teacher model”, in which the parameters of the teacher model are the exponential moving average of the student model at different training stages.
- DeepLabV3+ is an advanced semantic segmentation model that introduces Empty Space Pyramid Pooling (ASPP) and encoder-decoder architectures, and has strong multi-scale context modeling capabilities.
- FixMatch combines a pseudo-labeling mechanism with a strong and weak data augmentation strategy. It uses weak enhancement to generate pseudo-labels, strongly enhances input images, and filters labels with confidence thresholds to guide network training.
4.2. Experimental analysis
Intersection over Union is used to measure the degree of overlap between the prediction mask and the true mask.
The results of Figure 2 show that with the increase of the proportion of labeled data, the IoU of each method increases, SS-EU-Net always maintains the highest level, especially when the annotation ratio is less than 40%, and its IoU is about 3–5 percentage points higher than that of the second place FixMatch, showing the significant advantage of semi-supervised pre-training and multi-scale attention fusion in the few-shot scenario. At high annotation ratios (≥70%), the performance of all methods tends to be saturated, but SS-EU-Net still leads by about 2–3 percentage points, demonstrating that it can not only make effective use of limited labels, but also further improve segmentation accuracy under large-scale supervision.
Figure 2.
IoU Comparison Across Methods With Labeled Data Ratio.
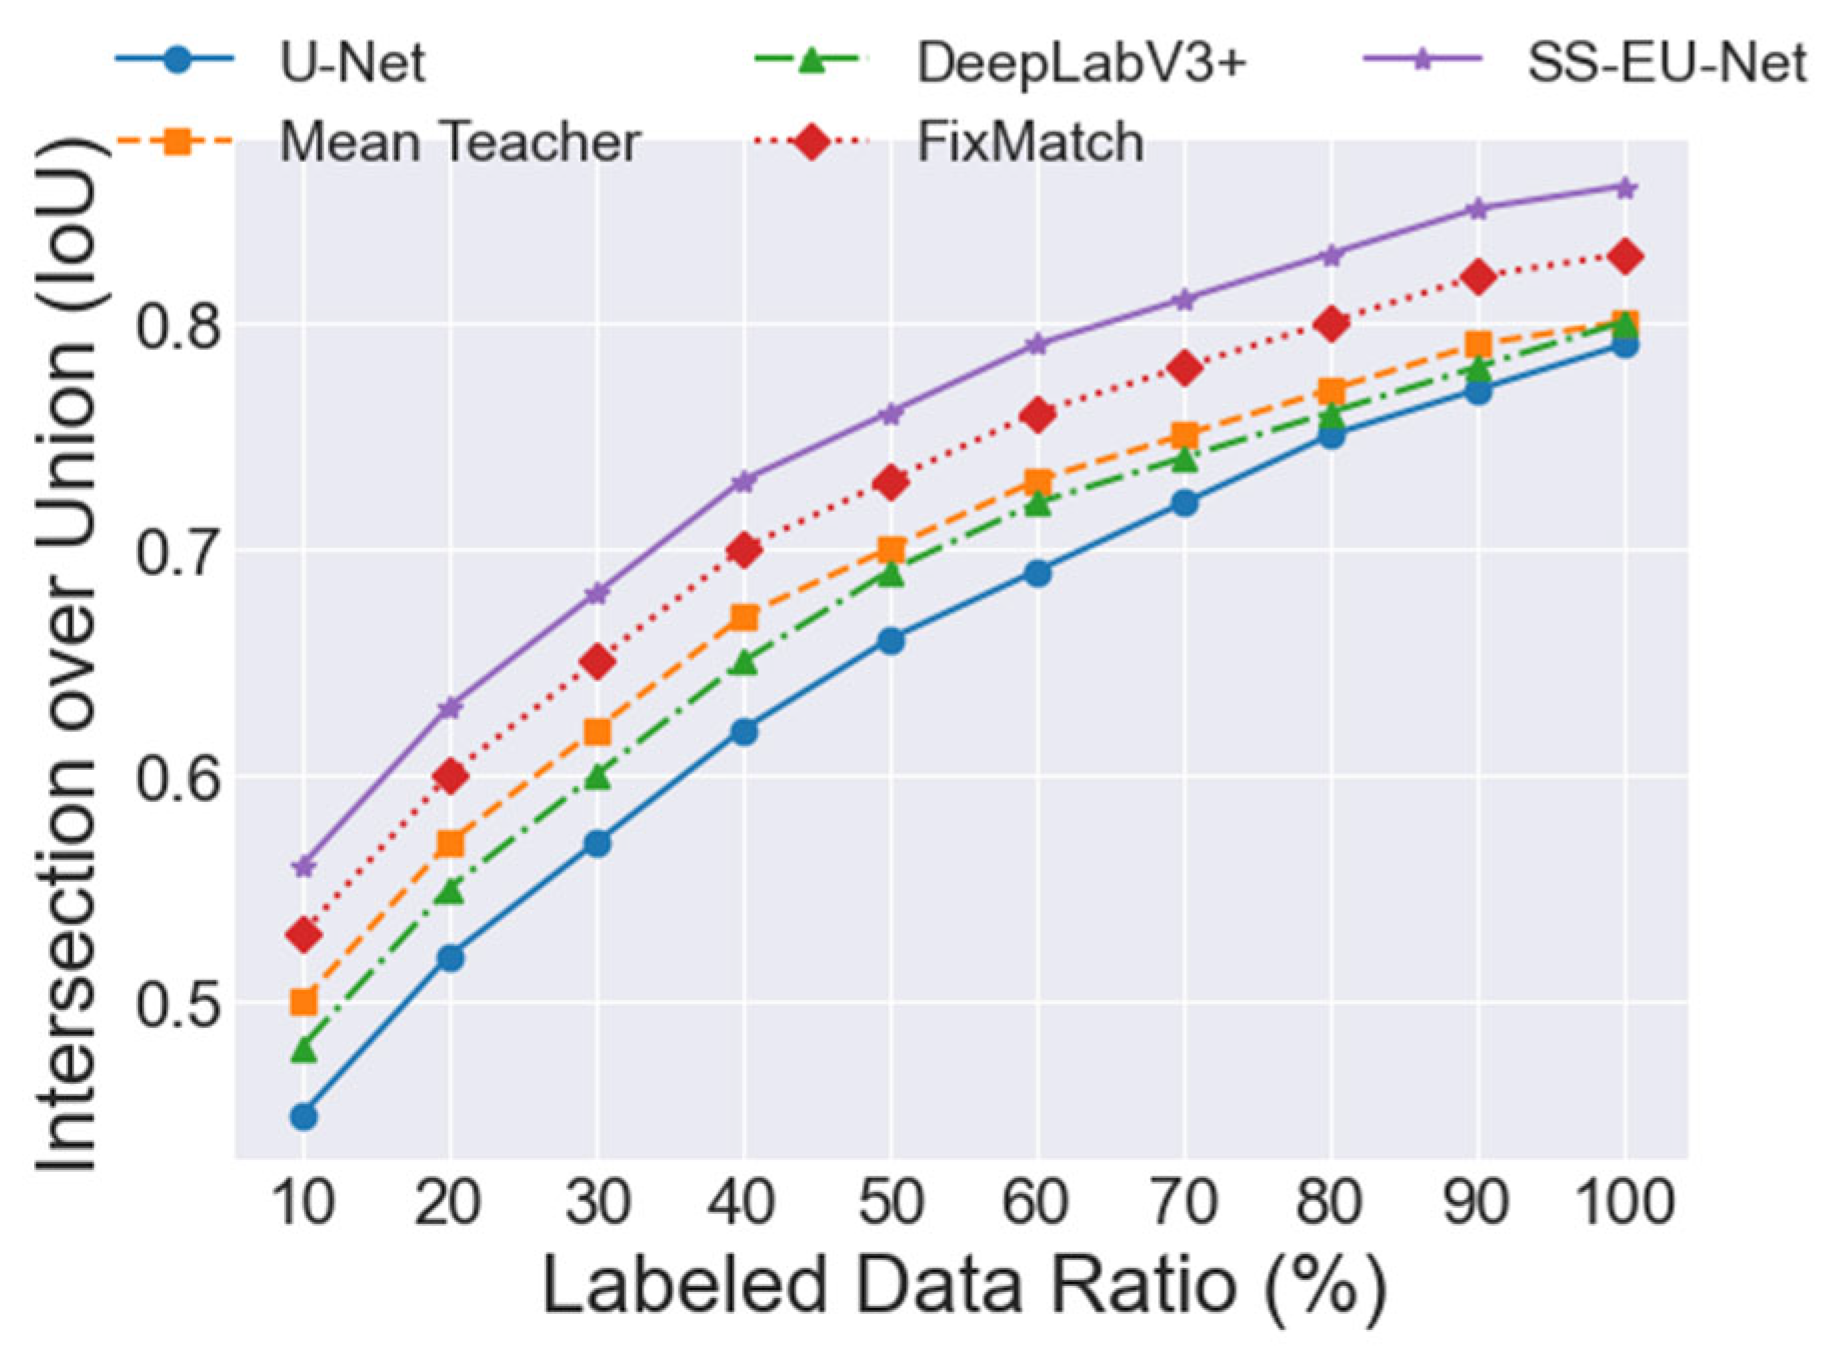
Figure 3.
‘F1 Score Comparison Across Methods With Training Epochs.
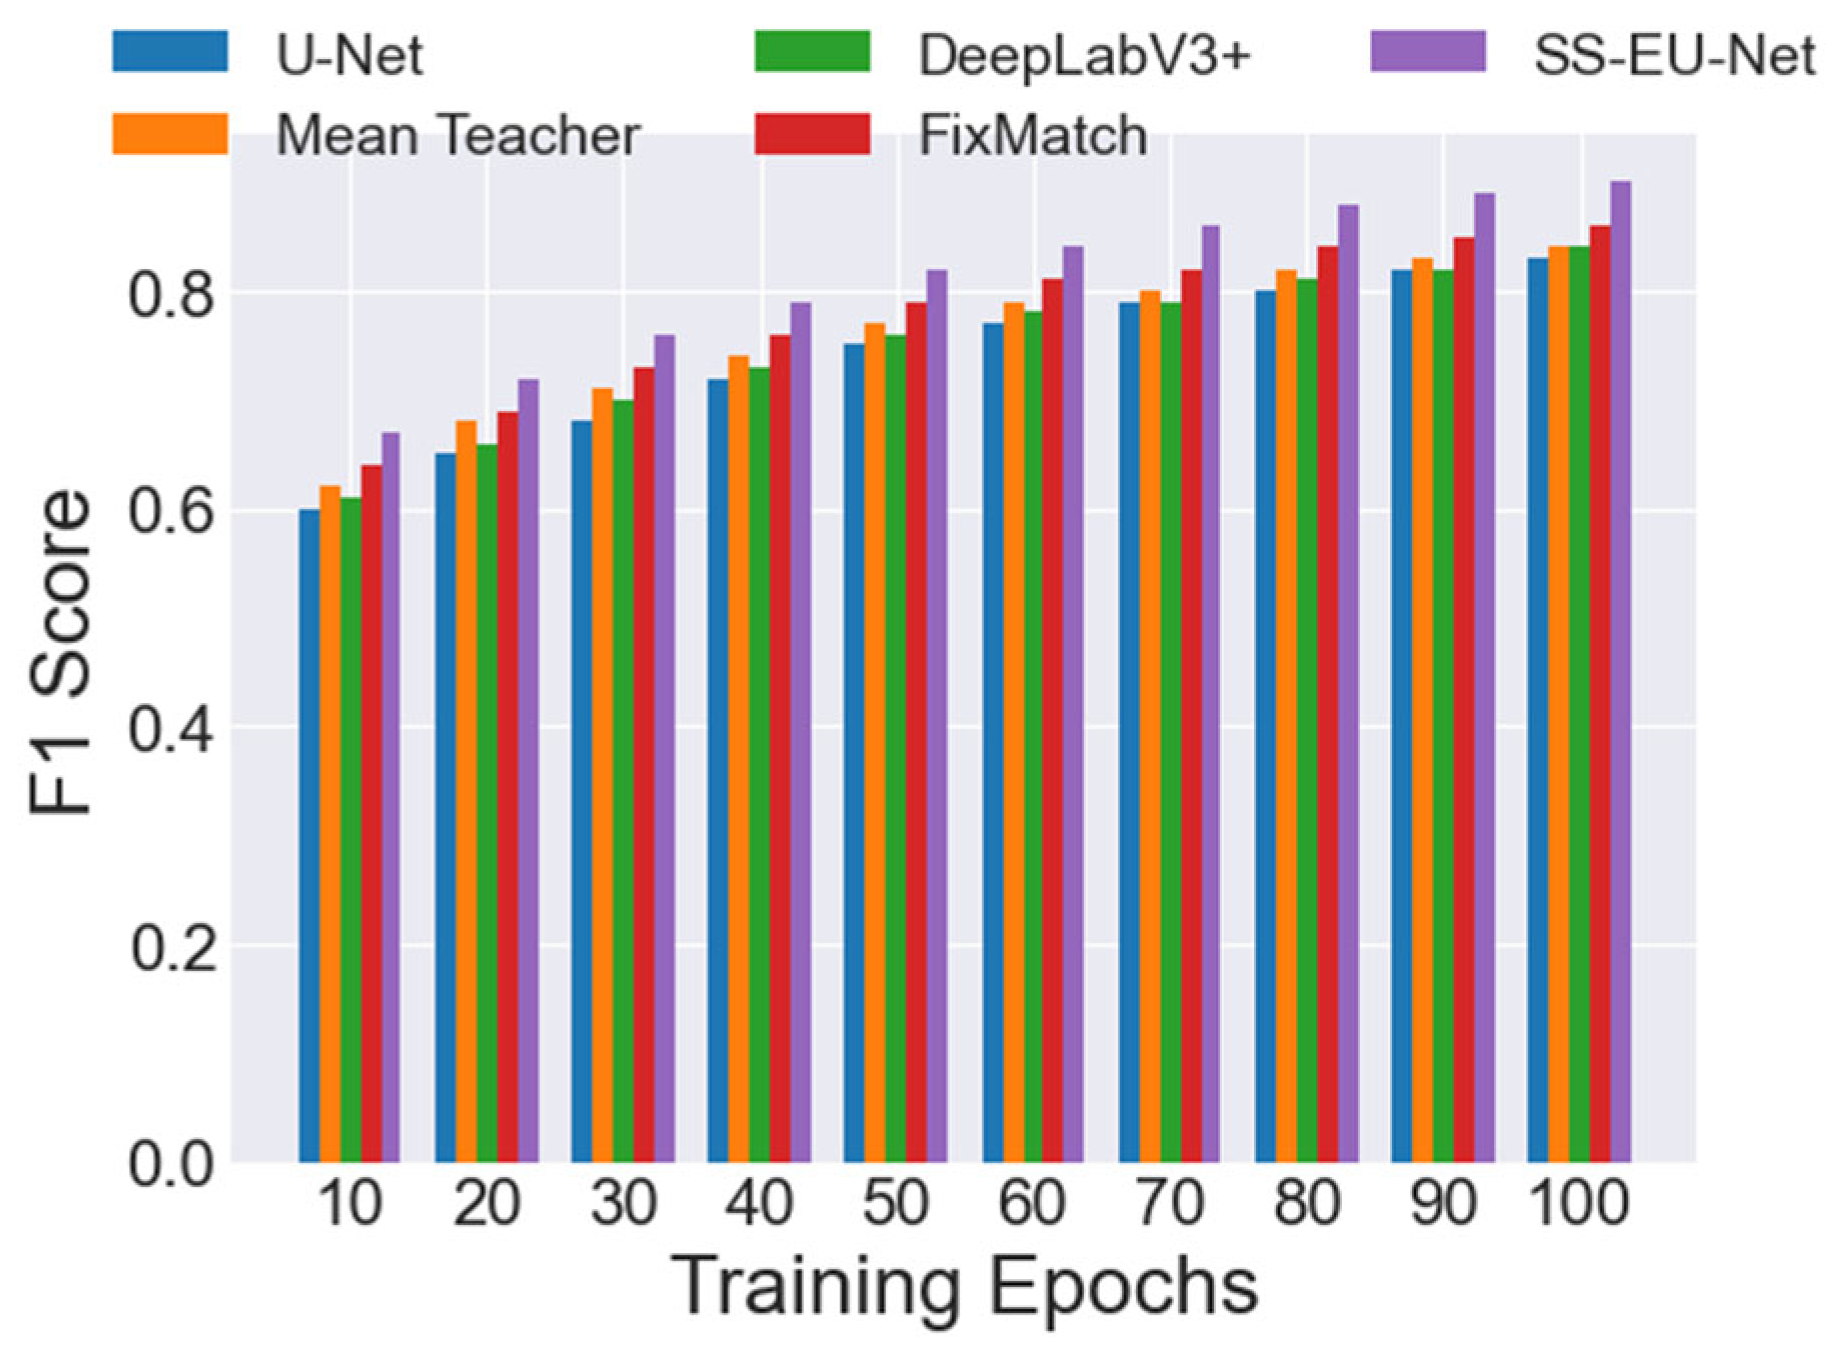
As can be seen in Figure 2, SS-EU-Net always maintained the highest level and converged the fastest throughout the training process. In the 30–50 rounds, the F1 value is already above 0.80, while other methods require a higher number of rounds to reach the same level. FixMatch came in second and also showed a strong semi-supervised advantage in the mid-to-low rounds; DeepLabV3+ and Mean Teacher gradually approached SS-EU-Net after a high number of rounds (≥70 rounds), but always lagged behind by about 0.02–0.03, while U-Net converged the slowest and had the lowest overall F1 value.
As the cloud coverage gradually increases from 0% to 90%, Table 1 shows a clear downward trend in MCC for all methods, but SS-EU-Net has always maintained the highest level and the smallest decrease in all cloud occlusion conditions: SS-EU-Net reaches 0.88 when there is no cloud, while U-Net only reaches 0.82, and when cloud coverage increases to 90%, SS-EU-Net remains around 0.44, while U-Net has dropped to 0.35.
5. Conclusion
In conclusion, this paper proposes a semi-supervised enhanced U-Net (SS-EU-Net) model, which integrates self-supervised pre-training, pseudo-label optimization and multi-scale attention fusion modules to achieve efficient and accurate pixel-level intrusion area segmentation, and completes GIS layer overlay and spatiotemporal evolution monitoring through geographic coordinate registration. Large-scale experimental comparisons show that SS-EU-Net is significantly better than U-Net, Mean Teacher, DeepLabV3+ and FixMatch in IoU, F1, MCC and other indicators, and shows excellent robustness in the context of high cloud cover and low labeling. In the future, the work will be expanded to multi-phase and multi-source data fusion, and online incremental learning and lightweight deployment will be explored to further improve the model generalization capability and real-time monitoring efficiency, and help intelligent ecological protection and decision support.
References
- Chen, F., Guo, H., Ma, P., Tang, Y., Wu, F., Zhu, M., ... & Lin, H. (2023). Sustainable development of World Cultural Heritage sites in China estimated from optical and SAR remotely sensed data. Remote Sensing of Environment, 298, 113838.
- Dong, D., Gao, Q., & Huang, H. (2024). Mangroves Invaded by Spartina alterniflora Loisel: A Remote Sensing-Based Comparison for Two Protected Areas in China. Forests, 15(10), 1788.
- Wang, N., Naz, I., Aslam, R. W., Quddoos, A., Soufan, W., Raza, D., ... & Ahmed, B. (2024). Spatio-temporal dynamics of rangeland transformation using machine learning algorithms and remote sensing data. Rangeland Ecology & Management, 94, 106-118.
- Diwate, P., Lavhale, P., Pande, C. B., Sammen, S. S., Refadah, S. S., Khan, M. Y. A., ... & Salem, A. (2025). Evaluating flood dynamics and effects in Nagpur city using remote sensing and Shannon’s entropy analysis. Scientific Reports, 15(1), 4900.
- Brumberg, H., Furey, S., Bouffard, M. G., Mata Quirós, M. J., Murayama, H., Neyestani, S., ... & Madden, M. (2024). Increasing forest cover and connectivity both inside and outside of Protected Areas in southwestern Costa Rica. Remote Sensing, 16(6), 1088.
- Kipkemboi, W., Kuria, B. T., Kuria, D. N., Sichangi, A. W., Mundia, C. N., Wanjala, J. A., ... & Rienow, A. (2023). Development of a web-GIS platform for environmental monitoring and conservation of the Muringato catchment in Kenya. Journal of Geovisualization and Spatial Analysis, 7(1), 13.
- Gunawansa, T. D., Perera, K., Apan, A., & Hettiarachchi, N. K. (2024). Identifying human elephant conflict hotspots through satellite remote sensing and GIS to support conflict mitigation. Remote Sensing Applications: Society and Environment, 35, 101261.
- Sharma, S., Beslity, J. O., Rustad, L., Shelby, L. J., Manos, P. T., Khanal, P., ... & Khanal, C. (2024). Remote Sensing and GIS in Natural Resource Management: Comparing tools and emphasizing the importance of in-situ data. Remote Sensing, 16(22), 4161.
- Mangewa, L. J., Ndakidemi, P. A., Alward, R. D., Kija, H. K., Nasolwa, E. R., & Munishi, L. K. (2024). Land Use/Cover Classification of Large Conservation Areas Using a Ground-Linked High-Resolution Unmanned Aerial Vehicle. Resources, 13(8), 113.
- Wang, T., Mei, X., Thomasson, J. A., Yang, C., Han, X., Yadav, P. K., & Shi, Y. (2022). GIS-based volunteer cotton habitat prediction and plant-level detection with UAV remote sensing. Computers and Electronics in Agriculture, 193, 106629.
- Lv, J., Liu, Y., Jin, R., & Zhu, W. (2025). Forested Swamp Classification Based on Multi-Source Remote Sensing Data: A Case Study of Changbai Mountain Ecological Function Protection Area. Forests, 16(5), 794.
- Nguyen, A., Kovyazin, V., & Pham, C. (2025). Application of Remote Sensing and GIS in Monitoring Forest Cover Changes in Vietnam Based on Natural Zoning. Land, 14(5), 1037.
Figure 1.
Illustration of Proposed SS-EU-Net Model Framework.
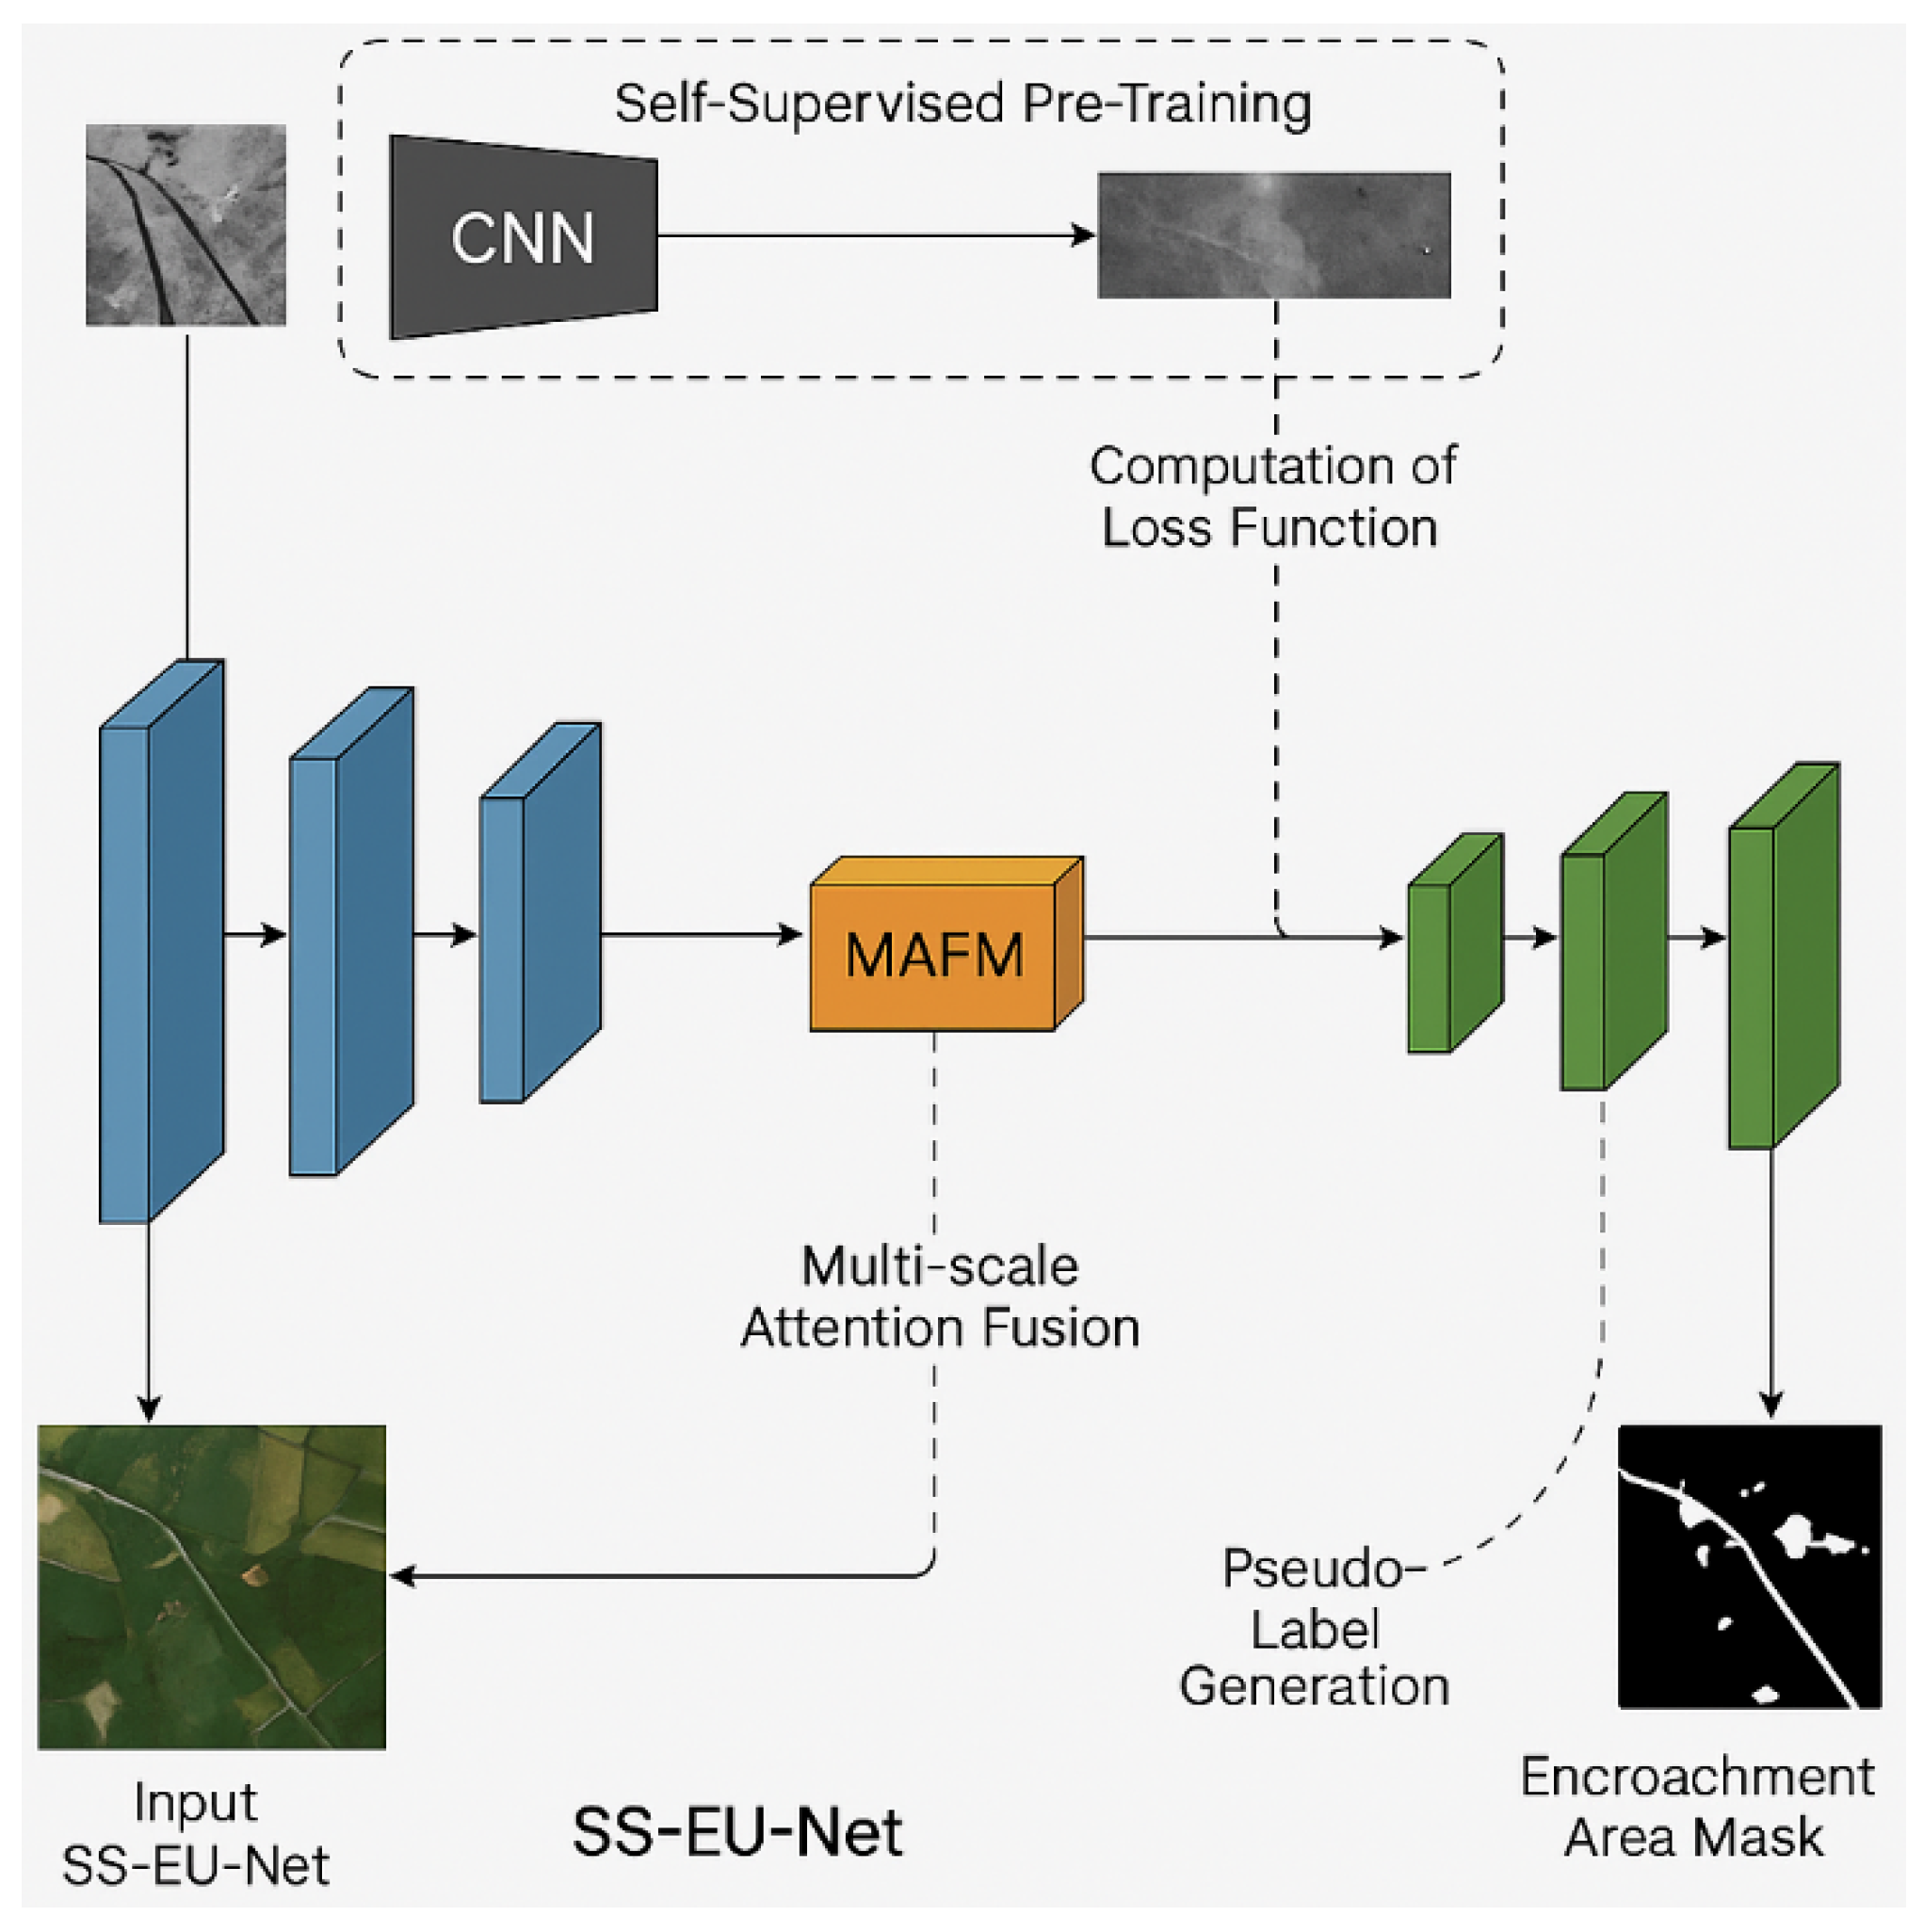

Table 1.
Matthews Correlation Coefficient Comparison.
| Cloud Cover (%) | U-Net | Mean Teacher | DeepLabV3+ | FixMatch | SS-EU-Net |
| 10 | 0.78 | 0.8 | 0.79 | 0.82 | 0.85 |
| 20 | 0.74 | 0.77 | 0.76 | 0.79 | 0.82 |
| 30 | 0.69 | 0.73 | 0.71 | 0.75 | 0.78 |
| 40 | 0.64 | 0.68 | 0.66 | 0.7 | 0.74 |
Disclaimer/Publisher’s Note: The statements, opinions and data contained in all publications are solely those of the individual author(s) and contributor(s) and not of MDPI and/or the editor(s). MDPI and/or the editor(s) disclaim responsibility for any injury to people or property resulting from any ideas, methods, instructions or products referred to in the content. |
© 2025 by the authors. Licensee MDPI, Basel, Switzerland. This article is an open access article distributed under the terms and conditions of the Creative Commons Attribution (CC BY) license (http://creativecommons.org/licenses/by/4.0/).
Copyright: This open access article is published under a Creative Commons CC BY 4.0 license, which permit the free download, distribution, and reuse, provided that the author and preprint are cited in any reuse.


