
Submitted:
17 June 2025
Posted:
19 June 2025
You are already at the latest version
Abstract
Respiratory diseases present significant global health challenges. Recent advances in respiratory sound analysis (RSA) have shown great potential for automated disease diagnosis and patient management. The International Conference on Biomedical and Health Informatics 2017 (ICBHI2017) database stands as one of the most authoritative open-access RSA datasets. This review systematically examines 135 technical publications utilizing the database, and a comprehensive and timely summary of RSA methodologies is offered for researchers and practitioners in this field. Specifically, the review covers signal processing techniques including data resampling, augmentation, normalization, and filtering; feature extraction approaches spanning time-domain, frequency-domain, joint time–frequency analysis, and deep feature representation from pre-trained models; and classification methods for adventitious sound (AS) categorization and pathological state (PS) recognition. Current achievements for AS and PS classification are summarized across studies using official and custom data splits. Despite promising technique advancements, several challenges remain unresolved. These include severe class imbalance in the dataset, limited exploration of advanced data augmentation techniques and foundation models, lack of model interpretability, and insufficient generalization studies across clinical settings. Future directions involve multi-modal data fusion, development of standardized processing workflows, interpretable artificial intelligence, and integration with broader clinical data sources to enhance diagnostic performance and clinical applicability.
Keywords:
respiratory sound analysis
; the ICBHI2017 database
; machine learning
; deep learning
; abnormal sound categorization
; pathological state recognition
1. Introduction
Respiratory diseases, including asthma, chronic obstructive pulmonary disease (COPD), lung cancer, and tuberculosis, are among the leading causes of death globally [1]. The burden of these diseases has been exacerbated by the coronavirus disease 2019, particularly in developing regions with limited access to healthcare services [2].
Respiratory sounds play a critical role in the respiratory and related disease analysis. These sounds are generated by vibrations in the airways and provide valuable information about airway conditions and lung function. Abnormal sounds, such as wheezes, crackles, and stridor, can signal the presence of specific pathological conditions. Moreover, the acquisition of respiratory sounds is noninvasive and cost-effective and thereby, they are especially useful in resource-limited settings. By capturing these acoustic signals, clinicians can assess disease severity, monitor progression in real-time, enable early detection, and evaluate treatment efficacy [3].
1.1. Review Studies on Respiratory Sound Analysis
To ensure reliable diagnosis of respiratory diseases, the development of objective RSA techniques has gained increasing attention. Several studies [4,5,6,7,8] have reviewed the advancements in this field (Table 1). Most studies focus on the application of machine learning (ML), deep learning (DL), and transfer learning (TL) techniques in signal processing (SP), feature extraction (FE), and the classification of AS or PS on the ICBHI2017 database.
However, RSA techniques have rapidly evolved alongside the artificial intelligence (AI) advancements, with notable progress in DL in recent years. To address this gap, the current study focuses on the ICBHI2017 database and examines SP, FE, ML, DL, and TL techniques with the goal to provide a comprehensive review on AS and PS classification, expanding the understanding of signal analysis techniques in related tasks.
1.2. The ICBHI2017 Database
Open-source databases are valuable for algorithm development, performance evaluation, and disease understanding. Table 2 presents details of open-source respiratory sound databases containing 1,000 or more acoustic segments. It shows the number of acoustic segments (), the classification problems () along with the maximum number of categories (), and supplementary information () regarding patient cases.
A comprehensive review of RSA techniques using the ICBHI2017 database [14] is timely and valuable for researchers and engineers who are interested in advancing this field. The ICBHI2017 database contains 6,898 segments from 126 subjects, aging from children to elderly individuals. The recordings were captured using various auscultation devices at multiple sites, with durations from 10 to 90 seconds. The acoustic segments are annotated and cross-reviewed by multiple experts. Demographic features are also provided for model training, subgroup analysis, and clinical modeling. In contrast, the HF_Lung_V2 database [13] consists of samples affected by issues such as missing annotations and subjective discrepancies. The SPRSound database [10] is limited to pediatric populations, and the HF_Tracheal_V1 database [12] involves anesthetized patients, both of which impede the generalization potential. In terms of classification, most studies focus on AS categorization [9,10,11,12,13], and only attention from [14] is additionally paid to PS recognition.
1.3. Literature Retrieval and Review on the ICBHI2017 Database
The keyword “ICBHI 2017” was searched using Google Scholar (accessed on May 5, 2025), and the database [14] has been used 517 times. Excluding non-English papers, books, editorials, review articles, dissertations, and other irrelevant literature, 135 technique papers remained. Figure 1 shows the RSA techniques reviewed in this study. The topics include signal processing, feature extraction, and sound classification, and detailed techniques are investigated and summarized under each topic.
2. Signal Processing
To ensure the consistency, the data should undergo resampling, normalization, and filtering, with the purpose to prepare each segment in subsequent processing. Because of class imbalance, data augmentation is introduced.
2.1. Signal Resampling
Signal resampling is applied to standardize the sampling rate, ensuring consistency across diverse data sources. Lower sampling rates improve computational and storage efficiency, whereas higher sampling rates preserve more detailed signal characteristics. Table 3 presents the resampling frequencies used in the literature, along with the corresponding references and the total number (#) of studies.
The resampling frequencies range from 1,000 Hz to 44,100 Hz, and 4,000 Hz is the most widely used in 38 studies. Different sampling rates are chosen to varying task requirements and signal characteristics. Selecting an appropriate sampling rate requires balancing signal fidelity, computational efficiency, and model training performance.
2.2. Data Augmentation
Class imbalance is present in the ICBHI2017 database, and 5,641 out of 6,898 respiratory cycles (81.8%) belong to the COPD category. It makes data augmentation essential for reducing the risk of overfitting and improving the model robustness [84]. To address this issue, standard data augmentation techniques are used.
Time stretching involves stretching or compressing the duration of the signal without changing its pitch. It benefits feature extraction by generating multi-scale samples of the original signal. The operation of time stretching is formulated as in Eq. 1,
where a is the stretching or compression coefficient.
Pitch shifting changes the pitch of the input signal without altering its duration. It enables the generation of signals with different pitches. The operation of time stretching can be formulated as in Eq. 2,
where denotes the pitch offset.
Adding noise involves inducing noise into the training samples. It helps the simulation of background interference in real-world environments or under noisy conditions [85]. The operation of adding noise can be formulated as in Eq. 3,
where stands for the adding noise.
Speed transformation simulates different breathing frequencies and rhythms by changing the playback speed of the signals with varying factors. It helps reduce the risk of overfitting [86]. The speed transformation operation can be formulated as in Eq. 4,
where b is the speed transformation coefficient.
Time shifting involves shifting the signal along the time axis either forward or backward. It simulates different starting points or variations in breathing. This technique increases the diversity of the signals that helps a model better adapt to different breathing rhythms and temporal changes [86]. Eq. 5 shows the operation of time shifting,
where denotes a time shift.
Dynamic range compression reduces the parts of the signal with large volume variations. It makes the overall volume more balanced with reduced impact of background noise, thereby highlighting the details of the respiratory sounds [87]. The operation of dynamic range compression can be formulated as in Eq. 6,
where represents the signal symbol.
Frequency masking works by masking a given frequency interval. It operates by masking a specified time interval to simulate signal loss or noise interference that may occur in real-world scenarios [88]. Two masking techniques help the model handle real-world challenges such as noise, signal loss or missing. The operation of frequency masking in the frequency domain can be formulated as in Eq. 7,
where is the starting frequency index of the mask, and is the width of the mask (number of frequency channels). The other operation of frequency masking in the time domain is shown in Eq. 8,
where is the starting time index of the mask, and is the width of the mask or the number of time steps.
Table 4 summarizes the applications of standard data augmentation techniques used on the ICBHI2017 database. It is found that time stretching, adding noise, and pitch shifting are widely applied, followed by time shifting and speed transformation.
Time stretching, adding noise, and pitch shifting are widely used as standard data augmentation techniques for alleviating the class imbalance issue. Several other techniques have also been proven effective. The variance time-length product method applies a random envelope factor to each recording and maps signal frequencies to new ones [103]. This technique has been used in [38,73,92,94,104,105]. The mix-up method enhances data diversity by linearly interpolating between two random samples to generate a new one [106] which has been broadly adopted in respiratory sound processing [28,62,66]. In addition, strategies such as intelligent padding and random sampling [26], slicing and feature fusion [107], patch random selection with positional encoding [70], and the use of the Griffin–Lim algorithm [108] have demonstrated benefits for augmenting respiratory sound data.
2.3. Signal Normalization
Signal normalization includes both duration normalization and amplitude normalization. The former aligns signals of varying lengths to a consistent time scale, while the latter scales the signal amplitudes to a uniform range. Both steps aim to ensure the comparability of respiratory signals across different samples.
2.3.1. Duration Normalization
Duration normalization involves adjusting the length of respiratory sound recordings to a fixed duration. This process eliminates the variability caused by signal lengths and ensures that all samples can be compared on the same temporal scale. Common standardization methods include cropping and padding [15,19,20,23,37,40,44,48,49,50,51,59,62,66,70,74,77,80,95,99,100,101,109,110,111,112,113]. The cropping method is used to truncate signals that exceed the target duration, while padding adds silent sections (typically zeros) to shorter signals to extend them to the desired length. These procedures enable consistent comparison and analysis within a unified time window, preserving the temporal structure needed for downstream processing and model training.
2.3.2. Amplitude Normalization
The purpose of amplitude normalization is to map the signals’ amplitudes to a uniform range for eliminating variability caused by amplitudes across signals. One widely used normalization method is to scale the amplitude of the signal proportionally to a specified range [5,15,27,29,35,44,45,53,58,59,62,64,68,72,78,94,96,110,114].
Another method is root mean square (RMS) normalization [97], which adjusts the signal’s RMS value to standardize the amplitude for enhancing the comparability of the signals across different environments. Eq. Section 2.3.2 formulates the operation,
in which x is the input vector, d is the dimension of the vector, and is a trainable parameter vector initialized randomly and optimized during the training process. The operator ⊙ denotes element-wise multiplication.
The min-max normalization [50,115,116,117] maps the signal values to [0, 1]. It preserves the relative proportionality of the data through linear transformation. This technique enhances data consistency and maintains relative structure of signal features. Eq. 10 shows the normalization procedure,
in which and correspond to the minimum value and the maximum value of all samples in the dataset.
In addition, z-score normalization [31,55] converts the signals into a form with zero mean and unit standard deviation. It reduces the differences in the scale and improves data consistency and model performance. Eq. 11 shows the operation of z-score normalization,
where and correspond to the mean and the standard deviation of a signal x.
2.4. Signal Filtering
Due to different environmental conditions, the raw respiratory signals may contain noise and irrelevant information, and signal filtering or denoising becomes crucial with the purpose to filter out noise and irrelevant components, and therefore, features related to respiratory activity can be highlighted to provide reliable subsequent analysis.
2.4.1. Environmental Noise Suppression
Environmental noise suppression uses filtering techniques to eliminate or reduce external environmental noise interference for extracting a clear target signals. It implements high-pass filters [69,95], which can effectively remove low-frequency noise. Typical high-pass filter designs include Finite Impulse Response filters [18,101,110], Butterworth filters [53,80], and Bessel filters [65]. These filters preserve signal waveform characteristics and provide proper phase responses for signal processing outcome.
2.4.2. Heart Sound Interference Removal
Heart sound interference removal aims to eliminate heart sound components that overlap with respiratory sounds. Common methods include the use of band-pass filters [15,19,21,22,30,58]. They retain the target signal by selecting specific frequency bands and suppress heart sound interference. Among band-pass filters, the Butterworth filter is one of the most used designs [17,23,26,34,38,42,44,45,49,52,55,56,57,60,64,114,117,118], and smooth frequency response characteristics allow for effective attenuation of unwanted frequency bands [119]. Additionally, anti-aliasing low-pass filters [120] can remove high-frequency noise and ensure minimal impact on the target signal. Another common signal smoothing method is the Savitzky-Golay filter [121]. It improves signal-to-noise ratio by removing noise without compromising the overall morphology of the signals [122].
3. Feature Extraction of Respiratory Signals
Feature extraction is a core step for identifying different types of respiratory signals. The techniques could be categorized into feature extraction in domains, including time domain, frequency domain and time-frequency domain, feature extraction from non-linear time series, and feature extraction using pre-trained deep learning networks. These methods capture the multi-dimensional cues of respiratory signals and provide important features for subsequent classification tasks by using machine learning-based or hybrid learning-based approaches.
3.1. Feature Extraction in Domains
3.1.1. Feature Extraction in the Time Domain
In the time domain, features are extracted to embed the temporal characteristics and dynamic changes of signals. Statistical features, such as mean, variance, maximum, and minimum values, provide the energy levels and the range of variations to understand the overall behavior of the signals [123].
Shannon entropy performs as a measure of signal uncertainty, randomness, or complexity that reflects the distribution characteristics of information within the signal. It is an effective, quantitative basis for signal analysis [123]. Eq. 12 shows the computing of Shannon entropy,
where denotes the entropy of random variable x, and presents the probability of the occurrence of the i-th event.
Zero-crossing rate (ZCR) refers to the number of times a signal crosses the zero axis. It provides a quantitative measure of the signal`s periodicity. It is helpful in analyzing the periodicity and noise characteristics of audio signals. It is formulated as in Eq. 13,
where is the signal value at the i-th sample point, and sign() represents the sign function.
The methods for extracting time-domain features of respiratory signals on the ICBHI2017 database are shown in Table 5. It is found that statistical features are preferred in time-domain-based feature extraction, and ZCR and Shannon entropy are also widely used.
3.1.2. Feature Extraction in the Frequency Domain
In the frequency domain, the frequency distribution and energy characteristics of signals are explored. As one of the core methods, Fourier Transform (FT) decomposes the time-domain signal into sine wave components of different frequencies, and the spectral representations of the signal are obtained. The discrete FT is shown in Eq. 14,
where denotes the angular frequency, and is the value of the n-th sampling point.
Spectral features, such as spectral centroid, spectral bandwidth, and spectral flatness, provide a straightforward reflection of the frequency structure of the signal by analyzing the energy distribution statistically in the spectrum. Due to their simple computation and ease of implementation, spectral features perform as a benchmark for an initial description and comparison of frequency-domain characteristics of signals [128].
Power spectral density analysis is to describe the energy distribution of signals across different frequencies. By performing FT or auto-correlation analysis, the power spectral density can be estimated to quantify the characteristics of power distribution to the frequency components.
In the ICBHI2017 database, the methods for frequency-domain feature extraction are shown in Table 6. The spectral features are relatively higher preferred, followed by FT features and power spectral density analysis.
3.1.3. Feature Extraction in the Time-Frequency Domain
Feature extraction in the time-frequency domain explores to perceive the temporal variations and frequency distribution characteristics of signals simultaneously. Mel-Frequency Cepstral Coefficients (MFCCs) mimic the auditory characteristics and converts the spectrum into cepstral coefficients on the Mel scale to capture the timbral features. The computing of MFCCs can be decribed as in Eq. 15,
where K represents the number of Mel filter bank bands, denotes the energy of the k-th Mel frequency band, and refers to the discrete cosine transform.
Short-Time Fourier Transform (STFT) slides a window function along the time axis, performs Fourier transform on the signal within each window, and obtains the time-frequency representation of the signal. It can be formulated as in Eq. 16,
where is the original signal, and is the window function.
Spectrogram is a visual tool to present the frequency distribution of a signal intuitively. After applying the FT on the signal, it arranges the spectrum of each moment in chronological order, and the energy intensity of each frequency component is visualized by using different color or grayscale levels. Subsequently, the frequency structure of the signal and its dynamic changes over time are uncovered [129].
Mel spectrogram further maps the frequency axis to the Mel scale, and the non-linear frequency perception can be better simulated [131]. The logarithmic Mel spectrogram extracts the spectrum of the signal through STFT, adjusts the spectrum using Mel filters to align with human auditory perception, and enhances the distinguishability of weak signals through logarithmic transformation.
Wavelet Transform (WT) performs multi-scale signals analysis through the dilation and translation of wavelet functions. It can offer high time and frequency resolution for non-stationary signal analysis [132]. The operation of WT can be formulated as in Eq. 17,
where is the original signal, denotes the mother wavelet function, s is the scale parameter, and is the translation parameter.
Gammatonegram utilizes a Gammatone filter bank to decompose the signal for extracting the energy distribution of each frequency channel, and it can visually present the time-frequency dynamics of the signal.
The constant-Q transform uses a logarithmic scale for frequency resolution for providing higher frequency resolution at low frequencies and better time resolution at high frequencies. It is suitable for the analysis of complex frequency components in respiratory signals [133].
As shown in Table 7, on the ICBHI2017 database, the respiratory signal analysis in the joint time-frequency domain includes various types of signal transformation for informative feature extraction. STFT is preferred among the methods, followed by Mel Spectrograms, MFCCs, and WT-based features.
3.2. Feature Extraction from Pre-Trained Deep Neural Networks
Deep convolutional neural networks (CNNs) have demonstrated powerful capacities in hierarchical abstract feature representation in a broad range of applications, and a number of pre-trained deep networks have been used in the feature extraction of respiratory signals. Through specific convolutional kernels, SincNet extracts features for respiratory signal representation [77]. Fraiwan combine both 1D-CNN and Bi-directional long short term memory (Bi-LSTM) models for temporal modeling in which 1D-CNN is to capture the local description and Bi-LSTM is for obtaining the bidirectional temporal dependencies [31]. Meanwhile, EasyNet [50] and parallel autoencoders [40] extract low-dimensional features through unsupervised learning that uncover the latent structure of respiratory signals. Self-attention mechanisms used in Densely connected networks [140], Audio Spectrogram Transformer (AST) [141] and novel networks emphasize key information that excel at capturing long-range dependencies [105]. In addition, combination of conditional Gaussian capsule networks with cubic encoders enhances respiratory signal representation learning, sincew dynamic routing and multi-dimensional mapping are embedded [54].
4. Learning-Based Respiratory Sound Classification
Despite to signal processing and feature extraction, respiratory signal classification methods have been evolved from machine learning, deep learning to hybrid learning, and the training strategies involves supervised learning, self-supervised learning, contrastive learning, and transfer learning.
4.1. Performance Evaluation Metrics
For four-class prediction, assuming , , , and respectively denote the number of correctly predicted samples for the classes of “normal,” “crackle,” “wheeze,” and “both” (i.e., samples exhibiting both crackle and wheeze), and , , , and stand for the number of samples in each respective class.
In the Challenge on the ICBHI2017 database, the metric specificity (SPE) measures the capacity of a model to identify healthy samples correctly, which is formulated as in Eq. 18,
The second metric sensitivity (SEN) measures the model’s ability to correctly identify pathological samples. It is computed as in Eq. 19,
Accuracy (ACC) estimates the overall classification correctness of the model, and its formula is shown in Eq. 20,
The Challenge also provides an ICBHI score (HS) that considers both specificity and sensitivity to evaluate the overall performance as shown in Eq. 21,
4.2. Machine Learning-Based Respiratory Sound Classification
After features are handcrafted, machine learning-based respiratory signal classification typically relies on the selection and training of machine learning classifiers. Constrained by domain knowledge and classifier exploration, the performance remains unsatisfactory, and several works are shown in Table 8 where # stands for the number of classes. Widely used ML classifiers include support vector machine (SVM), hidden Markov model (HMM), Gaussian mixture module (GMM), and tree models (such as RUSBoost tree and random forest), and k-fold cross-validation (k-FCV) is widely used for random data splitting.
4.3. Deep Learning-Based Respiratory Sound Classification
Deep learning has updated the performance in massive applications. In the field of respiratory signal classification, CNN, RNN (recurrent neural network) and their variants have become the mainstream methods that learn feature representation and signal classification in an end-to-end manner.
CNN learns representative features through convolutional and pooling layers. It is particularly suitable for processing spectrograms or time-frequency representations of respiratory sounds. Table 9 shows the performance of CNN-related models for respiratory signal classification. Except for novel design of CNN architectures and different splitting ratios, ResNet [144] and VGG [145] are the most widely applied models in binary, ternary and multi-class prediction [23,26,36,45,93,94,118]. Meanwhile, promising results have been obtained in binary classification ([93] with ACC and HS both ≥ 95.00%) and ternary classification ([115] with all metrics ≥ 98.00%), while there is room for further improvement in four-class prediction (the highest HS value ≤ 80.00%). Even though with the attention mechanism, the studies remain insufficient on six-class and eight-class prediction.
RNN and its variants, such as gated recurrent unit (GRU), are well-suited for processing sequential signals and temporal characteristics. Table 10 shows the results when using RNN and its variants on the database. Notably, LSTM and Bi-LSTM are widely used, and high ACC values are obtained on binary, six-class and eight-class prediction tasks.
4.4. Hybrid Learning-Based Respiratory Sound Classification
The hybrid models combine the feature extraction capability of CNN and the temporal modeling ability of RNN that enhance the classification performance. Table 11 shows these hybrid models in respiratory signal classification. The results are promising on binary classification (ACC ≥ 94.00%), on ternary classification (ACC ≥ 90.00%), on six-class prediction (metrics ≥ 96.00%), and on eight-class prediction (ACC ≥ 86.00%).
4.5. Transformer-Based Respiratory Sound Classification
The Transformer leverages self-attention into capturing the global temporal features of respiratory rhythms. By incorporating positional encoding, it can preserve respiratory phase information that enhances the identification of long-range dependencies and improves the classification accuracy of abnormal breath sounds. The Transformer-based respiratory signal classification on the database is shown in Table 12. Vision Transformer (ViT) [147] and AST are preferred on four-class prediction, and there is sufficient room for further improvement on the classification performance (HS ≤ 70.00%).
5. Current Achievement on the Respiratory Sound Classification
The ultimate goal of respiratory signal processing, feature extraction, machine learning, and deep learning is for accurate classification. The ICBHI2017 database supports both AS categorization and PS recognition tasks. The former categorizes respiratory signals into “normal”, “crackle”, “wheeze”, and “both crackle and wheeze” groups. The latter is to distinguish between “healthy” and “unhealthy” cases which can be further refined by subdividing the unhealthy category into more specific diagnostic groups.
5.1. Performance on AS Categorization
The database includes 3,642 normal segments (52.8% samples), 1,864 crackle segments, 886 wheeze segments, and 506 segments (7.3% samples) containing both crackle and wheeze. According to the literature, there are two groups of approaches for AS categorization based on the data splitting. One group uses the official split, where the training and testing sets are predefined and fixed. The other group involves custom splits, where researchers design their own data partitions with varying ratios for training, validation, and testing.
5.1.1. Performance on AS Classification When Using Official Data Split
Table 13 shows the classification performance, and the database is split into a training set (60% samples) and a testing set (40% samples) with officially fixed cases. The highest metric values is highlighted in bold.
The highest SEN, SPE, and HS value is 48.40%, 82.06%, and 63.54%, respectively achieved by GTFA-Net [99], CycleGuardian [92], and CLAP [151]. Five models obtain HS ≥ 60.00% among the algorithms. Technically, GTFA-Net [99] develops group-wise time-frequency attention that segments Mel-spectrograms into different groups by frequency-dimension random masking, and then, the states of groups are extracted, weighted, and aggregated into global representation for AS classification. CycleGuardian [92] integrates multi-channel spectrograms, adopts time-grouped encoding, combines deep clustering with group-mixed contrastive learning, and group feature embedding and cluster-projection fusion are incorporated into a multi-objective optimization manner for improved performance and generalization. CLAP [151] designs contrastive learning and multi-modal fusion, and a pre-trained framework is employed to align respiratory sounds and textual metadata in a shared feature space. It can handle missing or unseen metadata, encode key variables and mitigate variability caused by different devices and recording positions.
5.1.2. Performance on AS Categorization When Using Custom Data Splits
Except for officially fixed data splitting as used in the Challenge, numerous algorithms use different kinds of splitting strategies, including k-FCV and different splitting ratios for training, validating and testing. The performance of AS categorization using wild data splitting is summarized in Table 14.
Table 14 shows the ResNet-based model [36] obtains the highest SEN (93.00%) and HS (88.00%) using 10-FCV, the SincNet-based model [77] achieves the best SPE (95.00%) and ACC (91.13%) when using 80% samples for model training, and several models [36,77,80] lead to the HS values larger than 80.00%, which is much higher than those top-ranking models that use officially data splitting strategy (Table 13). Notably, the ResNet-based model [36] combines fluid–structure interaction dynamics to simulate the coupled bronchial airflow and wall deformation and to enhance sound source modeling accuracy, and ResNet is integrated to incorporate channel-wise and frequency-band attention for multi-dimensional feature enhancement and final classification. The SincNet-based model [77] is a two-stage self-supervised contrastive learning framework. The first stage involves a waveform encoder to extract informative frequency components, and the encoder is pre-trained on a large-scale dataset to learn robust and generalizable audio representations. The second stage introduces a contrastive variational autoencoder that leverages latent variable modeling to address class imbalance.
5.2. Performance on PS Recognition
According to the number of pathological conditions considered, the PS recognition can be categorized into binary, ternary, and multi-class classification. Binary classification typically distinguishes between healthy and unhealthy states, providing a straightforward diagnostic decision. Ternary classification further divides the unhealthy category into two distinct pathological groups, enabling more refined differentiation of disease severity or type. Multi-class classification expands this approach by identifying multiple specific conditions, offering detailed diagnostic insights that can support targeted treatment planning and personalized healthcare.
5.2.1. Performance on PS Binary Classification
As for binary classification, the ICBHI2017 dataset contains 35 healthy cases (3.8% samples) and 885 unhealthy cases (96.2% samples). PS binary classification is particularly suitable for the preliminary screening phase of diseases. Table 15 shows the performance of different methods for this task on the dataset.
High performance is achieved on the PS binary classification task. MHSONN [137] achieves the highest SEN, ACC, and HS values, and the second-best SPE value, all of which are larger than 99.00%. It integrates time-frequency representation from Mel spectrograms, constant-Q Transform spectrograms, and Mel-frequency cepstral coefficients to capture both the frequency-domain dynamics and nonlinear characteristics, employs a self-organizing operational neural network via generative operational perceptrons, and utilizes a multi-head architecture to process multi-modal features in parallel for global state recolonization. A comparable model is the EasyNet model [50] that designs a streamlined hierarchical architecture with targeted parameters. In the architecture, the first stage captures fundamental frequency components, the second stage utilizes depth-wise separable convolutions to extract temporal features from high-frequency components, and average pooling is used to compress the feature space for PS classification.
5.2.2. Performance on PS Ternary Classification
In PS ternary classification, the unhealthy cases are further divided into the cases with chronic diseases or non-chronic diseases, which differ significantly in clinical treatment and management strategies. Specifically, the database contains 35 healthy cases (3.8% samples), 75 non-chronic cases (8.2% samples), and 810 chronic cases (88.0% samples). Table 16 shows the performance of PS ternary classification.
The CNN-VAE-based model [115] obtains the metric values all larger than 98.00%, and the CNN-LSTM-based model [89] performs closely. The CNN-VAE model [115] employs variational autoencoder to generate synthetic data samples, and a Kullback–Leibler divergence regularization term is introduced to constrain the latent variables following a standard normal distribution. It enables effective augmentation of minority class samples and improves the classification performance. The CNN-LSTM-based model [89] adopts a 1D-CNN architecture for feature extraction with various activation functions, and the features are fed into a LSTM for modeling the temporal dependencies, long-term dependencies, and dynamic variations within the signals for improved PS prediction. Notably, a 11-layered network built in [102] achieves the highest HS value. It leverages auditory perception, frequency energy distribution, and pitch contour statistics to enhance feature expressiveness, and introduces a delayed superposition augmentation method to enrich the data samples by overlapping time-shifted signals.
5.2.3. Performance on PS Multi-Class Classification
PS multi-class classification is much complex. The data cases are classified into COPD (793 cases, 86.2% samples), pneumonia (37 cases), healthy (35 cases), upper respiratory tract infection (23 cases), bronchiectasis (16 cases), bronchiolitis (13 cases), lower respiratory tract infection (2 cases), and asthma (1 case, 0.1% samples). This task requires the model to not only identify healthy individuals but also effectively differentiate between various disease types, providing detailed support for clinical diagnosis and promoting precision medicine. Table 17 summarizes the PS multi-class recognition task of different methods.
Several algorithms [31,60,153] achieve the metric values all larger than 98.00%. Notably, the study [60] proposes a hybrid-scale spectrogram generation method that decomposes the signals into different intrinsic mode functions and uses continuous WT for discriminative time-frequency signal representation. Besides, light-weight module, batch normalization, max pooling, and multi-chromatic data augmentation are embedded for accurate classification. The study [31] implements a hierarchical abstraction framework, and a Bi-LSTM-based bidirectional temporal gating mechanism is proposed to capture the pathological feature evolution in forward and backward directions within a respiratory cycle. The study [153] combines wavelet-based denoising and Mel-frequency cepstral coefficients for feature extraction, time-domain warping and noise injection are used for enhancing data diversity, synthetic samples are adaptively generated for the minority class, and 1D-CNN is constructed for progressive temporal feature abstraction, and PS multi-class prediction.
6. Discussion
After literature retrieval and screening, technical publications utilizing the ICBHI2017 database were systematically analyzed across three key aspects from signal processing, feature extraction, to sound classification. Specifically, respiratory sounds are resampled, augmented, normalized, and filtered to ensure consistency across different data sources. Quantitative features are often handcrafted in the time domain, frequency domain, and joint time-frequency domain. In addition, high-level features extracted from pre-trained deep networks have proven effective. Finally, the processed sounds are classified into various AS or PS categories, employing machine learning, deep learning, hybrid approaches, and other advanced learning strategies. While promising performance has been achieved on the ICBHI2017 database, there remains substantial room for RSA improvement.
6.1. The Problem of Class Imbalance
The sensitivity (SEN) value remains below 50.00% in AS classification when using the official data split (Table 13). This indicates that the models fail to correctly identify more than half of the true positive cases, which is a serious concern in medical diagnostics. Several factors contribute to this issue. First, class imbalance plays a significant role. Normal recordings (3,642 samples, 52.8%) are heavily overrepresented compared to the mixed category containing both crackle and wheeze sounds (506 samples, 7.3%). This imbalance can cause models to favor the majority class during training. Similar patterns of imbalance are also observed in related classification tasks, such as binary, ternary, and multi-class PS recognition. Second, overlapping acoustic features among crackles, wheezes, and mixed sounds complicate accurate classification, particularly when abnormalities are subtle or co-occurring. Differentiating between individual crackles or wheezes and their combination is especially difficult due to the shared intrinsic characteristics of these respiratory sounds. Third, suboptimal feature representation may limit a model’s ability to learn and distinguish fine-grained patterns. While handcrafted features, features extracted from pre-trained deep networks, and hierarchical representations learned via end-to-end training have all been explored, it remains unclear which types of features are most effective for respiratory sound classification. This uncertainty makes it challenging to select the most discriminative features from the vast feature space [154]. In conclusion, class imbalance not only induces model predictions toward the majority class but also leads to reduced sensitivity for minority classes and introduces learning bias, ultimately hindering model performance in critical clinical applications.
Advanced data augmentation methods can help address class imbalance by generating entirely new samples. In contrast, standard augmentation techniques manipulate existing samples to promote invariant feature learning, increase data diversity, and enhance robustness to noise and distortions (Table 4). A variety of generative models have been proposed in the literature. Variational Autoencoders (VAEs) learn to encode input data into a latent space and then, this representation is decoded to reconstruct the original data. By optimizing a variational lower bound, VAEs enable efficient approximate inference and generative modeling [15,115,156]. Generative Adversarial Networks (GANs) consist of a generator to synthesize realistic samples from random noise and a discriminator to distinguish real from generated data [157]. This adversarial setup enables to effectively learn complex data distributions [95,158] and to synthesize respiratory sounds for improved classification performance [159]. Diffusion probabilistic models generate new data by learning to reverse a gradual noising process that corrupts data over multiple steps. This involves a forward (diffusion) process and a reverse (generative) process applied iteratively [160]. One such model, DiffWave, has been used for both conditional and unconditional waveform generation [161], which has been applied to respiratory sound synthesis through adversarial fine-tuning at the Mel-spectrogram level [162,163]. Although these advanced generative models show promise, further investigation is needed to fully evaluate their effectiveness in mitigating class imbalance in the RSA field.
By comparing performance under official data splitting (Table 13) and custom data splitting strategies (Table 14), we observe that SEN values are significantly improved when custom partitioning is applied. This demonstrates that how the dataset is divided into training, validation, and testing sets has a substantial impact on prediction performance (see Table 15, Table 16, and Table 17). In scenarios with class imbalance, simple random splitting or standard k-FCV may fail to ensure fair and reliable algorithm comparisons [164]. Addressing this issue is therefore of critical importance. Several strategies can be adopted during data splitting to mitigate class imbalance. First, stratified splitting helps preserve class distributions across all subsets, which is especially beneficial for small or multi-class datasets. Second, balancing the dataset before splitting, by down-sampling majority classes or over-sampling minority classes, can ensure more equitable representation in each subset. Third, subject-wise splitting, such as group k-fold, helps prevent data leakage and enhances generalization by ensuring that all samples from a single subject appear in only one partition. Additionally, if synthetic data augmentation is used, it should be performed before splitting, and care should be taken to group augmented samples with their corresponding subjects. This avoids contaminating the test set and preserves the integrity of model evaluation. However, for specific tasks with class imbalance, the optimal application of these strategies remains unclear and warrants further investigation.
6.2. Feature Representation Learning
Features handcrafted in the time domain, the frequency domain, and the joint time-frequency domain are preferred (Table 5, Table 6, and Table 7), while in RSA techniques, features extracted from pre-trained deep networks are paid less attention to. To enhance the effectiveness and efficiency of deep features, more advanced foundation models could be explored, including but not limited to wav2vec [165], VGGish [166], AST [141], and masked modeling Duo [167]. These foundation models have been pre-trained with a sufficiently large and diverse audio dataset and also verified effective on sound analysis.
To improve the capacity of feature representation learning for respiratory sound signals, different learning strategies could be utilized. First, under the context of supervised learning, transfer learning implemented by fine-tuning a pre-trained models with a small number of labeled samples could leverage knowledge from a source task to improve the performance on a target task. Technically, a model is trained on a large dataset, such as ImageNet [168] or AudioSet [169], and then, the pre-trained model is fine-tuned on the ICBHI2017 database for AS or PS prediction [69,112,155]. Second, unsupervised learning is an emerging technique to discover patterns or structure from unlabeled data. It learns to group the data without explicit labels [67,77]. As a type of unsupervised learning category, self-supervised learning is massively applied for training foundation models. It learns useful representations by creating pretext tasks to generate pseudo-labels, and the model is then fine-tuned for downstream tasks [77]. Contrastive learning is considered a form of self-supervised learning which designs positive pairs and negative pairs, and a model is trained to distinguish between positive and negative pairs of samples [67,170].
Meanwhile, various learning paradigms could be employed for improving the performance of respiratory sound classification. First, hybrid learning combines multiple learning paradigms (e.g., supervised and unsupervised, or machine learning and deep learning methods) and uses complementary strengths of each paradigm to enhance robustness, accuracy or generalization. Second, multi-modal fusion learning exploits multiple sources or types of data (modalities), such as audio, images, or clinical metadata, to improve the performance of respiratory disease detection, classification, or diagnosis. The learning paradigms can be fused at feature-level by feeding different types of features into a neural network, decision-level by combining the outputs with weighted voting or averaging, or model-level by fusing modality-specific feature representations through attention mechanism or a shared latent space [148]. Third, multi-task learning integrates AS classification with PS prediction by training a single model to perform multiple tasks simultaneously. The tasks are trained together with shared layers and task-specific heads, enabling learning of generalized features [17,66,109]. For instance, Pham . . achieve high accuracy in both AS and PS classification tasks [66]. The well-trained model not only identifies abnormal sounds, but also determines the pathological state, providing clinicians with more accurate diagnostic information.
6.3. Limitations of the Current Review
Several limitations remain in the current study. First, severe class imbalance is a persistent challenge in the ICBHI2017 database. Although standard and advanced data augmentation methods have been proposed, their effectiveness remains inconclusive. Emerging approaches, such as self-supervised learning and federated learning, hold promise for addressing data scarcity and privacy constraints [171]. Thorough evaluation of these data augmentation strategies is essential to advance the understanding and applicability of such methods. Second, no experimental benchmarking has been performed to compare the performance of proposed classification algorithms through intra- and inter-database validation. A systematic and reproducible comparison of these techniques is highly encouraged for future work. Third, a standardized data processing pipeline is currently lacking, which hampers reproducibility and the design of fair experiments. The end-to-end RSA workflow, from signal processing to feature extraction and classification, requires consistent protocols and well-documented methodologies to support further research and industrial deployment. Fourth, while AI techniques, such as large audio and visual foundation models, have rapidly advanced in other fields, their adaptation to RSA remains underexplored. Respiratory sounds can be represented both as acoustic waveforms and Mel-spectrogram images, and large foundation models need to be tailored to accommodate these dual representations effectively. Fifth, advanced learning paradigms, including multi-modal fusion, hybrid learning, causal inference, domain adaptation, and large foundation models, offer potential solutions to the inherent limitations of relying solely on audio features for disease classification [172,173,174,175]. In addition to respiratory sounds, incorporating complementary signals, such as blood oxygen saturation and thoracic motion, can enrich the model’s contextual understanding [176]. Furthermore, interpretability remains a pressing challenge. Understanding the failure and success of RSA techniques is essential for algorithm refinement. Although interpretability is a common concern, it is especially important in clinical settings to build trust and support real-world deployment. Finally, the development of portable, cost-effective respiratory sound detection devices, when integrated with AI algorithms, can significantly improve access to respiratory disease screening, especially in primary care and remote settings-promoting broader global adoption.
7. Conclusion
In this study, we present a comprehensive review of respiratory sound analysis techniques based on the ICBHI2017 database, covering signal processing, feature extraction, and classification methods. A total of 135 relevant publications are systematically analyzed. Specifically, signal processing techniques include signal resampling, data augmentation, normalization, and filtering. Feature extraction approaches span the time domain, frequency domain, joint time–frequency domain, and the representations from pre-trained deep networks. Classification methods are categorized into machine learning, deep learning, hybrid approaches, and Transformer-based models. We summarize recent advancements in classifying respiratory sounds into four AS categories under both official and custom data-splitting strategies, as well as into binary, ternary, and multi-class PS categories. The issue of class imbalance is extensively discussed, along with strategies to mitigate its impact during data splitting and model training. Furthermore, we examine feature representation learning from various paradigms and learning strategies, and the limitations of the current review and open challenges in the field are also highlighted.
From the perspective of data sufficiency, the ICBHI2017 database remains one of the most authoritative open-source resources for respiratory sound analysis with high-quality annotation and standardized benchmarks. However, like many existing respiratory sound datasets, it suffers from severe class imbalance, which limits algorithmic development, hinders fair performance comparison, and challenges the evaluation of model generalization. To overcome these limitations, there is a critical need to develop larger and more diverse respiratory sound databases that encompass a wider range of disease types, age groups, and health conditions. Such efforts will strengthen model generalizability, enhance adaptability to real-world clinical variability, and facilitate more reliable deployment in practical healthcare settings.
From the perspective of technical evolution, future advancements in respiratory sound analysis are expected to focus on three key directions of efficiency, generalization, and clinical applicability. A shift toward multi-modal integration and scenario-driven modeling will become increasingly prominent. To overcome the challenges related to data scarcity and high annotation costs, self-supervised learning and generative models will be paid increasing attention to augmenting underrepresented classes of diseases. Federated learning will enable privacy-preserving, distributed model training across institutions, facilitating the integration of heterogeneous clinical data. Model architectures will be increasingly tailored to clinical requirements through the fusion of audio, physiological, and imaging modalities, enhancing diagnostic accuracy. Temporal modeling of respiratory sound sequences will support the prediction of disease progression, while interpretable frameworks will improve clinical transparency and trust. Ultimately, integrating respiratory sound analysis with omics data may pave the way toward personalized diagnostics and precision medicine.
Author Contributions
Conceptualization, S.Y., B.Z. and Q.S.; Data curation, J.Y. and L.C.; Formal analysis, X.L., Y.X. and Q.S.; Funding acquisition, X.L., Y.X. and Q.S.; Investigation, B.Z., Y.X. and Q.S.; Methodology, S.Y., J.Y., B.Z. and X.L.; Project administration, Q.S.; Software, S.Y., J.Y. and L.C.; Supervision, Q.S.; Validation, X.L. and Y.X.; Visualization, J.Y., L.C., and X.L.; Writing - original draft, J.Y. and S.Y.; Writing - review & editing, B.Z., X.L., Y.X. and Q.S. All authors have read and agreed to the published version of the manuscript.
Funding
The work was in part supported by National Key Research and Develop Program of China (Grant No. 2024YFF0907401, 2022ZD0115901, and 2022YFC2409000), National Natural Science Foundation of China (Grant No. 62177007, U20A20373, and 82202954), China-Central Eastern European Countries High Education Joint Education Project (Grant No. 202012), Application of Trusted Education Digital Identity in the Construction of Smart Campus in Vocational Colleges (Grant No. 2242000393), The Knowledge Blockchain Research Fund (Grant No. 500230), and Medium- and Long-term Technology Plan for Radio, Television and Online Audiovisual (Grant No. ZG23011). The funder had no role in the study design, data collection and analysis, decision to publish, or preparation of the manuscript.
Institutional Review Board Statement
Not applicable.
Informed Consent Statement
Not applicable.
Data Availability Statement
The dataset supporting the current study is available online (ICBHI 2017 Respiratory Sound Database, https://bhichallenge.med.auth.gr/ICBHI_2017_Challenge).
Conflicts of Interest
The authors declare no conflicts of interest. The funders had no role in the design of the study; in the collection, analyses, or interpretation of data; in the writing of the manuscript; or in the decision to publish the results.
Abbreviations
The following abbreviations are used in this manuscript:
| RSA | Respiratory Sound Analysis |
| ICBHI2017 | International Conference on Biomedical and Health Informatics 2017 |
| AS | Adventitious Sound |
| PS | Pathological State |
| COPD | Chronic Obstructive Pulmonary Disease |
| ML | Machine Learning |
| DL | Deep Learning |
| TL | Transfer Learning |
| SP | Signal Processing |
| FE | Feature Extraction |
| AI | Artificial Intelligence |
| RMS | Root Mean Square |
| ZCR | Zero-Crossing Rate |
| FT | Fourier Transform |
| MFCC | Mel-Frequency Cepstral Coefficient |
| STFT | Short-Time Fourier Transform |
| WT | Wavelet Transform |
| CNN | Convolutional Neural Network |
| Bi-LSTM | Bi-directional Long Short Term Memory |
| AST | Audio Spectrogram Transformer |
| SPE | Specificity |
| SEN | Sensitivity |
| ACC | Accuracy |
| HS | ICBHI Score |
| SVM | Support Vector Machine |
| HMM | Hidden Markov Model |
| GMM | Gaussian Mixture Module |
| k-FCV | k-Fold Cross Validation |
| GRU | Gated Recurrent Unit |
| ViT | Vision Transformer |
| VAE | Variational Autoencoder |
| GAN | Generative Adversarial Network |
References
- World Health Organization. World health statistics 2024: monitoring health for the SDGs, sustainable development goals. World Health Organization, 2024.
- Aveyard, Paul and Gao, Min and Lindson, Nicola and Hartmann-Boyce, Jamie and Watkinson, Peter and Young, Duncan and Coupland, Carol AC and San Tan, Pui and Clift, Ashley K and Harrison, David and Gould, Doug W and Pavord, Ian D and Hippisley-Cox, Julia. Association between pre-existing respiratory disease and its treatment, and severe COVID-19: a population cohort study. Lancet Respiratory Medicine 2021, 9, 909–923. [Google Scholar] [CrossRef] [PubMed]
- Xia, Tong and Han, Jing and Mascolo, Cecilia. Exploring machine learning for audio-based respiratory condition screening: A concise review of databases, methods, and open issues. Experimental Biology and Medicine 2022, 247, 2053–2061. [Google Scholar] [CrossRef] [PubMed]
- Huang, D.-M. , Huang, J., Qiao, K., Zhong, N.-S., Lu, H.-Z., and Wang, W.-J. Deep Learning-Based Lung Sound Analysis for Intelligent Stethoscope. Military Medical Research 2023, 10(1), 44. [Google Scholar] [CrossRef] [PubMed]
- Latifi, S. A., Ghassemian, H., and Imani, M. Feature Extraction and Classification of Respiratory Sound and Lung Diseases. In: International Conference on Pattern Recognition and Image Analysis (IPRIA), 2023, 1–6.
- Sfayyih, A. H. , Sulaiman, N., and Sabry, A. H. A Review on Lung Disease Recognition by Acoustic Signal Analysis with Deep Learning Networks. Journal of big Data 2023, 10(1), 101. [Google Scholar] [CrossRef]
- Zarandah, Q. M. M., Daud, S. M., and Abu-Naser, S. S. A Systematic Literature Review of Machine and Deep Learning-Based Detection and Classification Methods for Diseases Related to the Respiratory System. Artificial Intelligence in Medicine 2023, 15(4), 200–215.
- Kapetanidis, P., et al. Respiratory Diseases Diagnosis Using Audio Analysis and Artificial Intelligence: A Systematic Review. Sensors 2024, 24, 1173. [Google Scholar] [CrossRef]
- Altan, G. Altan, G., Kutlu, Y., Garbi, Y., Pekmezci, A. O., and Nural, S. Multimedia Respiratory Database (RespiratoryDatabase@TR): Auscultation Sounds and Chest X-rays. Natural and Engineering Sciences 2017, 2(3), 59–72.
- Zhang, Q. , et al. SPRSound: Open-Source SJTU Paediatric Respiratory Sound Database. IEEE Transactions on Biomedical Circuits and Systems 2022, 16(5), 867–881. [Google Scholar] [CrossRef]
- Hsu, F.-S., et al. Benchmarking of Eight Recurrent Neural Network Variants for Breath Phase and Adventitious Sound Detection on a Self-Developed Open-Access Lung Sound Database—HF_Lung_V1. PLoS ONE 2021, 16(7), e0254134.
- Hsu, F.-S. , et al. A Dual-Purpose Deep Learning Model for Auscultated Lung and Tracheal Sound Analysis Based on Mixed Set Training. Biomedical Signal Processing and Control 2023, 86, 105222. [Google Scholar] [CrossRef]
- Hsu, F.-S., et al. A Progressively Expanded Database for Automated Lung Sound Analysis: An Update. Applied Sciences 2022, 12(15), 7623.
- Rocha, B. M., et al. A Respiratory Sound Database for the Development of Automated Classification. Precision Medicine Powered by pHealth and Connected Health, N. Maglaveras, I. Chouvarda, and P. De Carvalho, Eds., IFMBE Proceedings, vol. 66. Singapore: Springer, 2018, 33–37.
- Zhang, M. , Li, M., Guo, L., and Liu, J. A Low-Cost AI-Empowered Stethoscope and a Lightweight Model for Detecting Cardiac and Respiratory Diseases From Lung and Heart Auscultation Sounds. Sensors 2023, 23(5), 2591. [Google Scholar] [CrossRef]
- Mondal, A. , Saxena, I., Tang, H., and Banerjee, P. A Noise Reduction Technique Based on Nonlinear Kernel Function for Heart Sound Analysis. IEEE Journal of Biomedical and Health Informatics 2018, 22(3), 775–784. [Google Scholar] [CrossRef]
- Chambres, G., Hanna, P., and Desainte-Catherine, M. Automatic Detection of Patient With Respiratory Diseases Using Lung Sound Analysis. 2018 International Conference on Content-Based Multimedia Indexing (CBMI), La Rochelle: IEEE, 2018, 1–6.
- Jakovljević, Nikša and Lončar-Turukalo, Tatjana. Hidden Markov Model Based Respiratory Sound Classification. In: Precision Medicine Powered by pHealth and Connected Health, N. Maglaveras, I. Chouvarda, and P. De Carvalho, Eds., IFMBE Proceedings, vol. 66. Singapore: Springer, 2018, 39–43.
- Demir, F. , Ismael, A. M., and Sengur, A. Classification of Lung Sounds With CNN Model Using Parallel Pooling Structure. IEEE Access 2020, 8, 105376–105383. [Google Scholar] [CrossRef]
- Minami, K., Lu, H., Kamiya, T., Mabu, S., and Kido, S. Automatic Classification of Respiratory Sounds Based on Convolutional Neural Network With Multi Images. 2020 5th International Conference on Biomedical Imaging, Signal Processing, Kitakyushu, Japan: ACM, 2020, 17–21.
- Rocha, B. M. , Pessoa, D., Marques, A., Carvalho, P., and Paiva, R. P. Automatic Classification of Adventitious Respiratory Sounds: A (Un)solved Problem? Sensors 2020, 21(1), 57. [Google Scholar] [CrossRef] [PubMed]
- Wu, L., and Li, L. Investigating into Segmentation Methods for Diagnosis of Respiratory Diseases Using Adventitious Respiratory Sounds. 2020 42nd Annual International Conference of the IEEE Engineering in Medicine & Biology Society (EMBC), Montreal, QC, Canada: IEEE, 2020, 768–771.
- Yang, Z., Liu, S., Song, M., Parada-Cabaleiro, E., and Schuller, B. W. Adventitious Respiratory Classification Using Attentive Residual Neural Networks. Interspeech 2020, ISCA, 2020, 2912–2916.
- Asatani, N. , Kamiya, T., Mabu, S., and Kido, S. Classification of Respiratory Sounds Using Improved Convolutional Recurrent Neural Network. Computers & Electrical Engineering 2021, 94, 107367. [Google Scholar]
- Asatani, N., Kamiya, T., Mabu, S., and Kido, S. Classification of Respiratory Sounds by Generated Image and Improved CRNN. 2021 21st International Conference on Control, Automation and Systems (ICCAS), Jeju, Korea, Republic of: IEEE, 2021, 1804–1808.
- Gairola, S., Tom, F., Kwatra, N., and Jain, M. RespireNet: A Deep Neural Network for Accurately Detecting Abnormal Lung Sounds in Limited Data Setting. 2021 43rd Annual International Conference of the IEEE Engineering in Medicine & Biology Society (EMBC), Mexico: IEEE, 2021, 527–530.
- Gupta, S. , Agrawal, M., and Deepak, D. Gammatonegram Based Triple Classification of Lung Sounds Using Deep Convolutional Neural Network With Transfer Learning. Biomedical Signal Processing and Control 2021, 70, 102947. [Google Scholar] [CrossRef]
- Pham, L., Phan, H., Schindler, A., King, R., Mertins, A., and McLoughlin, I. Inception-Based Network and Multi-Spectrogram Ensemble Applied to Predict Respiratory Anomalies and Lung Diseases. 2021 43rd Annual International Conference of the IEEE Engineering in Medicine & Biology Society (EMBC), Mexico: IEEE, 2021, 253–256.
- Romero Gomez, A. F., and Orjuela-Canon, A. D. Respiratory Sounds Classification Employing a Multi-Label Approach. 2021 IEEE Colombian Conference on Applications of Computational Intelligence (ColCACI), Cali, Colombia: IEEE, 2021, 1–5.
- Stasiakiewicz, P. , et al. Automatic Classification of Normal and Sick Patients With Crackles Using Wavelet Packet Decomposition and Support Vector Machine. Biomedical Signal Processing and Control 2021, 67, 102521. [Google Scholar] [CrossRef]
- Fraiwan, M., Fraiwan, L., Alkhodari, M., and Hassanin, O. Recognition of Pulmonary Diseases From Lung Sounds Using Convolutional Neural Networks and Long Short-Term Memory. Journal of Ambient Intelligence and Humanized Computing 2022, 13(10), 4759–4771.
- Liu, B., et al. Energy-Efficient Intelligent Pulmonary Auscultation for Post COVID-19 Era Wearable Monitoring Enabled by Two-Stage Hybrid Neural Network. 2022 IEEE International Symposium on Circuits and Systems (ISCAS), Austin, TX, USA: IEEE, 2022, 2220–2224.
- Petmezas, G., et al. Automated Lung Sound Classification Using a Hybrid CNN-LSTM Network and Focal Loss Function. Sensors 2022, 22(3), 1232.
- Ren, Z., Nguyen, T. T., and Nejdl, W. Prototype Learning for Interpretable Respiratory Sound Analysis. ICASSP 2022 - 2022 IEEE International Conference on Acoustics, Speech and Signal Processing (ICASSP), Singapore, Singapore: IEEE, 2022, 9087–9091.
- Tabata, M., Lu, H., Kamiya, T., Mabu, S., and Kido, S. Automatic Classification of Respiratory Sound Considering Hierarchical Structure. 2022 22nd International Conference on Control, Automation and Systems (ICCAS), Jeju, Korea, Republic of: IEEE, 2022, 537–541.
- Tong, F. , Liu, L., Xie, X., Hong, Q., and Li, L. Respiratory Sound Classification: From Fluid-Solid Coupling Analysis to Feature-Band Attention. IEEE Access 2022, 10, 22018–22031. [Google Scholar] [CrossRef]
- Mang, L. D. , Canadas-Quesada, F. J., Carabias-Orti, J. J., Combarro, E. F., and Ranilla, J. Cochleogram-Based Adventitious Sounds Classification Using Convolutional Neural Networks. Biomedical Signal Processing and Control 2023, 82, 104555. [Google Scholar] [CrossRef]
- Papadakis, C., Rocha, L. M. G., Catthoor, F., Helleputte, N. V., and Biswas, D. AusculNET: A Deep Learning Framework for Adventitious Lung Sounds Classification. 2023 30th IEEE International Conference on Electronics, Circuits and Systems (ICECS), Istanbul, Turkiye: IEEE, 2023, 1–4.
- Crisdayanti, I. A. P. A. , Nam, S. W., Jung, S. K., and Kim, S.-E. Attention Feature Fusion Network via Knowledge Propagation for Automated Respiratory Sound Classification. IEEE Open Journal of Engineering in Medicine and Biology 2024, 5, 383–392. [Google Scholar] [CrossRef]
- Khan, R. , Khan, S. U., Saeed, U., and Koo, I.-S. Auscultation-Based Pulmonary Disease Detection Through Parallel Transformation and Deep Learning. Bioengineering 2024, 11(6), 586. [Google Scholar] [CrossRef]
- Roy, A. , Satija, U., and Karmakar, S. Pulmo-TS2ONN: A Novel Triple Scale Self Operational Neural Network for Pulmonary Disorder Detection Using Respiratory Sounds. IEEE Transactions on Instrumentation and Measurement 2024, 73, 1–12. [Google Scholar]
- Ren, Z., Nguyen, T. T., Zahed, M. M., and Nejdl, W. Self-Explaining Neural Networks for Respiratory Sound Classification With Scale-Free Interpretability. 2023 International Joint Conference on Neural Networks (IJCNN), Gold Coast, Australia: IEEE, 2023, 1–7.
- Shi, L., Zhang, Y., and Zhang, J. Lung Sound Recognition Method Based on Wavelet Feature Enhancement and Time-Frequency Synchronous Modeling. IEEE Journal of Biomedical and Health Informatics 2023, 27(1), 308–318.
- Sun, W., Zhang, F., Sun, P., Hu, Q., Wang, J., and Zhang, M. Respiratory Sound Classification Based on Swin Transformer. 2023 8th International Conference on Signal and Image Processing (ICSIP), Wuxi, China: IEEE, 2023, 511–515.
- Wang, F., Yuan, X., and Meng, B. Classification of Abnormal Lung Sounds Using Deep Learning. 2023 8th International Conference on Signal and Image Processing (ICSIP), Wuxi, China: IEEE, 2023, 506–510.
- Wu, C., Huang, D., Tao, X., Qiao, K., Lu, H., and Wang, W. Intelligent Stethoscope Using Full Self-Attention Mechanism for Abnormal Respiratory Sound Recognition. 2023 IEEE EMBS International Conference on Biomedical and Health Informatics (BHI), Pittsburgh, PA, USA: IEEE, 2023, 1–4.
- Cansiz, B. , Kilinc, C. U., and Serbes, G. Tunable Q-Factor Wavelet Transform Based Lung Signal Decomposition and Statistical Feature Extraction for Effective Lung Disease Classification. Computers in Biology and Medicine 2024, 178, 108698. [Google Scholar] [CrossRef]
- Constantinescu, C. , Brad, R., and Bărglăzan, A. Lung Sounds Anomaly Detection With Respiratory Cycle Segmentation. BRAIN. Broad Research in Artificial Intelligence and Neuroscience 2024, 15(3), 188. [Google Scholar] [CrossRef]
- Dexuan, Q., Ye, Y., Haiwen, Z., Wenjuan, W., and Shijie, G. Classification of Respiratory Sounds Into Crackles and Noncrackles Categories via Convolutional Neural Networks. 2024 IEEE International Conference on Mechatronics and Automation (ICMA), Tianjin, China: IEEE, 2024, 800–805.
- Hassan, U. , Singhal, A., and Chaudhary, P. Lung Disease Detection Using EasyNet. Biomedical Signal Processing and Control 2024, 91, 105944. [Google Scholar] [CrossRef]
- Song, W., Han, J., Deng, S., Zheng, T., Zheng, G., and He, Y. Joint Energy-Based Model for Semi-Supervised Respiratory Sound Classification: A Method of Insensitive to Distribution Mismatch. IEEE Journal of Biomedical and Health Informatics 2024, 1–11.
- Wang, F. , Yuan, X., Bao, J., Lam, C.-T., Huang, G., and Chen, H. OFGST-Swin: Swin Transformer Utilizing Overlap Fusion-Based Generalized S-Transform for Respiratory Cycle Classification. IEEE Transactions on Instrumentation and Measurement 2024, 73, 1–13. [Google Scholar]
- Wu, C. , Ye, N., and Jiang, J. Classification and Recognition of Lung Sounds Based on Improved Bi-ResNet Model. IEEE Access 2024, 12, 73079–73094. [Google Scholar] [CrossRef]
- Zhang, Y. , Zhang, J., and Shi, L. Open-Set Lung Sound Recognition Model Based on Conditional Gaussian Capsule Network and Variational Time-Frequency Feature Reconstruction. Biomedical Signal Processing and Control 2024, 87, 105470. [Google Scholar] [CrossRef]
- Faustino, P., Oliveira, J., and Coimbra, M. Crackle and Wheeze Detection in Lung Sound Signals Using Convolutional Neural Networks. 2021 43rd Annual International Conference of the IEEE Engineering in Medicine & Biology Society (EMBC), Mexico: IEEE, 2021, 345–348.
- Shokouhmand, S., Rahman, M. M., Faezipour, M., and Bhatt, S. Abnormality Detection in Lung Sounds Using Feature Augmentation. 2023 Congress in Computer Science, Computer Engineering, & Applied Computing (CSCE), Las Vegas, NV, USA: IEEE, 2023, 2690–2691.
- Chen, H. , Yuan, X., Li, J., Pei, Z., and Zheng, X. Automatic Multi-Level In-Exhale Segmentation and Enhanced Generalized S-Transform for Wheezing Detection. Computer Methods and Programs in Biomedicine 2019, 178, 163–173. [Google Scholar] [CrossRef]
- Kok, X. H., Imtiaz, S. A., and Rodriguez-Villegas, E. A Novel Method for Automatic Identification of Respiratory Disease From Acoustic Recordings. 2019 41st Annual International Conference of the IEEE Engineering in Medicine and Biology Society (EMBC), Berlin, Germany: IEEE, 2019, 2589–2592.
- Liu, R., Cai, S., Zhang, K., and Hu, N. Detection of Adventitious Respiratory Sounds Based on Convolutional Neural Network. 2019 International Conference on Intelligent Informatics and Biomedical Sciences, Shanghai, China: IEEE, 2019, 298–303.
- Shuvo, S. B., Ali, S. N., Swapnil, S. I., Hasan, T., and Bhuiyan, M. I. H. A Lightweight CNN Model for Detecting Respiratory Diseases From Lung Auscultation Sounds Using EMD-CWT-Based Hybrid Scalogram. IEEE Journal of Biomedical and Health Informatics 2021, 25(7), 2595–2603.
- Zhao, Z., et al. Automatic Respiratory Sound Classification via Multi-Branch Temporal Convolutional Network. ICASSP 2022 - 2022 IEEE International Conference on Acoustics, Speech and Signal Processing (ICASSP), Singapore, Singapore: IEEE, 2022, 9102–9106.
- Wang, Z. and Wang, Z. A Domain Transfer Based Data Augmentation Method for Automated Respiratory Classification. ICASSP 2022 - 2022 IEEE International Conference on Acoustics, Speech and Signal Processing (ICASSP), Singapore, Singapore: IEEE, 2022, 9017–9021.
- Babu, N. , Pruthviraja, D., and Mathew, J. Enhancing Lung Acoustic Signals Classification With Eigenvectors-Based and Traditional Augmentation Methods. IEEE Access 2024, 12, 87691–87700. [Google Scholar] [CrossRef]
- Wang, Z. and Sun, Z. Performance Evaluation of Lung Sounds Classification Using Deep Learning Under Variable Parameters. EURASIP Journal on Advances in Signal Processing 2024, 2024(1), 51. [Google Scholar] [CrossRef]
- Nguyen, T. and Pernkopf, F. Crackle Detection in Lung Sounds Using Transfer Learning and Multi-Input Convolutional Neural Networks. 2021 43rd Annual International Conference of the IEEE Engineering in Medicine & Biology Society (EMBC), Mexico: IEEE, 2021, 80–83.
- Pham, L., Phan, H., Palaniappan, R., Mertins, A., and McLoughlin, I. CNN-MoE Based Framework for Classification of Respiratory Anomalies and Lung Disease Detection. IEEE Journal of Biomedical and Health Informatics 2021, 25(8), 2938–2947.
- Song, W., Han, J., and Song, H. Contrastive Embedding Learning Method for Respiratory Sound Classification. ICASSP 2021 - 2021 IEEE International Conference on Acoustics, Speech and Signal Processing (ICASSP), Toronto, ON, Canada: IEEE, 2021, 1275–1279.
- Harvill, J., et al. Estimation of Respiratory Rate From Breathing Audio. 2022 44th Annual International Conference of the IEEE Engineering in Medicine & Biology Society (EMBC), Glasgow, Scotland, United Kingdom: IEEE, 2022, 4599–4603.
- Lal, K. N. A Lung Sound Recognition Model to Diagnose the Respiratory Diseases by Using Transfer Learning. Multimedia Tools and Applications 2023, 82(23), 36615–36631. [Google Scholar] [CrossRef]
- Wang, J., Dong, G., Shen, Y., Zhang, M., and Sun, P. Lightweight Hierarchical Transformer Combining Patch-Random and Positional Encoding for Respiratory Sound Classification. 2024 9th International Conference on Signal and Image Processing (ICSIP), Nanjing, China: IEEE, 2024, 580–584.
- Xiao, L., Fang, L., Yang, Y., and Tu, W. LungAdapter: Efficient Adapting Audio Spectrogram Transformer for Lung Sound Classification. Interspeech 2024, ISCA, 2024, 4738–4742.
- Tariq, Z., Shah, S. K., and Lee, Y. Lung Disease Classification Using Deep Convolutional Neural Network. 2019 IEEE International Conference on Bioinformatics and Biomedicine (BIBM), San Diego, CA, USA: IEEE, 2019, 732–735.
- Nguyen, T. and Pernkopf, F. Lung Sound Classification Using Snapshot Ensemble of Convolutional Neural Networks. 2020 42nd Annual International Conference of the IEEE Engineering in Medicine & Biology Society (EMBC), Montreal, QC, Canada: IEEE, 2020, 760–763.
- Xu, L., Cheng, J., Liu, J., Kuang, H., Wu, F., and Wang, J. ARSC-Net: Adventitious Respiratory Sound Classification Network Using Parallel Paths With Channel-Spatial Attention. 2021 IEEE International Conference on Bioinformatics and Biomedicine (BIBM), Houston, TX, USA: IEEE, 2021, 1125–1130.
- Yu, S., Ding, Y., Qian, K., Hu, B., Li, W., and Schuller, B. W. A Glance-and-Gaze Network for Respiratory Sound Classification. ICASSP 2022 - 2022 IEEE International Conference on Acoustics, Speech and Signal Processing (ICASSP), Singapore, Singapore: IEEE, 2022, 9007–9011.
- Zhang, L. , Lim, C. P., Yu, Y., and Jiang, M. Sound Classification Using Evolving Ensemble Models and Particle Swarm Optimization. Applied Soft Computing 2022, 116, 108322. [Google Scholar] [CrossRef]
- Kulkarni, S., Watanabe, H., and Homma, F. Self-Supervised Audio Encoder With Contrastive Pretraining for Respiratory Anomaly Detection. 2023 IEEE International Conference on Acoustics, Speech, and Signal Processing Workshops (ICASSPW), Rhodes Island, Greece: IEEE, 2023, 1–5.
- Roslan, I. K. B. and Ehara, F. Detection of Respiratory Diseases From Auscultated Sounds Using VGG16 With Data Augmentation. 2024 2nd International Conference on Computer Graphics and Image Processing (CGIP), Kyoto, Japan: IEEE, 2024, 133–138.
- Shi, L., Zhang, J., Yang, B., and Gao, Y. Lung Sound Recognition Method Based on Multi-Resolution Interleaved Net and Time-Frequency Feature Enhancement. IEEE Journal of Biomedical and Health Informatics 2023, 27(10), 4768–4779.
- Tiwari, U., Bhosale, S., Chakraborty, R., and Kopparapu, S. K. Deep Lung Auscultation Using Acoustic Biomarkers for Abnormal Respiratory Sound Event Detection. ICASSP 2021 - 2021 IEEE International Conference on Acoustics, Speech and Signal Processing (ICASSP), Toronto, ON, Canada: IEEE, 2021, 1305–1309.
- Sfayyih, A. H. , et al. Acoustic-Based Deep Learning Architectures for Lung Disease Diagnosis: A Comprehensive Overview. Diagnostics 2023, 13(10), 1748. [Google Scholar] [CrossRef] [PubMed]
- Sabry, A. H., Dallal Bashi, O. I., Nik Ali, N. H., and Al Kubaisi, Y. M. Lung Disease Recognition Methods Using Audio-Based Analysis With Machine Learning. Heliyon 2024, 10(4), e26218.
- Wanasinghe, T. , Bandara, S., Madusanka, S., Meedeniya, D., Bandara, M., and Díez, I. D. L. T. Lung Sound Classification With Multi-Feature Integration Utilizing Lightweight CNN Model. IEEE Access 2024, 12, 21262–21276. [Google Scholar] [CrossRef]
- Ko, T. , Peddinti, V., Povey, D., and Khudanpur, S. Audio Augmentation for Speech Recognition. Interspeech 2015, ISCA, 2015, 2015, 3586–3589. [Google Scholar]
- Barbu, T. Variational Image Denoising Approach With Diffusion Porous Media Flow. Abstract and Applied Analysis 2013, 1–8. [Google Scholar] [CrossRef]
- Iqbal, Turab and Helwani, Karim and Krishnaswamy, Arvindh and Wang, Wenwu. Enhancing Audio Augmentation Methods With Consistency Learning. ICASSP 2021-2021 IEEE International Conference on Acoustics, Speech and Signal Processing (ICASSP) 2021, 646–650.
- Aguiar, R. L., Costa, Y. M. G., and Silla, C. N. Exploring Data Augmentation to Improve Music Genre Classification With ConvNets. 2018 International Joint Conference on Neural Networks (IJCNN), Rio de Janeiro: IEEE, 2018, 1–8.
- Park, D. S., et al. SpecAugment: A Simple Data Augmentation Method for Automatic Speech Recognition. Interspeech 2019, 2019, 2613–2617.
- Alqudah, A. M. , Qazan, S., and Obeidat, Y. M. Deep Learning Models for Detecting Respiratory Pathologies From Raw Lung Auscultation Sounds. Soft Computing 2022, 26(24), 13405–13429. [Google Scholar] [CrossRef]
- Tariq, Z., Shah, S. K., and Lee, Y. Feature-Based Fusion Using CNN for Lung and Heart Sound Classification. Sensors 2022, 22(4), 1521.
- Wall, C. , Zhang, L., Yu, Y., Kumar, A., and Gao, R. A Deep Ensemble Neural Network With Attention Mechanisms for Lung Abnormality Classification Using Audio Inputs. Sensors 2022, 22(15), 5566. [Google Scholar] [CrossRef]
- Chu, Y., Wang, Q., Zhou, E., Fu, L., Liu, Q., and Zheng, G. CycleGuardian: A Framework for Automatic Respiratory Sound Classification Based on Improved Deep Clustering and Contrastive Learning. Complex Intelligent Systems 2025, 11(4), 200.
- Rahman, M. M., Shokouhmand, S., Faezipour, M., and Bhatt, S. Attentional Convolutional Neural Network for Automating Pathological Lung Auscultations Using Respiratory Sounds. 2022 International Conference on Computational Science and Computational Intelligence (CSCI), Las Vegas, NV, USA: IEEE, 2022, 1429–1435.
- Nguyen, T. and Pernkopf, F. Lung Sound Classification Using Co-Tuning and Stochastic Normalization. IEEE Transactions on Biomedical Engineering 2022, 69(9), 2872–2882.
- Kochetov, K. and Filchenkov, A. Generative Adversarial Networks for Respiratory Sound Augmentation. 2020 International Conference on Control, Robotics and Intelligent System, Xiamen China: ACM, 2020, 106–111.
- Chatterjee, S. , Roychowdhury, J., and Dey, A. D-Cov19Net: A DNN Based COVID-19 Detection System Using Lung Sound. Journal of Computational Science 2023, 66, 101926. [Google Scholar] [CrossRef]
- Tariq, Z., Shah, S. K., and Lee, Y. Multimodal Lung Disease Classification Using Deep Convolutional Neural Network. 2020 IEEE International Conference on Bioinformatics and Biomedicine (BIBM), Seoul, Korea (South): IEEE, 2020, 2530–2537.
- Im, S. , et al. Real-Time Counting of Wheezing Events From Lung Sounds Using Deep Learning Algorithms: Implications for Disease Prediction and Early Intervention. PLOS ONE 2023, 18(11), e0294447. [Google Scholar] [CrossRef]
- Chu, Y., Wang, Q., Zhou, E., Zheng, G., and Liu, Q. Hybrid Spectrogram for the Automatic Respiratory Sound Classification With Group Time Frequency Attention Network. 2023 IEEE 6th International Conference on Pattern Recognition and Artificial Intelligence (PRAI), Haikou, China: IEEE, 2023, 839–845.
- Mahmood, A. F. , Alkababji, A. M., and Daood, A. Resilient Embedded System for Classification Respiratory Diseases in a Real Time. Biomedical Signal Processing and Control 2024, 90, 105876. [Google Scholar] [CrossRef]
- Kochetov, K., Putin, E., Balashov, M., Filchenkov, A., and Shalyto, A. Noise Masking Recurrent Neural Network for Respiratory Sound Classification. In Artificial Neural Networks and Machine Learning – ICANN 2018, V. Kůrková, Y. Manolopoulos, B. Hammer, L. Iliadis, and I. Maglogiannis, Eds., Lecture Notes in Computer Science, vol. 11141. Cham: Springer International Publishing, 2018, 208–217.
- Borwankar, S. , Verma, J. P., Jain, R., and Nayyar, A. Improvise Approach for Respiratory Pathologies Classification With Multilayer Convolutional Neural Networks. Multimedia Tools and Applications 2022, 81(27), 39185–39205. [Google Scholar] [CrossRef]
- Jaitly, N. and Hinton, G. E. Vocal Tract Length Perturbation (VTLP) Improves Speech Recognition. Proc. ICML Workshop on Deep Learning for Audio, Speech and Language, 2013, 117:21.
- Gumelar, A. B., Yuniarno, E. M., Anggraeni, W., Sugiarto, I., Mahindara, V. R., and Purnomo, M. H. Enhancing Detection of Pathological Voice Disorder Based on Deep VGG-16 CNN. 2020 3rd International Conference on Biomedical Engineering (IBIOMED), Yogyakarta, Indonesia: IEEE, 2020, 28–33.
- Dong, G., Wang, J., Shen, Y., Zhang, M., Zhang, M., and Sun, P. Respiratory Sounds Classification by Fusing the Time-Domain and 2D Spectral Features. 2024 IEEE International Conference on Bioinformatics and Biomedicine (BIBM), Lisbon, Portugal: IEEE, 2024, 3178–3181.
- Wei, S., Zou, S., Liao, F., and Lang, W. A Comparison on Data Augmentation Methods Based on Deep Learning for Audio Classification. Journal of Physics: Conference Series 2020, 1453(1), 012085.
- Yuming, Z. and Wenlong, X. Research on Classification of Respiratory Diseases Based on Multi-Features Fusion Cascade Neural Network. 2021 11th International Conference on Information Technology in Medicine and Education (ITME), Wuyishan, Fujian, China: IEEE, 2021, 298–301.
- Zhao, X., Shao, Y., Mai, J., Yin, A., and Xu, S. Respiratory Sound Classification Based on BiGRU-Attention Network With XGBoost. 2020 IEEE International Conference on Bioinformatics and Biomedicine (BIBM), Seoul, Korea (South): IEEE, 2020, 915–920.
- Perna, D. and Tagarelli, A. Deep Auscultation: Predicting Respiratory Anomalies and Diseases Via Recurrent Neural Networks. 2019 IEEE 32nd International Symposium on Computer-Based Medical Systems (CBMS), Cordoba, Spain: IEEE, 2019, 50–55.
- Manzoor, A., Pan, Q., Khan, H. J., Siddeeq, S., Bhatti, H. M. A., and Wedagu, M. A. Analysis and Detection of Lung Sounds Anomalies Based on NMA-RNN. 2020 IEEE International Conference on Bioinformatics and Biomedicine (BIBM), Seoul, Korea (South): IEEE, 2020, 2498–2504.
- Ntalampiras, S. Collaborative Framework for Automatic Classification of Respiratory Sounds. IET Signal Processing 2020, 14(4), 223–228. [Google Scholar] [CrossRef]
- Ariyanti, W., Liu, K.-C., Chen, K.-Y., and Yu-Tsao. Abnormal Respiratory Sound Identification Using Audio-Spectrogram Vision Transformer. 2023 45th Annual International Conference of the IEEE Engineering in Medicine & Biology Society (EMBC), Sydney, Australia: IEEE, 2023, 1–4.
- Roy, A., Gyanchandani, B., Oza, A., and Singh, A. TriSpectraKAN: A Novel Approach for COPD Detection via Lung Sound Analysis. Scientific Reports 2025, 15(1), 6296.
- Yang, R. , Lv, K., Huang, Y., Sun, M., Li, J., and Yang, J. Respiratory Sound Classification by Applying Deep Neural Network With a Blocking Variable. Applied Sciences 2023, 13(12), 6956. [Google Scholar] [CrossRef]
- García-Ordás, M. T., Benítez-Andrades, J. A., García-Rodríguez, I., Benavides, C., and Alaiz-Moretón, H. Detecting Respiratory Pathologies Using Convolutional Neural Networks and Variational Autoencoders for Unbalancing Data. Sensors 2020, 20(4), 1214.
- Rahman, M. M., Faezipour, M., Bhatt, S., and Vhaduri, S. AHP-CM: Attentional Homogeneous-Padded Composite Model for Respiratory Anomalies Prediction. 2023 IEEE 11th International Conference on Healthcare Informatics (ICHI), Houston, TX, USA: IEEE, 2023, 65–71.
- Ma, Y. , Xu, X., and Li, Y. LungRN+NL: An Improved Adventitious Lung Sound Classification Using Non-Local Block ResNet Neural Network With Mixup Data Augmentation. Interspeech 2020, ISCA, 2020, 2020, 2902–2906. [Google Scholar]
- Ma, Y., et al. LungBRN: A Smart Digital Stethoscope for Detecting Respiratory Disease Using Bi-ResNet Deep Learning Algorithm. 2019 IEEE Biomedical Circuits and Systems Conference (BioCAS), Nara, Japan: IEEE, 2019, 1–4.
- Hussin, S. F., Birasamy, G., and Hamid, Z. Design of Butterworth Band-Pass Filter. Politeknik & Kolej Komuniti Journal of Engineering and Technology 2016, 1(1), 32–46.
- Messner, E. , et al. Multi-Channel Lung Sound Classification With Convolutional Recurrent Neural Networks. Computers in Biology and Medicine 2020, 122, 103831. [Google Scholar] [CrossRef]
- Levy, J. , Naitsat, A., and Zeevi, Y. Y. Classification of Audio Signals Using Spectrogram Surfaces and Extrinsic Distortion Measures. EURASIP Journal on Advances in Signal Processing 2022, 2022(1), 100. [Google Scholar] [CrossRef]
- Savitzky, A. and Golay, M. J. E. Smoothing and Differentiation of Data by Simplified Least Squares Procedures. Analytical Chemistry 1964, 36(8), 1627–1639. [Google Scholar] [CrossRef]
- Rao, A. , Huynh, E., Royston, T. J., Kornblith, A., and Roy, S. Acoustic Methods for Pulmonary Diagnosis. IEEE Rev. Biomed. Eng. 2019, 12, 221–239. [Google Scholar] [CrossRef]
- Kababulut, F. Y., Kuntalp, D. G., Düzyel, O., Özcan, N., and Kuntalp, M. A New Shapley-Based Feature Selection Method in a Clinical Decision Support System for the Identification of Lung Diseases. Diagnostics 2023, 13(23), 3558.
- Seong, J., Ortiz, B. L., and Chong, J. W. Wheeze and Crackle Discrimination Algorithm in Pneumonia Respiratory Signals. 2024 IEEE Colombian Conference on Communications and Computing (COLCOM), Barranquilla, Colombia: IEEE, 2024, 1–6.
- Fraiwan, L. , Hassanin, O., Fraiwan, M., Khassawneh, B., Ibnian, A. M., and Alkhodari, M. Automatic Identification of Respiratory Diseases From Stethoscopic Lung Sound Signals Using Ensemble Classifiers. Biocybernetics and Biomedical Engineering 2021, 41(1), 1–14. [Google Scholar] [CrossRef]
- Kuntalp, D. G. , Özcan, N., Düzyel, O., Kababulut, F. Y., and Kuntalp, M. A Comparative Study of Metaheuristic Feature Selection Algorithms for Respiratory Disease Classification. Diagnostics 2024, 14(19), 2244. [Google Scholar] [CrossRef]
- Yang, J., Luo, F. L., and Nehorai, A. Spectral Contrast Enhancement: Algorithms and Comparisons. Speech Communication 2003, 39(1-2), 33–46.
- Boggiatto, P. Landscapes of Time-Frequency Analysis: ATFA 2019. In Applied and Numerical Harmonic Analysis Series. Cham: Springer International Publishing AG, 2020.
- Swapna, M. S., Renjini, A., Raj, V., Sreejyothi, S., and Sankararaman, S. Time Series and Fractal Analyses of Wheezing: A Novel Approach. Physical and Engineering Sciences in Medicine 2020, 43(4), 1339–1347.
- Choi, Y. , Choi, H., Lee, H., Lee, S., and Lee, H. Lightweight Skip Connections With Efficient Feature Stacking for Respiratory Sound Classification. IEEE Access 2022, 10, 53027–53042. [Google Scholar] [CrossRef]
- Heil, C. E. and Walnut, D. F. Continuous and Discrete Wavelet Transforms. SIAM Review 1989, 31(4), 628–666. [Google Scholar] [CrossRef]
- Brown, J. C. Calculation of a Constant Q Spectral Transform. The Journal of the Acoustical Society of America 1991, 89(1), 425–434. [Google Scholar] [CrossRef]
- Perna, D. Convolutional Neural Networks Learning From Respiratory Data. 2018 IEEE International Conference on Bioinformatics and Biomedicine (BIBM), Madrid, Spain: IEEE, 2018, 2109–2113.
- Ntalampiras, S. and Potamitis, I. Automatic Acoustic Identification of Respiratory Diseases. Evolving Systems 2021, 12(1), 69–77. [Google Scholar] [CrossRef]
- Wall, C., Zhang, L., Yu, Y., and Mistry, K. Deep Recurrent Neural Networks With Attention Mechanisms for Respiratory Anomaly Classification. 2021 International Joint Conference on Neural Networks (IJCNN), Shenzhen, China: IEEE, 2021, 1–8.
- Roy, A. and Satija, U. A Novel Multi-Head Self-Organized Operational Neural Network Architecture for Chronic Obstructive Pulmonary Disease Detection Using Lung Sounds. IEEE/ACM Transactions on Audio, Speech, and Language Processing 2024, 32, 2566–2575. [Google Scholar] [CrossRef]
- Levy, J., Raz-Pasteur, A., Ovics, P., Arraf, T., Dotan, Y., and Zeevi, Y. Y. LungNet: A Deep Learning Model for Diagnosis of Respiratory Pathologies From Lung Sounds. 2023 5th International Conference on Bio-engineering for Smart Technologies (BioSMART), Paris, France: IEEE, 2023, 1–4.
- Bacanin, N. , et al. Respiratory Condition Detection Using Audio Analysis and Convolutional Neural Networks Optimized by Modified Metaheuristics. Axioms 2024, 13(5), 335. [Google Scholar] [CrossRef]
- Huang, Gao and Liu, Zhuang and Van Der Maaten, Laurens and Weinberger, Kilian Q. Densely connected convolutional networks. IEEE Conference on Computer Vision and Pattern Recognition 2017, 1, 4700–4708. [Google Scholar]
- Gong, Y., Chung, Y., Glass, J. AST: Audio spectrogram transformer. arXiv preprint 2021, arXiv, 2104.01778.
- Zou, L. , Yu, S., Meng, T., Zhang, Z., Liang, X., Xie, Y. A Technical Review of Convolutional Neural Network-Based Mammographic Breast Cancer Diagnosis. Computational and mathematical methods in medicine 2019, 1, 6509357. [Google Scholar]
- Zhu, B., Zhou, Z., Yu, S., Liang, X., Xie, Y., Sun, Q. Review of phonocardiogram signal analysis: insights from the PhysioNet/CinC challenge 2016 database. Electronics 2024, 13(16), 3222.
- He, Kaiming and Zhang, Xiangyu and Ren, Shaoqing and Sun, Jian. Deep residual learning for image recognition. Proceedings of the IEEE conference on computer vision and pattern recognition 2016, 770–778. [Google Scholar]
- Simonyan, Karen and Zisserman, Andrew. Very deep convolutional networks for large-scale image recognition. arXiv 2014, preprint arXiv, 1409.1556.
- Shehab, S. A., Mohammed, K. K., Darwish, A., and Hassanien, A. E. Deep Learning and Feature Fusion-Based Lung Sound Recognition Model to Diagnose the Respiratory Diseases. Soft Computing 2024, Early Access.
- Dosovitskiy, Alexey and Beyer, Lucas and Kolesnikov, Alexander and Weissenborn, Dirk and Zhai, Xiaohua and Unterthiner, Thomas and Dehghani, Mostafa and Minderer, Matthias and Heigold, Georg and Gelly, Sylvain and others. An image is worth 16x16 words: Transformers for image recognition at scale. arXiv preprint 2020. arXiv:2010.11929.
- Neto, J., Arrais, N., Vinuto, T., and Lucena, J. Convolution-Vision Transformer for Automatic Lung Sound Classification. 2022 35th SIBGRAPI Conference on Graphics, Patterns and Images (SIBGRAPI), Natal, Brazil: IEEE, 2022, 97–102.
- Moummad, I. , and Farrugia, N. Pretraining Respiratory Sound Representations using Metadata and Contrastive Learning. IEEE Workshop on Applications of Signal Processing to Audio and Acoustics, 2023, 1–5, 1–5. [Google Scholar]
- Bae, S. , Kim, J. W., Cho, W. Y., Baek, H., Son, S., Lee, B., Ha, C., Tae, K., Kim, S., and Yun, S. Y. Patch-Mix Contrastive Learning with Audio Spectrogram Transformer on Respiratory Sound Classification. Interspeech 2023, 2023, 5436–5440, 5436–5440. [Google Scholar]
- Kim, J. W. , Toikkanen, M., Choi, Y., Moon, S. E., and Jung, H. Y. BTS: Bridging Text and Sound Modalities for Metadata-Aided Respiratory Sound Classification. Interspeech 2024, 2024, 1690–1694, 1690–1694. [Google Scholar]
- Brunese, L., Mercaldo, F., Reginelli, A., and Santone, A. A Neural Network-Based Method for Respiratory Sound Analysis and Lung Disease Detection. Applied Sciences 2022, 12(8), 3877.
- Li, X. , et al. Electret-Based Flexible Pressure Sensor for Respiratory Diseases Auxiliary Diagnosis System Using Machine Learning Technique. Nano Energy 2023, 114, 108652. [Google Scholar] [CrossRef]
- Zhang, Zhicheng and Liang, Xiaokun and Qin, Wenjian and Yu, Shaode and Xie, Yaoqin. matFR: a MATLAB toolbox for feature ranking. Bioinformatics 2020, 36(19), 4968–4969.
- Zhang, P. , Swaminathan, A., and Uddin, A. A. Pulmonary Disease Detection and Classification in Patient Respiratory Audio Files Using Long Short-Term Memory Neural Networks. Frontiers in Medicine 2023, 10, 1269784. [Google Scholar] [CrossRef] [PubMed]
- Saldanha, J. , Chakraborty, S., Patil, S., Kotecha, K., Kumar, S., Nayyar, A. Data augmentation using Variational Autoencoders for improvement of respiratory disease classification. Plos one 2022, 17(8), e0266467. [Google Scholar] [CrossRef]
- Goodfellow, I. J., Pouget-Abadie, J., Mirza, M., Xu, B., Warde-Farley, D., Ozair, S., Courville, A., and Bengio, Y. Generative adversarial nets. Advances in Neural Information Processing Systems (NeurIPS), Montreal, Canada: Curran Associates, Inc., 2014, 27.
- Goodfellow, I., Pouget-Abadie, J., Mirza, M., Xu, B., Warde-Farley, D., Ozair, S., Courville, A. and Bengio, Y. Generative adversarial networks. Communications of the ACM 2020, 63(11), 139–144.
- Jayalakshmy, S. , Sudha, G. F. Conditional GAN based augmentation for predictive modeling of respiratory signals. Computers in Biology and Medicine 2021, 138, 104930. [Google Scholar] [CrossRef]
- Ho, J. , Jain, A., Abbeel, P. Denoising diffusion probabilistic models. Advances in neural information processing systems 2020, 33, 6840–6851. [Google Scholar]
- Kong, Z., Ping, W., Huang, J., Zhao, K., Catanzaro, B. Diffwave: A versatile diffusion model for audio synthesis. arXiv preprint 2020, arXiv, 2009.09761.
- Han, T. T., Le Trung, K., Anh, P. N., et al. Hierarchical Embedded System Based on FPGA for Classification of Respiratory Diseases. IEEE Access, 2025.
- Kim, June-Woo and Yoon, Chihyeon and Toikkanen, Miika and Bae, Sangmin and Jung, Ho-Young. Adversarial Fine-tuning using Generated Respiratory Sound to Address Class Imbalance. arXiv, 2023, preprint, 2311.06480.
- Yu, Shaode and Jin, Mingxue and Wen, Tianhang and Zhao, Linlin and Zou, Xuechao and Liang, Xiaokun and Xie, Yaoqin and Pan, Wanlong and Piao, Chenghao. Accurate breast cancer diagnosis using a stable feature ranking algorithm. BMC Medical Informatics and Decision Making 2023, 23(1), 64. [Google Scholar]
- Yuan, Y. , Xun, G., Suo, Q., Jia, K., Zhang, A. Wave2vec: Deep representation learning for clinical temporal data. Neurocomputing 2019, 324, 31–42. [Google Scholar] [CrossRef]
- Zhu, B. , Li, X., Feng, J., Yu, S. VGGish-BiLSTM-attention for COVID-19 identification using cough sound analysis. 2023 8th International Conference on Signal and Image Processing (ICSIP) 2023, 49–53. [Google Scholar]
- Niizumi, D., Takeuchi, D., Ohishi, Y., Harada, N., Kashino, K. Masked modeling duo: Towards a universal audio pre-training framework. IEEE/ACM Transactions on Audio, Speech, and Language Processing 2024.
- Russakovsky, Olga and Deng, Jia and Su, Hao and Krause, Jonathan and Satheesh, Sanjeev and Ma, Sean and Huang, Zhiheng and Karpathy, Andrej and Khosla, Aditya and Bernstein, Michael and others. Imagenet large scale visual recognition challenge. International journal of computer vision 2015, 115, 211–252. [Google Scholar] [CrossRef]
- Gemmeke, Jort F and Ellis, Daniel PW and Freedman, Dylan and Jansen, Aren and Lawrence, Wade and Moore, R Channing and Plakal, Manoj and Ritter, Marvin. Audio set: An ontology and human-labeled dataset for audio events. IEEE international conference on acoustics, speech and signal processing 2017, 776–780.
- Zhang, T., Meng, J., Yang, Y., Yu, S. Contrastive learning penalized cross-entropy with diversity contrastive search decoding for diagnostic report generation of reduced token repetition. Applied Sciences 2024, 14(7), 2817.
- Yang, T., Yu, X., McKeown, M. J., and Wang, Z. J. When Federated Learning Meets Medical Image Analysis: A Systematic Review With Challenges and Solutions. Foundations and Trends in Signal Processing 2024, 13(1).
- Suma, K. V., Koppad, D., Kumar, P., Kantikar, N. A., and Ramesh, S. Multi-Task Learning for Lung Sound and Lung Disease Classification. SN Computer Science 2024, 6(1), 51.
- Wu, Y. , Chen, J., Hu, L., Xu, H., Liang, H., and Wu, J. OmniFuse: A General Modality Fusion Framework for Multi-Modality Learning on Low-Quality Medical Data. Information Fusion 2025, 117, 102890. [Google Scholar] [CrossRef]
- Kursuncu, U., Gaur, M., and Sheth, A. Knowledge Infused Learning (K-IL): Towards Deep Incorporation of Knowledge in Deep Learning. arXiv preprint 2020. arXiv:1912.00512.
- Mokadem, N. , Jabeen, F., Treur, J., Taal, H. R., and Roelofsma, P. H. M. P. An Adaptive Network Model for AI-Assisted Monitoring and Management of Neonatal Respiratory Distress. Cognitive Systems Research 2024, 86, 101231. [Google Scholar] [CrossRef]
- ElMoaqet, H. , Eid, M., Glos, M., Ryalat, M., and Penzel, T. Deep Recurrent Neural Networks for Automatic Detection of Sleep Apnea From Single Channel Respiration Signals. Sensors 2020, 20(18), 5037. [Google Scholar] [CrossRef] [PubMed]
Figure 1.
Review of RSA techniques based on the ICBHI2017 database.
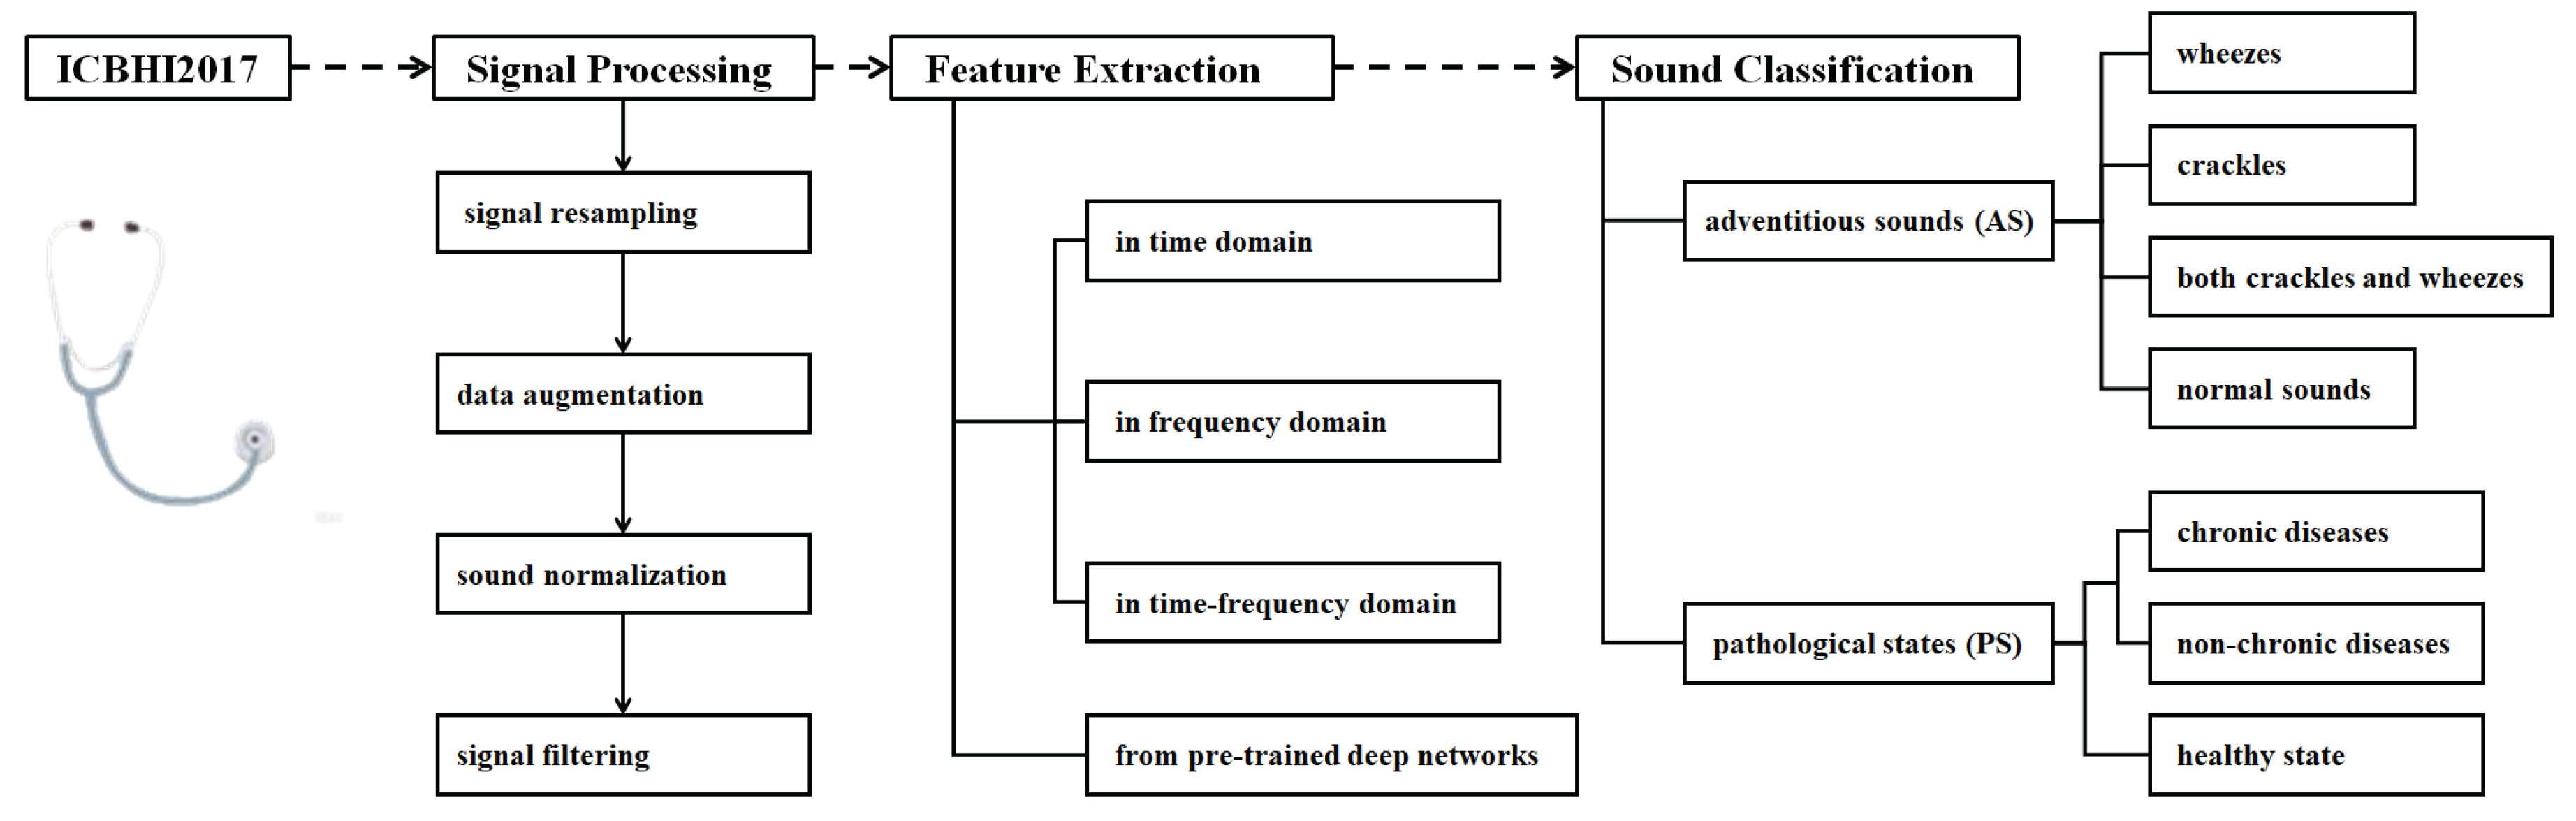

Table 1.
Review studies on RSA techniques
| involved datasets | techniques | purpose | covered years | |
| [4] | ICBHI2017, | DL | AS, PS | 2013-2023 |
| JUST Database, | ||||
| HF_Lung_V1/V2, | ||||
| RespiratoryDatabase@TR | ||||
| [5] | ICBHI2017 | FE, DL | AS, PS | 2013-2023 |
| [6] | ICBHI2017, | SP, FE, DL | AS, PS | 2011-2023 |
| HF_Lung_V1, | ||||
| R.A.L.E., | ||||
| RespiratoryDatabase@TR | ||||
| [7] | ICBHI2017 | ML, DL | AS, PS | 2015-2022 |
| R.A.L.E., | ||||
| CheXpert, ChestX-ray14 | ||||
| [8] | ICBHI2017, | FE, DL, TL | AS, PS | 2017-2022 |
| COUGHVID, | ||||
| Corp, Coswara | ||||
| ours | ICBHI2017 | SP, FE, ML, DL, TL | AS, PS, | 2017-2025 |
Table 2.
Overview of open-sourced respiratory sound databases
| database | () | ||
| RespiratoryDatabase@TR [9] | 3,696 | AS (4) | Chest X-ray, heart sound |
| questionnaire data | |||
| SPRSound [10] | 9,089 | AS (6) | Demographics |
| HF_Lung_V1 [11] | 9,765 | AS (4) | - |
| HF_Tracheal_V1 [12] | 10,448 | AS (3) | - |
| HF_Lung_V2 [13] | 13,957 | AS (5) | Demographics |
| ICBHI2017 [14] | 6,898 | AS (4), PS (7) | Demographics |
Table 3.
Signal resampling frequencies
| Resampling frequency | References (#) |
|---|---|
| 1,000 Hz | [15] (1) |
| 2,000 Hz | [5,16] (2) |
| 4,000 Hz | [17,18,19,20,21,22,23,24,25,26,27,28,29,30,31,32,33,34,35,36,37,38,39,40,41,42,43,44,45,46,47,48,49,50,51,52,53,54] (38) |
| 6,000 Hz | [55,56] (2) |
| 8,000 Hz | [57,58,59,60,61,62,63,64] (8) |
| 10,000 Hz | [19,40] (2) |
| 16,000 Hz | [28,65,66,67,68,69,70,71] (8) |
| 22,050 Hz | [72,73,74,75,76,77,78] (7) |
| 32,000 Hz | [79] (1) |
| 44,100 Hz | [6,19,40,78,80,81,82,83] (8) |
Table 4.
Standard data augmentation techniques
| Standard techniques | References (#) |
|---|---|
| Time stretching | [4,40,41,62,63,64,65,72,73,76,78,89,90,91,92,93,94,95,96,97] (20) |
| Pitch shifting | [4,26,38,39,40,41,62,63,72,83,93,96,97,98,99,100] (16) |
| Adding noise | [26,32,38,39,40,41,62,63,64,76,82,89,90,91,92,93,99,100] (18) |
| Speed transformation | [26,38,39,75,99] (5) |
| Time shifting | [32,39,63,89,92,100,101,102] (8) |
| Dynamic range compression | [4,72,97] (3) |
| Frequency and time masking | [27,70,95] (3) |
Table 5.
Feature extraction of respiratory signals in the time domain
| time-domain-based features | References (#) |
|---|---|
| Statistical features | [4,22,29,46,47,57,58,81,90,100,108,124,125,126] (15) |
| Shannon entropy | [82,127] (3) |
| Zero-crossing rate (ZCR) | [4,29,56,82,100,124] (6) |
Table 6.
Feature extraction of respiratory signals in the frequency domain
| frequency-domain-based features | References (#) |
|---|---|
| Fourier Transform (FT) | [65,90] (2) |
| Spectral features | [4,21,29,81,83,108,129] (7) |
| Power spectral density analysis | [55,124,130] (3) |
Table 7.
Feature extraction of respiratory signals in the joint time-frequency domain
| time-frequency-domain-based features | References (#) |
|---|---|
| Mel-Frequency Cepstral Coefficients (MFCCs) | [4,20,33,52,62,64,76,104,110,121,134,135,136] (14) |
| Mel Spectrograms | [4,6,17,18,22,29,41,46,56,58,63,64,74,82,83] (15) |
| Logarithmic Mel Spectrograms | [34,38,51,63,67,68,71] (7) |
| Short-Time Fourier Transform (STFT) | [4,6,16,19,20,21,23,24,25,33,35,37,40,44,45,53,63,64,69,76,78,83,97,104,105,110,112,117,118,137] (30) |
| Wavelet Transform (WT) | [4,5,20,25,28,32,40,53,60,80,81,114,138] (13) |
| Wavelet Packet Integral | [6,30,58,111,135] (5) |
| Constant-Q Transform | [25,41,92,99,139] (5) |
| Gammatonegram | [27,28,66,92,107] (5) |
| Mel Filter Bank | [28,55,61,65,69,105] (6) |
Table 8.
Machine learning-based respiratory sound classification
| year | # | splitting | SEN (%) | SPE (%) | ACC (%) | HS (%) | ||
|---|---|---|---|---|---|---|---|---|
| [58] | RUSBoost Tree | 2019 | 2 | - | 93.60 | 86.80 | 87.10 | 90.20 |
| [17] | SVM | 2018 | 4 | - | 77.80 | 48.90 | 49.98 | - |
| [18] | HMM/GMM | 2018 | 4 | 10-FCV | - | - | - | 39.56 |
| [22] | Random Forest | 2020 | 7 | 70-30-0 | - | - | 88.00 | 87.00 |
Table 9.
CNN-based respiratory sound classification
| year | # | splitting | SEN (%) | SPE (%) | ACC (%) | HS (%) | ||
| [134] | CNN | 2018 | 2 | 80-20-0 | - | - | 78.00 | 85.00 |
| [93] | ResNet-34 | 2022 | 2 | 80-20-0 | - | - | 96.00 | 95.80 |
| [134] | CNN | 2018 | 3 | 80-20-0 | - | - | 82.00 | 84.00 |
| [115] | CNN | 2020 | 3 | 10-FCV | 98.60 | 98.80 | 99.40 | 98.70 |
| [28] | CNN | 2021 | 3 | 60-40-0 | 88.00 | 85.00 | 86.00 | 86.50 |
| [60] | CNN | 2021 | 3 | 70-10-20 | - | - | 98.70 | 98.47 |
| [102] | CNN | 2022 | 3 | 70-20-10 | - | - | - | 99.30 |
| [118] | Bi-ResNet | 2019 | 4 | 60-40-0 | 31.12 | 69.20 | 57.29 | 50.16 |
| [73] | CNN | 2020 | 4 | 80-20-0 | 87.30 | 69.40 | - | 78.35 |
| [23] | ResNet-18 | 2020 | 4 | 70-30-0 | 81.25 | 17.84 | - | 49.55 |
| [26] | ResNet-34 | 2021 | 4 | 60-40-0 | 39.00 | 71.40 | - | 55.20 |
| [26] | ResNet-34 | 2021 | 4 | 80-20-0 | 78.80 | 53.60 | - | 66.20 |
| [28] | CNN | 2021 | 4 | 60-40-0 | 32.00 | 73.00 | - | 53.00 |
| [94] | ResNet-50 | 2022 | 4 | 60-40-0 | 37.24 | 79.34 | - | 58.29 |
| [34] | CNN | 2022 | 4 | 60-40-0 | 27.78 | 72.96 | - | 50.37 |
| [36] | ResNet | 2022 | 4 | 60-40-0 | 30.00 | 70.00 | - | 50.00 |
| [45] | ResNet-34 | 2023 | 4 | 60-40-0 | 25.10 | 75.30 | - | 50.20 |
| [45] | ResNet-34 | 2023 | 4 | 80-20-0 | 79.56 | 57.89 | - | 68.72 |
| [72] | 2D-CNN | 2019 | 6 | 70-30-0 | - | - | 97.00 | - |
| [146] | CNN | 2024 | 8 | 80-20-0 | 99.42 | 96.53 | 96.03 | 97.99 |
| [78] | VGG16 | 2024 | 8 | 60-40-0 | - | - | 75.00 | 72.00 |
Table 10.
Respiratory sound classification using RNN and its variants
| year | # | splitting | SEN (%) | SPE (%) | ACC (%) | HS (%) | ||
| [109] | LSTM | 2019 | 2 | 80-20-0 | 82.00 | 99.00 | 99.00 | 91.50 |
| [101] | RNN | 2018 | 4 | 5-FCV | 74.10 | 61.70 | 67.90 | 67.90 |
| [108] | Bi-GRU | 2020 | 4 | 70-30-0 | 80.65 | 64.24 | 64.94 | 72.45 |
| [136] | BiLSTM-BiGRU | 2021 | 6 | 75-12.5-12.5 | - | - | 96.20 | - |
| [107] | Bi-LSTM | 2021 | 6 | 80-20-0 | - | - | 88.30 | - |
| [40] | LSTM | 2024 | 8 | 80-20-0 | 99.10 | 89.56 | 94.16 | 94.33 |
Table 11.
Hybrid learning-based respiratory sound classification
| year | # | splitting | SEN (%) | SPE (%) | ACC (%) | HS (%) | ||
| [69] | VGGish-BiGRU | 2023 | 2 | 85-15-0 | - | - | 94.00 | 94.00 |
| [115] | CNN-LSTM | 2022 | 3 | - | 99.15 | 97.60 | 99.62 | - |
| [33] | CNN-LSTM | 2022 | 4 | 10-FCV | 84.26 | 52.78 | 76.39 | 68.52 |
| [31] | CNN-BiLSTM | 2022 | 6 | 10-FCV | 99.69 | 98.43 | 99.62 | 99.06 |
| [89] | CNN-LSTM | 2022 | 8 | - | 97.71 | 84.73 | 82.35 | - |
| [89] | CNN-RNN | 2022 | 8 | - | - | - | 86.00 | 87.00 |
Table 12.
Transformer-based respiratory sound classification
| year | # | splitting | SEN (%) | SPE (%) | ACC (%) | HS (%) | ||
| [148] | ViT | 2022 | 4 | 60-40-0 | 36.41 | 78.31 | - | 57.36 |
| [112] | ViT | 2023 | 4 | 80-20-0 | - | - | - | 69.30 |
| [46] | AST | 2023 | 4 | 60-40-0 | 42.91 | 62.11 | 53.53 | 50.76 |
| [71] | AST | 2024 | 4 | 60-40-0 | 44.37 | 80.43 | - | 62.40 |
Table 13.
Performance of AS categorization using official data splitting
| backbone | year | splitting | SEN (%) | SPE (%) | HS (%) | |
| [118] | Bi-ResNet | 2019 | 60-40 | 31.12 | 69.20 | 50.16 |
| [117] | LungRN+NL | 2020 | 60-40 | 41.32 | 63.20 | 52.26 |
| [55] | CNN | 2021 | 60-40 | 42.00 | 42.00 | 42.00 |
| [26] | ResNet-34 | 2021 | 60-40 | 39.00 | 71.40 | 55.20 |
| [66] | CNN-MoE | 2021 | 60-40 | 26.00 | 68.00 | 47.00 |
| [28] | CNN-Inception | 2021 | 60-40 | 32.00 | 73.00 | 53.00 |
| [74] | ARSC-Net | 2021 | 60-40 | 46.38 | 67.13 | 56.76 |
| [148] | ViT | 2022 | 60-40 | 36.41 | 78.31 | 57.36 |
| [94] | ResNet-50 | 2022 | 60-40 | 37.24 | 79.34 | 58.29 |
| [34] | CNN | 2022 | 60-40 | 27.78 | 72.96 | 50.37 |
| [36] | ResNet | 2022 | 60-40 | 30.00 | 70.00 | 50.00 |
| [62] | ResNeStIBN | 2022 | 60-40 | 40.20 | 70.40 | 55.30 |
| [149] | CNN | 2022 | 60-40 | 39.15 | 76.93 | 58.04 |
| [99] | GTFA-Net | 2023 | 60-40 | 48.40 | 72.10 | 60.25 |
| [45] | ResNet-34 | 2023 | 60-40 | 25.10 | 75.30 | 50.20 |
| [46] | FNN | 2023 | 60-40 | 44.55 | 55.95 | 50.25 |
| [114] | BLNet | 2023 | 60-40 | 42.63 | 61.33 | 51.98 |
| [150] | AST | 2023 | 60-40 | 43.07 | 81.66 | 62.37 |
| [52] | OFGST-Swin | 2024 | 60-40 | 40.53 | 71.56 | 56.05 |
| [151] | CLAP | 2024 | 60-40 | 45.67 | 81.40 | 63.54 |
| [71] | AST | 2024 | 60-40 | 44.37 | 80.43 | 62.40 |
| [92] | CycleGuardian | 2025 | 60-40 | 44.47 | 82.06 | 63.26 |
Table 14.
Performance of AS categorization using custom data splits.
| backbone | year | splitting | SEN (%) | SPE (%) | ACC (%) | HS (%) | |
| [101] | RNN | 2018 | 5-FCV | 74.10 | 61.70 | 67.90 | 67.90 |
| [123] | CNN-RNN | 2020 | 80-20-0 | 84.14 | 48.63 | 58.47 | 66.38 |
| [19] | CNN | 2020 | 10-FCV | 86.00 | 61.00 | 69.00 | 65.00 |
| [95] | InfoGAN | 2020 | 5-FCV | 70.20 | 79.30 | - | 74.80 |
| [117] | LungRN+NL | 2020 | 5-FCV | 63.20 | 41.32 | - | 52.26 |
| [20] | VGG-16 | 2020 | 5-FCV | 66.80 | 47.40 | 55.60 | 57.10 |
| [73] | CNN | 2020 | 80-20-0 | 87.30 | 69.40 | - | 78.35 |
| [23] | ResNet18 | 2020 | 70-30-0 | 81.25 | 17.84 | - | 49.55 |
| [108] | BiGRU-XGBoost | 2020 | 70-30-0 | 80.65 | 64.24 | 64.94 | 72.45 |
| [25] | CRNN | 2021 | 5-FCV | 83.00 | 64.00 | - | 74.00 |
| [26] | ResNet-34 | 2021 | 80-20-0 | 78.80 | 53.60 | - | 66.20 |
| [66] | CNN-MoE | 2021 | 5-FCV | 86.60 | 71.30 | - | 78.90 |
| [67] | CNN | 2021 | 80-20-0 | 85.44 | 70.93 | 78.73 | 78.18 |
| [80] | CNN-RNN | 2021 | 5-FCV | 90.66 | 72.32 | - | 81.64 |
| [74] | ASRC-Net | 2021 | 5-FCV | 74.76 | 58.95 | - | 66.86 |
| [33] | CNN-LSTM | 2022 | 10-FCV | 84.26 | 52.78 | 76.39 | 68.52 |
| [36] | ResNet | 2022 | 5-FCV | 87.00 | 80.00 | - | 83.00 |
| [36] | ResNet | 2022 | 10-FCV | 93.00 | 84.00 | - | 88.00 |
| [61] | MBTCNSE | 2023 | 80-20-0 | 86.10 | 65.30 | 72.50 | 75.70 |
| [99] | GTFA-Net | 2023 | 80-20-0 | 82.00 | 61.40 | - | 71.70 |
| [77] | SincNet | 2023 | 80-20-0 | 80.20 | 95.00 | 91.30 | 87.60 |
| [77] | SincNet | 2023 | 10-FCV | 77.60 | 94.90 | 90.60 | 86.30 |
| [37] | CNN | 2023 | 10-FCV | 68.84 | 52.71 | 62.93 | 60.78 |
| [45] | ResNet34 | 2023 | 80-20-0 | 79.56 | 57.89 | - | 68.72 |
| [114] | BLNet | 2023 | 80-20-0 | 79.13 | 66.31 | - | 72.72 |
| [40] | LSTM | 2024 | 80-20-0 | 92.49 | 89.56 | 79.61 | 78.67 |
Table 15.
Performance of PS binary classification.
| backbone | year | splitting | SEN (%) | SPE (%) | ACC (%) | HS (%) | |
| [134] | CNN | 2018 | 80-20-0 | - | - | 78.00 | 85.00 |
| [58] | RUSBoost | 2019 | - | 93.60 | 86.80 | 87.10 | 90.20 |
| [109] | LSTM | 2019 | 80-20-0 | 82.00 | 99.00 | 99.00 | 92.00 |
| [66] | CNN-MoE | 2021 | 5-FCV | 86.00 | 98.00 | - | 92.00 |
| [152] | SVM | 2022 | 10-FCV | 96.60 | 100.0 | - | 98.30 |
| [93] | ResNet34 | 2022 | 80-20-0 | - | - | 96.00 | 95.80 |
| [69] | VGGish-StackedBiGRU | 2023 | 85-15-0 | - | - | 94.00 | 94.00 |
| [48] | DNN | 2024 | 70-30-0 | 68.00 | 100.0 | 96.00 | 84.00 |
| [50] | EasyNet | 2024 | 5-FCV | 99.00 | 99.00 | 99.70 | 99.00 |
| [137] | MHSONN | 2024 | 80-10-10 | 99.73 | 99.85 | 99.81 | 99.79 |
Table 16.
Performance on PS ternary classification.
| backbone | year | splitting | SEN (%) | SPE (%) | ACC (%) | HS (%) | |
| [134] | CNN | 2018 | 80-20-0 | - | - | 82.00 | 84.00 |
| [109] | LSTM | 2019 | 80-20-0 | 82.00 | 98.00 | 98.00 | 91.00 |
| [115] | CNN-VAE | 2020 | 10-FCV | 98.60 | 98.80 | 99.40 | 98.70 |
| [28] | CNN | 2021 | 60-40-0 | 88.00 | 85.00 | 86.00 | 86.50 |
| [60] | CNN | 2021 | 70-10-20 | - | - | 98.70 | 98.47 |
| [89] | CNN-LSTM | 2022 | - | 99.15 | 97.60 | 99.62 | 98.38 |
| [102] | CNN | 2022 | 70-20-10 | - | - | - | 99.30 |
| [94] | ResNet | 2022 | 60-40-0 | 91.77 | 93.68 | 92.72 | 92.57 |
| [47] | CNN | 2024 | 5-FCV | - | - | 66.35 | 69.42 |
Table 17.
Performance on PS multi-class classification
| backbone | year | splitting | SEN (%) | SPE (%) | ACC (%) | HS (%) | |
| [72] | CNN | 2019 | 70-30-0 | - | - | 97.00 | - |
| [22] | Random Forest | 2020 | 70-30-0 | - | - | 88.00 | 87.00 |
| [60] | CNN | 2021 | 70-10-20 | 100.00 | 98.60 | 98.70 | 99.30 |
| [136] | BiLSTM-BiGRU | 2021 | 75-12.5-12.5 | - | - | 96.20 | - |
| [107] | Bi-LSTM | 2021 | 80-20-0 | - | - | 88.30 | - |
| [31] | CNN-BiLSTM | 2022 | 10-FCV | 99.69 | 98.43 | 99.62 | 99.06 |
| [90] | FDC-FSNet | 2022 | 80-20-0 | - | - | 99.10 | - |
| [153] | 1D-CNN | 2022 | - | 99.02 | 98.30 | 99.43 | 98.66 |
| [155] | CNN-LSTM | 2022 | 80-20-0 | - | - | 98.82 | 97.00 |
| [89] | CNN-LSTM | 2022 | - | 97.71 | 84.73 | 82.35 | 91.22 |
| [5] | CNN | 2023 | 50-50-0 | - | - | 93.00 | - |
| [78] | VGG16 | 2024 | 60-40-0 | - | - | 75.00 | 72.00 |
| [40] | LSTM | 2024 | 80-20-0 | 99.10 | 89.56 | 94.16 | 94.33 |
| [146] | CNN | 2024 | 80-20-0 | 99.42 | 96.53 | 96.03 | 97.99 |
Disclaimer/Publisher’s Note: The statements, opinions and data contained in all publications are solely those of the individual author(s) and contributor(s) and not of MDPI and/or the editor(s). MDPI and/or the editor(s) disclaim responsibility for any injury to people or property resulting from any ideas, methods, instructions or products referred to in the content. |
© 2025 by the authors. Licensee MDPI, Basel, Switzerland. This article is an open access article distributed under the terms and conditions of the Creative Commons Attribution (CC BY) license (http://creativecommons.org/licenses/by/4.0/).
Copyright: This open access article is published under a Creative Commons CC BY 4.0 license, which permit the free download, distribution, and reuse, provided that the author and preprint are cited in any reuse.


