Submitted:
14 June 2025
Posted:
18 June 2025
You are already at the latest version
Abstract
This study presents a comprehensive analysis of property tax classification using machine learning approaches applied to the 2024 U.S. Property Tax Roll dataset. The research employs four different machine learning algorithms - XGBoost, Random Forest, Support Vector Machine (SVM), and Logistic Regression - to predict and analyze property classifications across American states. To address the challenge of imbalanced data distribution in property classes, we implement the SMOTE technique for data balancing. The experimental results demonstrate that the XGBoost algorithm achieves superior performance with an accuracy of 0.901, significantly outperforming other models across multiple evaluation metrics. The study reveals strong correlations between total assessment values and tax exemptions (correlation coefficient 0.98), providing insights into the relationship between property valuation and tax policy implementation. The findings have important implications for both tax administrators and policymakers, offering a data-driven approach to property tax classification and assessment.
Keywords:
property tax classification
; machine learning
; tax policy analysis
; real estate valuation
1. Introduction
In the context of global economic development, real estate tax policy, as a crucial tool for government regulation of economic and social development, has garnered increasing attention from academia and policymakers regarding its scientific validity and effectiveness. The United States, as a federal system, grants states considerable autonomy in formulating and implementing real estate tax policies, creating a diverse range of tax practices that provides unique samples for studying real estate tax policies. With the rapid development of big data and artificial intelligence technologies, utilizing machine learning methods for real estate tax prediction and analysis not only enhances tax administration efficiency but also provides data support for policy formulation.
In recent years, the complexity and diversity of real estate tax policies have posed challenges to traditional analytical methods. On one hand, the interaction of multidimensional factors such as property assessment values, geographical location, and usage types has made tax classification and prediction increasingly complex. On the other hand, the variations in tax policies across states have increased the difficulty of establishing a unified analytical framework. Against this backdrop, machine learning methods, with their powerful pattern recognition and prediction capabilities, offer new approaches to addressing these challenges.
This study, based on the 2024 U.S. Property Tax Roll dataset, employs various machine learning algorithms to predict and analyze property classifications. By comparing the performance of Random Forest, XGBoost, Support Vector Machine, and Logistic Regression algorithms, we explore the most suitable models for property tax classification prediction. The research not only focuses on model prediction accuracy but also emphasizes the analysis of key factors influencing property classification, providing empirical evidence for understanding and optimizing tax policies. The innovation of this study primarily lies in: first-time application of multiple machine learning methods to analyze the latest U.S. property tax data; establishment of a systematic solution for property classification prediction through comprehensive evaluation of different algorithms; and in-depth exploration of key factors affecting property classification and their mechanisms.
2. Literature Review
The existing literature on real estate tax policy analysis and machine learning applications in taxation can be broadly categorized into several streams of research. Early studies primarily focused on traditional statistical methods for analyzing property tax policies. For instance, Zodrow conducted a comprehensive review of property tax systems across different states, highlighting the variations in tax bases and rates that create challenges for unified analysis approaches [1].
Recent years have witnessed an increasing application of machine learning techniques in tax-related predictions and classifications. Athey and Imbens demonstrated how machine learning methods could revolutionize economic policy analysis, including tax policy evaluation, by providing more accurate predictions and identifying complex patterns in large datasets. Their work established a fundamental framework for applying machine learning in economic policy analysis [2].
In the specific context of property tax classification, several studies have employed various machine learning algorithms. Chen and Guestrin, in their seminal work introducing XGBoost, demonstrated its superior performance in structured data classification tasks, including financial and real estate applications. Their findings have influenced numerous subsequent studies in tax classification systems [3].
The challenge of imbalanced data in property classification has been widely recognized in the literature. Chawla et al. proposed the SMOTE technique, which has become a standard approach for handling class imbalance in real estate and taxation datasets. This method has been particularly valuable in property tax classification where certain property types are significantly underrepresented [4].
Recent empirical studies have specifically focused on property tax prediction models. Lee compared different machine learning algorithms for property value assessment and tax classification, finding that ensemble methods generally outperform traditional statistical approaches. Their study provided evidence that machine learning techniques can significantly improve the accuracy of property tax classifications [5].
The importance of feature selection in property tax classification has been emphasized by several researchers. Chanasit et al. demonstrated that proper feature selection and engineering can significantly improve the performance of machine learning models in tax-related predictions. Their work highlighted the critical role of understanding the relationships between different tax-related variables [6].
3. Research Design
3.1. Data Introduction
In the research design part, the introduction and explanation of data is an important part of research methodology. The data used in this study comes from the 2024 Property Tax Roll data set, which provides the latest real estate tax-related data of American States and provides a solid data foundation for the empirical analysis of this study.
In the time dimension of data, this study adopts the latest real estate tax data up to 2024, and these data are kept timely by annual updating. From the geographical dimension, the data covers the tax situation of American States, including key indicators such as real estate tax rate and evaluation value, which provides the possibility for cross-regional comparative research.
In order to ensure the reliability and accuracy of the research results, this study systematically preprocessed the original data. Firstly, duplicate values and abnormal values are deleted through the data cleaning process; Secondly, the missing values in the data are filled by appropriate statistical methods; Thirdly, considering the dimensional differences between different indicators, the necessary data standardization is carried out. In the aspect of data quality control, this study strictly carried out the procedures of data consistency test, abnormal value identification and processing, data integrity verification and variable correlation analysis.
Figure 1 focuses on the distribution of P_ID. It can be observed from the first picture that P_ID presents a bimodal distribution, in which the main distribution interval is concentrated between 0 and 50000, and it shows a relatively uniform distribution trend in this interval. There is an obvious trough between 50000 and 60000, and a second smaller distribution peak is formed between 60000 and 80000. This distribution may reflect the coding law of different areas or different types of real estate, which provides an important classification basis for subsequent analysis.
Figure 2 shows the distribution of Property Classes, showing obvious right-leaning distribution characteristics. The data shows that the number of properties in categories 1.0 and 2.0 is the largest, with about 14,000 and 13,000 samples respectively, which is much higher than other categories. With the increase of category value, the number of samples showed a significant decreasing trend. This distribution shows that the low-category property is the main sample, which may be related to the use type or value evaluation grade of the property, which is of great significance to understand the tax structure of the property.
Figure 3 reveals the interrelationships among the variables. Among them, the most significant correlation appears between TOTAL_ASSMT (total evaluation estimate) and TOTAL_EXEMPT (total tax allowance), and the correlation coefficient is as high as 0.98, indicating that there is a strong positive correlation between these two indicators. In addition, there is a moderate positive correlation (0.51) between P_ID and plat. It is worth noting that the correlation between TOTAL_TAXES and most other variables is weak, and only shows a weak correlation of 0.21 with TOTAL_ASSMT. This finding implies that the determination of real estate tax may be influenced by multiple complex factors, rather than simply determined by a single factor.
3.2. Software and Hardware Configuration
In terms of software and hardware environment configuration, Python 3.8 is adopted as the main programming language in this study, which is based on its wide application in data science and machine learning and rich library support. The core data processing and modeling depend on several professional libraries, including pandas 1.5.3 and numpy 1.23.5 for data processing and analysis, matplotlib 3.7.1 and seaborn 0.12.2 for data visualization. In the machine learning framework, scikit-learn 1.0.2 is selected as the basic modeling tool, XGBoost 1.7.3 is introduced for the realization of integrated learning, and TensorFlow 2.12.0 is used to construct the deep learning model. In order to solve the problem of data imbalance, SMOTE technology in imbalanced-learn 0.10.1 library is adopted.
In terms of hardware environment, the experiment was carried out on a workstation equipped with Intel Core i7 processor and 32GB RAM, and the training of deep learning model was accelerated with NVIDIA GeForce RTX 3080 graphics card. Specific parameter information is shown in Table 1 and Table 2.

Table 1.
Software environment configuration.
| Category | Component | Version |
| Programming Language | Python | 3.8 |
| Data Processing | pandas | 1.5.3 |
| numpy | 1.23.5 | |
| Data Visualization | matplotlib | 3.7.1 |
| seaborn | 0.12.2 | |
| Machine Learning Framework | scikit-learn | 1.0.2 |
| XGBoost | 1.7.3 | |
| Data Balancing Processing | imbalanced-learn | 0.10.1 |
Table 2.
Hardware environment configuration.
| Device Type | Configuration Parameter |
| Processor | Intel Core i7 |
| Memory | 32GB RAM |
| Operating System | Windows 10 |
| Storage Device | 512GB SSD |
3.3. Model Introduction
In terms of model theory, this study uses four representative machine learning algorithms to predict the classification of real estate categories. First of all, the core advantage of Random Forest algorithm is to realize the diversity of models by constructing multiple decision trees and adopting voting mechanism, thus improving the accuracy and robustness of prediction. The algorithm can effectively process high-dimensional data and provide feature importance evaluation, which is of great significance for understanding the key factors affecting real estate classification.
Secondly, XGBoost, as an efficient implementation of gradient lifting decision tree, uses second-order Taylor expansion to approximate the objective function, and introduces regularization term to control the model complexity. This algorithm design makes the model keep high accuracy while effectively preventing over-fitting, which is especially suitable for the classification task of structured data. Another advantage of XGBoost is its built-in feature importance evaluation mechanism, which can help us identify the most influential factors in real estate classification.
Thirdly, support vector machine (SVM) maps data to high-dimensional feature space through kernel function, and finds the optimal classification hyperplane in this space. This theoretical basis makes it especially suitable for dealing with nonlinear classification problems. In this study, we use radial basis function (RBF) kernel, which can effectively capture the nonlinear relationship between features and improve the classification performance of the model.
Fourthly, Logistic Regression, as a classical statistical learning method, classifies by establishing a nonlinear mapping relationship between features and category probabilities. Although its form is simple, it can effectively prevent over-fitting and realize feature selection by introducing L1 or L2 regularization. The advantage of this method is that the model has strong explanatory power, and it can intuitively show the influence degree of each feature on the classification results.
4. Model Result Analysis
The experimental results (Table 3) show that XGboost has highest amount in the accuracy (0.901) , precision (0.893), recall (0.882) and F1-score (0.887) among the four models.
Although the accuracy of support vector machine (SVM) is slightly lower than that of ensemble learning method, it still reaches an acceptable level of 0.845. Its performance shows that even when dealing with nonlinear classification problems, SVM can still capture the complex relationship between features through the mapping of RBF kernel function. However, a relatively long time (15.32 seconds) may limit its application in large-scale data processing.
As a benchmark model, logistic regression is relatively weak in various indicators, but its accuracy of 0.812 and F1 score of 0.796 still show the basic effectiveness of this method in real estate classification tasks. More importantly, the logistic regression model has the shortest reaction time (5.43 seconds), which has certain advantages in practical application.
Generally speaking, the experimental results show that XGBoost has the best comprehensive performance in the task of real estate classification and prediction, followed by random forest algorithm. These two ensemble learning methods not only perform well in prediction accuracy, but also have obvious advantages in calculation efficiency and model stability. These findings provide reliable technical support for the real estate tax administration, and also provide valuable reference for the follow-up research.
5. Conclusions
In terms of model performance, the experimental results show that XGBoost algorithm is the best in the task of real estate category prediction, with an accuracy of 0.901, and all evaluation indexes are significantly better than other models. This discovery shows that the integrated learning method has obvious advantages in dealing with complex real estate classification problems. Especially, XGBoost shows good comprehensive performance in balancing prediction accuracy and computational efficiency.
It is found that the distribution of real estate categories is obviously unbalanced, and the real estate with low category value occupies the main part of the sample. This distribution characteristic reflects the structural characteristics of the American real estate market, and it also suggests that we need to pay special attention to the sample imbalance when making classified forecasts. Additionally, different States have different rules of calculating property taxes and applying exemptions based on their own rules. This may also lead to challenges of using models for cross-state analysis.
The practical significance of this study is as follows: it provides a reliable tool for tax administration to predict the classification of real estate, which is helpful to improve the efficiency and accuracy of tax administration; It provides data support for policy makers and helps to formulate more scientific and reasonable tax policies; It provides a methodological reference for the follow-up research and promotes the application of machine learning in the field of taxation.
Future research can be deepened in the following aspects: expanding the time span of data and exploring the dynamic evolution law of real estate tax policy; Introduce more external data, such as economic development indicators and demographic data, to improve the prediction ability of the model; Develop an algorithm that is more suitable for dealing with unbalanced data and improve the prediction accuracy of a few categories of samples; State-specific-research to avoid inconsistencies of policies among States; Discover other factors that may have a stronger correlation coefficient with property taxes. These research directions will help to further enhance our ability to understand and predict the real estate tax policy.
References
- Zodrow, G. R. (2001). The property tax as a capital tax: A room with three views. National Tax Journal, 54(1), 139-156. [CrossRef]
- Athey, S., & Imbens, G. W. (2019). Machine learning methods that economists should know about. Annual Review of Economics, 11, 685-725. [CrossRef]
- Chen, T., & Guestrin, C. (2016). XGBoost: A scalable tree boosting system. In Proceedings of the 22nd ACM SIGKDD international conference on knowledge discovery and data mining (pp. 785-794).
- Chawla, N. V., Bowyer, K. W., Hall, L. O., & Kegelmeyer, W. P. (2002). SMOTE: synthetic minority over-sampling technique. Journal of artificial intelligence research, 16, 321-357. [CrossRef]
- Lee, C. (2022). Training and interpreting machine learning models: application in property tax assessment. Real Estate Management and Valuation, 30(1), 13-22. [CrossRef]
- Chanasit, K., Chuangsuwanich, E., Suchato, A., & Punyabukkana, P. (2021). A real estate valuation model using boosted feature selection. IEEE Access, 9, 86938-86953. [CrossRef]
Figure 1.
Distribution of P_ID.
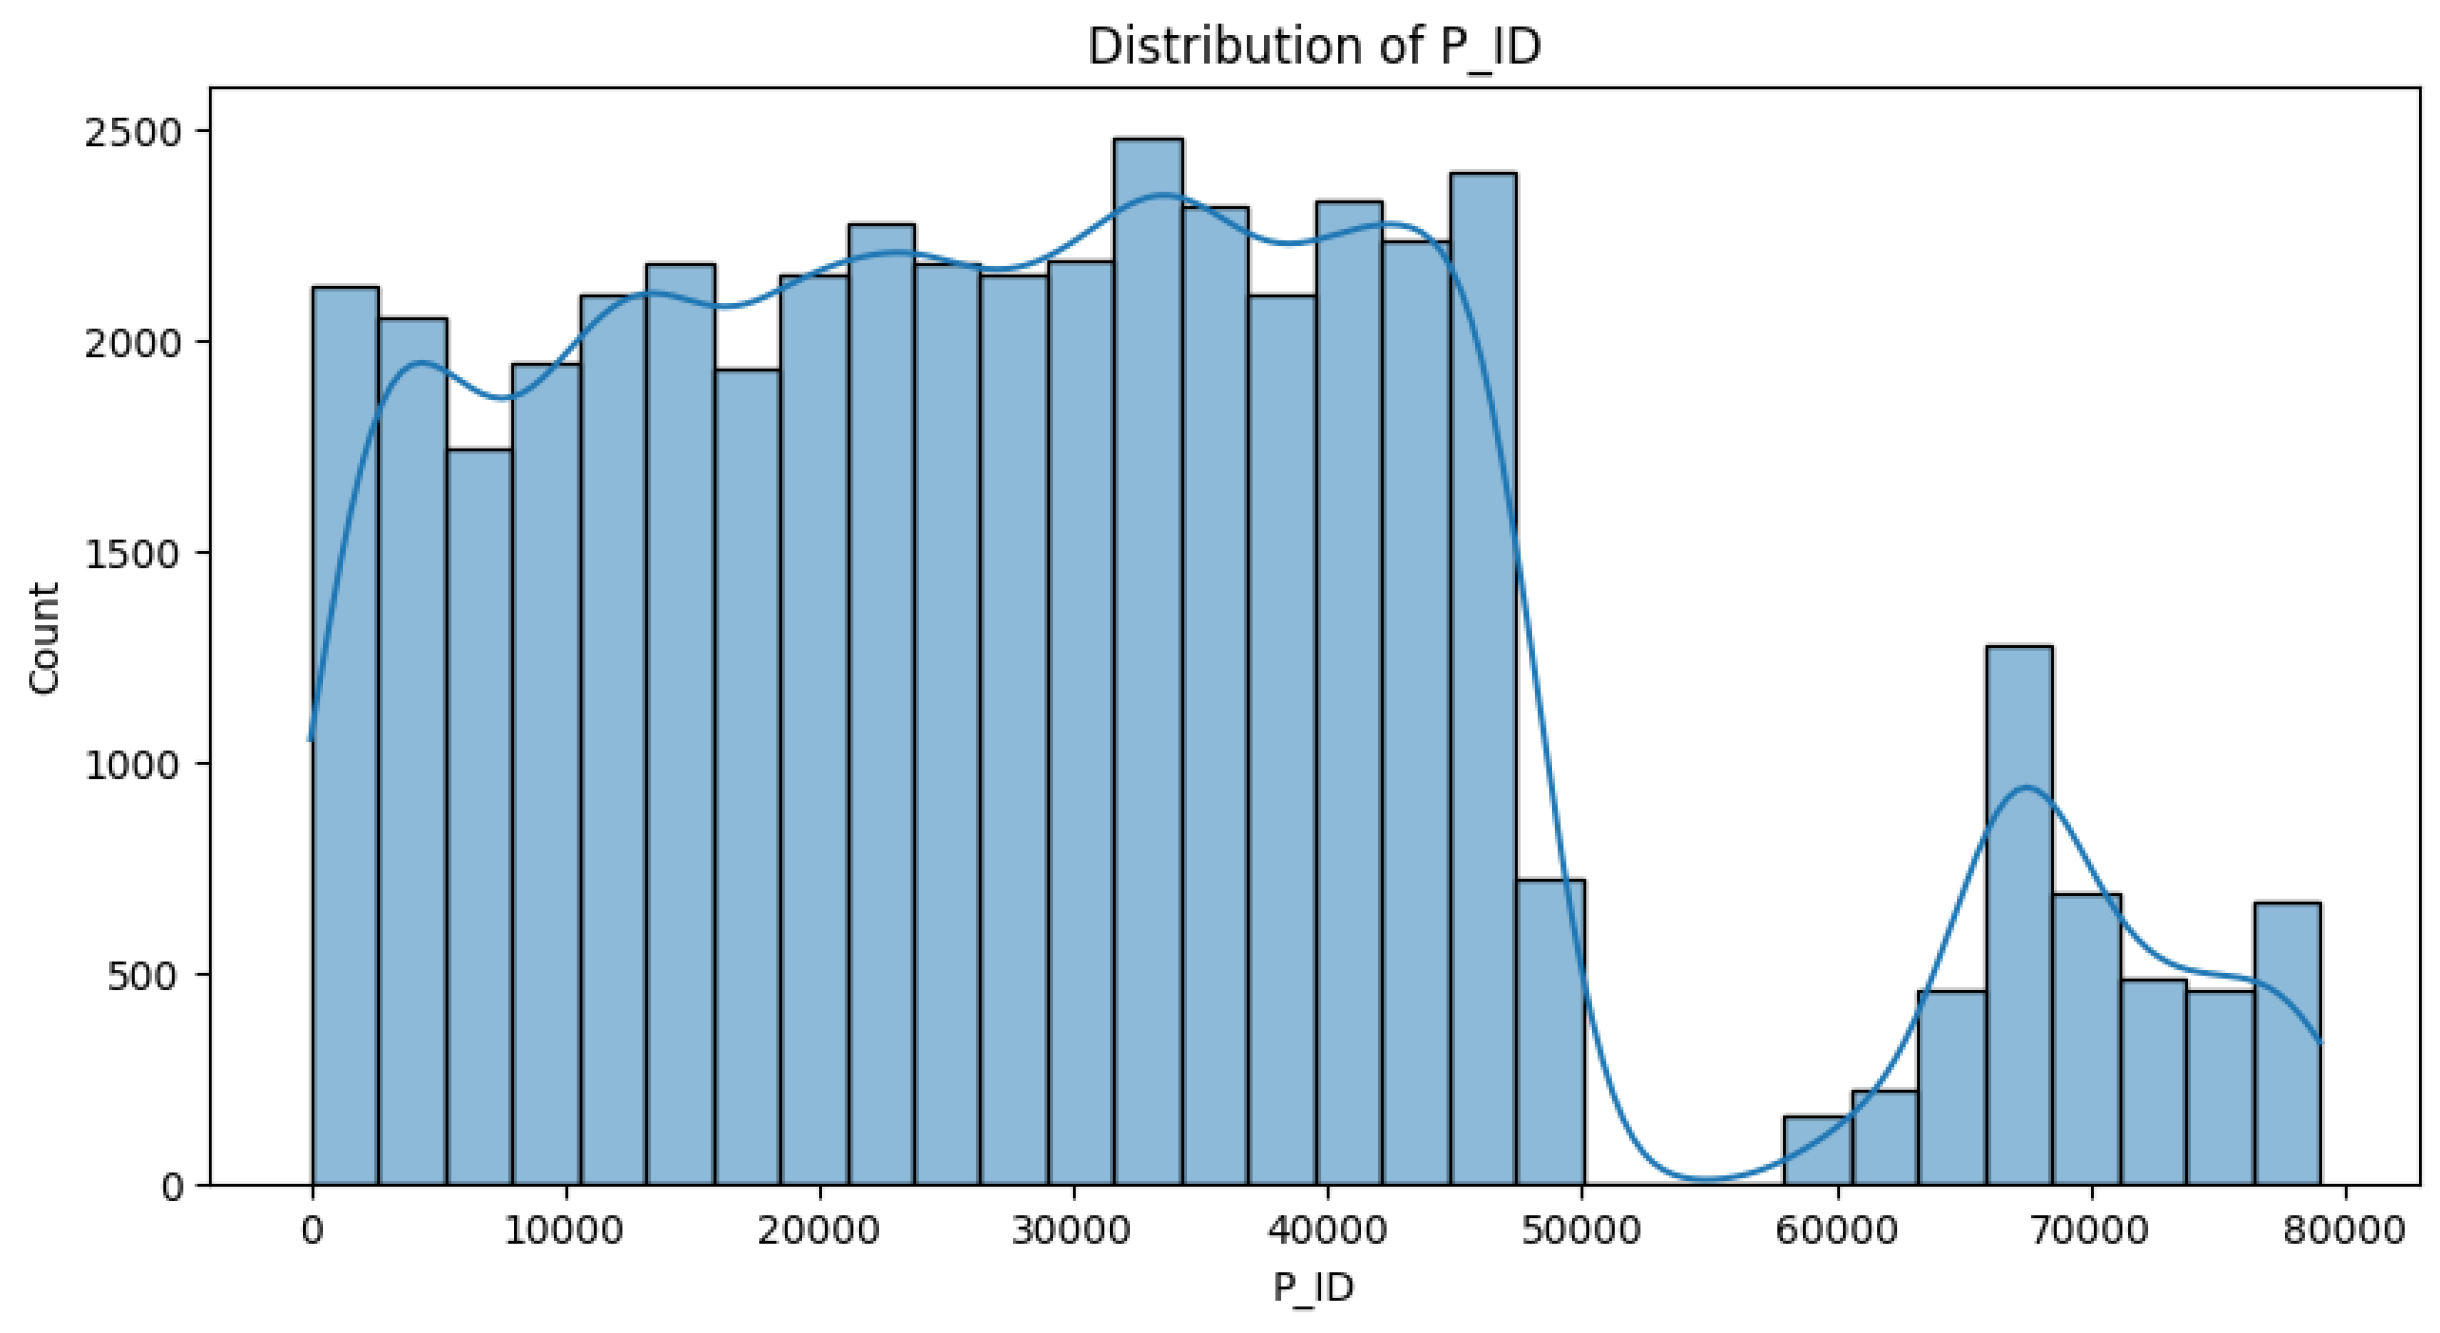
Figure 2.
Distribution of Property Classes.
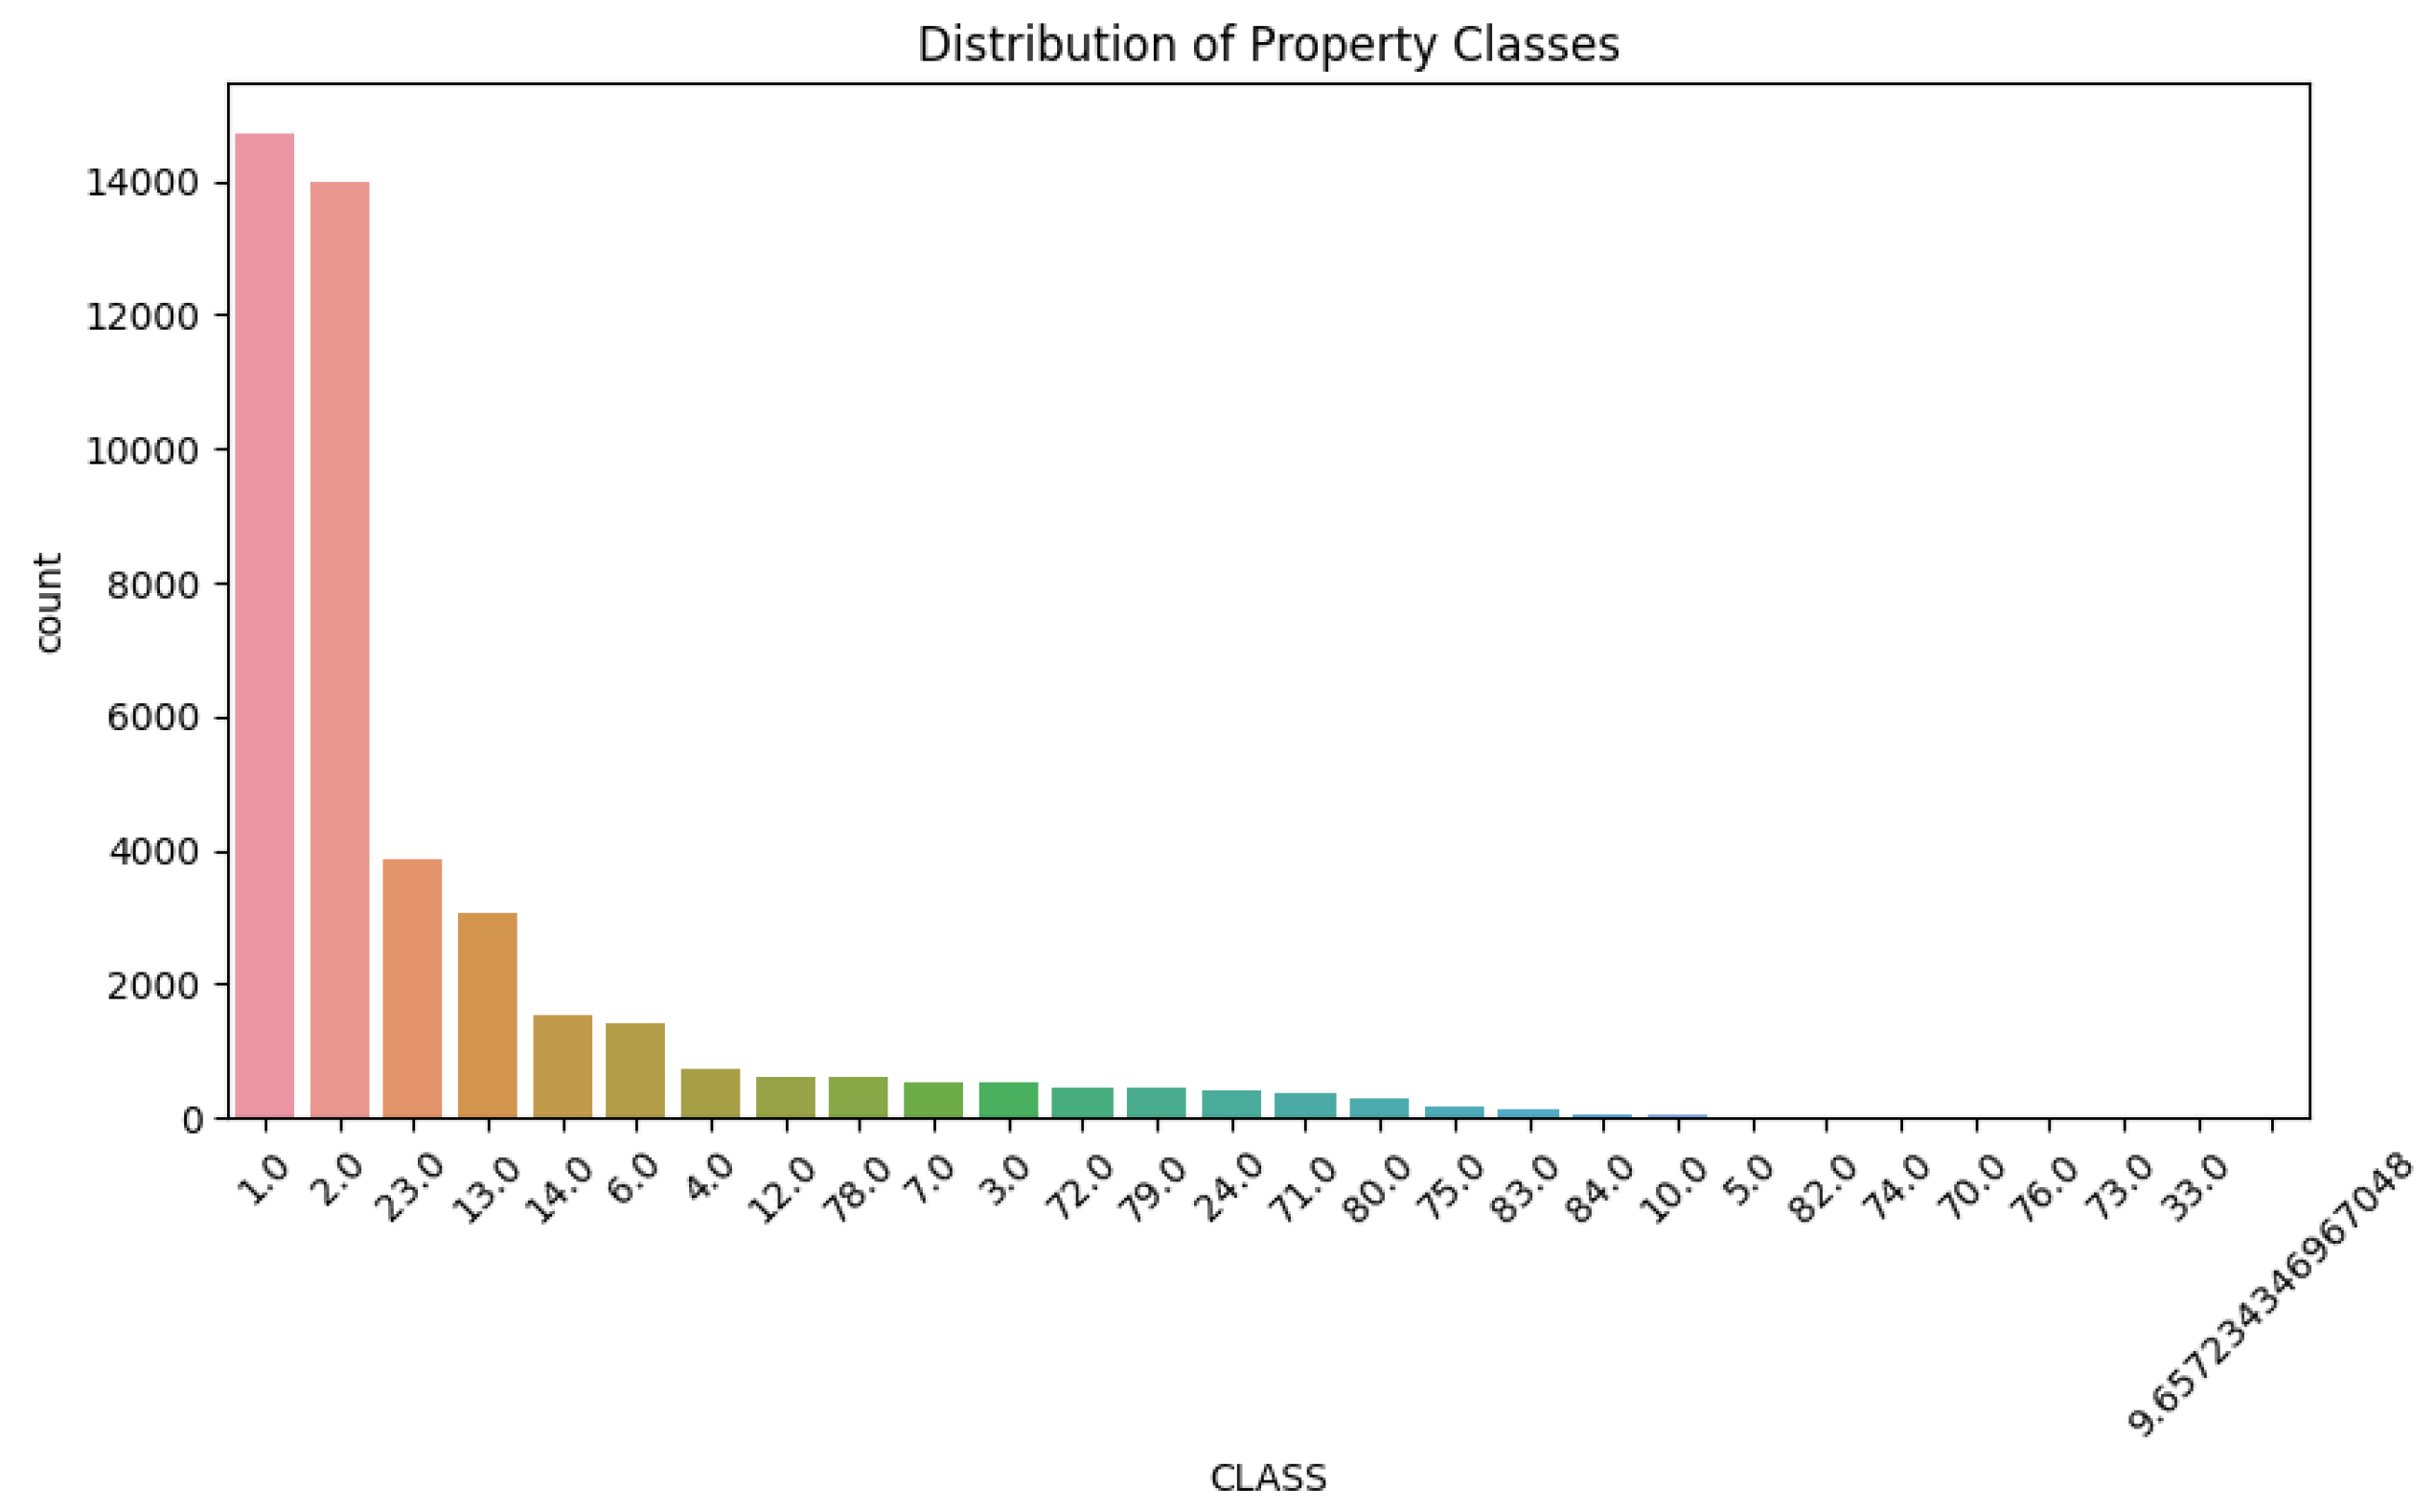
Figure 3.
Correlation Heatmap.
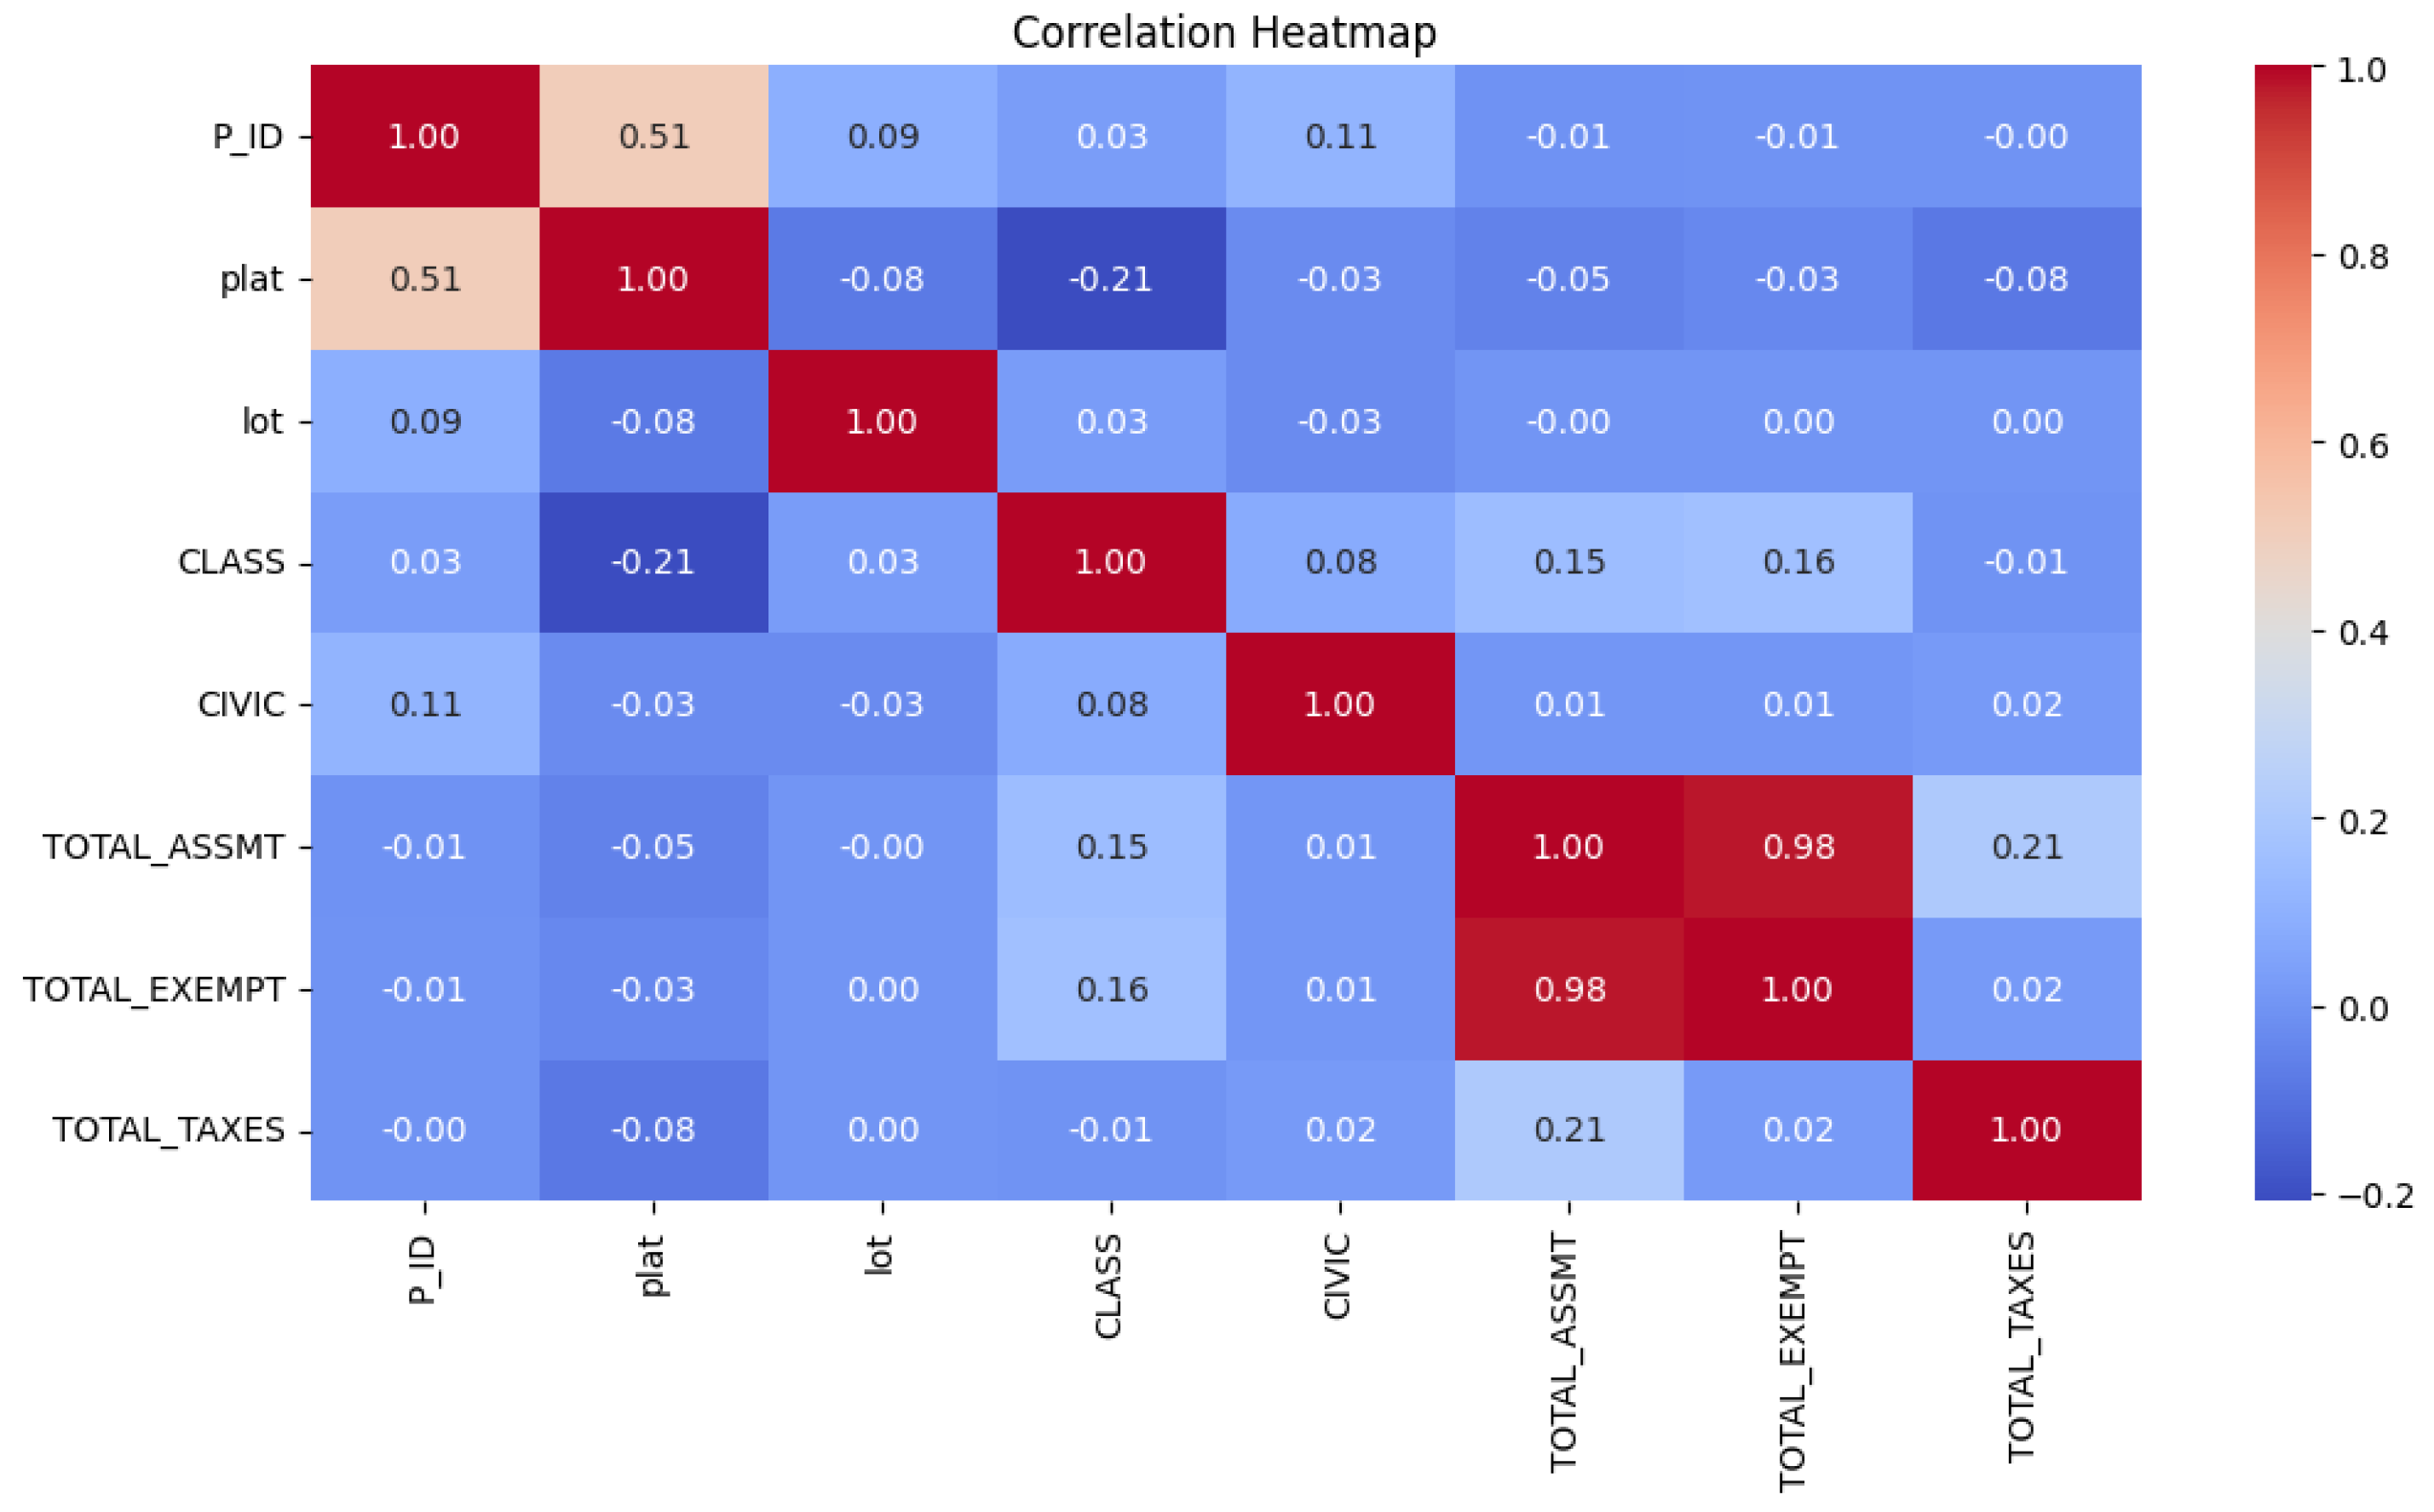
Table 3.
Model Performance Metrics.
| Model | Accuracy | Precision | Recall | F1-score | Time(s) |
| Random Forest | 0.892 | 0.875 | 0.868 | 0.871 | 12.45 |
| XGBoost | 0.901 | 0.893 | 0.882 | 0.887 | 8.76 |
| SVM | 0.845 | 0.832 | 0.828 | 0.83 | 15.32 |
| Logistic Regression | 0.812 | 0.798 | 0.795 | 0.796 | 5.43 |
Disclaimer/Publisher’s Note: The statements, opinions and data contained in all publications are solely those of the individual author(s) and contributor(s) and not of MDPI and/or the editor(s). MDPI and/or the editor(s) disclaim responsibility for any injury to people or property resulting from any ideas, methods, instructions or products referred to in the content. |
© 2025 by the authors. Licensee MDPI, Basel, Switzerland. This article is an open access article distributed under the terms and conditions of the Creative Commons Attribution (CC BY) license (https://creativecommons.org/licenses/by/4.0/).
Copyright: This open access article is published under a Creative Commons CC BY 4.0 license, which permit the free download, distribution, and reuse, provided that the author and preprint are cited in any reuse.


