Submitted:
17 June 2025
Posted:
17 June 2025
You are already at the latest version
Abstract
As network infrastructure and IoT technologies continue to evolve, immersive systems such as virtual reality (VR) are becoming increasingly integrated into interconnected environments. These advancements enable the transmission and processing of vast amounts of multimodal data in real time, enhancing user experiences through rich visual and 3D interactions. However, ensuring continuous user authentication in VR environments remains a significant challenge. Therefore, an effective user monitoring system is needed to track VR users in real time and trigger re-authentication when necessary. Based on this premise, we propose a multi-model authentication framework that combines eye-tracking data and biometric information named Mobilenetv3pro. Using the MobileNetV3 model, we extract and classify eye region features, while an CNN-based model processes sequential behavioral data. Authentication performance is measured through Equal Error Rate (EER), accuracy, Recall, F1-score, model size and inference time. Experimental results show that eye-based authentication using MobileNetV3pro achieves a lower EER (0.03) compared to baseline models, demonstrating its effectiveness in VR environments.
Keywords:
continuous authentication
; virtual reality
; eye-tracking
; biometric authentication
; MobileNetV3
; machine learning
1. Introduction
Virtual reality (VR) authentication is the process of verifying a user’s identity in a virtual environment to prevent unauthorized access and protect user privacy and data security [1]. As VR technologies become increasingly integrated into IoT ecosystems, spanning sectors such as gaming, education, healthcare, and remote industrial training. Therefore, the need for secure and seamless authentication mechanisms is more pressing than ever. A robust authentication not only safeguards sensitive user data but also protects against identity spoofing and enhances user experience across distributed, networked devices [2].
Traditionally, authentication methods rely on passwords, security tokens, or biometric identification [3]. However, in a fully immersive VR environment, these methods become impractical. Typing passwords, entering codes, or using physical tokens disrupts immersion and may introduce usability challenges. To address these limitations, researchers have explored biometric authentication methods, such as voice recognition, facial recognition, gesture tracking, and even eye movement analysis [4,5,6,7]. Among these, eye-tracking-based authentication has emerged as a promising solution due to its unobtrusiveness and compatibility with modern VR headsets [8,9].
Despite the advantages of biometric authentication, continuous authentication (CA) goes a step further by monitoring the user’s identity throughout the VR session rather than relying on a single authentication step. This approach enhances security by preventing unauthorized access even after initial login, mitigating risks such as session hijacking and unauthorized takeovers[10]. However, challenges remain, including privacy concerns, real-time computational efficiency, and user acceptance of biometric data usage in VR headsets.
This paper explores continuous authentication in VR, focusing on eye region features and behavioral patterns for real-time identity verification. We discuss existing VR authentication methods, propose a multi-modal authentication framework, and evaluate its effectiveness using MobileNetV3 for eye-based authentication. The rest of the paper is organized as follows: Section 2 reviews related work on VR authentication, Section 3 introduces the proposed continuous authentication methods, Section 4 presents experimental design and evaluation, Section 5 discusses challenges and future directions, and Section 6 concludes the study.
2. Literature Review
Virtual reality (VR) authentication refers to the process of verifying a user’s identity before granting access to a VR system or application. As VR technology continues to evolve and gain popularity across various sectors such as gaming, education, healthcare, and professional training, the need for secure and effective authentication methods becomes increasingly vital. VR authentication helps to protect users’ privacy, secure sensitive data, and ensure that only authorized individuals can access VR environments.[1] It plays a critical role in safeguarding the virtual reality space, enhancing the user experience, and building trust in these emerging technologies.[2,3]
In the early exploration of VR authentication mechanisms, Yu [11] conducted an investigation into the feasibility of implementing various authentication systems within a VR environment. Building on these initial insights, George [12] extended the investigation by adapting PIN and Android unlock patterns for use in VR. They evaluated these systems for their usability and security, focusing on the distinct nature of VR’s private visual channel—where users are immersed in the virtual world, making it more difficult for unauthorized observers to view the authentication process.
Some researchers have taken a more novel approach to VR authentication, proposing unique methods that take full advantage of VR’s immersive capabilities [13,15]. Mann [14] presented RubikAuth, an innovative VR-based authentication scheme that uses 3D models for user verification. Traditional authentication methods by using passwords to log in to the VR can be easily stolen by attackers. Some researcher focus on the biometric authentication . R.Miller[16] use Siamese neural networks to learn a distance function that characterizes the systematic differences between data provided across pairs of dissimilar VR systems. Their approach provides an Average Equal Error Rate (EERs), the value ranges from 1.38% to 3.86% when benchmarks are used for a certification containing a dataset of 41 users performing pitching tasks. There are three VR systems – an Oculus Quest, an HTC Vive, and an HTC. A lively universe is used for comparison with previous VR biometric methods. The average accuracy of the recognition task is also obtained, where Given the trajectory of the user in the VR system at the time of use, they use The Siamese network returns the user with the most matching trace Use the VR system as the tag. The result showed that the average improvement was from 87.82% to 98.53% 29.78%±8.58% and 30.78%±3.68%, respectively. It uses universal distance matching and fully convolutional networks separately on the registration dataset. [17] proposed a biometric system that will be watching the user’s behavior as a unique and distinctive feature teristic. In particular, they focused on the head orientation of the user’s gaze behavior as it followed the moving stimulus. They validated the methods of user research. The results of the hybrid post hoc analysis were interpretable machines with a recognition accuracy of up to 75% for the learning algorithm and up to 100% for the deep learning method. [18] found that the user’s unique head-movement patterns in response to an external audio stimulus. They proposed a unique head movement-based authentication to authenticate users with an average true acceptance rate of 95.57% while keeping the average false acceptance rate of 4.43%. And the overall processing latency on Google Glass is around 1.9 seconds. Not only the head, but also [19] showed that head, hand, and/or body movement patterns displayed when users freely interact with VR applications, which contain user-specific information that can be exploited for user authentication.
Voice-based authentication in virtual reality (VR) involves using voice recognition technology to verify users’ identities within VR environments. This method leverages unique voice characteristics, making it convenient and hands-free, ideal for immersive VR experiences. Key advantages include increased security and user convenience, as users can authenticate without removing VR headsets[20,21]. [22] leverages internal body voice, which involves capturing the voice vibrations transmitted through the user’s body, making it difficult for attackers to replicate. This method provides a higher level of security as it ensures that the voice input is genuinely from the user wearing the headset. Experimental results show that this system can successfully defend against various attacks with an accuracy of at least 98%, significantly enhancing the security of voice-based authentication in AR environments.[23] discusses various input systems for authentication in VR, including voice recognition. It highlights the challenges and solutions in developing authentication methods that are both secure and user-friendly in the context of VR and AR head-mounted displays (HMDs). The research focuses on usability and security, evaluating different interaction methods like voice control, head movement, and touch controls for entering responses to authentication challenges. [24]evaluates the effectiveness of voice biometrics for identification and authentication, analyzing the accuracy and reliability of voice recognition technology. It addresses factors like background noise, distance from the microphone, and the length of the authentication speech. The study concludes that while voice biometrics show promise, they are often more effective when combined with other authentication methods such as facial recognition or passwords for enhanced security.
Although most VR headsets don’t have eye-tracking sensors, in recent years more and more VR headsets have started to use eye-tracking systems to help VR perform better[26,27,28,29,30]. Recently, [25] noted that gaze-based authentication systems either suffer from high error rates or require long authentication times. Using a gaze tracking device, they build a prototype system and perform a series of systematic user experiments with 30 participants from the general public. They investigate the performance and security guarantees under several different attack scenarios and showed that their system surpasses existing gaze-based authentication methods both in achieving equal error rates (6.3%) and significantly lower authentication times (5 seconds). This year, [26] also presents a study for the incorporation of dynamic saccadic features into a model of eye movement-driven biometrics. They tested on a large database of 322 subjects, and the biometric accuracy presents a relative improvement in the range of 31.6–33.5% for the verification scenario, and in the range of 22.3–53.1% for the identification scenario. More importantly, this improvement was demonstrated for different types of visual stimulus (random dot, text, video), indicating the enhanced robustness offered by the incorporation of saccadic vigor and acceleration cues. For the authentication eye-tracking sensors applied in VR, many researchers [8] found that pursuits are robust against different sizes of virtual 3D targets. However, performance improves when the trajectory size (e.g., radius) is larger, particularly if the user is walking while interacting. While walking, selecting moving targets via Pursuits is generally feasible albeit less accurate than when stationary.
Previous work is focusing on the eye tracking sensors, [9] has created a real-time eye movement-driven authentication system for virtual reality devices. And described the architecture of the system and provide a specific implementation that is done using the FOVE head-mounted display. [13] presented that users’ data can be used as high-confidence biometric discriminators using machine learning classification methods such as kNN, thus adding a layer of security in identification, or dynamically adjusting the VR environment to user preferences. They also performed white-box penetration tests on 12 attackers, some of whom were physically similar to the participants. After the preliminary study, they can obtain average recognition confidence of 0.98 from the test data of actual participants, and the classification accuracy of the trained model is 98.6%. Penetration tests show that the confidence of all attackers is less than 50%, although physically similar attackers have higher confidence levels. These findings are helpful for the design and development of secure virtual reality systems.[6] aims to explore and analyze the potential of using gaze-based authentication as a secure method for user identification in VR settings.
[32]presents a real-time system that continually authenticates users in VR by monitoring their motion trajectories during interactions. The system captures data from VR controllers and headsets, analyzing movement patterns to ensure the identity of the user remains consistent throughout the session. This continuous authentication approach enhances security by promptly detecting any unauthorized user attempting to take over the VR session. [33]analyzes the effectiveness of behavior-based biometric authentication across different VR systems. It focuses on how user behavior, such as hand movements and interaction patterns, can be used to authenticate users within a single VR system and across multiple systems. The paper evaluates various machine learning algorithms to classify and authenticate users based on their unique interaction behaviors. [31]discusses a system that uses motion forecasting to authenticate users in VR based on their behavior. The system leverages users’ motion trajectories (e.g., movements of the VR headset and controllers) to predict future actions and use these predictions for authentication. This approach improves security by relying on unique behavioral patterns that are difficult to replicate. The research highlights the use of deep learning techniques such as convolutional neural networks (CNNs) and Siamese networks to enhance the accuracy and reliability of the authentication process.
Most current research in VR authentication has focused on traditional password systems, body movement tracking, and eye-tracking sensors as individual methods for verifying user identities. However, a more secure and efficient solution could emerge from combining these approaches. [34] proposed a decentralized identifier in metaverse to prove their identities without exposing sensitive information, while ensuring resistance to common security threats through formal security analysis. One such multi-attribute authentication system was proposed by Wang [35] to counter the “Man-in-the-Room” (MITR) attack in VR environments. MITR attacks refer to scenarios where an attacker physically enters the VR environment, attempting to access a user’s sensitive data by observing or manipulating their authentication process.
In summary, VR authentication is an evolving field with several promising approaches, including 3D login systems, eye tracking, and gaze tracking. While these methods offer various advantages, significant challenges remain in ensuring fast, secure, and seamless authentication.
3. Continuous Authentication Methods in VR
The system is designed to simulate VR user authentication by utilizing the VRBiom dataset to predict user identity. It enables real-time verification based on biometric data, ensuring secure and seamless authentication without requiring re-authentication upon user change detection.
3.1. VRBiom Data
To evaluate our proposed continuous authentication system in VR, we utilize the VRBiom dataset [36], which, to the best of our knowledge, is the first periocular presentation attack detection (PAD) dataset collected using head-mounted display (HMD) devices such as the Meta Quest Pro. This dataset provides high-quality Near-Infrared (NIR) periocular images, making it well-suited for biometric authentication and security studies in VR environments. Fig Figure 1 shows a sample of the eye region images.
Since the HMD closely fits around the user’s head, the dataset was collected under controlled conditions. Each identity, whether bona fide (genuine users) or presentation attacks (PAIs), was recorded within a single session. Each recorded sample includes two sub-samples, corresponding to left and right eye images captured by the NIR cameras of the Meta Quest Pro. During bona fide data collection, participants were first informed about the study and signed a consent form. Each subject was recorded under two conditions: with and without glasses, as shown in Figure X. For each condition, the subject maintained three gaze states: steady gaze, moving gaze, and partially closed eyes. Each video recording lasted approximately 10 seconds at 72 FPS, resulting in sequences of about 650 frames after discarding overexposed initial frames. The spatial resolution of each frame is 224 X 224 pixels.
To simulate presentation attacks, PAIs were used to create a diverse attack dataset. The attacks included rigid masks with real eyes, rigid masks with fake 3D eyeballs, generic flexible masks with printed synthetic eyes, and custom flexible masks with fake 3D eyeballs. Additionally, print-based attacks using bona fide images, as well as auxiliary elements such as fake eyeballs, eyelashes, and glasses, were incorporated to enhance realism and variability. Table X summarizes the different types of PAIs used, while Figure Y presents sample images from both bona fide and attack sessions. This dataset enables us to evaluate the robustness of our continuous authentication model against both genuine and spoofed identities, particularly in VR-based biometric authentication scenarios.

Table 1.
Summary of attack types and bona-fide samples.[36]
Table 1.
Summary of attack types and bona-fide samples.[36]
| Type | Subtype | # Identities | # Videos | Attack Types |
|---|---|---|---|---|
| Bona-fide | Steady gaze, moving gaze, glass, no glass |
25 | 900 | – |
| Mannequins | 2 | 7 | Own eyes | |
| Custom rigid mask | 3 | 10 | Own eyes | |
| Attacks | Custom rigid mask | 4 | 14 | Fake 3D eyeballs |
| Generic flexible masks | 5 | 20 | Print attacks | |
| Custom silicone masks | 6 | 16 | Fake 3D eyeballs | |
| Print attacks | 7 | 25 | Print attacks |
3.2. Data Pre-Processing and Feature Extraction
The dataset comprises video recordings of 25 bona fide subjects, captured under controlled conditions. Each subject participated in 36 recording sessions, which include variations across three gaze scenarios, two conditions (with and without glasses), and three repetitions from both the left and right cameras. In total, 900 bona fide videos were collected.
To generate attack samples, we selected a near-frontal frame from both the with-glasses and without-glasses recordings of each subject. This frame was printed using a high-resolution laser printer (visible in the near-infrared spectrum) to create print attacks. For each eye (left and right), we recorded three attack attempts, both with and without glasses, resulting in 300 attack videos.
Additionally, we collected presentation attacks (PAs) using different instruments, with each attack type recorded three times under both glasses and no-glasses conditions. Specifically:
7 mannequin identities were used, leading to (7 × 3 × 2 =) 42 videos. Two types of rigid masks (one with real eyes, one with fake 3D eyeballs) contributed 120 and 168 videos, respectively. Flexible masks with either printed eyes or 3D eyeballs resulted in 240 and 192 videos, respectively. To ensure a balanced dataset for Presentation Attack Detection (PAD) assessment, we designed an experimental protocol that partitions the dataset into training, validation, and test sets. These partitions are identity-disjoint, ensuring that subjects in one set do not appear in another. Each partition contains approximately one-third of the total dataset.
For frame selection, we applied uniform sampling, extracting every 10th frame from each video. This process ensures that each frame is treated independently, without considering temporal correlations between consecutive frames. Video-based PAD detection, which utilizes temporal patterns, is beyond the scope of this study. At the frame level, the dataset is divided as follows:
Training partition: 68394 frames from 1002 videos. Validation partition: 40080 frames from 448 videos (with unique identities distinct from training). Test partition: 34478 frames from 432 videos (including both bona fide and attack samples). A manual inspection was conducted to remove erroneous samples caused by recording artifacts or technical glitches. Figure X provides examples of bona fide frames, while Figure Y illustrates various attack types.
3.3. Model Design and Training
In this study, we adopt MobileNetV3-Large as the backbone model due to its efficiency and strong feature extraction capabilities. MobileNetV3 is a lightweight CNN designed for mobile and edge applications, incorporating squeeze-and-excitation (SE) modules, hard swish activations, and an optimized depthwise separable convolution structure to enhance both accuracy and computational efficiency.
To improve the model’s performance in Presentation Attack Detection (PAD), we introduce several modifications: To capture more fine-grained spatial details, we integrate an extra convolutional block before the classification head. This block consists of two 3×3 convolutional layers, each followed by Batch Normalization and ReLU activation. This addition helps in refining discriminative features crucial for distinguishing bona fide samples from attacks. To further enhance feature representation, we incorporate Channel Attention (SE module) in the additional CNN layers. This mechanism selectively emphasizes the most relevant feature channels, improving the model’s robustness to variations in illumination and occlusion (e.g., glasses, masks). Instead of using the default fully connected layer, we replace it with a global average pooling (GAP) layer, followed by a dropout layer (p=0.3) to mitigate overfitting. The final fully connected layer outputs a single logit, which is passed through a sigmoid activation function for binary classification.
3.4. Optimization
Through the analysis of training and testing data, we observed a noticeable decline in the model’s predictive performance when dealing with blurred images and highly illuminated images. The model struggles to extract discriminative features under these challenging conditions, leading to increased misclassification rates. This performance degradation suggests that variations in image clarity and lighting conditions significantly impact the model’s ability to generalize effectively.
Figure 2 shows the highlight image affecting prediction accuracy. During testing, it was observed that the MobileNetV3 model’s prediction accuracy degrades when exposed to certain visual distortions in the input images. Specifically, images affected by motion blur or defocus blur tend to reduce the model’s ability to accurately extract discriminative features from the eye region. Furthermore, the presence of strong light sources or specular highlights (e.g., light spots or glare) in the image often leads to inaccurate feature extraction or incorrect classification, likely due to overexposed regions masking critical visual cues. These factors introduce challenges in real-world environments where lighting and motion cannot be consistently controlled, particularly in mobile or wearable VR systems. To improve the accuracy of our MobileNetV3-based classification model, we implemented several optimization strategies, including network architecture refinement, training adjustments, and data handling techniques.
The original model used a Flatten layer followed by fully connected layers with dropout. To enhance generalization and reduce overfitting, we replaced Flatten with GlobalAveragePooling2D, which reduces the number of trainable parameters while preserving spatial information. Additionally, we introduced BatchNormalization after each dense layer to accelerate convergence and stabilize training. The dropout rate was also adjusted to 0.3 to prevent excessive feature loss. Initially, we only trained the last 10 layers of MobileNetV3. To allow the model to learn more task-specific features, we expanded the training scope to the last 30 layers. This strategy enables the network to adapt deeper feature representations while still leveraging the pretrained weights from ImageNet. Fine-tuning modifies the trainable parameter set:
where:
- represents parameters in layers frozen to retain pretrained ImageNet features.
- corresponds to parameters in fine-tuned layers.
Expanding from to allows deeper feature adaptation while leveraging pretrained representations. The parameter update follows:
where is the learning rate. Increasing k enables the model to extract higher-level domain-specific features while maintaining generalizable representations from ImageNet.
A fixed learning rate may cause suboptimal convergence. To dynamically adjust the learning rate, we integrated ReduceLROnPlateau, which reduces the learning rate by a factor of 0.5 when validation loss stagnates. This approach helps the model escape local minima and improves final accuracy. A fixed learning rate may cause suboptimal convergence. To dynamically adjust the learning rate, we integrated ReduceLROnPlateau, which reduces the learning rate by a factor of when validation loss stagnates:
where:
- is the learning rate at epoch t.
- is the validation loss at epoch t.
- p is the patience parameter, controlling the number of epochs before reducing the learning rate.
- is the reduction factor, typically set to .
This approach helps the model escape local minima and improves final accuracy. MobileNetV3pro utilizes depthwise separable convolutions and hard Swish activation, making it sensitive to gradient magnitudes. Weighted loss affects optimization by modifying gradients:
This adjustment ensures:
- Higher gradient contribution from minority classes.
- Balanced parameter updates, reducing bias towards majority classes.
- Improved recall for underrepresented classes.
To address issues caused by variations in lighting and reflections from eyeglasses, we applied extensive data augmentation. Using ImageDataGenerator, we introduced random brightness adjustments, rotation, width and height shifts, zooming, and horizontal flips. These transformations improve the model’s ability to generalize across diverse real-world conditions. Instead of using standard binary cross-entropy or focal loss, we implemented Accuracy Loss to directly optimize the model’s classification accuracy. This loss function penalizes incorrect predictions explicitly and provides intuitive feedback for training. It is particularly effective under challenging conditions such as extreme lighting, where misclassifications are more likely.
The Accuracy Loss is defined as:
where is an indicator function that equals 1 if the predicted label matches the ground truth label , and 0 otherwise. N is the total number of samples. By minimizing this loss, the model is trained to maximize its overall accuracy. Since the indicator function is non-differentiable and cannot be used directly in gradient-based optimization, ances classes and reduce the impact of easy examples. By incorporating these improvements, we significantly enhanced the model’s robustness and accuracy in classifying eye region images under challenging conditions. These strategies collectively addressed overfitting, improved feature extraction, and increased resilience to real-world variations.
3.5. Adversarial Training with PGD Attacks
To improve model robustness against adversarial perturbations and privacy-preserving noise, we incorporated adversarial training based on the Projected Gradient Descent (PGD) method. For each mini-batch, adversarial examples were generated by iteratively applying small perturbations to the input samples x, guided by the loss gradient. The PGD update rule is defined as:
where is the step size, is the perturbation bound, denotes the loss function, and projects the perturbed input back to the -ball centered at the original input.
During training, each batch consisted of both clean and adversarial samples, with a fixed ratio (e.g., 70% clean and 30% adversarial). This strategy enabled the model to learn more generalized and robust feature representations, improving its performance under both Laplace Differential Privacy (LDP) noise and adversarial attacks.
4. Experiments
4.1. Experimental Set Up
To evaluate the performance of our proposed model, MobileNetV3Pro, we compare it with four widely used models: ResNet-50, ResNet-101, MobileNet, and MobileNetV3. The evaluation focuses on two key metrics: Equal Error Rate (EER) and accuracy, assessing each model’s effectiveness in VR user authentication. Additionally, we plot the Receiver Operating Characteristic (ROC) curve for each model to visualize their performance in distinguishing between genuine users and impostors. The ROC curve helps analyze the trade-off between the true positive rate (TPR) and false positive rate (FPR) across different threshold values.
4.2. Evaluation Metrics
To compare the performance of our improved MobileNetV3 model against ResNet50, ResNet101, MobileNet, and standard MobileNetV3, we employ the following evaluation metrics:
- Accuracy: Measures the overall correctness of predictions:where , , , and denote true positives, true negatives, false positives, and false negatives, respectively.
-
EER: Commonly used in biometric authentication, it is the point where the false acceptance rate (FAR) and false rejection rate (FRR) are equal:Lower EER values indicate better biometric authentication performance.
-
Area Under the Curve (AUC-ROC): Evaluates the trade-off between true positive rate and false positive rate:Higher AUC values indicate better classification performance.
-
F1-score:is the harmonic mean of precision and recall, providing a balanced measure of a model’s performance:where:Higher F1 scores indicate a better balance between precision and recall.
- Model size:refers to the total storage required for the trained model, measured in megabytes (MB). Smaller models are more efficient for deployment on edge devices like VR headsets.
-
Inference time: measures the average time required for a model to make a single prediction:It is usually measured in milliseconds (ms). Lower inference time indicates faster model execution, which is crucial for real-time applications.
These metrics comprehensively assess our model’s effectiveness in classification tasks, ensuring a fair comparison with other architectures.
4.3. Adversarial Attack
In this study, we employed the Projected Gradient Descent (PGD) attack to evaluate the robustness of our biometric verification model against adversarial examples. PGD is one of the most powerful and widely-used first-order adversarial attack methods. It generates perturbations by iteratively applying small gradient-based updates within a defined perturbation bound, thereby crafting adversarial inputs that remain imperceptible to human vision but can deceive neural networks.
The primary motivation for using PGD is its ability to simulate strong and realistic adversarial threats. Unlike simpler attacks such as FGSM, PGD performs multi-step optimization, making it a more rigorous and comprehensive benchmark for model robustness. This allows us to assess how well the model can maintain its verification performance in the presence of adversarial noise, which is crucial for real-world applications where system security and reliability are essential.
Moreover, integrating PGD attacks during training (i.e., adversarial training) can help improve model generalization and resilience by exposing the model to challenging examples, effectively reducing its vulnerability to unseen attacks. Therefore, PGD serves both as a robustness evaluation tool and a regularization mechanism for enhancing model security.
Let x be the original input, y the true label, the loss function (e.g., cross-entropy), the maximum perturbation, the step size, and T the number of iterations. The PGD attack generates an adversarial example as follows:
where:
- denotes the projection operator onto the -ball of radius centered at x,
- is the element-wise sign function,
- is the gradient of the loss with respect to the input.
This formulation illustrates the iterative nature of the PGD attack, where the adversarial example is gradually refined over multiple steps. The process begins with a small random initialization within the allowed perturbation region to avoid gradient masking. In each step, the adversarial example is updated in the direction that maximally increases the model’s loss using the sign of the gradient. The projection operator ensures that the updated input remains within the ball of radius , maintaining perceptual similarity to the original input. By repeating this process T times, PGD creates strong adversarial examples that are more effective than one-step attacks like FGSM. This makes PGD a powerful tool for evaluating model robustness and training models to resist adversarial perturbations through adversarial training.
4.4. Results and Evaluation
4.4.1. Quantitative Results
To evaluate the performance of our proposed model, we conducted experiments on VRBiom using five different architectures: ResNet-50, ResNet-101, MobileNet, MobileNetV3, and our proposed model. The evaluation was performed using EER and AUC as key performance metrics, which are widely used for biometric authentication systems.
Table 2 presents a comprehensive performance comparison of various deep learning models in terms of EER, AUC, F1-Score, model size, and inference time. The results clearly highlight the superior performance of our proposed model, MobilenetV3pro, which achieves the best overall trade-off between verification accuracy and computational efficiency.
Among all models, MobilenetV3pro achieves the lowest EER (3.00%), highest AUC (95.17%), and the highest F1-Score (94.79%), demonstrating its strong discriminative power and robustness. In contrast, deeper models such as ResNet-50 and ResNet-101 suffer from higher EERs (16.08% and 22.45%, respectively) and lower AUCs (83.89% and 80.30%), indicating their limitations in handling fine-grained biometric data, particularly in data-constrained scenarios.
Lightweight baselines like MobileNet and MobileNetV3 show competitive performance with EERs of 3.68% and 15.15%, respectively. However, MobilenetV3pro still outperforms them in all evaluation metrics. Compared to MobileNetV3, it reduces EER by 12.15 percentage points and increases AUC by 7.34 points. While MobileNet achieves a comparable AUC (95.90%), its slightly higher EER (3.68%) and larger model size (16.75 MB) make it less efficient overall.
In terms of model complexity, MobilenetV3pro has the smallest size (13.82 MB), significantly smaller than ResNet-50 (91.98 MB) and ResNet-101 (164.32 MB), and even lighter than MobileNetV3 (15.35 MB). It also achieves the fastest inference time (159.43 ms), making it especially well-suited for real-time biometric verification in resource-constrained environments such as VR headsets or mobile devices.
Figure 3 illustrates the Receiver Operating Characteristic (ROC) curves of six evaluated models, highlighting their TPR against the FPR at various decision thresholds. These visualizations offer an intuitive perspective on each model’s discriminative power and corroborate the quantitative findings presented in Table 2.
As shown in the figure, the ROC curve for the Proposed Model consistently lies above those of the baseline models, reflecting its superior verification performance. The area under the ROC curve for the Proposed Model is the highest among all, indicating its strong capability in distinguishing between genuine and impostor samples across a range of thresholds.
In comparison, ResNet-50 and ResNet-101 exhibit shallower curves, with noticeably lower AUCs and higher EERs, suggesting limited robustness and a tendency to misclassify samples, particularly under varying biometric inputs. MobileNet and MobileNetV3 perform better than the ResNet architectures, with more favorable ROC curves. However, the MobileNetV3 curve shows a broader variance, which aligns with its wider EER range reported in the table.
Overall, the ROC curve analysis reinforces the quantitative evaluation results and confirms that the Proposed Model not only maintains a low false positive rate but also achieves high recall, making it highly effective and reliable for biometric verification tasks in resource-constrained environments. ResNet-101 is a deeper and more complex network than MobileNetV3, requiring a larger dataset to generalize well. If the dataset is relatively small, e.g. VRBiom, ResNet models might overfit, leading to higher EER. MobileNetV3, being a lightweight network designed for efficiency, can generalize better with limited data due to built-in architectural optimizations. ResNet-101 has significantly more parameters than MobileNetV3. If your dataset is not large enough, the model might learn noise instead of meaningful biometric features, leading to suboptimal performance. MobileNetV3, with depthwise separable convolutions and a reduced number of parameters, is more efficient in learning essential patterns while reducing overfitting risks. ResNet models extract high-level abstract features effectively in tasks like image classification but may not be as efficient for biometric verification, which requires fine-grained, subtle features from eye-region data. MobileNetV3 uses a combination of squeeze-and-excitation (SE) blocks, inverted residual connections, and lightweight convolutions, making it better suited for capturing discriminative details in small regions like the eye area. ResNet-101 requires more computations per forward pass, making it harder to train with limited resources, whereas MobileNetV3 is optimized for efficiency with techniques like non-linear activation (Swish) and automated architecture search. MobileNetV3 benefits from better training stability due to its optimized structure, improving generalization performance. MobileNetV3’s architectural efficiency, better feature selection mechanisms, and lightweight design likely contributed to its superior performance over ResNet models in your biometric verification task. ResNet-101, while powerful, may not be well-suited to your dataset due to overfitting, computational inefficiency, and suboptimal feature extraction for fine-grained eye-region analysis.
4.4.2. Ablation Study
To analyze the contributions of different components in our proposed model, we conducted an ablation study by systematically adding or removing key modifications, including weighted loss, fine-tuning more layers, and learning rate scheduling. Table 3 summarizes the results of these experiments in terms of EER and AUC.
Table 3 presents an ablation study illustrating the effect of various optimization techniques applied to the baseline MobileNetV3 model. The evaluation considers EER, AUC, F1-Score, model size, and inference time. The results clearly show that the performance of the baseline model can be significantly improved through targeted optimizations in both architecture and loss function design.
The unmodified MobileNetV3 model achieves an EER of 15.15%, an AUC of 87.83%, and an F1-Score of 80.31%. These baseline values reflect moderate performance, leaving substantial room for improvement, particularly in classification robustness and discriminative power.
Adding a weighted loss helps address class imbalance by penalizing minority class misclassifications more heavily. This adjustment slightly improves the F1-Score to 84.42%, though the EER remains relatively unchanged at 15.27%, and AUC even drops slightly to 85.40%. Nevertheless, inference time is reduced to 802.30 ms, and model size becomes more compact (13.82 MB), suggesting efficiency gains.
When applying fine-tuning to the last 30 layers, the model exhibits mixed effects. While inference time improves to 621.43 ms—demonstrating speed benefits from deeper tuning—the performance drops slightly with an EER of 17.54% and AUC of 84.22%, possibly due to overfitting or suboptimal learning without complementary strategies like loss function modification.
In contrast, the use of focal loss yields a substantial leap in verification accuracy. The EER drops sharply to 8.32%, AUC increases to 91.48%, and F1-Score rises to 90.64%. This suggests focal loss is particularly effective in emphasizing hard-to-classify examples, thereby enhancing the model’s robustness and reducing false positives.
Finally, integrating all three techniques—weighted loss, fine-tuning, and focal loss—results in the best overall performance. The model achieves an EER of just 3.00%, an AUC of 95.17%, and an F1-Score of 94.79%. Moreover, this configuration also delivers the fastest inference time (545.22 ms) and smallest model size (13.82 MB), demonstrating the efficiency and effectiveness of a well-rounded optimization strategy.
These results underline the complementary nature of architectural and loss-based enhancements. While focal loss individually contributes most to improving discriminative ability, its combination with weighted loss and deeper fine-tuning unlocks the full potential of MobileNetV3. This synergy boosts generalization, stabilizes learning, and enhances performance across all critical metrics for biometric verification.
4.4.3. PGD Attack Results
Table 4 summarizes the model performance under clean and adversarial conditions. Without any defense mechanisms, the model exhibited a substantial performance degradation under PGD attack. Specifically, the EER increased markedly from 3.00% to 40.78%, and the AUC decreased from 95.17% to 58.37%. Furthermore, the F1-Score also suffered significant declines, highlighting the model’s vulnerability to adversarial perturbations.
Fig Figure 4 shows the model prediction accuracy under PGD attack. The robustness of the MobileNetV3Pro has already demonstrated excellent performance. The EER of other models (ResNet-101, and MobileNet) is nearly 100%, with the best-performing ResNet-50 still reaching 84.54%, while their accuracy is nearly 0.
5. Discussion
One limitation of our system is its reliance on facial recognition, which can be prone to inaccuracies in low-light environments or when the user is wearing a VR headset that covers part of the face. Additionally, our system’s real-time performance depends on the hardware capabilities of the VR device, meaning that on less powerful systems, the response time might increase. Future iterations could improve by incorporating more advanced tracking sensors or alternative biometric measures like voice recognition, which would function more reliably in certain conditions.
The results of this study suggest that continuous authentication in VR can be effectively implemented without disrupting the user experience. This has important implications for industries that require secure and immersive environments, such as virtual healthcare, financial transactions in VR, or military simulations. By ensuring that sensitive data and interactions remain secure even when multiple users share a single device, our system could contribute to the broader adoption of VR in these sensitive applications.
Future work could explore integrating additional biometric data sources, such as voice recognition or heart rate monitoring, to further improve the accuracy of real-time user verification. Additionally, extending this system to augmented reality (AR) environments, where users frequently interact with both digital and physical elements, could present unique challenges and opportunities. More extensive testing with a diverse range of users would also help improve the system’s adaptability to different demographic groups and behaviors.
6. Conclusion
The goal of this research was to develop an efficient and reliable continuous authentication system for VR environments, addressing the critical need for continuous user monitoring in shared or multi-user VR scenarios.
This study contributes to the growing field of VR security by offering a real-time, dynamic solution to user authentication. The system enhances security in VR applications that involve sensitive data, such as healthcare, finance, or education, while ensuring that users can continue to enjoy a seamless and immersive experience.
Despite its promising results, the system faces limitations, particularly in environments with poor lighting or where facial recognition may be obstructed by the VR headset. Additionally, the reliance on specific hardware configurations may limit its broader applicability across different VR platforms.
In conclusion, this research demonstrates the feasibility of continuous authentication in VR environments and offers a solid foundation for developing more secure and user-friendly VR systems. As VR continues to expand into new industries, solutions like Mobilenetv3pro will play a crucial role in safeguarding user privacy and ensuring the secure use of immersive technologies.
7. Patents
Author Contributions
Conceptualization, L.Y.; methodology, P.L.; software, P.L.; validation, P.L. and L.Y.; formal analysis, P.L.; investigation, P.L.; resources, P.L.; data curation, P.L.; writing—original draft preparation, P.L.; writing—review and editing, P.L., F.C., L.P., T.H., and Y.Z.; visualization, P.L.; supervision, L.Y.; project administration, L.Y.; funding acquisition, L.Y. All authors have read and agreed to the published version of the manuscript.
Data Availability Statement
The dataset used in this study is the publicly available VRBiom dataset, which can be accessed at https://www.idiap.ch/en/scientific-research/data/vrbiom. No new data were created during this study.
Conflicts of Interest
The authors declare no conflicts of interest. The funders had no role in the design of the study; in the collection, analyses, or interpretation of data; in the writing of the manuscript; or in the decision to publish the results.
Abbreviations
The following abbreviations are used in this manuscript:
| VR | Virtual Reality |
| EER | Equal Error Rate |
| HMDs | Hand Mounted Displays |
| CA | Continuous Authentication |
| CNN | Convolutional Neural Networks |
| LSTM | Long Short-Term Memory |
| NIR | Near-Infrared |
References
- J. M. Jones, R. J. M. Jones, R. Duezguen, P. Mayer, M. Volkamer, and S. Das, “A literature review on virtual reality authentication,” in Human Aspects of Information Security and Assurance: 15th IFIP WG 11.12 International Symposium, HAISA 2021, Proceedings, vol. 15, pp. 189–198, Springer, 2021.
- P. Kürtünlüoğlu, B. P. Kürtünlüoğlu, B. Akdik, and E. arXiv preprint arXiv:2209.06447, A: authentication methods in metaverse; arXiv:2209.06447, 2022.
- Y. Abdelrahman, F. Y. Abdelrahman, F. Mathis, P. Knierim, A. Kettler, F. Alt, and M. Khamis, “Cuevr: Studying the usability of cue-based authentication for virtual reality,” in Proc. 2022 Int. Conf. on Advanced Visual Interfaces, pp. 1–9, 2022.
- F. Mathis, H. I. F. Mathis, H. I. Fawaz, and M. Khamis, “Knowledge-driven biometric authentication in virtual reality,” in Extended Abstracts of the 2020 CHI Conference on Human Factors in Computing Systems, pp. 1–10, 2020.
- A. Kupin, B. A. Kupin, B. Moeller, Y. Jiang, N. K. Banerjee, and S. Banerjee, “Task-driven biometric authentication of users in virtual reality (VR) environments,” in MultiMedia Modeling: 25th Int. Conf., MMM 2019, vol. 25, pp. 55–67, Springer, 2019.
- J. Liebers and S. Schneegass, “Gaze-based authentication in virtual reality,” in ACM Symp. on Eye Tracking Research and Applications, pp. 1–2, 2020.
- K. Pfeuffer, M. J. K. Pfeuffer, M. J. Geiger, S. Prange, L. Mecke, D. Buschek, and F. Alt, “Behavioural biometrics in VR: Identifying people from body motion and relations in virtual reality,” in Proc. 2019 CHI Conf. on Human Factors in Computing Systems, pp. 1–12, 2019.
- M. Khamis, C. M. Khamis, C. Oechsner, F. Alt, and A. Bulling, “VRpursuits: Interaction in virtual reality using smooth pursuit eye movements,” in Proc. 2018 Int. Conf. on Advanced Visual Interfaces, pp. 1–8, 2018.
- D. Lohr, S.-H. D. Lohr, S.-H. Berndt, and O. Komogortsev, “An implementation of eye movement-driven biometrics in virtual reality,” in Proc. 2018 ACM Symp. on Eye Tracking Research & Applications, pp. 1–3, 2018.
- A. Andam, J. A. Andam, J. Bentahar, and M. Hedabou, “Multi-modal deep reinforcement learning for visual security of virtual reality applications,” IEEE Internet Things J., 2024.
- Z. Yu, H.-N. Z. Yu, H.-N. Liang, C. Fleming, and K. L. Man, “An exploration of usable authentication mechanisms for virtual reality systems,” in 2016 IEEE Asia Pacific Conf. on Circuits and Systems (APCCAS), pp. 458–460, IEEE, 2016.
- C. George, M. C. George, M. Khamis, E. von Zezschwitz, M. Burger, H. Schmidt, F. Alt, and H. Hussmann, “Seamless and secure VR: Adapting and evaluating established authentication systems for virtual reality,” in NDSS, 2017.
- I. Olade, H.-N. I. Olade, H.-N. Liang, C. Fleming, and C. Champion, “Exploring the vulnerabilities and advantages of swipe or pattern authentication in virtual reality (VR),” in Proc. 2020 4th Int. Conf. on Virtual and Augmented Reality Simulations, pp. 45–52, 2020.
- Z. Á. Mann, “Optimization problems in fog and edge computing,” in Fog and Edge Computing: Principles and Paradigms, pp. 103–121, 2019.
- M. Funk, K. M. Funk, K. Marky, I. Mizutani, M. Kritzler, S. Mayer, and F. Michahelles, “Lookunlock: Using spatial-targets for user-authentication on HMDs,” in Extended Abstracts of the 2019 CHI Conf. on Human Factors in Computing Systems, pp. 1–6, 2019.
- R. Miller, N. K. R. Miller, N. K. Banerjee, and S. Banerjee, “Using Siamese neural networks to perform cross-system behavioral authentication in virtual reality,” in 2021 IEEE Virtual Reality and 3D User Interfaces (VR), pp. 140–149, IEEE, 2021.
- J. Liebers, P. J. Liebers, P. Horn, C. Burschik, U. Gruenefeld, and S. Schneegass, “Using gaze behavior and head orientation for implicit identification in virtual reality,” in Proc. 27th ACM Symp. on Virtual Reality Software and Technology, pp. 1–9, 2021.
- S. Li, A. S. Li, A. Ashok, Y. Zhang, C. Xu, J. Lindqvist, and M. Gruteser, “Whose move is it anyway? Authenticating smart wearable devices using unique head movement patterns,” in 2016 IEEE Int. Conf. on Pervasive Computing and Communications (PerCom), pp. 1–9, IEEE, 2016.
- T. Mustafa, R. T. Mustafa, R. Matovu, A. Serwadda, and N. Muirhead, “Unsure how to authenticate on your VR headset? Come on, use your head!,” in Proc. Fourth ACM Int. Workshop on Security and Privacy Analytics, pp. 23–30, 2018.
- M. Sivasamy, V. M. Sivasamy, V. Sastry, and N. Gopalan, “VRCAuth: Continuous authentication of users in virtual reality environment using head-movement,” in 2020 5th Int. Conf. on Communication and Electronics Systems (ICCES), pp. 518–523, IEEE, 2020.
- M. Li, N. K. M. Li, N. K. Banerjee, and S. Banerjee, “Using motion forecasting for behavior-based virtual reality (VR) authentication,” in 2024 IEEE Int. Conf. on Artificial Intelligence and eXtended and Virtual Reality (AIxVR), pp. 31–40, IEEE, 2024.
- J. Shang and J. Wu, “Enabling secure voice input on augmented reality headsets using internal body voice,” in 2019 16th Annual IEEE Int. Conf. on Sensing, Communication, and Networking (SECON), pp. 1–9, IEEE, 2019.
- R. Duezguen, P. R. Duezguen, P. Mayer, S. Das, and M. arXiv preprint arXiv:2007.11663, arXiv:2007.11663, 2020.
- N. Bekkanti, L. N. Bekkanti, L. Busch, and S. Amman, “Evaluation of voice biometrics for identification and authentication,” SAE Technical Paper, 2021.
- I. Sluganovic, M. I. Sluganovic, M. Roeschlin, K. B. Rasmussen, and I. Martinovic, “Using reflexive eye movements for fast challenge-response authentication,” in Proc. 2016 ACM SIGSAC Conf. on Computer and Communications Security, pp. 1056–1067, 2016.
- I. Rigas, O. I. Rigas, O. Komogortsev, and R. Shadmehr, “Biometric recognition via eye movements: Saccadic vigor and acceleration cues,” ACM Trans. Appl. Percept., vol. 13, no. 2, pp. 1–21, 2016.
- I. Olade, C. I. Olade, C. Fleming, and H.-N. Liang, “Biomove: Biometric user identification from human kinesiological movements for virtual reality systems,” Sensors, vol. 20, no. 10, p. 2944, 2020. [CrossRef]
- K. Qian et al., “An eye tracking based virtual reality system for use inside magnetic resonance imaging systems,” Sci. Rep., vol. 11, no. 1, pp. 1–17, 2021. [CrossRef]
- S. M. Asish, A. K. S. M. Asish, A. K. Kulshreshth, and C. W. Borst, “User identification utilizing minimal eye-gaze features in virtual reality applications,” Virtual Worlds, vol. 1, pp. 42–61, MDPI, 2022. [CrossRef]
- S. Peng and N. Al Madi, “An eye opener on the use of machine learning in eye movement based authentication,” in 2022 Symp. on Eye Tracking Research and Applications, pp. 1–2, 2022.
- L. Li et al., “SIGA: RPPG-based authentication for virtual reality head-mounted display,” in Proc. 26th Int. Symp. on Research in Attacks, Intrusions and Defenses, pp. 686–699, 2023.
- R. Miller, A. R. Miller, A. Ajit, N. K. Banerjee, and S. Banerjee, “Realtime behavior-based continual authentication of users in virtual reality environments,” in 2019 IEEE Int. Conf. on Artificial Intelligence and Virtual Reality (AIVR), pp. 253–2531, IEEE, 2019.
- R. Miller, N. K. R. Miller, N. K. Banerjee, and S. Banerjee, “Within-system and cross-system behavior-based biometric authentication in virtual reality,” in 2020 IEEE Conf. on Virtual Reality and 3D User Interfaces Abstracts and Workshops (VRW), pp. 311–316, IEEE, 2020.
- M. Kim et al., “Secure and privacy-preserving authentication scheme using decentralized identifier in metaverse environment,” Electronics, vol. 12, no. 19, p. 4073, 2023. [CrossRef]
- J. Wang and B. Gao, “Analysis of multi-attribute user authentication to against man-in-the-room attack in virtual reality,” in Int. Conf. on Human-Computer Interaction, pp. 455–461, Springer, 2021.
- K. Kotwal, G. K. Kotwal, G. Özbulak, and S. Marcel, “Assessing the reliability of biometric authentication on virtual reality devices,” in IEEE Int. Joint Conf. on Biometrics (IJCB), pp. 1–10, Sep. 2024.
Figure 1.
Example of sample images
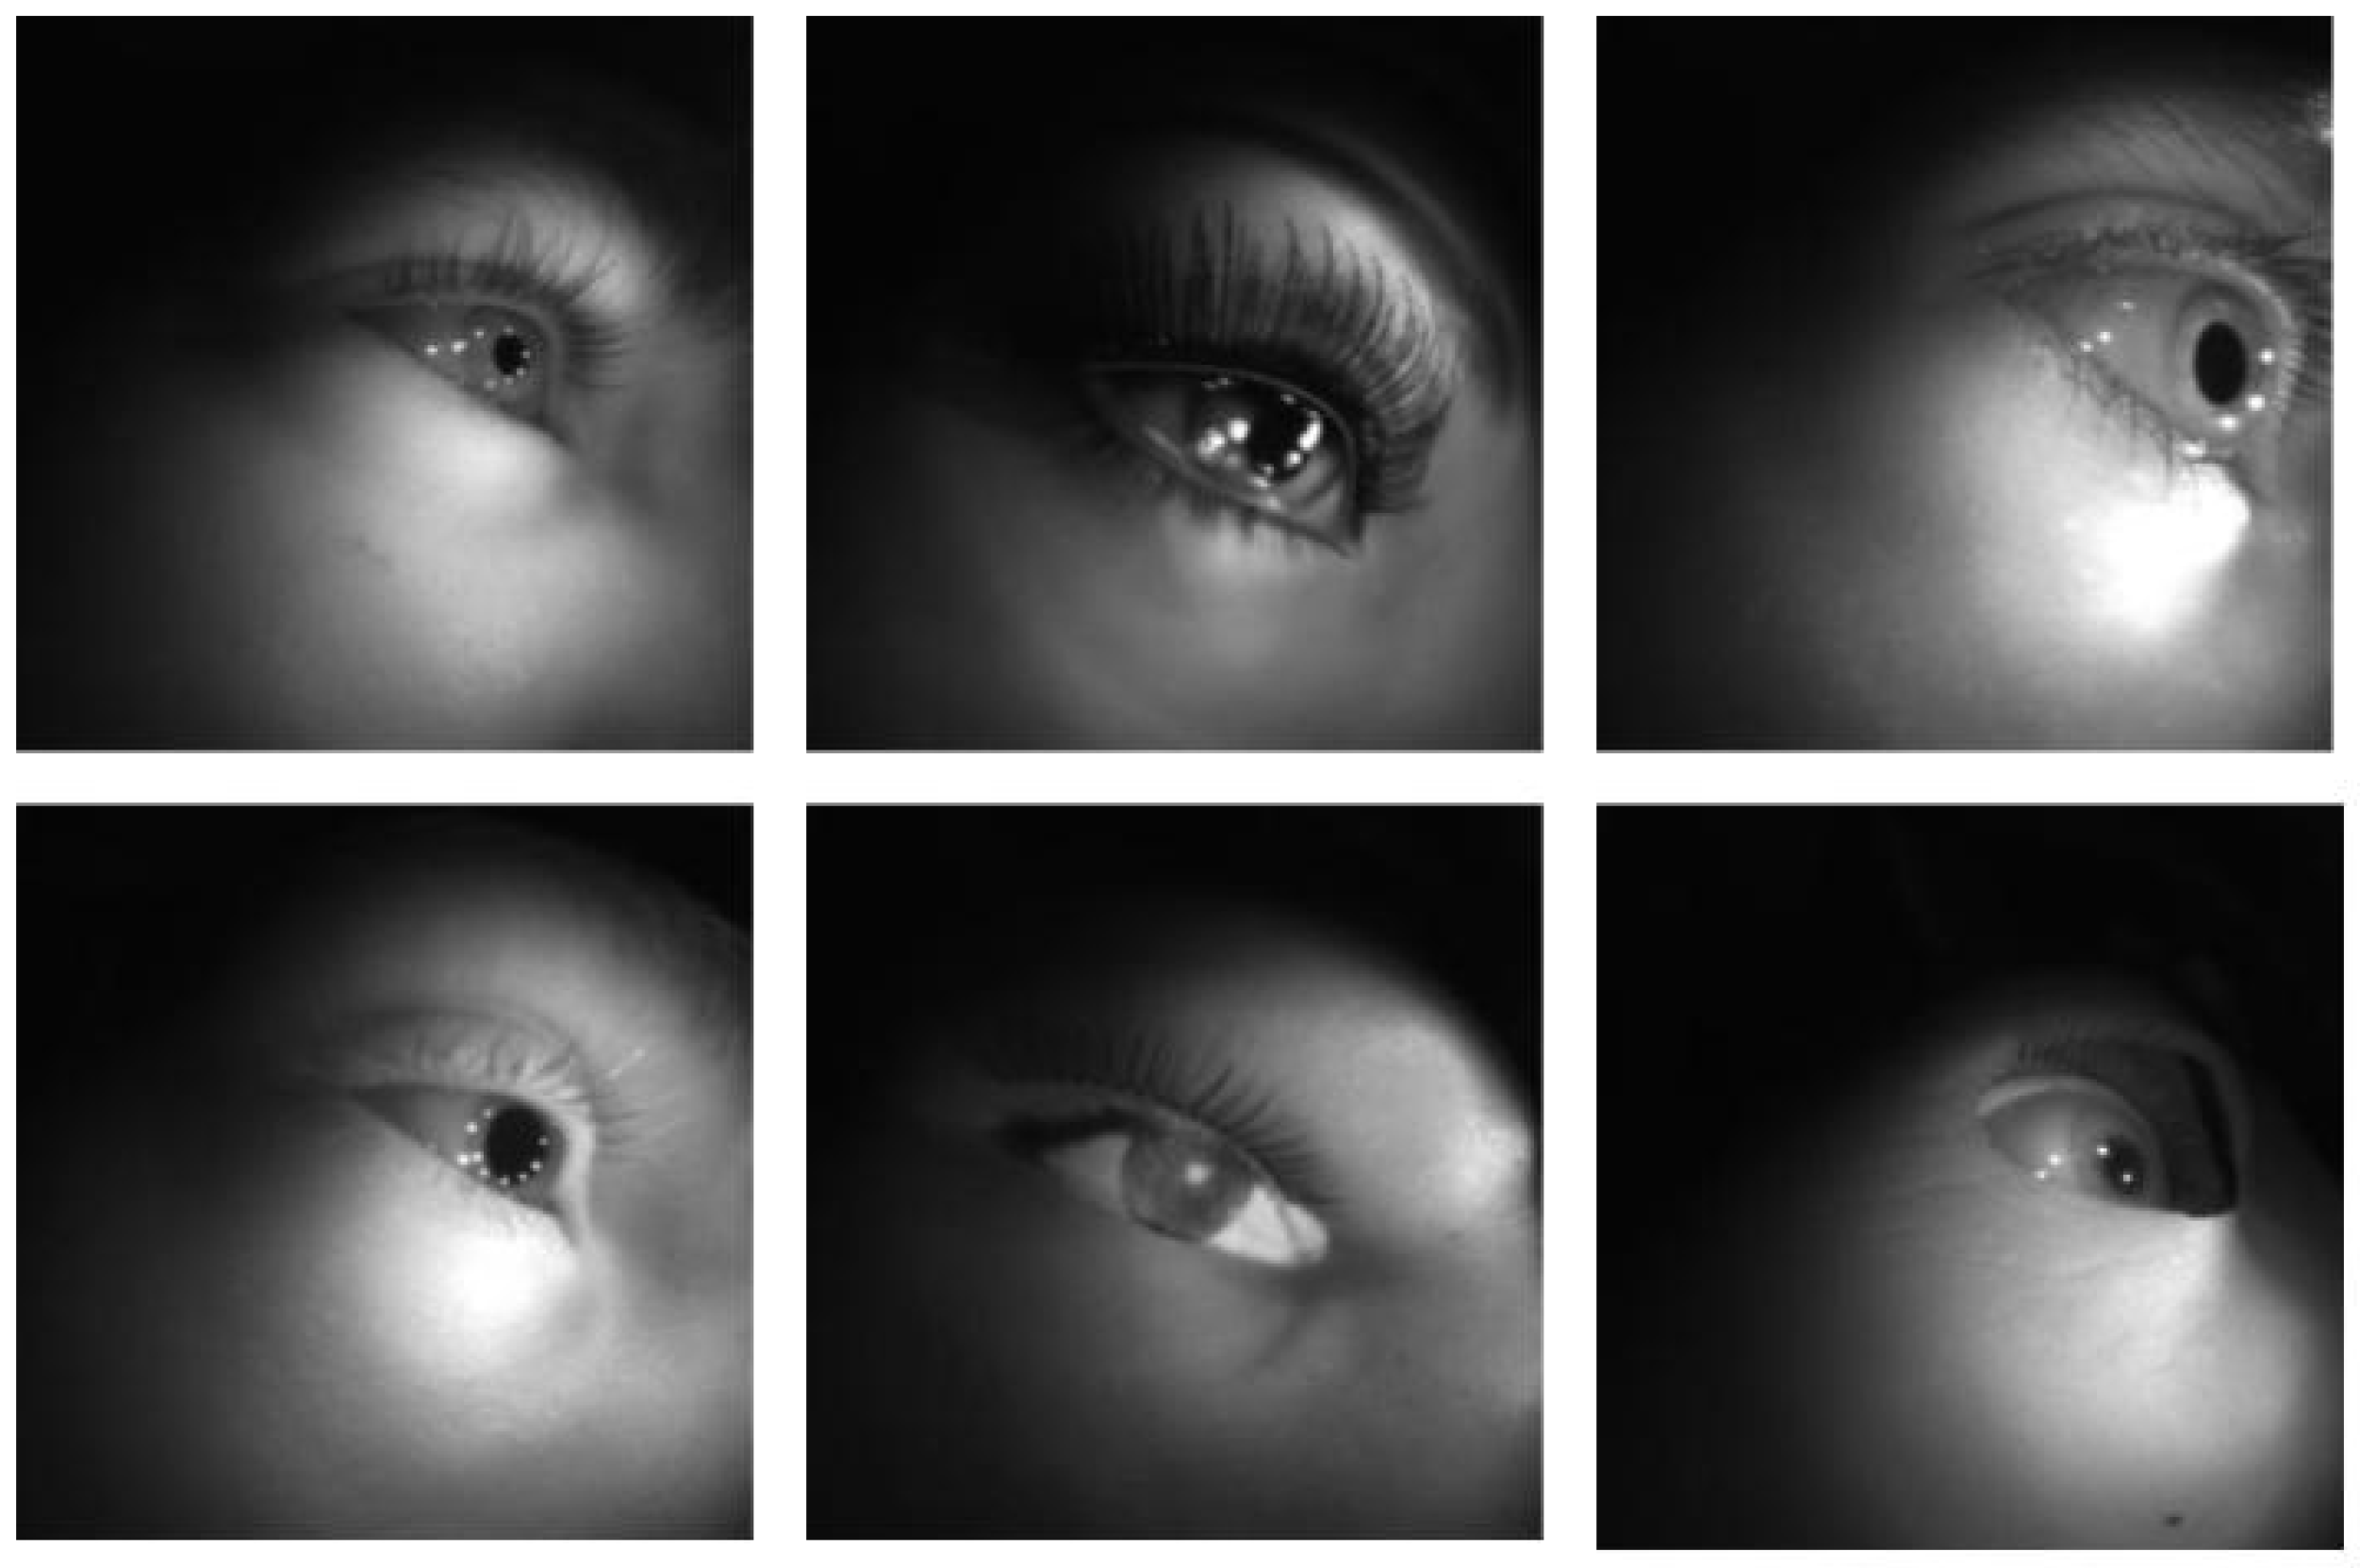
Figure 2.
Example of a highlight image affecting prediction accuracy.
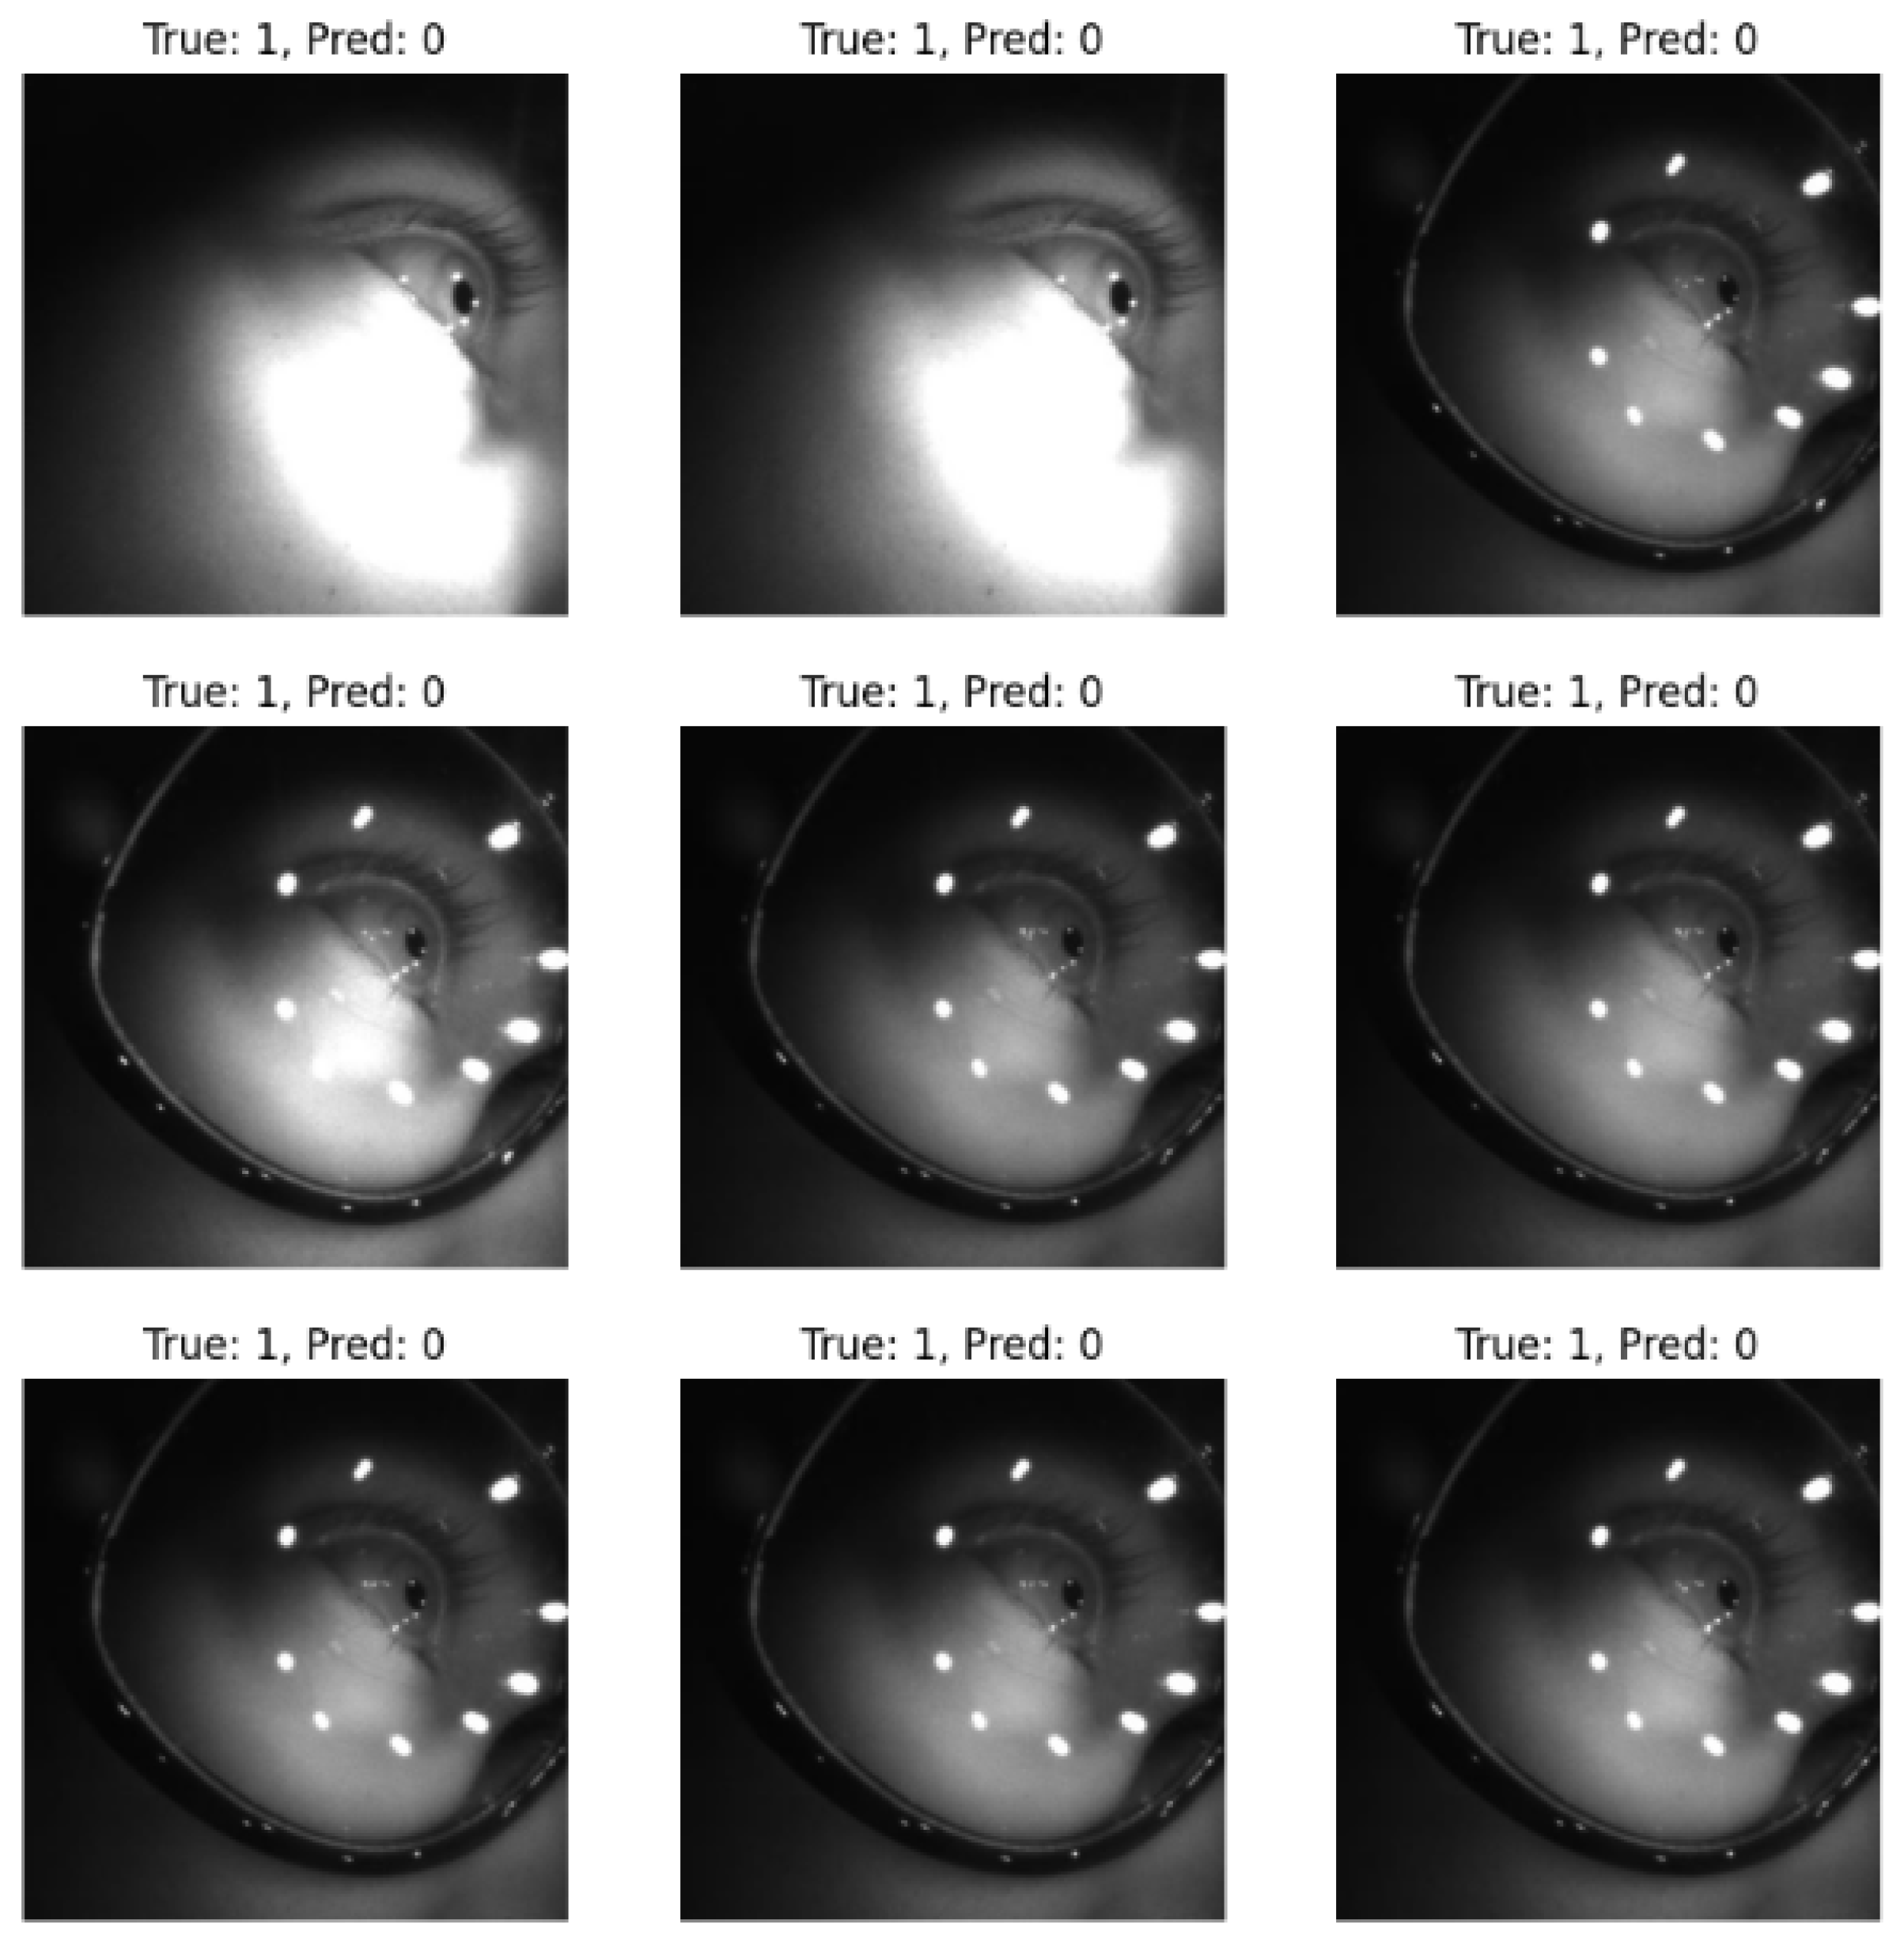
Figure 3.
Different model prediction results: (a) Resnet 50 model prediction ROC curve. (b) Resnet 101 model prediction ROC curve. (c) Mobilenet V1 model prediction ROC curve. (d) Mobilenet V3 model prediction ROC curve. (e) Mobilenet V3 improve model prediction ROC curve. (f) Mobilenet V3 pro model prediction ROC curve
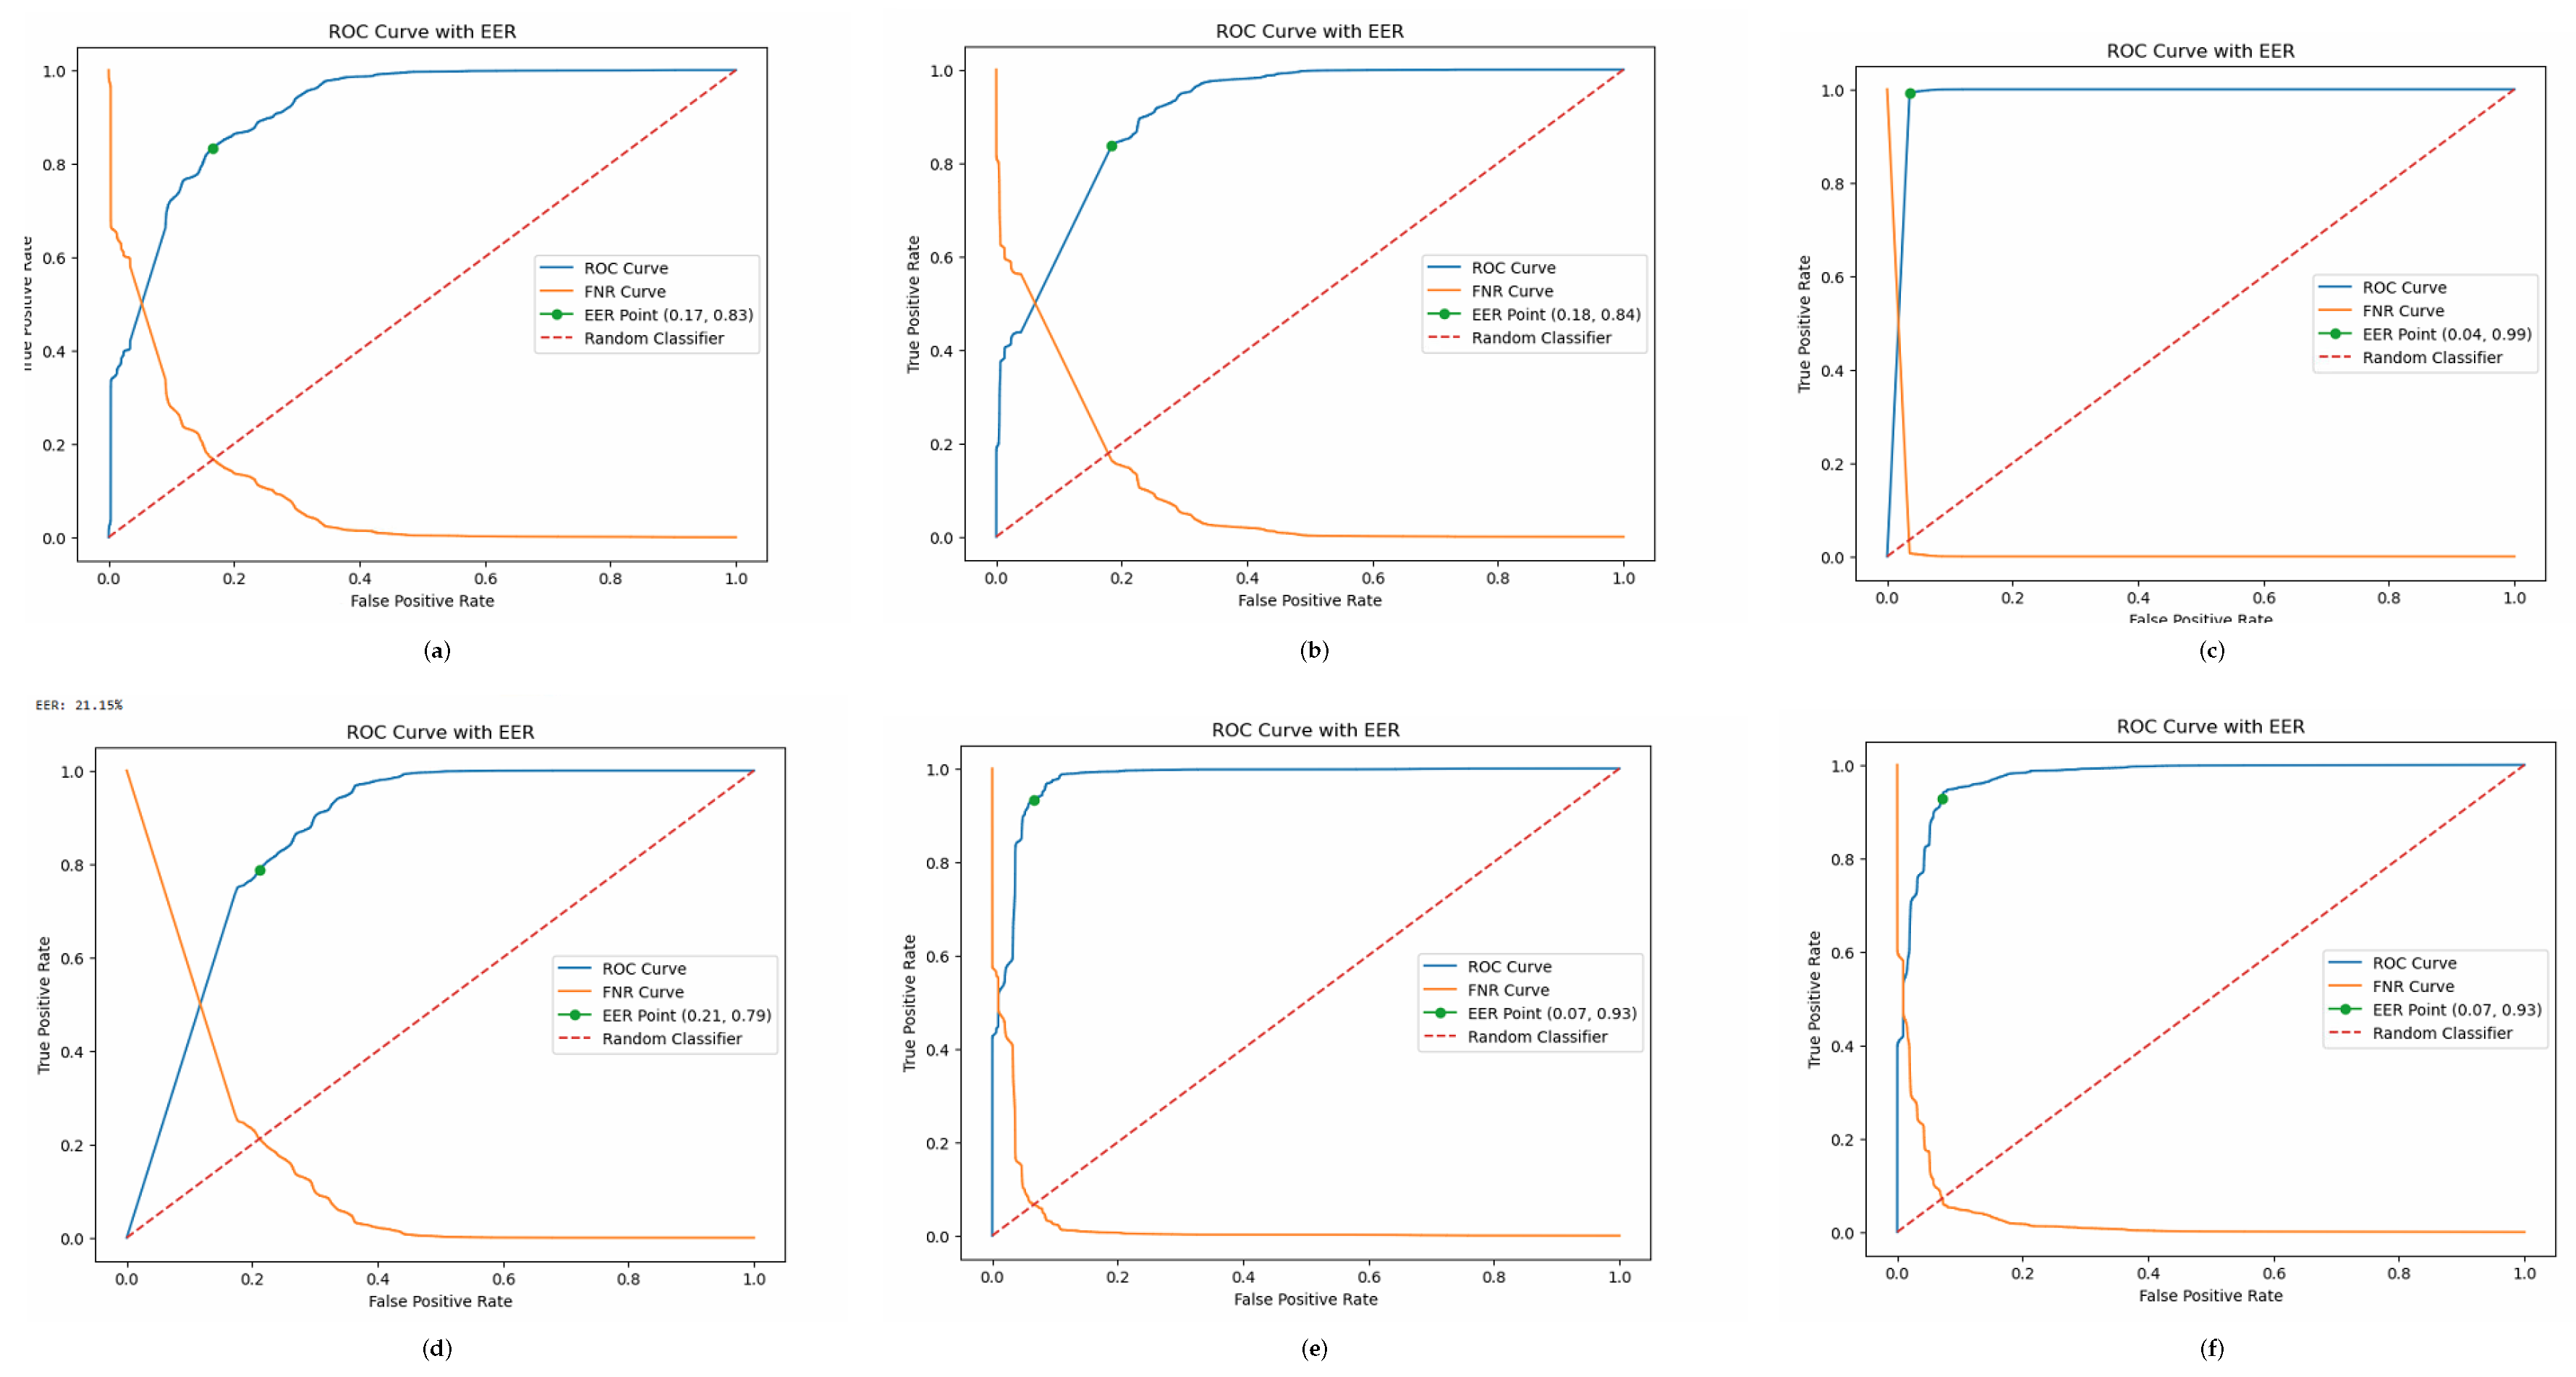
Figure 4.
Model Prediction Accuracy under PGD Attack
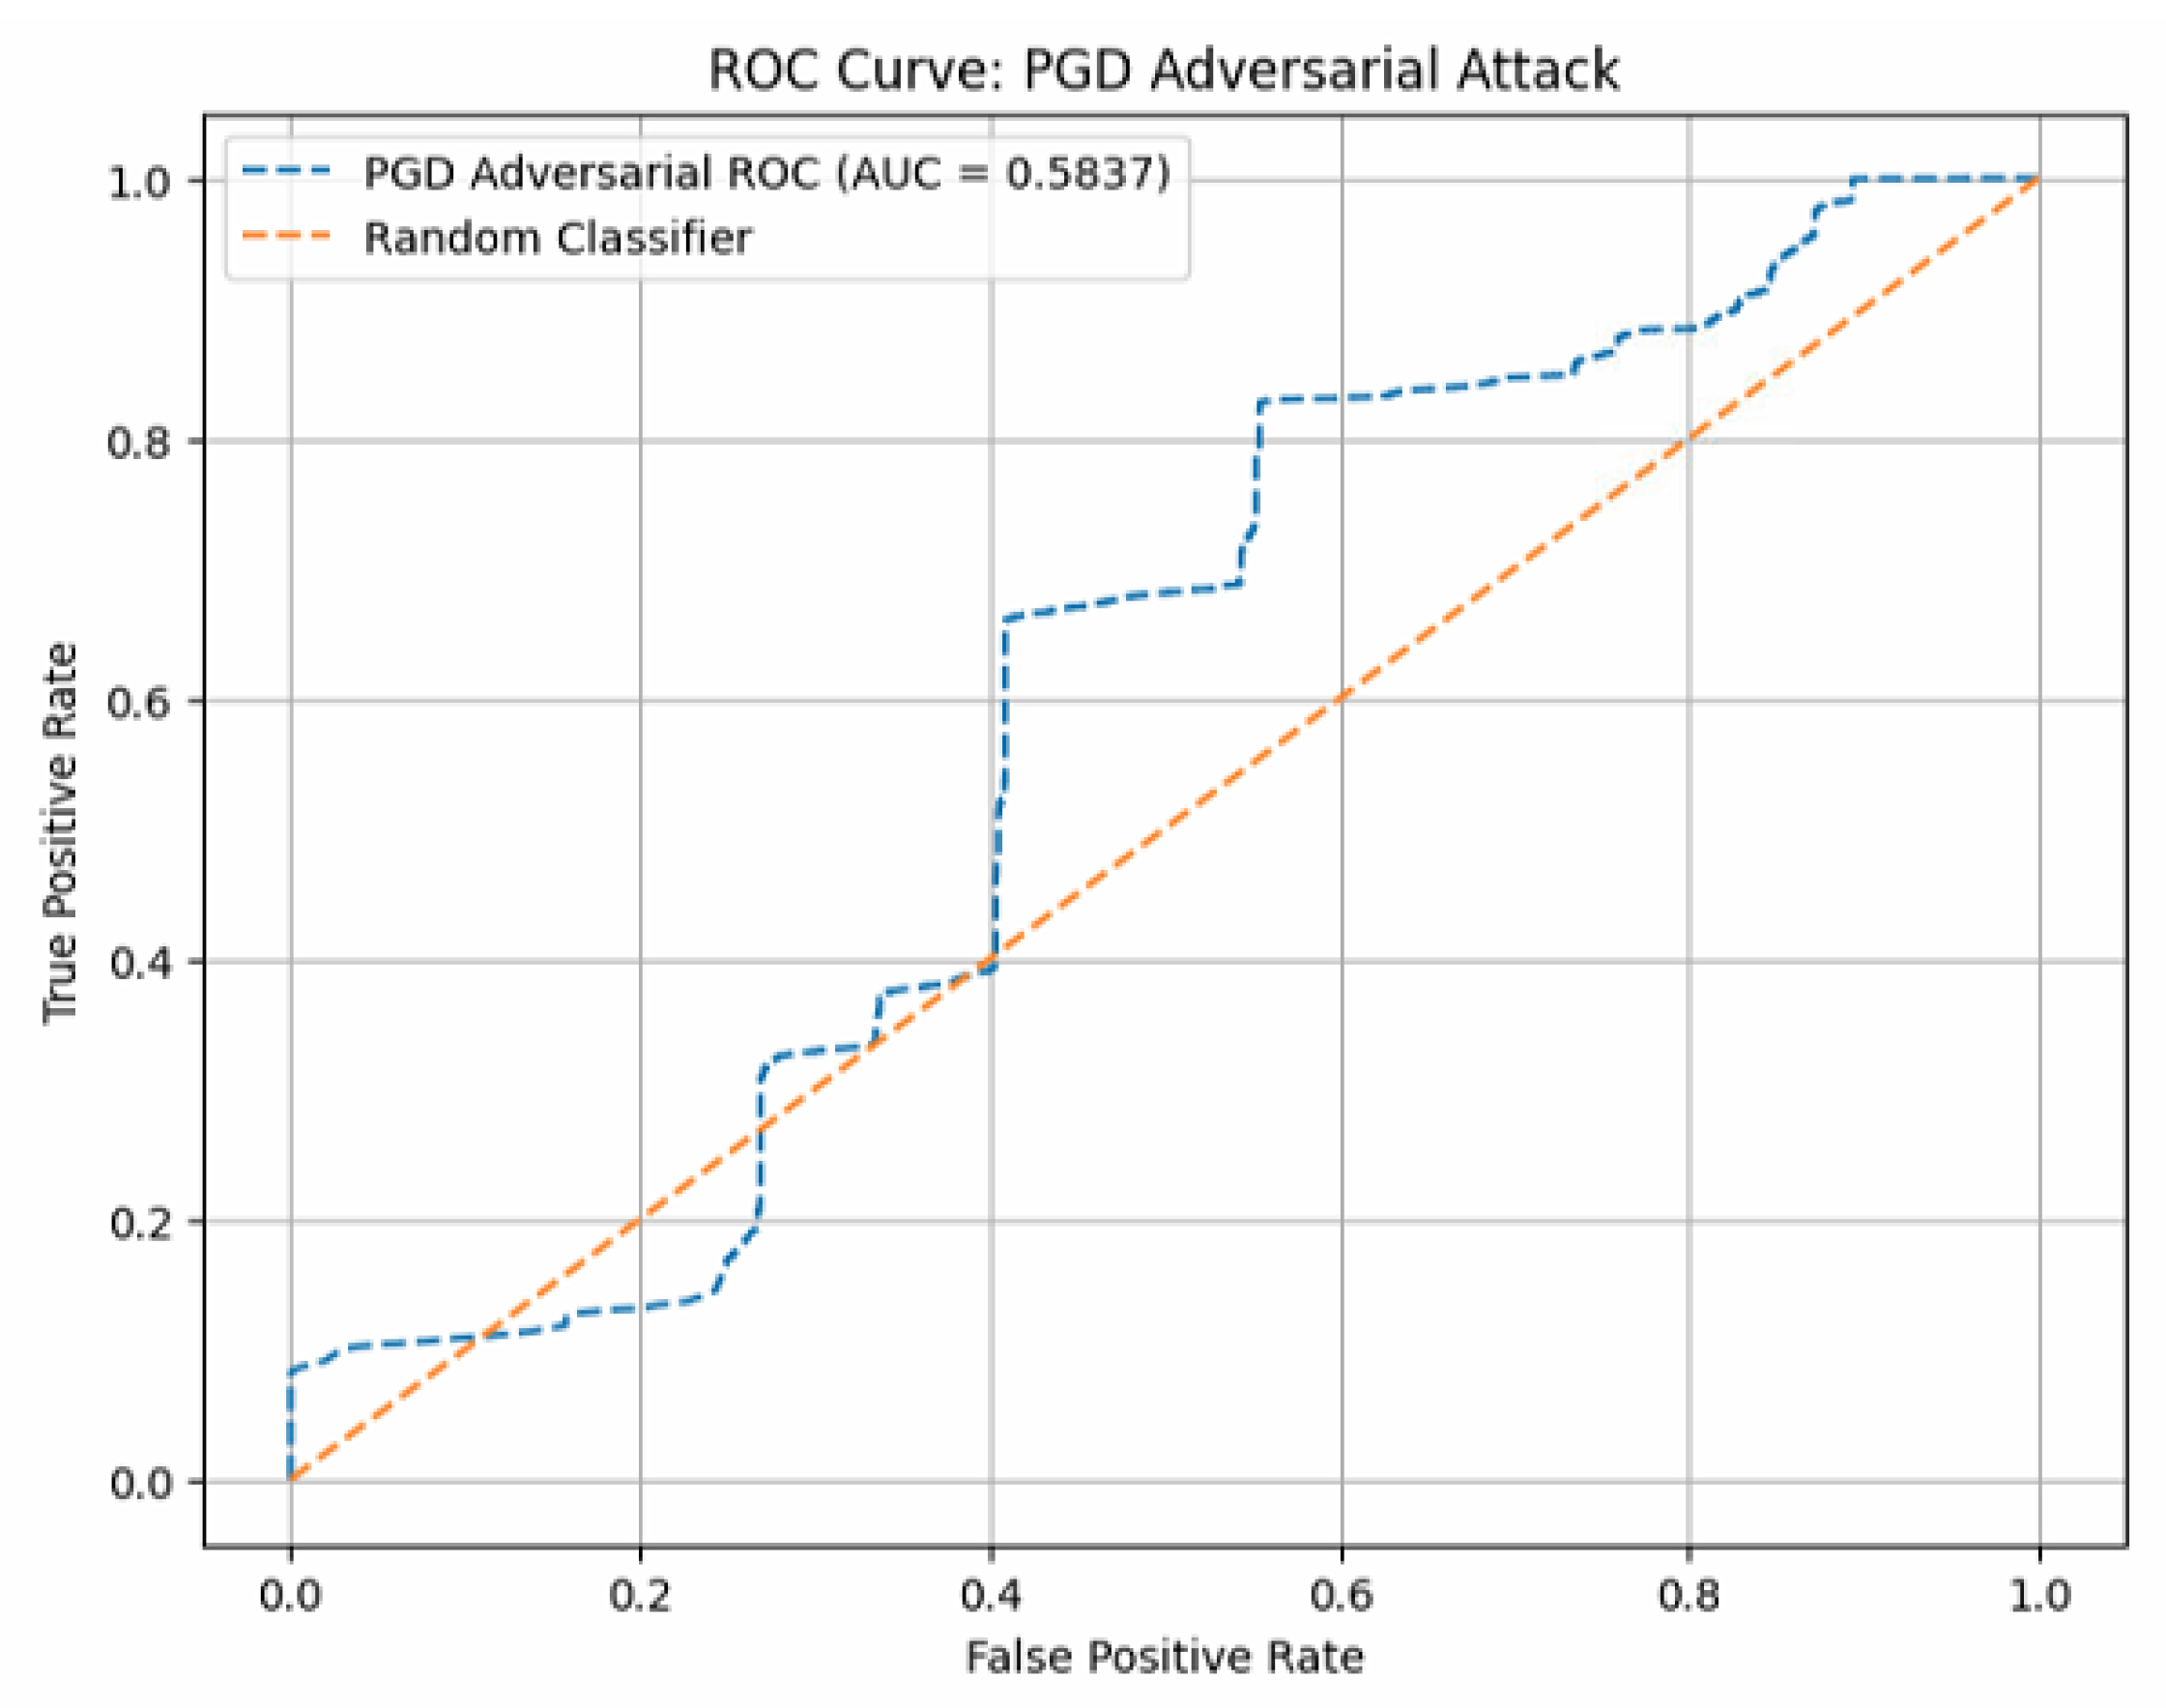
Table 2.
Performance Comparison of Different Models.
| Model | EER (%) | AUC (%) | F1-Score (%) | Model Size (MB) | Inference Time (ms) |
|---|---|---|---|---|---|
| ResNet-50 | 16.08 | 83.89 | 81.82 | 91.98 | 847.25 |
| ResNet-101 | 22.45 | 80.30 | 81.45 | 164.32 | 1079.26 |
| MobileNet | 3.68 | 95.90 | 95.03 | 16.75 | 784.56 |
| MobileNetV3 | 15.15 | 87.83 | 80.31 | 15.35 | 984.34 |
| MobilenetV3pro | 3.00 | 95.17 | 94.79 | 13.82 | 545.22 |
Table 3.
Performance Comparison of Different Optimization Methods.
| Model | EER (%) | AUC (%) | F1-Score (%) | Model Size (MB) | Inference Time (ms) |
|---|---|---|---|---|---|
| Mobilenet V3 | 15.15 | 87.83 | 80.31 | 15.35 | 984.34 |
| + Weighted Loss | 15.27 | 85.40 | 84.42 | 13.82 | 802.30 |
| + Fine-tuning 30 layers | 17.54 | 84.22 | 83.02 | 13.82 | 621.43 |
| + Focal Loss | 8.32 | 91.48 | 90.64 | 13.82 | 650.53 |
| + All together | 3.00 | 95.17 | 94.79 | 13.82 | 545.22 |
Table 4.
Model performance under clean and PGD adversarial settings.
| Condition | EER (%) | AUC (%) | F1-Score (%) |
|---|---|---|---|
| Clean Test Data | 3.00 | 95.17 | 94.79 |
| Under PGD Attack | 40.78 | 58.37 | 68.01 |
Disclaimer/Publisher’s Note: The statements, opinions and data contained in all publications are solely those of the individual author(s) and contributor(s) and not of MDPI and/or the editor(s). MDPI and/or the editor(s) disclaim responsibility for any injury to people or property resulting from any ideas, methods, instructions or products referred to in the content. |
© 2025 by the authors. Licensee MDPI, Basel, Switzerland. This article is an open access article distributed under the terms and conditions of the Creative Commons Attribution (CC BY) license (http://creativecommons.org/licenses/by/4.0/).
Copyright: This open access article is published under a Creative Commons CC BY 4.0 license, which permit the free download, distribution, and reuse, provided that the author and preprint are cited in any reuse.


