Submitted:
13 June 2025
Posted:
16 June 2025
You are already at the latest version
Abstract
Background/Objectives: At our institution, we implemented the Centers for Disease Control and Prevention’s (CDC’s) lifestyle change diabetes prevention program using the in-person modality. However, the recent pandemic compelled us to move our diabetes prevention program from an in-person to a distance learning modality. We evaluated and compared participant outcomes between these two modalities. Methods: Participants reported weight in pounds and physical activity in minutes in each session as primary outcomes to their lifestyle coaches. Outcomes were coded according to the goals of the diabetes prevention program as depicted by the CDC’s Diabetes Prevention Recognition Program Standard for Operating Procedures: (i) weight loss ≥5.0% of the starting weight and (ii) Physical activity ≥150 minutes. Paired sample t-test was performed to examine the association between modality and outcome. Results: A total of 115 participants completed the diabetes prevention program from May 2018 to April 2023 (53 in-person and 62 distance learning). On average, they lost 11 lbs and increased their physical activity by 186 minutes. There was no difference in outcomes between the two modalities (p>0.6 each). Weight loss was more observed among whites in the in-person class (coeff. = 0.04, p
Keywords:
diabetes prevention program
; DPP
; distance learning modality
; in person modality
1. Introduction
There are currently 98 million people with prediabetes in the U.S., with over 10% converting to Type 2 Diabetes yearly [1]. To help prevent individuals with prediabetes from progressing to Type 2 Diabetes, the National Diabetes Prevention Program (DPP) year-long curriculum, PreventT2®, was developed. The program's goals are to have participants lose 5-7% of their starting weight and achieve ≥ 150 minutes of weekly physical activity. In addition, the reduction of hemoglobin A1c (A1c) by 0.2% is considered a success marker [2]. PreventT2® has been proven to reduce diabetes risk by 58% compared to metformin at 31% [3]. The DPP accomplishes these goals by promoting self-monitoring, self-efficacy, and social support to help participants create healthy eating and physical activity habits. If left without intervention, 15-30% of people with prediabetes will develop Type 2 Diabetes within 5 years [4].
Diabetes is one of the top causes of death and decreased life expectancy globally [5]. Diabetes increases the chance of mortality by raising the risks of developing and progressing to severe prognosis of stroke, cardiovascular disease, cancer, COVID-19, and infections [6,7]. One of the best ways to delay diabetes onset and manage its detrimental effects on the body is through diabetes prevention [8]. Type 2 diabetes is common in people over 45 years of age or those in a hypercoagulable and pro-inflammatory state [6]. The Coronavirus Disease 2019 (COVID-19) infection is known to trigger hyperinflammation and damage pancreatic beta cells. The resulting hyperglycemia has been linked to an increase in the severity of COVID-19 symptoms and mortality risk [9,10]. These factors make diabetes one of the most important underlying factors of severe COVID-19 symptoms and an increased mortality rate [6]. However, among people with diabetes who have contracted the COVID-19 infection, adequate glycemic control has been correlated with better pulmonary function and immune response [11].
Before the pandemic, the majority of National Diabetes Prevention Programs, which offered group support, interactivity, motivation, accountability, and patient empowerment, were in-person (IP). Less-used modalities included distance learning (DL) and online learning. The COVID-19 pandemic forced many programs to switch rapidly to the DL modality. With the Centers for Disease Control and Prevention (CDC) allowing DPPs to be delivered virtually and Medicare flexibility using DL instead of the IP modality, DL was widely adopted. Combination modality was allowed post-pandemic [2].
During the pandemic, the DL modality was widely used as a viable option[12]. However, the outcomes of using technology for DL were mixed, as some suggested that technology increased disparities, whereas others claimed that technology closed the gap[13]. The use of digital technology in people with prediabetes or diabetes has been reviewed elsewhere, indicating that most randomized clinical trials endorsed technology use as it had high efficacy, enhancing patient engagement [14]. During the height of the COVID-19 pandemic, a group of older adults with type 2 diabetes transitioned from an in-person exercise intervention and education program to an online program. The online program was as effective as the in-person program, improving physical fitness and waist circumference [15]. In people with prediabetes, technology, which can be tailored to users’ needs [16], was shown to help reduce their weight [17,18], and A1c levels [17] compared to non-users. Barriers to technology use include cost, sustainability, and integration with healthcare systems [14]. Considering other barriers to chronic disease self-management during the pandemic [19], we aimed to evaluate the DPP outcomes between the two modalities. This evaluation is a quality improvement project to provide insight into using both modalities to deliver the DPP. Our Institutional Review Board deemed the DPP as a non-research project. Consents were not collected from DPP participants. The data presented here were collected under a Quality Improvement Initiative and, as such, do not constitute research on human subjects. This initiative is reported based on the Standards for Quality Improvement Reporting Excellence (SQUIRE 2.0).
2. Materials and Methods
Program Description: The year-long DPP at our institution is part of the National DPP utilizing the CDC-accredited PreventT2® curriculum. The curriculum is divided into months 1-6 with 16 weekly sessions completed within 26 weeks, and months 7-12 with monthly or bi-monthly sessions, a total of 26 sessions. Each session occurs in a group setting and lasts for 1 hour led by a lifestyle coach. All lifestyle coaches underwent twelve hours of training to be certified as required by the CDC. The program features an approach that is proven to stop or delay prediabetes from progressing into type 2 diabetes. It focuses on improving food choices and increasing physical activity (PA) with the goals to 1) attain 4-7% weight loss, 2) get 150 min of PA weekly, and 3) decrease A1c by 0.2% or more, to achieve diabetes risk reduction.
Sessions were offered using IP or DL modality over the Zoom® platform. At the beginning of each of the IP sessions, lifestyle coaches recorded the weights of participants in private and collected their food and PA logs kept during the week before the session. Before each DL session, participants privately reported to their lifestyle coaches their current weight, their food and calorie intake, and minutes of PA by text messages, emails, or verbally. The privacy of the data collection process allowed people to honestly report their data to their coach. According to the CDC, self-reported data is a valid and accepted form of data reporting for the DL modality. Attendance was taken at each session by lifestyle coaches. All of the above information was recorded and used to help lifestyle coaches monitor their participants’ progress. The DPP was offered free of charge to all participants, thanks to the support of the Texas Department of State Health Services. Participants were recruited through direct referrals from healthcare providers, health fairs, inquiries on our electronic medical records, and self-referral through our website.
Data Source: All DPP participants who completed the program from May 2018 to April 2023 were included in this analysis. The inclusion criteria for DPP participants include being 18 or older, having a BMI of 25 or greater, (23 or greater, if Asian American), or having either a history of gestational diabetes or being diagnosed with prediabetes through a blood test like finger prick glucose, fasting plasma glucose, oral glucose tolerance test or A1c. Exclusion criteria include those younger than 18 years of age, diagnosed with type 1 or type 2 diabetes, or who were pregnant.
Measurements: All CDC-Diabetes Prevention Recognition Program (DPRP) outcomes were measured before and after the completion of the one-year program. The primary outcome variable is weight (in lbs.) and the percentage of weight change. The secondary outcomes were the level of PA in minutes and the change in PA. A1c was not collected for the IP classes as it was not a requirement before the latest 2021 DPRP Standards of Operating Procedure, and all IP classes reported here were conducted prior to 2021.
The first predictor was the class modality (IP or DL). The second set of predictors was the participant’s age, gender, combination of race and ethnicity, and education. Because the number of participants who self-reported as Asian Americans, Pacific Islanders, or Native Americans was relatively small, we combined them into one group (Others).
Analysis: Descriptive analysis was conducted to compare participant characteristics by class modality (in-person versus DL). Chi-squared and Student’s t-test were used to further profile the participants of the two groups and determine any differences in their demographic characteristics; Chi-Square was performed for categorical variables (gender, combined race and ethnicity, education), and Student’s t-test was performed for a continuous variable (age). The bivariate analysis was conducted to stratify the outcomes by class modality. As all the outcome variables are numeric, a t-test was performed to examine whether the difference in weight loss and PA improvement between in-person participants and DL participants is significant. We merged participants of both modalities and constructed two linear regression models to identify which personal characteristic predicts weight change and PA improvement. For each of the in-person and DL groups, we also conducted a linear regression to examine the association between two outcomes (weight and PA minutes) and four personal characteristics (age, gender, combination of race and ethnicity, and education). Both outcomes are numeric and continuous (i.e., non-binary), so we reported the coefficient results. We performed a subset of analyses using mixed modeling and difference-in-difference techniques and no confounding effect by participation cohort or time was found. The analysis was performed by Stata v18.0 and any p-value less than 0.05 is considered statistically significant.
3. Results
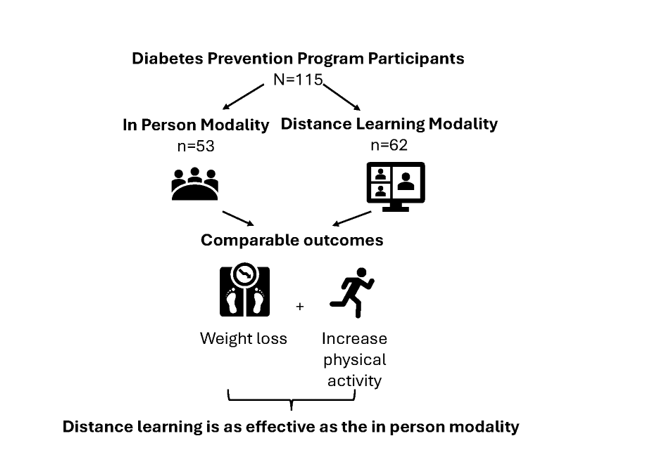
A total of 138 participants enrolled in the DPP from May 2018 to April 2023. Out of these, 115 completed the DPP (n=53 and 62 in the IP and DL modalities; respectively). Almost 25% of our participants are our institution employees (Texas BlueCross BlueShield Beneficiaries), and 33% were Medicare beneficiaries. The characteristics of participants enrolled in both modalities are listed in Table 1. There were no statistically significant differences in the population demographics between the two class modalities. The average age of participants was 56.3. Most of the participants were whites (61%), females (82%), and had completed a college or higher education status (59%).
Table 2 compares the program outcomes by class modality. There was no statistically significant difference in starting weight, end weight, and weight variation between the two modalities. The weight loss in the DL modality is comparable to that in the IP modality (p=0.80). While the starting PA minutes were significantly higher in the DL group (p<0.001), the level of PA increase was higher in the IP group (p<0.001).
Table 3 shows the Diabetes Prevention Recognition Program (DPRP) criteria for success for completers. A1c was not collected for the IP classes as it was not a requirement before the 2021 DPRP Standards of Operating Procedure, and all IP classes reported here were conducted before 2021. There were no significant differences between the DPRP criteria between the two modalities (p>0.05 each). Despite the lack of A1c data for the IP group, an A1c reduction of ≥0.2% was achieved in 72% of reporting DL completers.
Table 4 shows the associations between participant characteristics and outcomes by class modality. Being white was associated with more weight loss; a result observed in all participants and those in the IP modality group (p<0.05 each vs. Others). Participants who completed college or higher education were more likely to increase PA (p<0.05 vs. other educational status). Finally, participants in the IP modality had higher PA changes than their DL counterparts (p<0.05).
4. Discussion
In comparing IP and DL modalities in DPP, we found that 1) there is no difference in participant outcomes between the two modalities, 2) More weight loss was achieved among whites, and 3) More increase in PA was associated with being of a higher educational level.
The CDC recommends that the DPP is delivered by several modalities: 1) in-person, 2) distance learning, 3) online, 4) in-person with a DL component, and 4) combination. [20] There was no statistically significant difference in program outcomes between the IP and DL groups. This was expected as both modalities are deemed equally effective for the delivery of the DPP by the CDC. This is also similar to previous reports where neither weight loss nor physical activity minutes were affected by DPP modality [12,20]. This was consistent regardless of the sample size of the studied population. While Welshons et al reported no statistical difference in weight loss between the two modalities following adjustment for co-variates in a sample of 47 IP and 31 DL participants [12], Cannon et al reported weight loss as 4.4%, and 4.7% for IP and for DL modality, in a total of 333,715 participants [20]. Benefits of the DL modality include a lower cost burden for both participants and the organizations offering such programs, which can be associated with decreased need for transportation, time away from family or jobs, and other barriers to DPP participation [21]. DL was also reported to increase session attendance due to the ease of attending sessions [22]. An increase in attendance is beneficial to participants as there is almost a linear relationship between session attendance and weight loss [23]. Every DPP session attended was reported to be associated with over 0.5 lbs weight loss [24]. An increase in participant attendance can aid in building personal relationships with their group members, and lifestyle coaches to help support and motivate participants to make lifestyle changes.
We also found that among all participants, whites had the highest weight loss compared to other races; an effect that was seen in the IP group. This can be partly explained as most of our participants were whites. This is similar to reports where whites constituted 71-80% of enrollees [12,20,23] and may be explained by the fact that whites are known to be more likely to have a higher program attendance in particular[25] and their willingness to seek out healthcare in general [26].
Participants with higher education levels had the highest change in PA minutes. This can be partly explained as those with higher education status constituted almost 59% of our overall participants and were the highest group in either modality. While higher education can allow for higher incomes in more stable jobs [27], the benefits of having access to more financial resources that can be spent on health also extend to the benefits of health insurance that allows for access to care and increased utilization of health care resources. This is especially important in the United States where most health insurance is provided by employers [28]. Additionally, having a lower level of education can deter a person from affording healthier diets, which are usually expensive, and not have time to invest in their health due to work demands [29]. Lastly, lower education can put a strain on the availability of social support available to them from their married spouses or other long-term relationships due to financial needs, workplace environment, and other stressors [30].
Participants in the IP modality had higher PA changes than their DL counterparts, similar to other reports [20]. This observation may be due to the higher starting PA minutes among participants in the DL group, which made any PA increase in the DL group relatively small compared with those in the IP group. Both modalities, when offered to participants, were more accommodating than offering one or the other. Participants can choose which modality to join, based on their preference, work/family schedule, transportation, or access to electronic devices and internet connectivity.
The DPRP is a CDC program built to ensure the quality and fidelity of the DPP delivery. Institutions are CDC-recognized based on their achievement of the goals of the DPP. Institutions enrolled in the DPRP follow the standards and operating procedures to report their DPP data every 6 months to the CDC in a coded manner for evaluation [31]. Looking at the DPRP criteria for success, we found no difference between the two modalities in terms of weight loss or changes in PA minutes. Since all our IP classes were conducted before 2021 and A1c was not listed as an optional success measure reportable to the CDC before the issuing of the 2021 standards and operating procedures, we missed the opportunity to collect A1c for the IP participants and thus were unable to compare the A1c changes in both modalities. However, among the DL completers, 72% achieved the goal of ≥0.2% reduction in A1c, suggesting the effectiveness of the DL modality in diabetes risk reduction.
The DPP is known to be cost-effective from a health system and society standpoint [32], with less than $5,000 per QALY-gained [33]. Digital DPP was also cost-effective [34]. Program costs and values can be found on the National DPP coverage toolkit webpage where program coordinators can calculate the cost of covering DPP for their employees or clients [35]. With cost-analysis in favor of DPP reducing mortality, Medicare started coverage for the Medicare DPP effective April 2018 [35].
Our findings inform our practice in implementing DPP. Since both modalities result in comparable outcomes, modalities should selected and tailored to the served population (e.g., DL may be used in remote areas to overcome transportation issues, or in a population where physical space rental or availability is challenging, etc.). Moreover, such a pandemic-learned lesson of using the DL modality model can be easily applied to other areas of public health. These may include but are not limited to, chronic disease self-management [36], health education and promotion, or other behavioral health interventions (e.g., smoking cessation, mental health support, etc.).
There are some limitations to our findings. The data was collected from the program participants at a single health system, making the results not necessarily generalized to other types of health systems or different geographic areas. Another limitation is the lack of collection of other variables including socioeconomic status, healthcare utilization, and access to DPP, since all data collected were limited to that required for reporting to the CDC’s DPRP. Moreover, the majority of our DPP participants were Whites with a higher level of education which may have affected our results. We also combined Asian Americans, Pacific Islanders, and Native Americans into one group for statistical analysis due to their small sample size, making our results not necessarily generalized to minority races. Despite these limitations, our observations were comparable to national studies involving almost 15,000 participants [25]. Future research is warranted to explore disparities in DPP outcomes among large and more diverse study populations.
5. Conclusions
Both in person and distance learning modalities for the DPP yield comparable results. Observing DPP outcomes in different settings and with different populations would help identify potential causes of attrition and opportunities to enhance retention and better patient outcomes. Such similarities in outcomes may inform public health policy development and practice guidance, particularly the effectiveness and feasibility of the distance learning model for sustaining the delivery of diabetes prevention services in similar public health crises that may occur in the future.
Author Contributions
Conceptualization, H.SA., H.SE.; Methodology, H.SA., H.SE., W-C.L.; Validation, W-C.L., S.B.S., H.SA., and H.SE.; Formal Analysis, L.T., H.SA., H.SE., and W-C.L.; Investigation, M.F., L.T.; Resources, H.SA., H.SE.; Writing – Original Draft Preparation, L.T.; Writing – Review & Editing, L.T., M.F. K.M., S.B.S., W-C.L., H.SA., and H.SE.; Visualization, S.B.S., H.SA., H.SE., and W-C.L.; Supervision, H.SA., H.SE., and K.M.; Project administration, H.SA; Funding Acquisition, H.SA, and H.SE. All authors have read and agreed to the published version of the manuscript.
Funding
This work was supported by the Texas Department of State Health Services (DSHS #HHS000384500001 – PIs: Serag/Sallam).
Institutional Review Board Statement
Our Institutional Review Board deemed the DPP as a non-research project. Consents were not collected from DPP participants. The data presented here were collected under a Quality Improvement Initiative and, as such, do not constitute research on human subjects. This initiative is reported based on the Standards for Quality Improvement Reporting Excellence (SQUIRE 2.0).
Informed Consent Statement
Our Institutional Review Board deemed the DPP as a non-research project. Consents were not collected from DPP participants.
Data Availability Statement
The raw data supporting the conclusions of this article will be made available by the authors on request.
Acknowledgments
The authors acknowledge the Texas Department of State Health Services for their financial support.
Conflicts of Interest
The authors declare no conflicts of interest. The funders had no role in the collection, analyses, or interpretation of data; in the writing of the manuscript; or in the decision to publish the results.
Abbreviations
The following abbreviations are used in this manuscript:
| DPP | Diabetes Prevention Program |
| IP | In person |
| DL | Distance Learning |
| A1c | Hemoglobin A1c |
| PA | Physical Activity |
References
- Centers for Disease Control and Prevention. A Snapshot: Diabetes in the United States. https://www.cdc.gov/diabetes/library/socialmedia/infographics/diabetes.html. Cited on 4/21/2023.
- Centers for Disease Prevention and Control. Diabetes Prevention Recognition Program (DPRP) standards. https://www.cdc.gov/diabetes/prevention/pdf/dprp-standards.pdf. cited on 2/12/2020.
- Knowler, W.C.; Barrett-Connor, E.; Fowler, S.E.; Hamman, R.F.; Lachin, J.M.; Walker, E.A.; Nathan, D.M.; Diabetes Prevention Program Research, G. Reduction in the incidence of type 2 diabetes with lifestyle intervention or metformin. N Engl J Med 2002, 346, 393–403. [Google Scholar] [CrossRef]
- Rezaei Shahrabi, A.; Arsenault, G.; Nabipoorashrafi, S.A.; Lucke-Wold, B.; Yaghoobpoor, S.; Meidani, F.Z.; Rahmati, R.; Ghaedi, A.; Khanzadeh, S. Relationship between neutrophil to lymphocyte ratio and diabetic peripheral neuropathy: a systematic review and meta-analysis. European journal of medical research 2023, 28, 523. [Google Scholar] [CrossRef]
- Lin, X.; Xu, Y.; Pan, X.; Xu, J.; Ding, Y.; Sun, X.; Song, X.; Ren, Y.; Shan, P.F. Global, regional, and national burden and trend of diabetes in 195 countries and territories: an analysis from 1990 to 2025. Sci Rep 2020, 10, 14790. [Google Scholar] [CrossRef] [PubMed]
- Landstra, C.P.; de Koning, E.J.P. COVID-19 and Diabetes: Understanding the Interrelationship and Risks for a Severe Course. Front Endocrinol (Lausanne) 2021, 12, 649525. [Google Scholar] [CrossRef]
- Policardo, L.; Seghieri, G.; Anichini, R.; De Bellis, A.; Franconi, F.; Francesconi, P.; Del Prato, S.; Mannucci, E. Effect of diabetes on hospitalization for ischemic stroke and related in-hospital mortality: a study in Tuscany, Italy, over years 2004-2011. Diabetes Metab Res Rev 2015, 31, 280–286. [Google Scholar] [CrossRef]
- American Diabetes Association. Standards of medical care in diabetes—2024. Diabetes Care. 2024 Jan;47 Suppl 1. https://diabetesjournals.org/care/issue/47/Supplement_1.
- Coppelli, A.; Giannarelli, R.; Aragona, M.; Penno, G.; Falcone, M.; Tiseo, G.; Ghiadoni, L.; Barbieri, G.; Monzani, F.; Virdis, A.; et al. Hyperglycemia at Hospital Admission Is Associated With Severity of the Prognosis in Patients Hospitalized for COVID-19: The Pisa COVID-19 Study. Diabetes Care 2020, 43, 2345–2348. [Google Scholar] [CrossRef] [PubMed]
- Ferguson M., V.J., Phan V., Ali R., Mabe L., Cherner A., Doan T., Manakatt B., Jose M., Powell A.R., McKinney K., Serag H., Sallam H. Coronavirus Disease 2019, Diabetes, and Inflammation: A Systemic Review. Metabolic Syndrome and Related Disorders 2023, 21.
- Klonoff DC, U.G. COVID-19 in patients with diabetes: risk factors that increase morbidity, Metabolism 2020. [CrossRef]
- Bullock, S.L.; Menendez, T.; Schwarte, L.; Craypo, L.; Mosst, J.T.; Green, G.; Barragan, N.C.; Kuo, T. Transitioning to Telehealth during COVID-19: Experiences and Insights from Diabetes Prevention and Management Program Providers in Los Angeles County. Diabetology 2023, 4, 46–61. [Google Scholar] [CrossRef]
- Saeed, S.A.; Masters, R.M. Disparities in Health Care and the Digital Divide. Curr Psychiatry Rep 2021, 23, 61. [Google Scholar] [CrossRef] [PubMed]
- Shan, R.; Sarkar, S.; Martin, S.S. Digital health technology and mobile devices for the management of diabetes mellitus: state of the art. Diabetologia 2019, 62, 877–887. [Google Scholar] [CrossRef]
- Kirwan, M.; Chiu, C.L.; Laing, T.; Chowdhury, N.; Gwynne, K. A Web-Delivered, Clinician-Led Group Exercise Intervention for Older Adults With Type 2 Diabetes: Single-Arm Pre-Post Intervention. J Med Internet Res 2022, 24, e39800. [Google Scholar] [CrossRef]
- Serrano-Ripoll, M.J.Z.-C., R.; Mira Martínez, S.; Fiol-deRoque, M.A.; Malih, N.; Angullo-Martínez, E.; Ricci-Cabello, I. Engaging Primary Care Professionals and People at Risk of Type 2 Diabetes in the Design of PREDIABETEXT, a Multifaceted Digital Intervention Aimed at Preventing Type 2 Diabetes: A Qualitative Study. Diabetology & Metabolic Syndrome 2025, 6. [Google Scholar]
- Block, G.; Azar, K.M.; Romanelli, R.J.; Block, T.J.; Hopkins, D.; Carpenter, H.A.; Dolginsky, M.S.; Hudes, M.L.; Palaniappan, L.P.; Block, C.H. Diabetes Prevention and Weight Loss with a Fully Automated Behavioral Intervention by Email, Web, and Mobile Phone: A Randomized Controlled Trial Among Persons with Prediabetes. J Med Internet Res 2015, 17, e240. [Google Scholar] [CrossRef] [PubMed]
- Fukuoka, Y.; Gay, C.L.; Joiner, K.L.; Vittinghoff, E. A Novel Diabetes Prevention Intervention Using a Mobile App: A Randomized Controlled Trial With Overweight Adults at Risk. Am J Prev Med 2015, 49, 223–237. [Google Scholar] [CrossRef] [PubMed]
- Ghotbi, T.; Salami, J.; Kalteh, E.A.; Ghelichi-Ghojogh, M. Self-management of patients with chronic diseases during COVID19: a narrative review. J Prev Med Hyg 2021, 62, E814–E821. [Google Scholar] [CrossRef]
- Cannon, M.J.; Ng, B.P.; Lloyd, K.; Reynolds, J.; Ely, E.K. Delivering the National Diabetes Prevention Program: Assessment of Enrollment in In-Person and Virtual Organizations. J Diabetes Res 2022, 2942918. [Google Scholar] [CrossRef]
- Lee TC, F.S., Torres M, Winckler B, Ji SG, Dow E. Integrating Undergraduate Patient Partners into Diabetes self-management education: Evaluating a free clinic pilot program for the Underserved. Journal of Health Care for the Poor and Underserved 2013, 27, 1689–1708. [CrossRef] [PubMed] [PubMed Central]
- Brown, S.A.; Garcia, A.A.; Winter, M.; Silva, L.; Brown, A.; Hanis, C.L. Integrating education, group support, and case management for diabetic Hispanics. Ethn Dis 2011, 21, 20–26. [Google Scholar]
- Hoerger, T., Jacobs S, Romaire M, Allaire B, Neuwahl S, Casoglos A, Dempsey M, Elkins W, Markovich P. Evaluation of the Medicare Diabetes Prevention Program Second Evaluation Report | Deliverable #14. https://www.cms.gov/priorities/innovation/data-and-reports/2022/mdpp-2ndannevalrpt. Accessed Nov. 22nd, 2023.
- Poupakis, S.; Kolotourou, M.; MacMillan, H.J.; Chadwick, P.M. Attendance, Weight Loss, and Participation in a Behavioural Diabetes Prevention Programme. Int J Behav Med 2023. [Google Scholar] [CrossRef] [PubMed] [PubMed Central]
- Ely, E.K.; Gruss, S.M.; Luman, E.T.; Gregg, E.W.; Ali, M.K.; Nhim, K.; Rolka, D.B.; Albright, A.L. A National Effort to Prevent Type 2 Diabetes: Participant-Level Evaluation of CDC's National Diabetes Prevention Program. Diabetes Care 2017, 40, 1331–1341. [Google Scholar] [CrossRef]
- Dickman, S.L.; Gaffney, A.; McGregor, A.; Himmelstein, D.U.; McCormick, D.; Bor, D.H.; Woolhandler, S. Trends in Health Care Use Among Black and White Persons in the US, 1963-2019. JAMA Netw Open 2022, 5, e2217383. [Google Scholar] [CrossRef]
- Cutler, D.M.; Lleras-Muney, A. Understanding differences in health behaviors by education. J Health Econ 2010, 29, 1–28. [Google Scholar] [CrossRef] [PubMed]
- Erlangga, D.; Suhrcke, M.; Ali, S.; Bloor, K. The impact of public health insurance on health care utilisation, financial protection and health status in low- and middle-income countries: A systematic review. PLoS One 2019, 14, e0219731. [Google Scholar] [CrossRef]
- Mirowsky, J. Education, Social Status, and Health (1st ed.). Routledge. 2003. [Google Scholar] [CrossRef]
- Hogendoorn B, K.M. , Leopold T. Why Do Lower Educated People Separate More Often? Life Strains and the Gradient in Union Dissolution. European Sociological Review Feb. 2022, 38, 88–102. [Google Scholar] [CrossRef]
- Hazari, A.; Mishra, V.; Agouris, I. Clinical evaluation of painful diabetes peripheral neuropathy in type 2 diabetes patients: Lessons from expatriates in the United Arab Emirates. Diabetes & Metabolic Syndrome 2023, 17, 102832. [Google Scholar] [CrossRef]
- Herman, W.H. The cost-effectiveness of diabetes prevention: results from the Diabetes Prevention Program and the Diabetes Prevention Program Outcomes Study. Clin Diabetes Endocrinol 2015, 1, 9. [Google Scholar] [CrossRef]
- Herman, W.H.; Edelstein, S.L.; Ratner, R.E.; Montez, M.G.; Ackermann, R.T.; Orchard, T.J.; Foulkes, M.A.; Zhang, P.; Saudek, C.D.; Brown, M.B.; et al. Effectiveness and cost-effectiveness of diabetes prevention among adherent participants. Am J Manag Care 2013, 19, 194–202. [Google Scholar] [PubMed]
- Smith, D.H.; O'Keeffe-Rosetti, M.; Fitzpatrick, S.L.; Mayhew, M.; Firemark, A.J.; Gruss, I.; Nyongesa, D.B.; Smith, N.; Dickerson, J.F.; Stevens, V.J.; et al. Costs and Cost-Effectiveness of Implementing a Digital Diabetes Prevention Program in a Large, Integrated Health System. Perm J 2022, 26, 74–82. [Google Scholar] [CrossRef]
- National Diabetes Prevention Program Coverage Toolkit. Cost & Value. https://coveragetoolkit.org/cost-value-elements/. Accessed on 8/22/2024.
- Lorig, K.R.; Ritter, P.L.; Laurent, D.D.; Plant, K. Internet-based chronic disease self-management: a randomized trial. Med Care 2006, 44, 964–971. [Google Scholar] [CrossRef]

Table 1.
Population Demographics by Class Modality.
| Total (N=115) |
In Person (n=53) |
Distance Learning (n=62) |
p-value | ||
|---|---|---|---|---|---|
| Age | 56.3 ± 1.2 | 57.8 ± 1.9 | 55.0 ± 1.6 | 0.26 | |
| Female (n, %) | 94 (82%) | 41 (77%) | 53 (86%) | 0.19 | |
| Race & Ethnicity | 0.41 | ||||
| Asian American and Other Races (n, %) | 5 (4%) | 1 (2%) | 4 (7%) | ||
| Black (n, %) | 16 (14%) | 7 (13%) | 9 (15%) | ||
| Hispanic (n, %) | 33 (29%) | 13 (25%) | 20 (32%) | ||
| White (n, %) | 61 (53%) | 32 (60%) | 29 (47%) | ||
| Education | 0.68 | ||||
| Grade 12 or GED (n, %) | 10 (9%) | 6 (12%) | 4 (7%) | ||
| College 1-3 years (n, %) | 35 (32%) | 15 (29%) | 20 (35%) | ||
| College 4+ years (n, %) | 64 (59%) | 31 (60%) | 33 (58%) | ||
| Age | 56.3 ± 1.2 | 57.8 ± 1.9 | 55.0 ± 1.6 | 0.26 | |
Table 2.
Program Outcomes by Class Modality.
| Total (N=115) |
In Person (n=53) |
Distance Learning (n=62) |
p-value | |
|---|---|---|---|---|
| Start Weight in lbs | 214 ± 57 | 216 ± 57 | 212 ± 57 | 0.66 |
| End Weight in lbs | 203 ± 57 | 205 ± 57 | 201 ± 58 | 0.72 |
| Weight Loss in lbs | 11 ± 12 | 11 ±10 | 10 ± 13 | 0.71 |
| Weight Loss in % | 5.1% ± 0.1 | 5.2% ± 0.1 | 5.0% ± 0.1 | 0.80 |
| Weight Loss<4.0% (n, %) | 45 (39%) | 18 (34%) | 27 (44%) | 0.60 |
| Weight Loss 4.0~4.9% (n, %) | 13 (11%) | 7 (13%) | 6 (10%) | |
| Weight Loss ≥5.0% (n, %) | 57 (50%) | 28 (53%) | 29 (47%) | |
| Start PA in minutes | 63 ± 10 | 8 ± 6 | 109 ± 15 | <0.001 |
| End PA in minutes | 249 ± 20 | 282 ± 37 | 220 ± 21 | 0.13 |
| Level of PA Increase | 186 ± 22 | 274 ± 37 | 111 ± 22 | <0.001 |
| End PA<150 minutes (n, %) | 53 (46%) | 19 (44%) | 34 (47%) | 0.80 |
| End PA≥150 minutes (n, %) | 62 (54%) | 24 (56%) | 38 (53%) |
Table 3.
CDC’s Diabetes Prevention Recognition Program (DPRP) Criteria of Success by Class Modality for Completers.
Table 3.
CDC’s Diabetes Prevention Recognition Program (DPRP) Criteria of Success by Class Modality for Completers.
| DPRP Criteria | Total (N=115) |
In Person (n=53) |
Distance Learning (n=62) |
p-value |
|---|---|---|---|---|
| Weight Loss ≥5.0% (n, %) | 57 (50%) | 28 (53%) | 29 (47%) | 0.60 |
| Weight Loss ≥4.0% and End PA ≥150 minutes (n, %) | 49 (43%) | 24 (45%) | 25 (40%) | 0.59 |
| A1c reduction ≥0.2% (n, %) | N/A | NR | 18 (72%) | N/A |
Table 4.
Association between Participant Characteristics and Outcomes by Class Modality.
| Total (N=115) |
In Person (n=53) |
Distance Learning (n=62) |
|
|---|---|---|---|
| I. Weight Change (%) | |||
| Age | -0.00006 ± 0.00 | -0.00018 ± 0.00 | -0.00002 ± 0.00 |
| Female vs. Male | -0.009 ± 0.01 | -0.0001 ± 0.02 | -0.020 ± 0.02 |
| Race & Ethnicity | |||
| Hispanic vs. Others | 0.028 ± 0.02 | 0.037 ± 0.02 | 0.022 ± 0.03 |
| White vs. Others | 0.032 ± 0.02ǂ | 0.044 ± 0.02ǂ | 0.022 ± 0.02 |
| Education | |||
| College 1-3 vs. Other Status | -0.022 ± 0.02 | -0.0196 ± 0.02 | -0.022 ± 0.03 |
| College 4+ vs. Other Status | -0.010 ± 0.02 | -0.0095 ± 0.02 | -0.008 ± 0.03 |
| Modality | |||
| Distance Learning vs. In-person | 0.00009 ± 0.01 | N/A | N/A |
| II. PA Change (minutes) | |||
| Age | 3.04 ± 1.75 | 6.39 ± 3.19 | 0.41 ± 1.91 |
| Female vs. Male | -69.35 ± 57.88 | -81.50 ± 87.99 | -75.70 ± 65.53 |
| Race & Ethnicity | |||
| Hispanic vs. Others | 39.57 ± 62.59 | 173.67 ± 120.99 | -64.80 ± 67.07 |
| White vs. Others | -5.19 ± 59.30 | -41.43 ± 114.63 | 25.32 ± 59.78 |
| Education | |||
| College 1-3 vs. Other Status | 112.94 ± 68.34 | 209.83 ± 119.71 | 25.32 ± 72.93 |
| College 4+ vs. Other Status | 138.63 ± 63.41ǂ | 137.77 ± 108.92 | 56.19 ± 73.12 |
| Modality | |||
| Distance Learning vs. In-person | -149.81 ± 42.31ǂ | N/A | N/A |
Disclaimer/Publisher’s Note: The statements, opinions and data contained in all publications are solely those of the individual author(s) and contributor(s) and not of MDPI and/or the editor(s). MDPI and/or the editor(s) disclaim responsibility for any injury to people or property resulting from any ideas, methods, instructions or products referred to in the content. |
© 2025 by the authors. Licensee MDPI, Basel, Switzerland. This article is an open access article distributed under the terms and conditions of the Creative Commons Attribution (CC BY) license (http://creativecommons.org/licenses/by/4.0/).
Copyright: This open access article is published under a Creative Commons CC BY 4.0 license, which permit the free download, distribution, and reuse, provided that the author and preprint are cited in any reuse.


