Submitted:
09 June 2025
Posted:
10 June 2025
You are already at the latest version
Abstract
Iron and steel have been two of the main construction materials for engineering structures ever since it was introduced. The ease of construction, high strength to weight ratio are major driving forces of iron and steel construction. Researchers have found that strength of these structures reduces with ageing due to various environmental factors. In the modern world, civil infrastructure of the most of countries is getting older and needing urgent attention, repair and retrofitting to avert any catastrophic failures and thus ensure the safety of occupants. In this context, the prediction of existing strength properties of these structures is significant. However, such strength prediction has been a challengeable issue for design engineers. Considering the nature of structures, extracting iron or steel test specimens for coupon testing is not advisable as it would generate unexpected stress concentrations leading to structural failures. Therefore, there is a need to have methodology that would determine the strength properties of iron and steel members without harming to structures. This paper presents a novel method to find strength properties of iron and steel structures using in-situ Brinell hardness measurements which can be carried out through the portable hammer hitting type Brinell hardness tester. Initially, the obtained in-situ Brinell hardness values are converted to the ultimate tensile strength values which are then used for the determination of the Vicker’s hardness. The Vicker’s hardness is then used to determine the yield strength of the iron or steel material. The proposed methodology is verified with experimental material testing of a 130 years old railway bridge. It was found that the proposed methodology gives a reasonably accurate prediction for strength properties of iron and steel structures. Further, the proposed methodology was validated with a Wrought Iron bridge and a high strength steel bridge in Sri Lanka. Since in-situ test can be performed with low cost and have reasonable accuracy, it can effectively be used in the strength prediction of iron and steel structures.
Keywords:
brinell hardness
; ultimate tensile strength
; yield strength
; iron and steel structures
1. Introduction
In the modern world, civil infrastructure of most countries is getting older and needing urgent attention, repair and retrofitting to avert any catastrophic failures and thus ensure the safety of occupants [1]. In this context, the prediction of existing strength properties of iron or steel structures is of paramount importance. However, this prediction has been a challengeable issue for design engineers since there is no widely accepted low cost methodology.
Considering the nature of structures, extracting test specimens for coupon testing are not advisable as it would cause unexpected stress concentrations leading to structural failures. Therefore, there is a need to have a reasonably accurate and low cost non-destructive type methodology that would predict the strength properties of iron and steel materials without harming to structures.
The hardness is the resistance to localized plastic deformation and it is one of the most important material properties of metals [2]. It is widely used in mechanical engineering applications and it is an indirect measurement of strength of a material [3]. There are different scales used for hardness measurements of metallic materials including iron and steel. Rockwell, Brinell and Vickers have been mostly used hardness scales for metals. Further, ASTM has produced a chart to convert hardness values from one scale to another. Basic fundamental concept of hardness can be used to measure strength properties of metallic materials including iron and steel.
Researchers have studied the hardness and strength of materials in different situations. Organek et al. [4] has studied the relationships between Brinell hardness and strength of structural steel using laboratory sample testing. However, this study is a laboratory based and not focusing on in-situ measurements. Fujita and Kuki [5] have studied the use of ultrasonic hardness measurement with mechanical properties of a structural steel work in Japan. However, use of ultrasonic hardness equipment is costly and needs to verify often and the use of such equipment in applications where cost factor is dominant is questionable. Loporcaro et al. [6] have studied use of hardness measurements in determining plastic strains in reinforcement bars. Liu et al. [7] have studied the use of Leeb hardness measurement of strength measurement in fire damaged steel structures. As mentioned in above literature studies, the use of hardness measurements to predict mechanical properties of steel has been established. However, in-situ, low cost hardness measurements and their relationship to strength properties have not been established. Considering the status of old iron and steel structures, there is a urgent need to develop a low cost simplified and reasonably accurate methodology that would assist practicing engineers in strength estimation.
The in-situ hardness of iron and steel structures can be determined using the portable hammer hitting type Brinell hardness tester. The equipment is versatile since it can be used with any steel structures; bridges, buildings and towers by using first principle techniques.
The relevant standard used in hardness measurement through portable tester is the ASTM E110 Test for Rockwell and Brinell Hardness of Metallic Materials by Portable Hardness Testers [8]. Therefore, the procedure of using in-situ hardness is well established methodology since it has been included as an ASTM guideline.
This paper presents a novel method to find strength properties of iron and steel structures using in-situ Brinell hardness measurements which can be carried out through the portable hammer hitting type Brinell hardness tester.
2. Methodology
A view of the portable hammer hitting type Brinell hardness tester is given in Figure 1. Following steps gives the procedure of the methodology [9].
- i.
- Prior to the measurement, put the shaped end of the standard hardness test block in between the steel ball and the indentor, i.e., to let the spring inside shell press test block on to the steel ball tightly.
- ii.
- Measurements will be taken on points where rusts or corrosion does not exist. The distance between each indentation would be selected based on St Venant Principle.
- iii.
- Having done above, the test will be started. When doing the test, the hardness tester with test block must be first placed perpendicular on the steel member material and then give a perpendicular and instantaneous hit on the indentor with hammer. The hammer which was used is around 1 kg in weight and less than 10 N impact load is applied.
- iv.
- Due to the hit by the hammer, an identation is left at the same time on the standard test block and the member, respectively.
- v.
- The diameter of identation on the standard hardness test block will not be beyond 4.2 mm. In such case, test is ineffective. Therefore, it is obvious that indentation is small that it does not contribute any substantial damage to the member.
- vi.
- When hitting the indentator, attention is to be concentrated, not to hit second time on the same indentation.
- vii.
- Two indentations left on two surfaces (1. On the standard test piece: 2. member) are measured by the attached 20 x microscope (Graduation on the knuckle wheel is 0.01 mm).
- viii.
- If indentation is oval, the average diameter is measured. Further, the center distance between two adjacent indentations on the standard hardness test block must not be less than 10mm.
- ix.
- Then, referring the relevant chart, provided by the manufacturer on the manual, Brinell hardness of the iron or steel material is measured.
Since the equipment is based on first principles, no calibration is needed. Further, indentations were obtained through microscope which has the 20 magnification factor.
These indentation values are used to measure the Brinell hardness using the relationships to obtain tensile and yield strength values. The relationship between tensile strength and yield strength with the Brinell hardness value is explained below [10].
Using Equation (1), the ultimate tensile strength (UTS) value was determined [2]. Then, using this value, substituted in Equation (2), the Vicker hardness (H) is determined. Thirdly, using Equation (3), the yield strength of material is determined [10].
where,
HB = Brinell hardness
where,
UTS = Ultimate Tensile Strength
YS = Yield Strength
H = Diamond Pyramid Hardness (Vickers hardness)
n = Strain-Hardening Exponent (n)
It is important to remove any galvanized layer before applying indentations. This requirement arises as there will be a reduction of indentation due to thickness of the galvanized layer. Further, any surface rust is to be removed before applying indentations.
3. Verification of the Proposed Methodology
A 130 years old railway bridge was selected to illustrate the proposed methodology. At the site, indentation values were obtained using the portable hammer hitting type Brinell hardness tester. Following table shows the Brinell hardness test results.

Table 1.
Brinell hardness test results.
| Element | Indentation on standard test bar (mm) | Indentation on the member (mm) | Brinell Hardness (HB) | Ultimate Tensile Strength (MPa) |
|---|---|---|---|---|
| Cross Girder | 2.64 | 3.69 | 96 | 331 |
| 2.48 | 3.63 | 97 | 335 | |
| 2.46 | 3.58 | 97 | 335 | |
| Main Girder | 2.21 | 2.59 | 100 | 345 |
| 2.18 | 2.46 | 97 | 335 | |
| Bed Plate | 2.35 | 3.38 | 103 | 355 |
| 2.38 | 3.42 | 103 | 355 |
By using the HB, the ultimate tensile strength of the material can be determined as 331 MPa.
By comparing ultimate tensile strength calculated by Brinell hardness test and ultimate tensile strength obtained from literature, it can be concluded that the bridge [11] was constructed by using wrought iron material (Carbon content 0.05-0.25%).
Uniaxial tensile test is known as a basic and universal engineering test to achieve material parameters such as ultimate strength, yield strength, % elongation at the failure, Young’s modulus. The tensile test was carried out in the materials laboratory of the university of Peradeniya from the collected samples of the bridge.
Figure 2.
Test specimens.
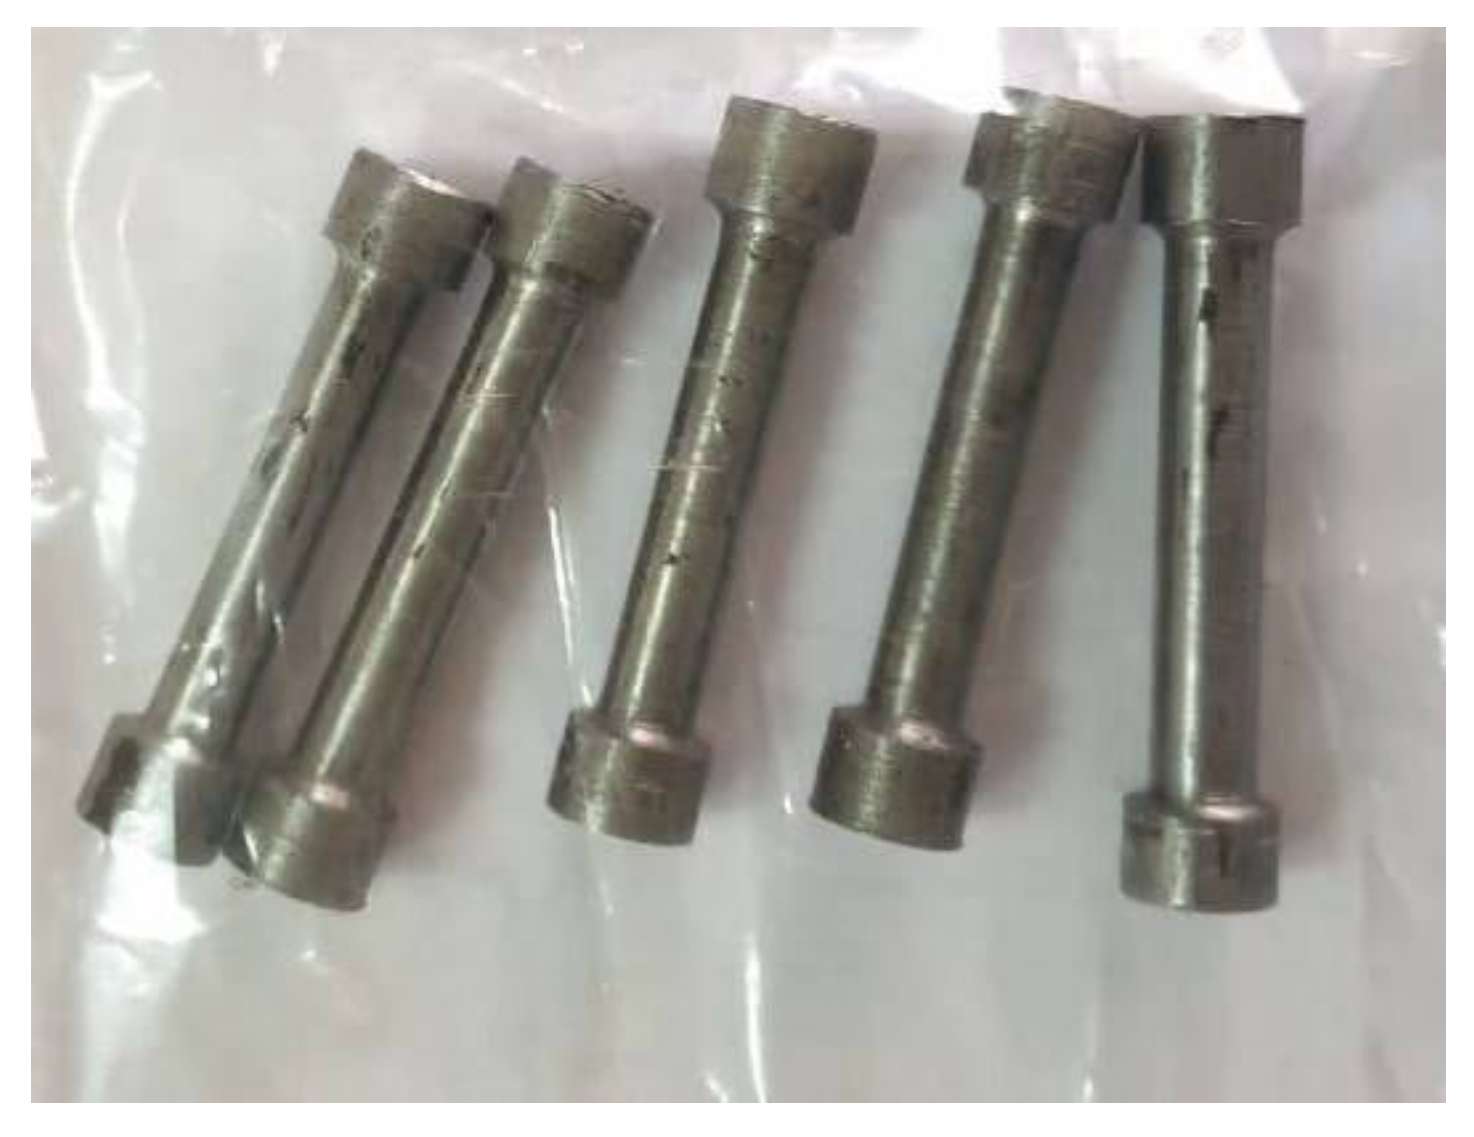
Figure 3.
Uniaxial tensile test.
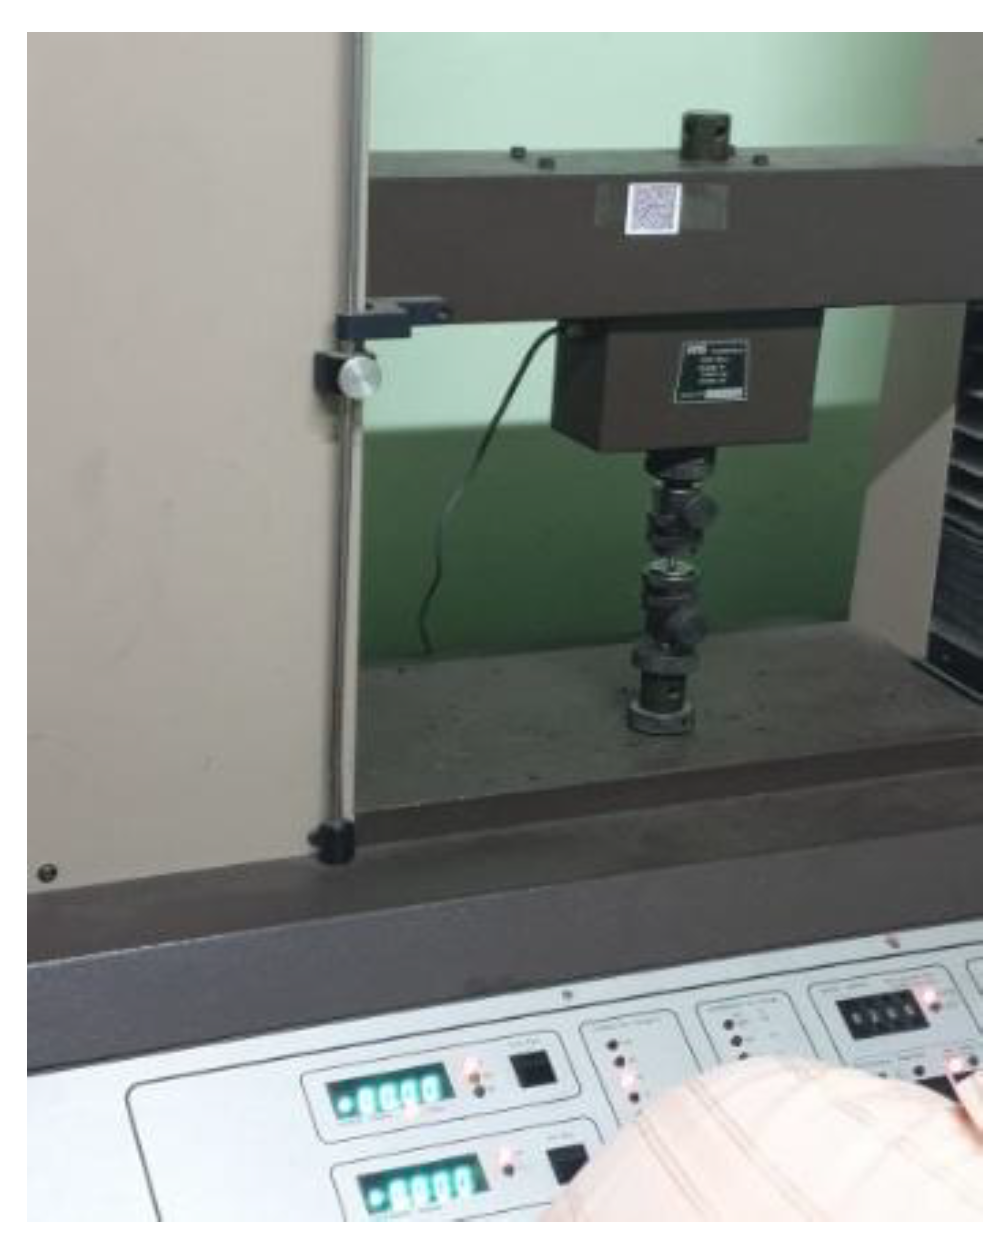
The tensile test is carried out by applying axial load at a specific extension rate until the specimen failure. The output of such tensile test is recorded on computer as force versus elongation. The load deformation characteristics depend on the size of the specimen. Table 2 shows the percentage of elongation and ultimate tensile strength of three samples.
According to this test, the minimum Ultimate Tensile Strength (UTS) is 352 MPa. Table 3 shows the percentage of variation of hardness based UTS from the minimum UTS which was obtained experimentally. As shown, the variation is less than 6%.
Figure 4 shows the variation of minimum UTS with hardness based UTS graphically. As shown there, the variation of hardness based UTS is low from the minimum UTS.
3.1. Proof Stress and Yield Strength
Proof stress is the point at which a particular degree of permanent deformation occurs in a test sample. Proof stress is also called offset yield stress. Typically, the stress needed to produce 0.2 percent of plastic deformation is considered proof stress. When the yield point of a material is not visible, the proof stress is used. Figure 5 shows the illustration of the concept of proof stress.
Table 4 shows the proof stress of samples determined from the graphs of tensile test.
Therefore, the minimum proof stress of 254 MPa was used to determine the percentage of variation of hardness based yield strength values.
Table 5.
Prediction of yield strength and its comparison with experimental proof stress (n = 0.16).
| Element | Hardness based YS (MPa) | Minimum Proof Stress/ Experimental (MPa) | Percentage of variation (%) |
|---|---|---|---|
| Cross girder | 233 | 254 | -8.2 |
| 235 | 254 | -7.4 | |
| 235 | 254 | -7.4 | |
| Main girder | 242 | 254 | -4.7 |
| 235 | 254 | -7.4 | |
| Bed plate | 250 | 254 | 1.6 |
| 250 | 254 | 1.6 |
Strain hardening exponent of low carbon steel varies from 0.08 to 0.25. In the determination of yield strength values (Eqs. 2 and 3), the strain hardening exponent of the material was considered as 0.16. In the absence of exact value, the average value of 0.08 and 0.25 was selected the strain hardening exponent. Figure 6 shows the variation of minimum proof stress with the yield strength by hardness method graphically.
As shown in Figure 6, the variation of minimum proof stress with the yield strength by hardness method is low.
4. Statistical Verification of Hardness Based Ultimate Tensile Strength and Yield Strength
It is important to verify that hardness based UTS and YS values would predict the almost same corresponding strength values of the steel or iron material in statistical point of view. Such verification would strengthen the proposed methodology. Hypothesis testing was performed to verify above requirements. In this context, hypothesis testing for the change of mean strength values were performed. Since hardness based strength values may predict higher or less strength values than the experimental values, two tailed hypothesis testing for the difference in mean values were performed. Then, null and alterative hypothesis are designed below.
where subscript 1 represents hardness based method and subscript 2 represents experimental based tests. Therefore, are mean and standard deviation of hardness based strength value (UTS or YS). is the mean value of material strength values (UTS and proof stress) of experimental tests. Z is the standard unit normal distribution and is the level of significance.
4.1. Hypothesis Testing for Mean Value Difference of Hardness Based UTS and Experimental Based UTS
With hardness based UTS mentioned in the last column of Table 1, statistical parameters were determined. Then, mean value of the experimental based UTS was found using values given the 3rd column of Table 3. Based on the above values, test statistic was determined. Then, was determined based on level of significance value of 1%. The obtained results are shown in Table 6.
As shown in above table, it is possible to mention that hardness based UTS and experimental based UTS are the same with 99% level of confidence.
4.2. Hypothesis Testing for Mean Value Difference of Hardness Based YS and Experimental Based Proof Stress
Statistical parameters of hardness based YS were determined based on values given in Table 5. Then, mean value of the experimental based proof stress was found from Table 4. Based on the above values, test statistic was determined. Then, was determined based on level of significance value of 10%. The obtained results are shown in Table 7.
As shown in above table, it is possible to mention that hardness based YS and experimental based proof stress are the same with 90% level of confidence.
5. Application of the Proposed Methodology
The proposed method was applied to two case study bridges in Sri Lanka. The first case study is a iron bridge and the second case study is a high tensile steel bridge.
5.1. Application of an Iron Bridge
The proposed method was applied to the oldest road bridge in Sri Lanka which was constructed in 1859. It was a brotherhood type truss [12,13] and a view of the bridge is shown in Figure 7. This iron bridge is situated in Central province in Sri Lanka and it is still used for road traffic. The material is a form of Wrought iron and in-situ Brinell hardenss was measured. The obtained hardness values were converted to the yield and ultimate tesnile strength values and the obtained results are given in Table 8.
Above values of yield strength and tensile strength are close to experimentally obtained values of a similar bridge (218 MPa and 340 MPa, respectivelly) [14].
5.2. Application of High Tensile Steel Bridge
High tensile steel bridge which is located in the coastel railway line of Sri Lanka was selected and it was constructed in 2004.
It is through Warren truss with verticals and a view of the bridge is shown in Figure 8. Brinell hardness was measured and those values were converted to the yield and ultimate tensile strength values.
Table 9.
Result Summery of the bridge.
| Parameter | Value |
|---|---|
| Average BHN(µ) | 177 |
| Yield Strength (N/mm-2) | 405 |
| Ultimate Tensile Strength (N/mm-2) | 612 |
Above values of yield strength and tensile strength are close to experimentally obtained values of the bridge (425 MPa and 606 MPa, respectivelly) [15].
6. Conclusions
In-situ Brinell hardness based methodology was introduced to predict the strength properties of iron/steel material. The proposed methodology was verified with a field testing of a 130 years old bridge. It is evident that percentage variations of predicted results from the experimental results are less than 10%. Further, hypothesis testing was conducted for difference in mean value. From the results, it can be concluded that UTS and YS by hardness based method predict reasonably accurate results. In addition, two case study bridges selected from Sri Lanka Railways were used to validate the proposed methodology. These two bridges are made of Wrought iron material and high strength steel materials. Therefore, the proposed methodology is recommended to be used for strength prediction of existing iron and steel structures.
Acknowledgments
The author acknowledges the assistance given by the Department of Civil Engineering, Faculty of Engineering of the University of Peradeniya in experimental testing.
Conflicts of Interest
The authors declare no conflicts of interest.
References
- Frangopol, D.M.; Liu, M. Maintenance and Management of Civil Infrastructure based on Condition, Safety, Optimization, and Life Cycle Cost. Struc. & Infras. Eng. 2007, 3, 29–41. [Google Scholar]
- Callister, D.; Rethwisch, D.G. Material Science and Engineering, 9th ed.; Wiley, 2009. [Google Scholar]
- Cripps, A.C.F. The Measurement of Hardness of very Hard Materials. Surface and Coating Technology 2016, 291, 314–317. [Google Scholar] [CrossRef]
- Organek, P.; Gosowski, B.; Redecki, M. Relationship between Brinell Hardness and Strength of Structural Steel. Structures 2024, 59. [Google Scholar] [CrossRef]
- Fujita, M.; Kuki, K. An Evaluation of Mechanical Properties with the Hardness of Building Steel Structural Members for Reuse by NDT. Metals 2016, 6. [Google Scholar] [CrossRef]
- Loporcaro, G.; Pampanin, S.; Kral, M.V. Investigating the Relationship between Hardness and Plastic Strain in Reinforcing Steel Bars. New Zealand Society of Earthquake Engineering Conference. 2014. [Google Scholar]
- Liu, D.; Liu, X.; Fu, F.; Wang, W. Non-Destructive Post Fire Damage Assessment of Structural Steel Members using Leeb Hardness Method. Fire Tech. 2020, 56, 1777–1799. [Google Scholar] [CrossRef]
- ASTM E110-14; Standard Test for Rockwell and Brinell Hardness of Metallic Materials by Portable Hardness Testers. American Standard for Testing Methods. 2015.
- Operation Manual of Hammer Hitting Type Portable Brinell Hardness Tester. Laizhou Huayin Testing Instrument Co., Ltd. in Shandong Laizhou, China.
- Pavlina, E. J.; Van Tyne, C.J. Correlation of yield strength and tensile strength with hardness for steels. Jour.of Mate. Engin. Perfor. 2008, 17, 888–893. [Google Scholar] [CrossRef]
- Ranaweera, M.P.; Aberuwan, H.; Herath, K.R.B.; Maharoof, A.L.M.; Siriwardane, S.A.S.C.; Adasooriya, A.M.N.D. Assessment of Kelani Railway Bridge over Kelani River. Engineering Design Center, University of Peradeniya, Sri Lanka. 2002. [Google Scholar]
- Abesuiya, A.N. Paragastota Bridge Failure, Annual Research Session. The Institute of Engineers, Sri Lanka. 2014. [Google Scholar]
- Prabodini, S.A.D.N.; Karunananda, P.A.K. Failure Propagation of Paragastota Bridge. Modulus Official Publication of Society of Strucutral Engineers, Sri Lanka, 2024, Volume 31, Issue 2, pp. 17-22.
- Mahadeva, S. Reconstruction of Katugastota Bridge, Transactions. The Institute of Engineers, Sri Lanka, 1939. pp. 21-44.
- Karunananda, P.A.K.; Madusara, H.A.K.M.; Karunarathna, O.G.L.K.; Sanjeewa, T.M. Life assessment of high strength steel bridges under corrosion attack; LAP Lambert Academic Publishers: Saarbrucken, Germany, 2023; ISBN 978-620-6-14305-5. [Google Scholar]
Figure 1.
Brinell hardness Tester and its use.
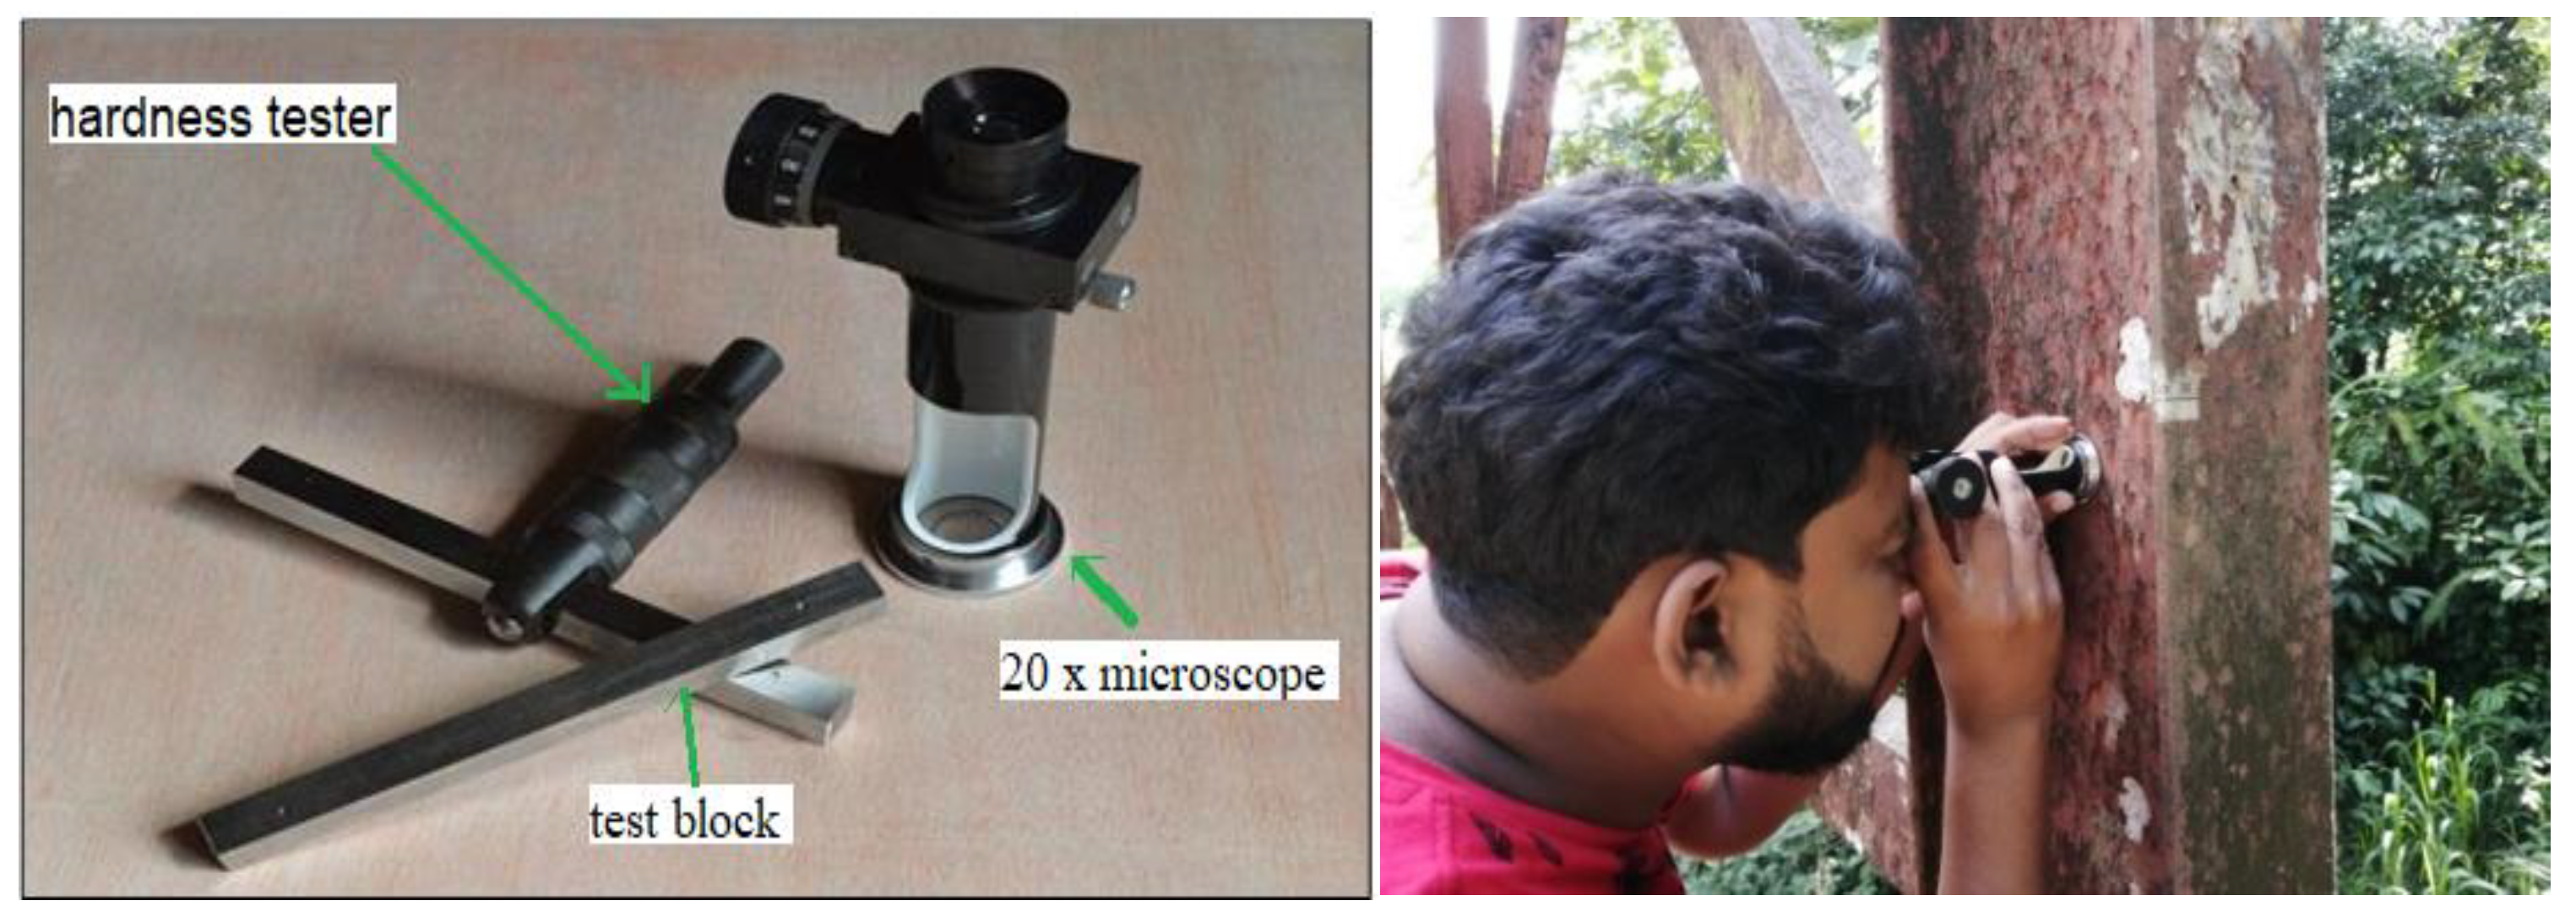
Figure 4.
Graphical representation of experimental based minimum ultimate tensile strength vs hardness based ultimate tensile strength.
Figure 4.
Graphical representation of experimental based minimum ultimate tensile strength vs hardness based ultimate tensile strength.
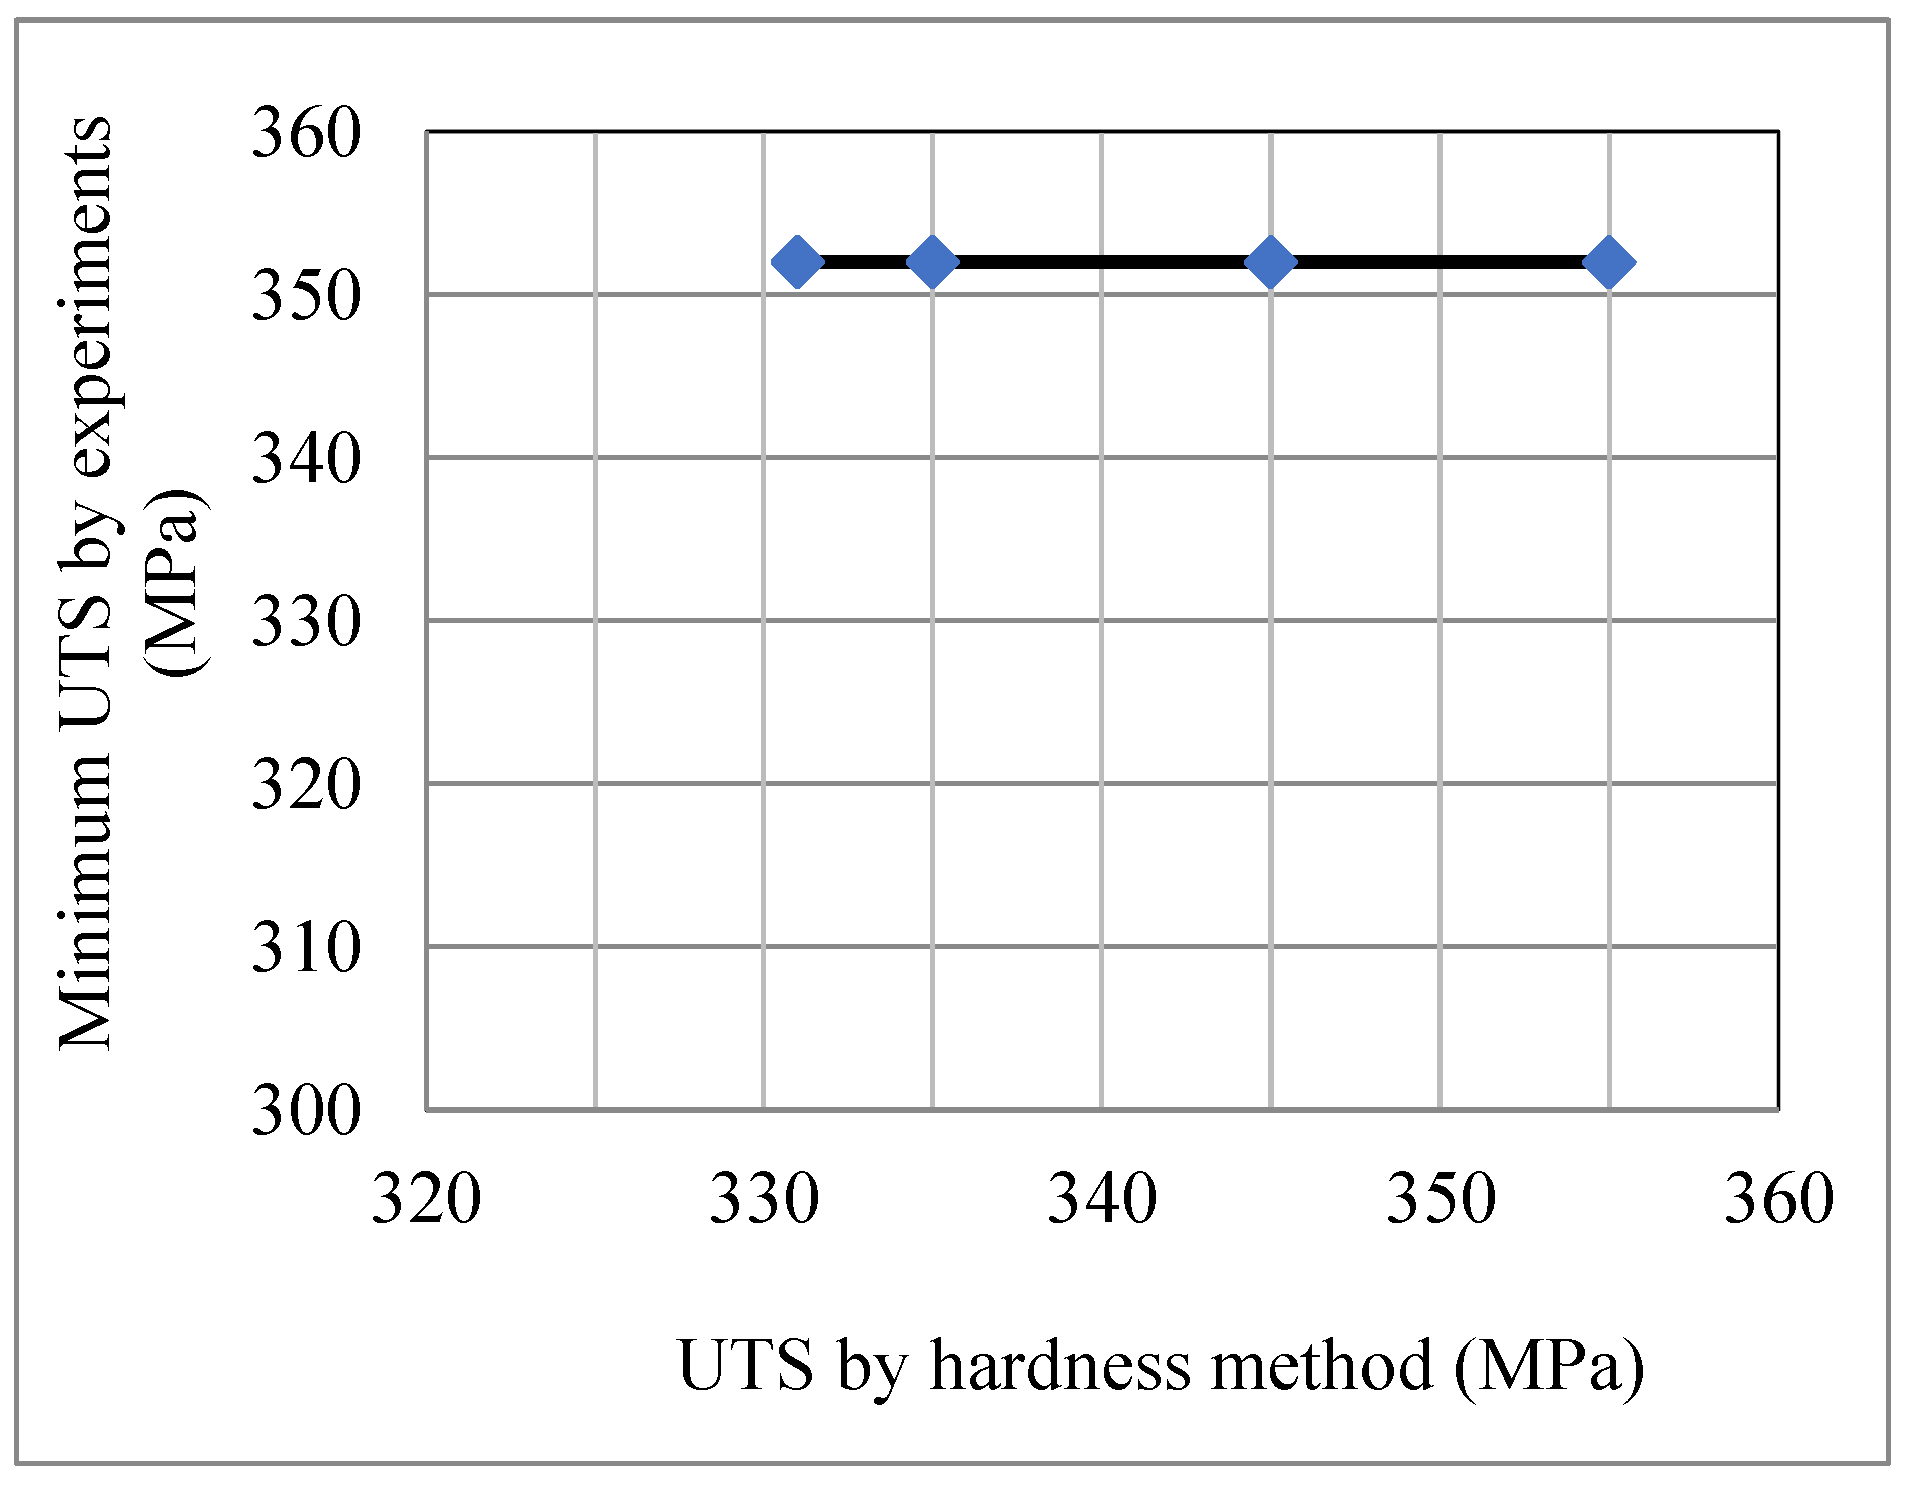
Figure 5.
Graphical representation of proof stress.
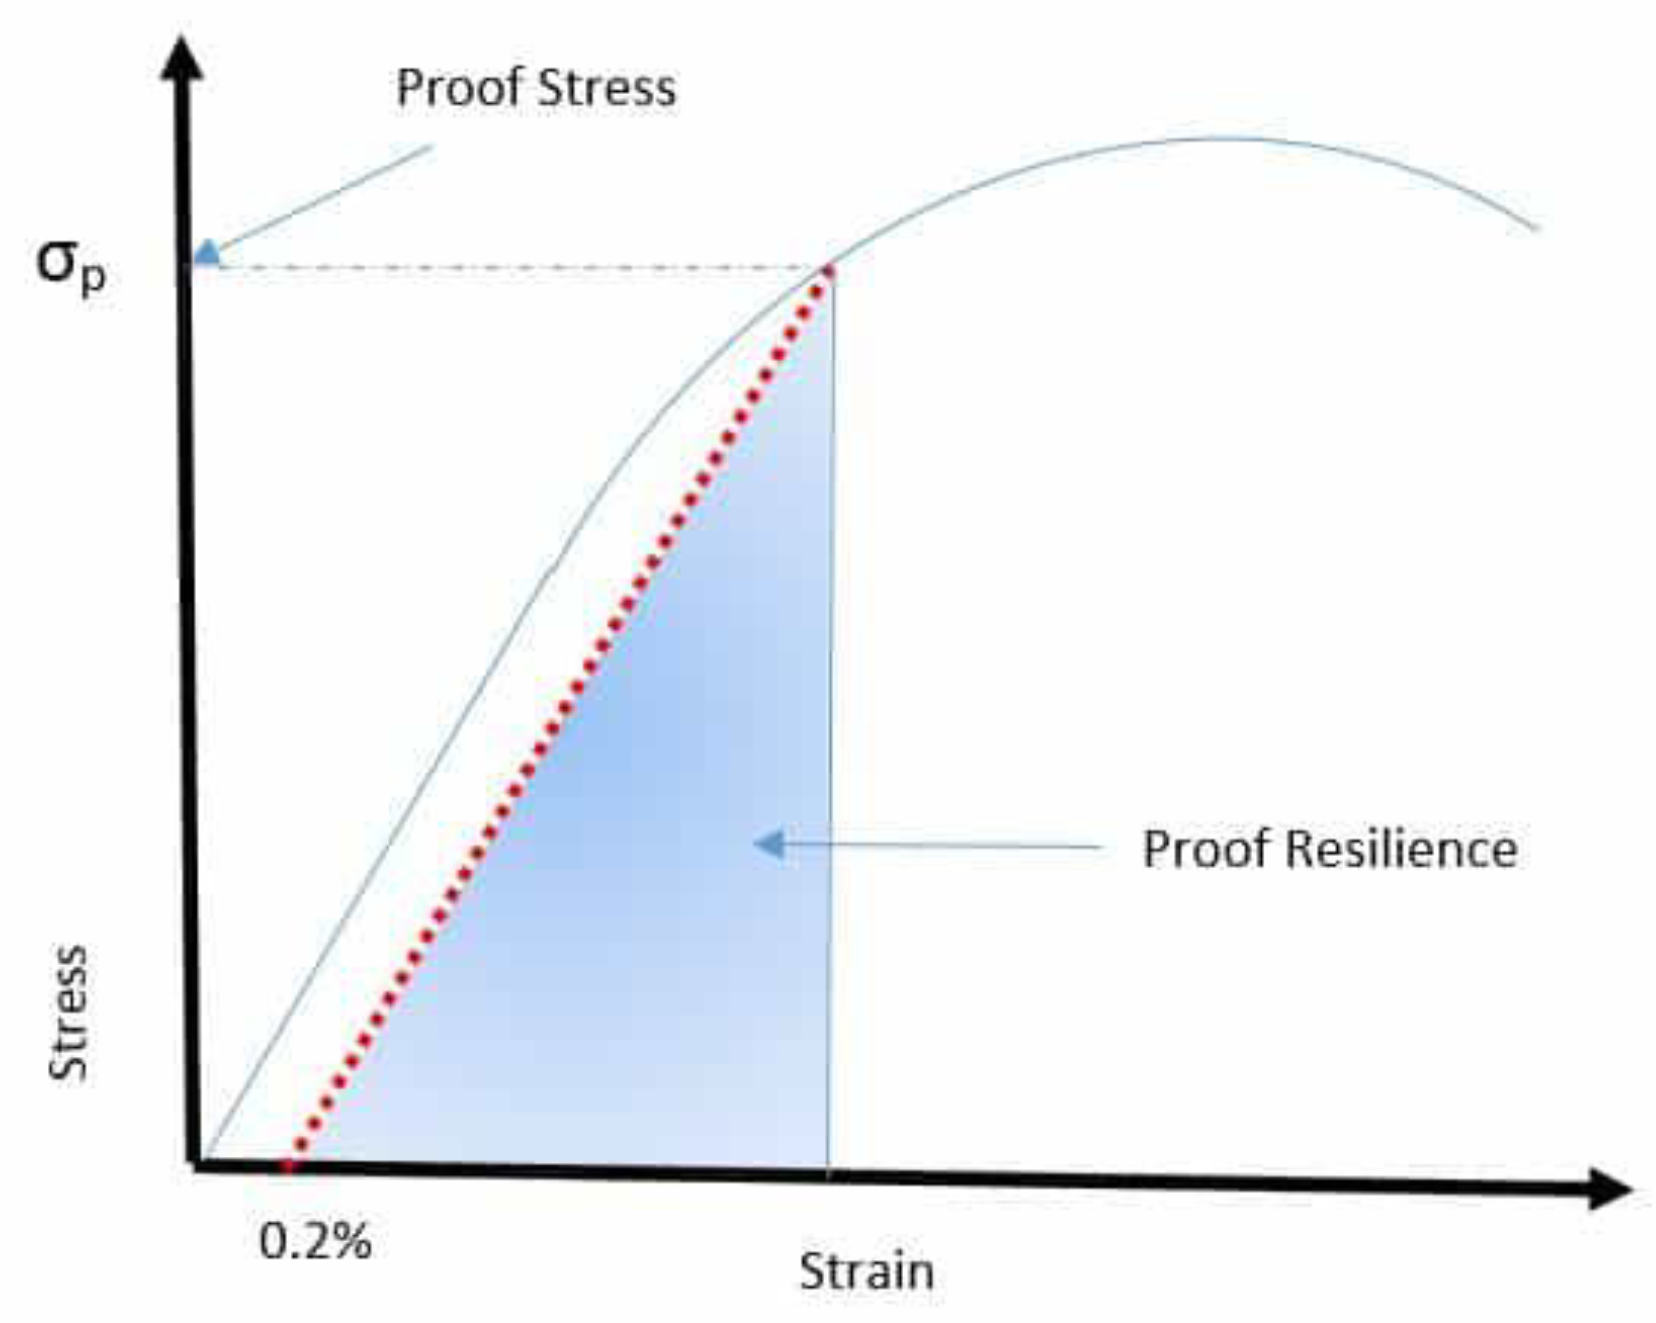
Figure 6.
Variation of minimum proof stress vs yield strength by hardness method.
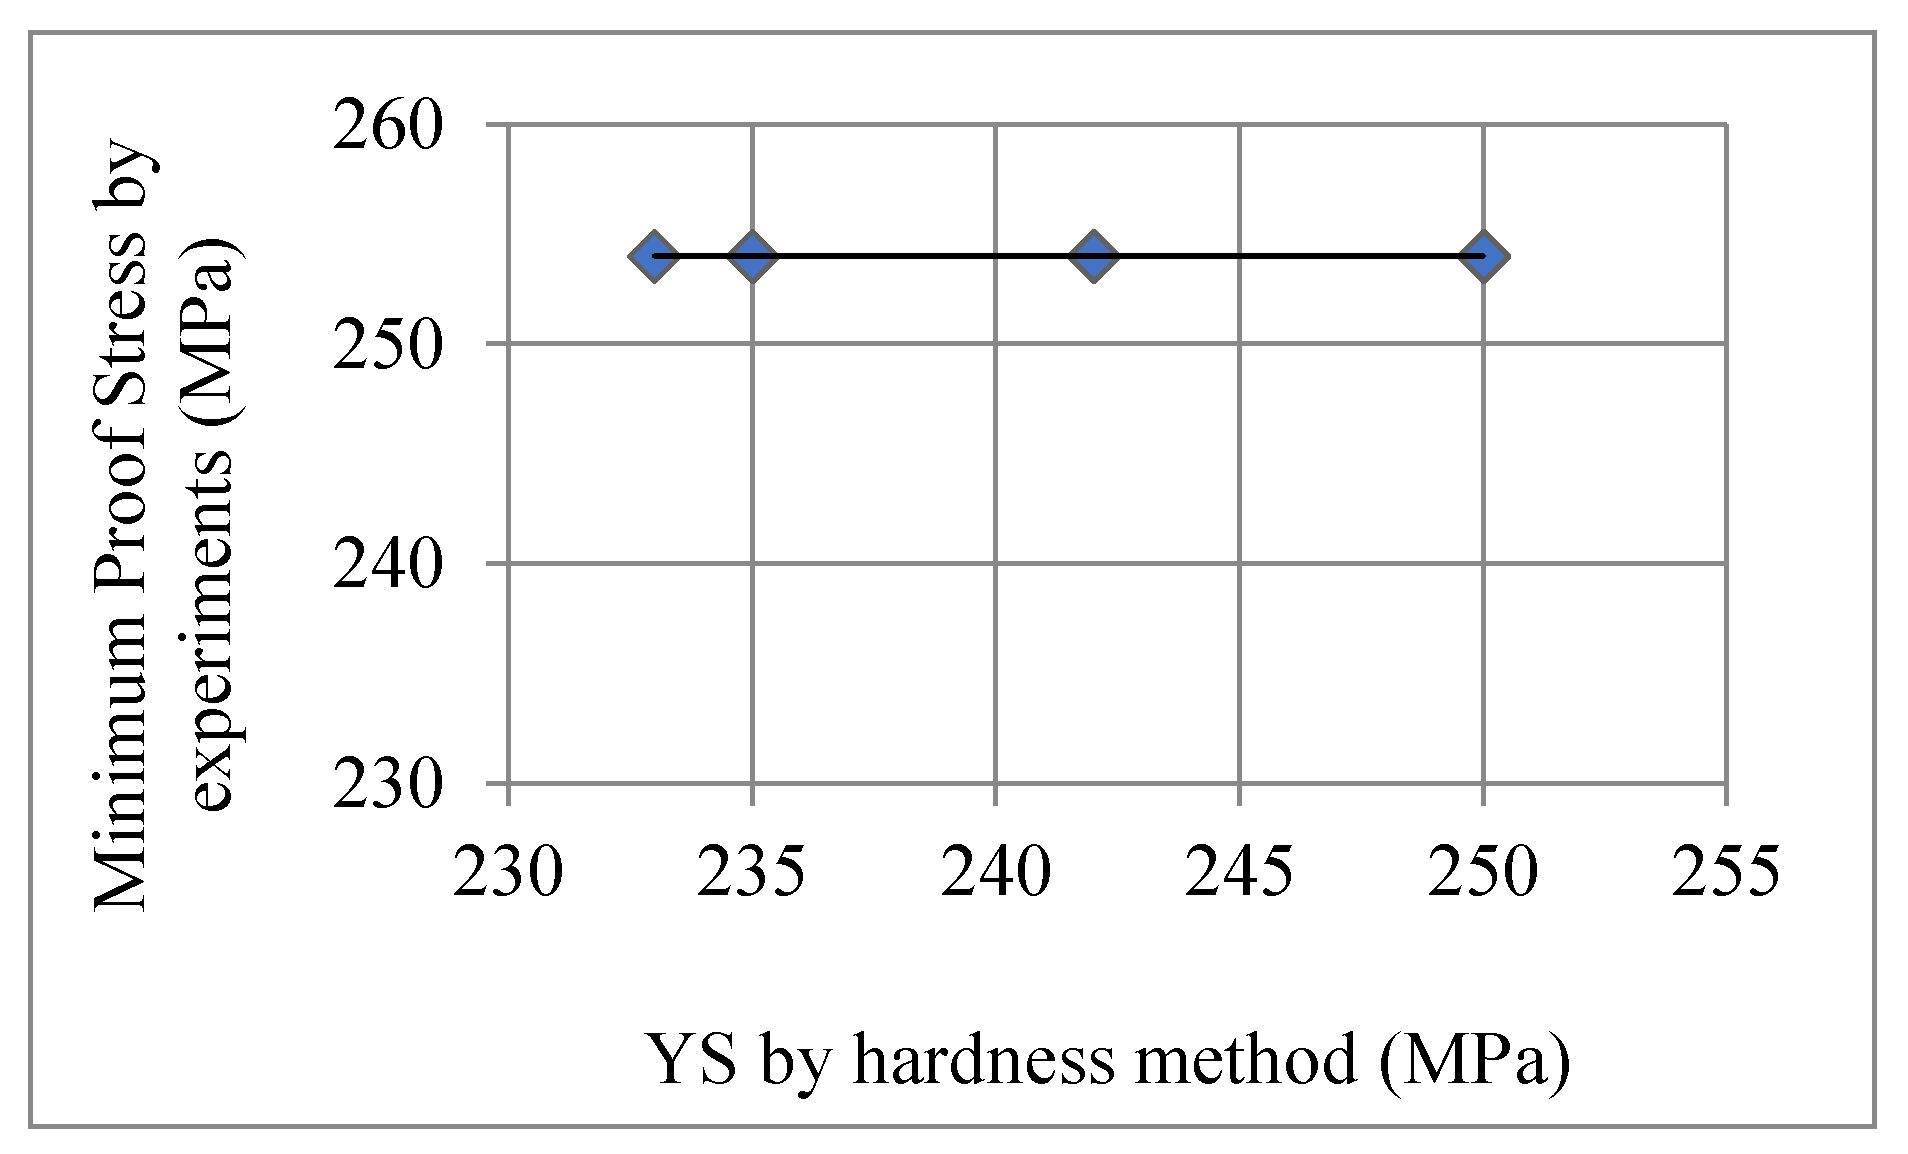
Figure 7.
A view of the Brotherhood truss bridge at Bambarella in Sri Lanka.
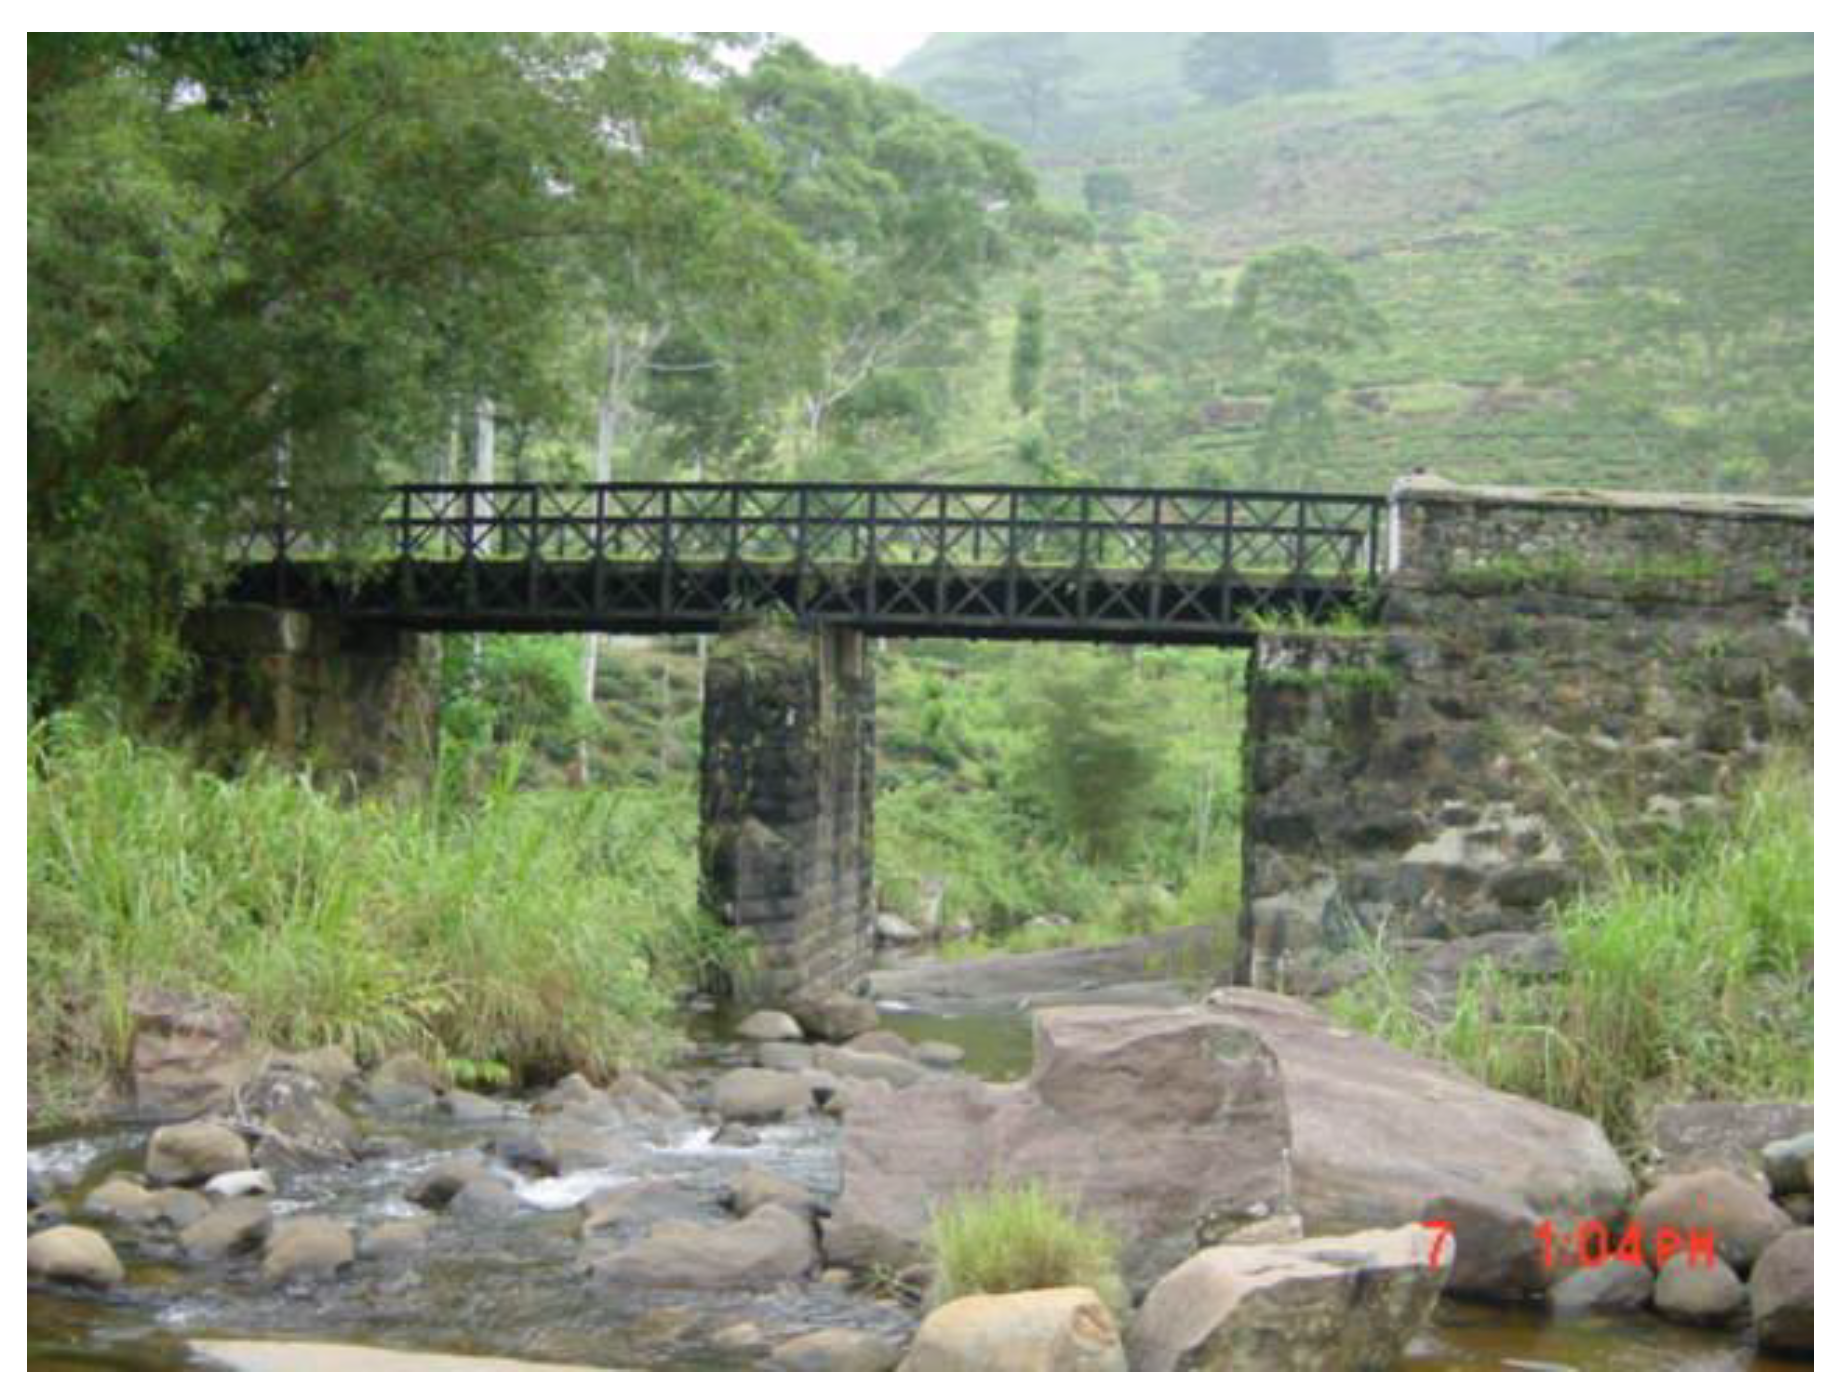
Figure 8.
A view of the high strength steel bridge at Midigama in Sri Lanka.
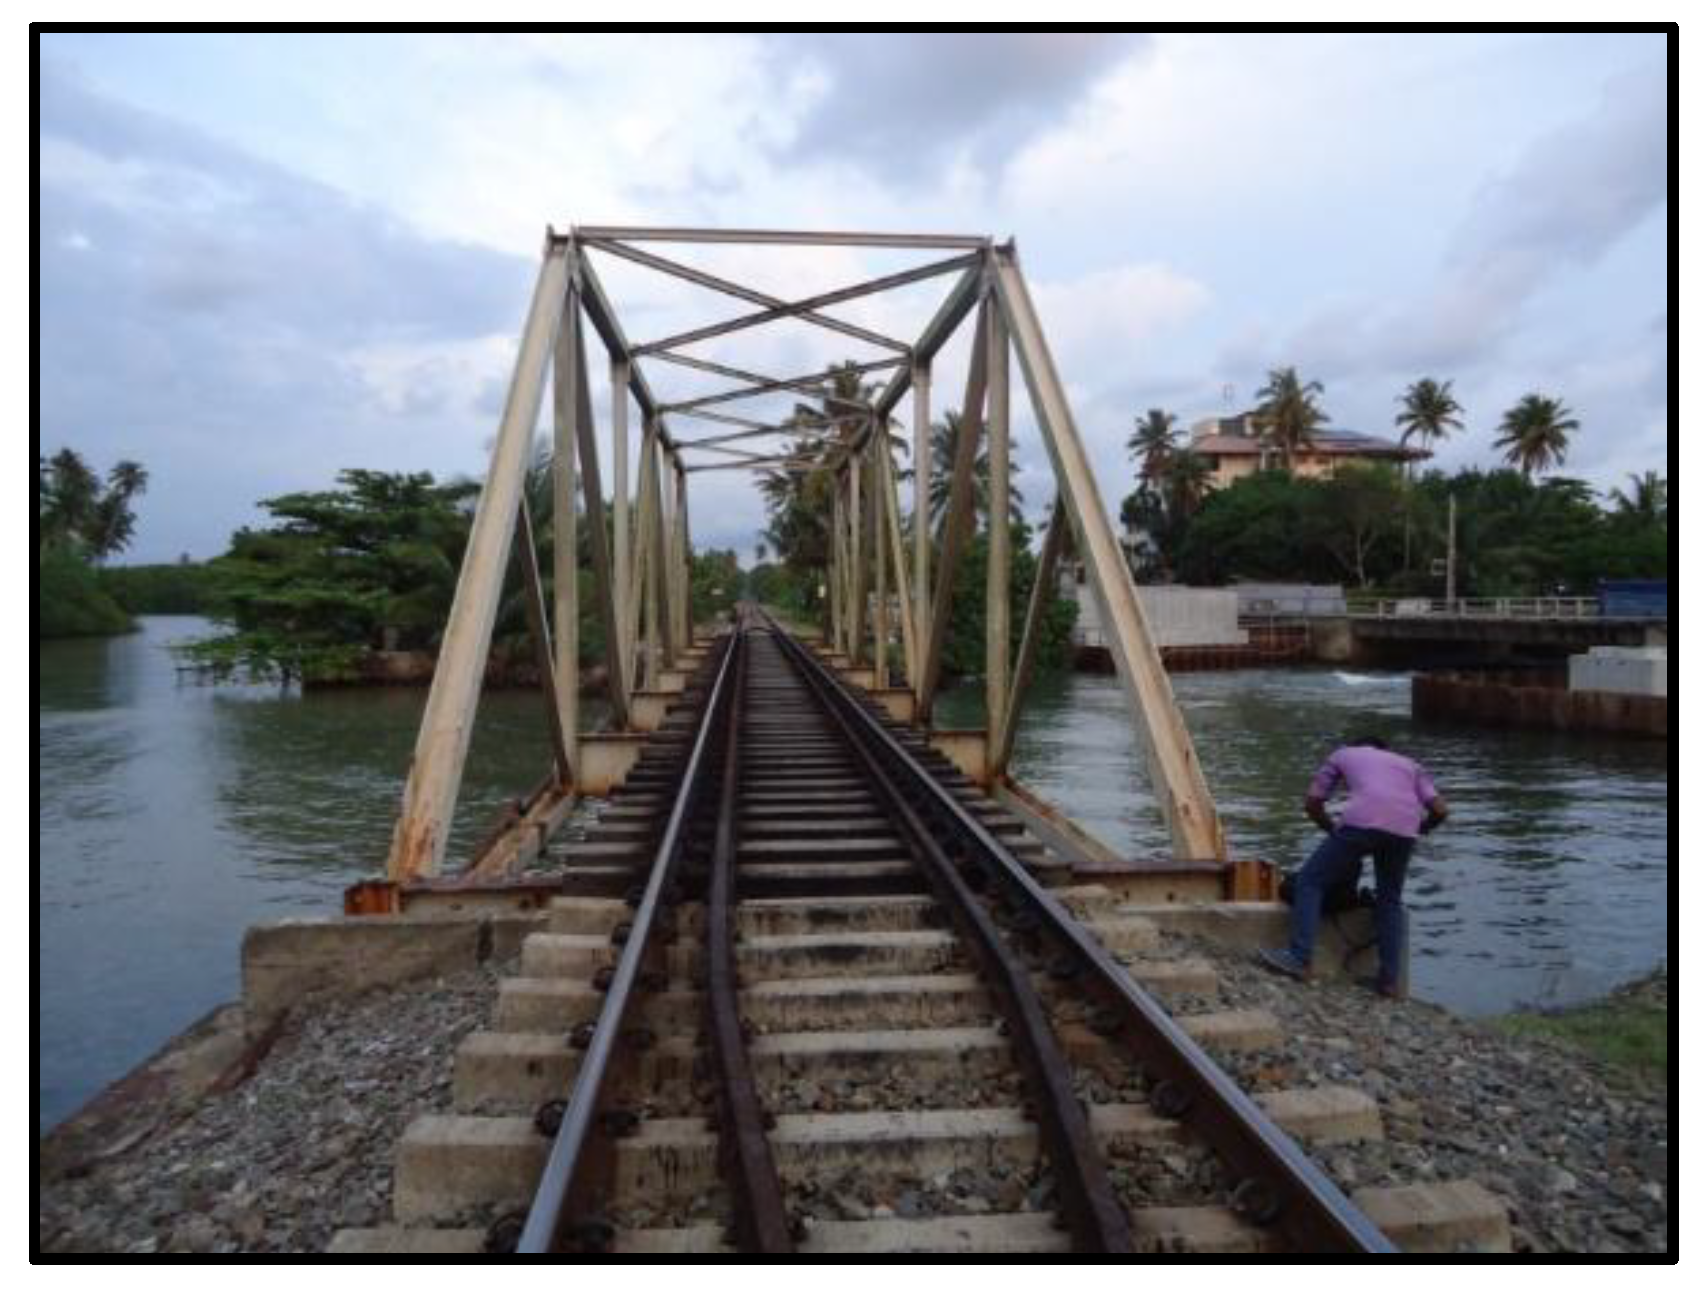
Table 2.
Ultimate tensile strength of the samples.
| Sample Description | Diameter (mm) | Length (mm) | Elongation % | UTS (MPa) |
|---|---|---|---|---|
| Sample 01 | 4.0 | 21.85 | 4.74 | 352 |
| Sample 02 | 4.0 | 21.90 | 13.23 | 369 |
| Sample 03 | 3.9 | 21.80 | 12.62 | 382 |
| Minimum Ultimate Tensile Strength (MPa) | 352 | |||
Table 3.
Percentage of variation of hardness based UTS results.
| Element | Hardness based UTS (MPa) | Minimum UTS/ Experimental (MPa) | Percentage of variation (%) |
|---|---|---|---|
| Cross girder | 331 | 352 | -6.0 |
| 335 | 352 | -4.8 | |
| 335 | 352 | -4.8 | |
| Main girder | 345 | 352 | -1.9 |
| 335 | 352 | -1.9 | |
| Bed plate | 355 | 352 | 0.8 |
| 355 | 352 | 0.8 |
Table 4.
Proof stress values of material.
| Sample Description | εb % | 0.2% εb | Proof Stress (MPa) |
|---|---|---|---|
| Sample 01 | 4.74 | 0.010 | 294 |
| Sample 02 | 13.23 | 0.026 | 254 |
| Sample 03 | 12.62 | 0.025 | 276 |
Table 6.
Summary of hypothesis testing for change of mean values of UTS.
| Parameter | Value |
|---|---|
| Mean of hardness based UTS | 341.57 |
| Standard deviation of hardness based UTS | 4.12 |
| Mean of experimental based UTS | 367.67 |
| Level of significance | 1% |
| Test statistic | -0.903 |
| Acceptable region | (-2.575 to 2.575) |
| Result | Null hypothesis is acceptable |
Table 7.
Summary of hypothesis testing of Change of mean values of YS.
| Parameter | Value |
|---|---|
| Mean of hardness based YS | 240.00 |
| Standard deviation of hardness based YS | 3.02 |
| Mean of experimental based proof stress | 274.67 |
| Level of significance | 10% |
| Test statistic | -1.64 |
| Acceptable region | (-1.645 to 1.645) |
| Result | Null hypothesis is acceptable |
Table 8.
Result Summery of the bridge.
| Parameter | Value |
|---|---|
| Average BHN(µ) | 104.31 |
| Standard Deviation of BHN(σ) | ±2.69 |
| Maximum BHN | 107 |
| Minimum BHN | 101.62 |
| Maximum Tensile Strength (MPa) | 369.15 |
| Minimum Tensile Strength (MPa) | 350.59 |
| Maximum Yield Strength (MPa) | 246.1 |
| Minimum Yield Strength (MPa) | 233.73 |
Disclaimer/Publisher’s Note: The statements, opinions and data contained in all publications are solely those of the individual author(s) and contributor(s) and not of MDPI and/or the editor(s). MDPI and/or the editor(s) disclaim responsibility for any injury to people or property resulting from any ideas, methods, instructions or products referred to in the content. |
© 2025 by the authors. Licensee MDPI, Basel, Switzerland. This article is an open access article distributed under the terms and conditions of the Creative Commons Attribution (CC BY) license (http://creativecommons.org/licenses/by/4.0/).
Copyright: This open access article is published under a Creative Commons CC BY 4.0 license, which permit the free download, distribution, and reuse, provided that the author and preprint are cited in any reuse.


