
Submitted:
07 June 2025
Posted:
09 June 2025
You are already at the latest version
Abstract
Ancient documents that have undergone physical and visual degradation pose significant challenges in the digital recognition and preservation of information. This study adopts a digital forensic approach to segment the Terumbalan palm leaf manuscript preserved by the National Library of Indonesia, which contains symbolic illustrations and traditional Balinese script. The research aims to evaluate and compare the effectiveness of ten thresholding-based segmentation methods in extracting textual content from digitized palm leaf manuscripts. A total of 15 high-resolution images were used, with preprocessing steps including grayscale conversion and median filtering. To assess segmentation performance, ground truth masks were created and evaluated. The results indicate that the locally adaptive Sauvola method consistently outperforms the others, achieving the highest scores across both accuracy and perceptual quality metrics—specifically, an IoU of 0.934, a Recall of 0.971, and an MS-SSIM of 0.800. While Li’s cross-entropy method produced competitive recall performance, it demonstrated lower structural fidelity. In contrast, methods such as Niblack and K-Means yielded poor results due to fragmentation and high sensitivity to noise. These findings highlight the effectiveness of locally adaptive thresholding in recovering faint and degraded scripts in historical documents. Furthermore, this study contributes a replicable digital image forensic analysis and evaluation framework to support future digital preservation efforts involving visually complex manuscripts.
Keywords:
digital forensics
; palm leaf manuscripts
; heritage
; segmentation
; document analysis
; threshold
1. Introduction
Palm leaf manuscripts are a popular cultural heritage in Southeast and South Asia that recorded a wide range of subjects of knowledge, religious beliefs, and artistic and cultural expressions for centuries before the existence of printing systems [1,2]. Due to the large number of Indian speakers in the South Asian region, preservation and research efforts on palm leaf manuscripts continue to grow rapidly, supported by cultural and academic institutions that actively digitize and study their contents [3,4]. In contrast, in Southeast Asia, although palm leaf manuscripts are found in Sanskrit and Kawi, which have historical links to Indian traditions, active users of these languages are now very limited. Among the countries in the region, the Balinese still actively utilize and preserve the palm leaf manuscripts tradition as part of their religious and cultural practices [5]. The preservation of palm leaf manuscripts is crucial due to the organic composition of the material and its vulnerability to degradation from age, environmental conditions, and incorrect handling. [6].
The preservation and analysis of ancient palm leaf manuscripts face various challenges, such as physical damage, fungal attack, and environmental degradation, that make traditional conservation methods inadequate [7]. The complexity of handwritten script and the interaction between text and image in manuscripts add to the difficulty of interpretation [8,9]. Consequently, an improved strategy to address these challenges and facilitate the preservation of these unique cultural artifacts is urgently required [10,11,12]. In the face of this, digital forensics offers innovative solutions through techniques such as image enhancement and segmentation, which enable information recovery from damaged artifacts [13]. Applying this approach to palm leaf manuscripts not only supports the preservation of historic documents but also expands academic access to cultural heritage that was previously difficult to interpret, bridging technology and the humanities in the preservation of past civilizations [14,15].
Image segmentation is one of the most popular research methods that divides palm leaf manuscript images into meaningful regions to isolate specific features [16,17], such as text from the background and some illustrations [18]. Thresholding, a fundamental segmentation technique, converts grayscale images into binary images by selecting an optimal intensity value to distinguish foreground elements from the background [19,20]. Various thresholding methods, including Otsu's [21], Sauvola's [22], and Li's minimum cross-entropy algorithms [23], have been developed to address different image characteristics and degradation levels [24]. Niblack threshold [25], ISODATA [26], and K-means are also examined for segmenting some degraded documents and other ancient collections, such as inscriptions or temple reliefs. These methods have been used in several studies to improve the readability of historical collections and simplify automated analysis [27,28,29,30,31].
The successful performance of thresholding approaches in manuscript analysis is commonly measured using a variety of evaluation metrics. These metrics provide quantitative measures of segmentation performance, allowing researchers to compare different techniques objectively. For instance, Intersection over Union (IoU) and Dice Coefficient assess the overlap between the segmented output and the ground truth [32,33], while SSIM evaluates the perceived quality of the segmentation [34]. By employing these metrics, researchers can identify the most suitable thresholding methods for specific types of manuscripts and degradation conditions. Such evaluations are essential for developing robust digital preservation strategies and ensuring the integrity of the recovered information.
This study focuses on comparing the application of various thresholding techniques to the Terumbalan manuscript, a Balinese palm leaf document characterized by intricate illustrations and traditional script. The manuscript’s complex visual structure and signs of degradation present unique challenges for digital analysis. By systematically applying and evaluating ten different thresholding methods, this study aims to determine the most effective approaches for segmenting and enhancing the manuscript’s content. The insights gained from this study not only enhance our understanding of Balinese manuscripts but also establish a framework for the analysis of other historical artifacts facing similar challenges.
To provide a comprehensive understanding of the study, each chapter of this paper is structured to guide the reader through the research process and findings systematically. The next chapter describes the datasets, the methodology used in this study, including preprocessing stages, and the ten thresholding approaches that were tested, along with the evaluation metrics utilized. The third chapter presents the experimental results and a comparative analysis of the thresholding outputs, followed by Chapter 4 discusses their value in revealing the manuscript's content. Finally, Chapter V summarizes major discoveries, discusses limits, and suggests future research areas in digital preservation and forensic examination of ancient manuscripts.
2. Materials and Methods
The main object of this study is a digitized Balinese palm leaf manuscript called Terumbalan, housed in the National Library of Indonesia [35]. These manuscripts serve not only as linguistic artifacts but also as visual records of cultural practices carried out by the community. To enable forensic analysis of digital images, this study obtained 15 high-resolution image datasets of scanned original Terumbalan palm leaf manuscripts. Figure 1 shows the sample of original Terumbalan palm leaf manuscript image datasets. The datasets present a variety of visual challenges, including uneven lighting, ink bleed-through, noise from leaf fibers, and varying degrees of degradation, thus offering a realistic context for evaluating the robustness of segmentation methods.
This study is grounded in a digital image forensics framework, viewing the segmentation process as an act of structured visual information recovery. The objective of segmentation in this context is to isolate foreground elements from a complex background filled with texture, stains, and physical degradation. The forensic nature of the approach emphasizes reproducibility, transparency, and auditability, the key principles that underpin the investigative character of digital forensics [36]. As shown in Figure 1, the manuscript image features two main types of foreground content: symbolic illustrations and handwritten Balinese script. These elements are the primary focus of the segmentation process, as they carry the meaningful visual and textual information embedded in the manuscript. Surrounding these components is a complex background composed of palm leaf textures, discoloration, and signs of physical aging. The visual contrast between the foreground and background highlights the importance of precise segmentation techniques to isolate the relevant cultural artifacts while minimizing interference from the surrounding noise.
The proposed workflow consists of three main stages: preprocessing, image segmentation using various thresholding methods, and segmentation evaluation, designed to simulate a forensic investigative pipeline for historical manuscript images. As illustrated in Figure 2, the process begins with the input of original images, which undergo a series of preprocessing steps including grayscale conversion and noise reduction using median filtering. This is followed by the application of multiple binarization techniques such as Adaptive Mean, Sauvola, Global Otsu, and others listed under the Image Segmentation process.
To evaluate the accuracy of each segmentation result, a set of ground-truth images was created through a semi-automated annotation process. This involved manually labeling the textual regions after the images were first enhanced through preprocessing and binarization steps, which helped highlight the relevant areas and facilitated more accurate annotation. As shown in Figure 2, the dashed lines connecting the Ground Truth Images to both the Preprocessing and Segmentation Evaluation modules illustrate the supportive role of ground truth data in the overall workflow. While not part of the primary processing sequence, the ground truth was derived from preprocessed images to aid the annotation process and later used as a reference standard for comparing the segmented outputs during evaluation. This visual distinction emphasizes the function of ground truth images as an external benchmark, crucial for validating the segmentation performance without influencing the core processing pipeline.
2.1. Preprocessing
All manuscript images were preprocessed to improve the visual clarity and segmentation readiness of the input data. First, Red ®, Green (G), and Blue (B) images were converted into 8-bit grayscale image format to reduce computational complexity and focus on the segmentation process on luminance information. This transformation emphasizes the green channel, which is more perceptually dominant in human vision, making it suitable for document images where contrast is essential [37].
The grayscale image ( calculated as a weighted average of the RGB components, where the weights, denoted as , , and , are applied to the R, G, and B channels, as shown in Equation (1).
These weights satisfy the constraint ++=1, ensuring that the resulting grayscale image remains within the appropriate intensity range. Commonly used values for these weights are = 0.2989, = 0.5870, and = 0.1140, reflecting the human eye’s higher sensitivity to green [38]. As shown in Figure 3a, the output of this grayscale conversion process successfully enhances the textual and symbolic content of the manuscript while suppressing background color variations. This result serves as a crucial input for subsequent noise reduction and binarization steps in the segmentation pipeline.
Next, median filter was applied using a 3×3 kernel to suppress salt-and-pepper noise while preserving edge details [39]. Median filtering replaces the value of a pixel with the median value of its local neighborhood [40]. Median filters are very efficient for smoothing spiky noise [41], this non-linear filter is effective in preserving edges and stroke boundaries while eliminating isolated noise pixels, which is critical for maintaining the structural integrity of characters. In this study, the median-filtered output at location (, denoted as () is defined as (2).
where the represents the grayscale intensity of the input image at pixel location . Meanwhile, the denotes the 3×3 neighborhood centered at pixel . The visual output of this step is shown in Figure 3b, where the filtered image demonstrates a noticeable reduction in isolated noise artifacts. More importantly, the essential textual and illustrative elements remain sharp and intact, which is crucial for maintaining segmentation fidelity in the later stages of analysis.
2.2. Thresholding Techniques
In this study, image thresholding works by dividing the image into two groups of pixels to separate objects from the background and facilitate object identification [42]. Thirteen proposed methods derived from ten thresholding techniques and some modifications are applied to preprocessed images to generate binary masks that separate text from background. Each method was implemented in Python using the OpenCV and scikit-image libraries, ensuring consistency in the computational environment. The diversity in these methods enables a robust comparison of their performance on visually degraded palm leaf manuscripts. Each method is described further below.
Niblack threshold is a method that calculates the threshold for each pixel based on the mean () and standard deviation () of the pixel values within a local window around it [25,43]. This threshold () at pixel defined in Equation (3) [44].
In this method, the bias setting or boundary pixels of the object (k) is set to –0.2, with the good neighborhood choice is 15 x 15 [45]. Niblack is more prone to noise amplification, particularly in areas with high background variation. Despite this limitation, it is still capable of extracting detailed character structures when used on well-contrasted sections of the manuscript.
Li’s Minimum Cross-Entropy Method, originally proposed by Li et.al, seeks to minimize the cross-entropy between the original grayscale image and its binarized version through an iterative update process [23,46]. This method leverages the minimization of Kullback-Leibler divergence to provide practical solutions under constraints, enhancing accuracy and efficiency in different contexts [47,48]. The method begins by dividing the image histogram into two classes, background (below the threshold) and foreground (above the threshold). For each candidate threshold , the cross-entropy function is computed based on the zero-order and first-order moments of the histogram as shown in (4).
Here, the denotes the histogram count at intensity level , and are the mean intensities of the background and foreground classes, and s the maximum gray level (typically 255 for 8-bit images). The goal is to find the threshold that minimizes this entropy function, which can be formally written as (5).
To enhance computational efficiency, the algorithm employs an iterative formulation that eliminates the need for evaluating all possible intensity levels [46]. The threshold is progressively updated based on (6).
This process is repeated until convergence, typically when the difference between successive thresholds is negligible. The variables and represent the mean intensities of the background and foreground classes at iteration . The use of logarithmic terms in the denominator ensures that the threshold is sensitive to entropy variations across the two classes, making it particularly effective for handling visual degradations and soft intensity transitions found in ancient manuscript images.
ISODATA (Iterative Self-Organizing Data Analysis Technique) thresholding calculates a threshold iteratively by partitioning the histogram into two classes and computing the average intensity of each [26]. Although it lacks a formal closed-form equation, it involves repeating mean calculations until the threshold value stabilizes [49]. In this method, the threshold () output can be obtained from (7), where and represent the means of each histogram separated by the threshold [49].
K-Means Clustering threshold uses an unsupervised learning algorithm to assign pixels into two intensity-based clusters. The algorithm minimizes the intra-cluster variance through centroid updates and is robust to a range of intensity distributions. However, it is sensitive to initial cluster centers and may misclassify pixels in homogeneously textured areas. The K-Means threshold can be shown in (8) [50].
Where represents the total loss or compactness of the clustering, is the number of data ppoints while is the number of clusters. In this equation, represents the -th data point in the dataset, while denotes the centroid of the -th cluster. The term calculates the squared Euclidean distance between the data point and the cluster center. The double summation indicates that the algorithm considers the distance from every point to every cluster center, although in practice, each point is only assigned to its closest center.
Adaptive Mean calculates the threshold value for each pixel based on the mean intensity of its local neighborhood. The threshold is computed using Equation (9):
In the adaptive mean thresholding method, the threshold value for each pixel is calculated based on the average intensity of the pixels within a local neighborhood window surrounding that pixel. refers to the mean grayscale value of all pixels in the local window centered at position . To fine-tune the threshold and increase its robustness against slight background variations or noise, a constant value is subtracted from the local mean. This constant acts as a bias and can be adjusted depending on the characteristics of the image.
As a result, the final threshold dynamically adapts to local intensity variations rather than relying on a single global value. This method is more flexible than global thresholding because it adapts to local image conditions, especially in images with uneven lighting or complex backgrounds [51]. It is particularly useful in documents with uneven illumination because it provides better visual quality and lower misclassification errors but may still be sensitive to local noise or structural inconsistencies in the manuscript surface [52].
Adaptive Gaussian operates similarly to Adaptive Mean but uses a weighted Gaussian kernel instead of a uniform one [53]. Its threshold computation is defined in Equation (10):
Instead of treating all pixels in the neighborhood equally, this approach assigns higher importance to pixels closer to the center of the window. The Gaussian kernel is denoted by , where controls the spread or standard deviation of the Gaussian distribution. The convolution of this kernel with the input image , expressed as . Yields a weighted local mean that better preserves gradual intensity changes, such as those caused by lighting gradients or ink fading. A constant is then subtracted to adjust the sensitivity of the thresholding. The Gaussian weighting improves the method’s robustness to gradual intensity changes, making it effective for palm leaf manuscripts where ink fading and lighting gradients are present. However, it may still struggle with high-contrast edges or extremely faint text regions.
Otsu threshold is a reimplementation of the Global Otsu method using floating-point arithmetic, improving precision in datasets with subtle grayscale variations. While its conceptual foundation is identical to the original Otsu, it enables more nuanced segmentation in high-resolution images such as those in this study.
Global Otsu determines a single global threshold that minimizes intra-class variance in intensity distribution [26]. It computes the optimal threshold by minimizing the weighted sum of within-class variances, as shown in Equation (12).
where and are the probabilities of the two classes separated by threshold , and and are the means of those classes. The threshold that maximizes is selected. This method is efficient and well-suited for images with bimodal histograms where foreground and background intensities are well-separated. Where is the probability that the data can be below the threshold, and is the probability that the data can be above the threshold [26].
Otsu Morph enhances the output of the basic Otsu method by applying morphological operations. Morphological opening followed by closing removes small artifacts and bridges fragmented text strokes, improving readability. The process to obtain the otsu morph output is defined in Equation (13):
In this process, Binary image result from multilevel Otsu thresholding, and is the structuring element that defines the shape and size of the local neighborhood. The symbol denotes dilation, which expands the foreground region by adding pixels to the object boundaries, while represents erosion, which trims away noise and sharpens the object’s shape. This combination helps to close small gaps, connect broken lines, and reduce noise in the background [54].
Sauvola’s method adapts the threshold using both local mean () and standard deviation () to account for illumination variability [22]. It is formulated in Equation (7):
In this equation, is the local mean, is the local standard deviation, is a tunable parameter typically set between 0.2 and 0.5 (commonly 0.5), and represents the dynamic range of the standard deviation, usually set to 128 or 255. The default window size for local calculation is typically set to 15×15 pixels, which balances the need to capture sufficient local context without over-smoothing fine text structures. This method was originally developed for degraded document images and has proven highly effective in dealing with textured or stained backgrounds. This study showed particular strength in preserving fine character details even under inconsistent contrast conditions.
2.3. Quantitative Evaluation Metrics
This study employed seven evaluation metrics to comprehensively assess each thresholding method’s performance in segmenting Balinese palm leaf manuscripts. These metrics are categorized into two groups based on their analytical orientation: first, the pixel-wise classification metrics derived from the confusion matrix, and second, a structure-based metric that evaluates perceptual similarity. In the context of forensic recovery of ancient manuscripts, such as palm leaf documents, it is not only important to classify text regions accurately but also to preserve the visual structure of the characters. Each of the following metrics provides a different perspective on segmentation quality, making them suitable for a well-rounded evaluation.
2.3.1. Confusion Matrix-Based Metrics
Confusion matrix-based metrics quantify how accurately the segmentation algorithm classifies each pixel in the image as either foreground (text) or background (non-text). These include Intersection over Union (IoU), Dice Coefficient, Accuracy, and Recall. Each of these metrics is calculated based on four fundamental classification outcomes. First, the True Positives () refer to correctly identified text pixels, while True Negatives () denote correctly identified background pixels. False Positives () occur when background pixels are incorrectly labeled as text, and False Negatives () represent missed text pixels [55]. These components form the basis for computing pixel-level performance and allow for detailed evaluation of both over-segmentation and under-segmentation in document image analysis.
The Intersection over Union (IoU) is also known as the Jaccard Index. It determines the amount of overlap between the segmented output and the ground truth. IoU is defined as the ratio of the intersection of the expected and actual foregrounds to their union. A high IoU implies that the segmentation result closely matches the real character regions. Mathematically, this is expressed as (15) [32,33].
The Dice Coefficient offers another perspective on region similarity. Dice Coefficient also quantifies the overlap, but gives more weight to true positives. It is considered more sensitive than IoU when dealing with small or thin foreground regions, such as handwritten characters. Dice is especially important when evaluating segmentation performance on delicate character strokes, where even small mismatches can result in loss of semantic meaning. The formula as shown in (16).
Accuracy, which measures the overall proportion of correctly classified pixels. It accounts for both foreground (text) and background (non-text) regions and is useful for understanding general segmentation correctness. While intuitive and easy to compute, accuracy can be misleading in datasets with class imbalance, such as manuscripts where background pixels dominate. It is defined in Equation (17).
Recall, also referred to as sensitivity or true positive rate. It evaluates how many of the actual text pixels were correctly identified by the segmentation algorithm. In forensic contexts, high recall is desirable because missing even faint or partially degraded characters can result in a loss of critical historical or linguistic information. It is defined in Equation (18).
2.3.2. Structure-Based Similarity Metrics
In addition to pixel-wise evaluation, this study also applied a set of structure-based similarity metrics to assess the perceptual and structural similarity between the segmented output and the ground truth. These metrics provide insights beyond simple classification accuracy by considering how well the visual and spatial properties of the original manuscript are preserved. In digital forensics, such structure-aware evaluation is crucial for ensuring that recovered texts retain their shape, continuity, and readability, especially in historical documents like palm leaf manuscripts.
The Structural Similarity Index Measure (SSIM) to assess the perceptual similarity between the segmented output and the ground truth. Unlike classification metrics, SSIM considers local luminance, contrast, and structure to model human visual perception. This is critical in digital forensics, where accurate recovery of text shape, stroke continuity, and layout are essential. The SSIM is calculated over local windows in the image and is defined in (19) [56].
Here, and represent the means, and the variances, and the covariance of the predicted and ground truth images. The constants and are used to stabilize the computation in the presence of low denominators. SSIM values range from 0 to 1, with values closer to 1 indicating higher structural similarity [57,58].
The Feature Similarity Index Measure (FSIM) evaluates perceptual similarity using two human-sensitive features: phase congruency (PC) and gradient magnitude (GM). FSIM assesses how well important visual structures like edges, strokes, and lines are preserved in the segmented image. It is defined in (20):
In this formula, represents the maximum phase congruency between the reference and test images at pixel and is the combined similarity of phase congruency and gradient magnitude at that pixel. FSIM values also range from 0 to 1, with scores above 0.70 considered excellent for structural preservation, particularly for handwritten characters with fine strokes and curves [59].
Multi Scale Structural Similarity Index Measure (MS-SSIM) extends the original SSIM by evaluating image similarity at multiple scales, which better reflects the way humans perceive structural information across different resolutions. At each scale, contrast and structure similarities are measured, while luminance is only assessed at the coarsest scale [60].
In the MS-SSIM formula, the variables play distinct roles in assessing the structural similarity between two images at multiple scales. The terms and represent the two image signals being compared—typically the reference (original) image and the test (distorted or processed) image. The total number of scales used in the analysis is denoted by , with the image progressively downsampled at each scale. At the coarsest scale , luminance similarity is evaluated using the function , which measures how closely the average brightness levels of the two images match. For each scale (where =1,2,…,), the contrast similarity is represented by , which compares the standard deviations (or local contrast) of the images, while denotes the structural similarity that captures the correlation between local patterns or textures. Each component—luminance, contrast, and structure—is raised to an exponent , , and , which acts as a weight to control its contribution to the final MS-SSIM score. These weights are empirically chosen to reflect the perceptual importance of each component at different scales. The contrast and structure terms are aggregated multiplicatively across all scales using a product operation, providing a comprehensive and hierarchical measure of visual similarity that aligns with human perception.
The Gradient Magnitude Similarity Deviation (GMSD) is a dissimilarity-based metric that captures structural distortion by comparing the gradient magnitudes between two images. It is particularly sensitive to edge and contour inconsistencies—key elements in character segmentation. GMSD is computed as the standard deviation of the gradient magnitude similarity map, defined in (21):
where is the gradient magnitude similarity at pixel and is the mean gradient magnitude similarity. The value of GMSD increases as structural distortion grows, meaning lower values are better. Typically, values below 0.35 are interpreted as structurally accurate, while values above 0.45 indicate significant deviations in edge alignment or stroke consistency [61].
Together, SSIM, FSIM, MS-SSIM, and GMSD offer a comprehensive evaluation framework that captures both human perceptual quality and structural correctness. Their combined use ensures a well-rounded assessment of the segmentation performance, especially important in the forensic processing of ancient scripts, where maintaining visual authenticity is critical.
3. Results
This section presents the segmentation results of ten different thresholding methods and evaluates their effectiveness in extracting characters from Balinese palm leaf manuscripts. A visual sample of segmentation outputs for each method is presented in Figure 4. The visual comparison highlights how each method handles the challenges posed by the unique characteristics of the manuscript, including aging and damaged textures in some parts, as well as fading or discontinuous character strokes and images.
Among the presented outputs, the Sauvola method (Figure 4j) demonstrates superior performance in maintaining the integrity of character strokes, particularly in preserving line continuity and preventing character disintegration. In contrast, methods such as Niblack (Figure 4g) show a lot of background noise and fragmented character outlines, especially in areas with uneven lighting. Although some parts of the text and illustrations are successfully captured, much of the fine character structure is damaged. Meanwhile, K-Means (Figure 4e) shows more fragmented output, with character boundaries appearing jagged or partially eroded.
Moreover, Adaptive Gaussian (Figure 4a) and Adaptive Mean (Figure 4b) methods show smoother background suppression, but they occasionally over-smooth fine details, leading to partial loss of thinner strokes. Meanwhile, the Otsu (Figure 4h) and Global Otsu (Figure 4c) methods produce balanced results, though some stroke thinning and background noise can still be observed. The output from ISODATA (Figure 4d) appears moderately consistent, though line merging occurs in densely written regions. Moreover, Li’s Minimum Cross Entropy (Figure 4f), while sharp in contrast, tends to exaggerate transitions at stroke boundaries, causing minor distortions. Overall, this visual inspection provides an essential preliminary insight into the segmentation behavior of each method before delving into quantitative performance metrics.
After comparing each segmentation result with the ground truth masks, a quantitative evaluation was conducted using confusion matrix-based metrics as summarized in Table 1. The Sauvola method emerges as the most reliable, achieving the highest IoU score of 0.934, indicating a strong overlap between the predicted masks and the ground truth annotations. The Dice coefficient of 0.966 further reinforces the quality of segmentation, reflecting an excellent balance between true positive detections and the minimization of false classifications. Remarkably, Sauvola also attained the highest Recall value of 0.971, demonstrating its superior sensitivity in capturing nearly all text regions, even subtle and degraded strokes. The method’s Accuracy of 0.942 underscores its robustness in correctly classifying both foreground and background pixels, thus minimizing segmentation errors across the board.
Meanwhile, the Li’s Minimum Cross Entropy closely follows with high Dice (0.940) and Recall (0.959), suggesting that while it performs slightly lower in terms of overlap with IoU value of 0.887, it still maintains substantial pixel-level alignment with ground truth. On the other hand, methods like Niblack, which achieved IoU value of 0.741 and a Recall in 0.755, underperform across all metrics, likely due to their higher sensitivity to noise and lack of adaptive response to local variation. Global Otsu and Otsu Morph showed moderate, balanced performance but are constrained by their global thresholding nature, which limits responsiveness to regional intensity shifts. Figure 5 visually reinforces these trends, where Sauvola consistently leads in all metric bars, while Niblack lags significantly behind. These findings, further illustrated in Figure 5, confirm that Sauvola’s locally adaptive thresholding is the most effective method for handling the complex visual characteristics of historical Balinese manuscripts.
In addition to pixel-level accuracy, this study also employed structural similarity metrics to assess the perceptual and visual fidelity of the segmented outputs. Table 2 summarizes the results of SSIM, FSIM, MS-SSIM, and GMSD. These metrics assess not only pixel accuracy but also the preservation of visual structure, texture, and edge consistency, which are critical for script legibility. The Sauvola method again outperforms all others, with SSIM of 0.725, FSIM of 0.774, and MS-SSIM of 0.800, indicating its high fidelity in retaining the structural properties of the original manuscript. Its GMSD score of 0.304 is the lowest among all methods, signifying minimal deviation in gradient magnitudes, hence stronger edge preservation. FSIM captures phase congruency and gradient magnitude at a perceptual level, and Sauvola’s leading score here suggests better alignment of key features like stroke curvature and density transitions.
Meanwhile, methods like Global Otsu, ISODATA, and Kmeans demonstrated mid-level performance with SSIM and FSIM values ranging around 0.60–0.61, reflecting stable but less refined structural preservation. Although Li’s method performed well in confusion matrix metrics, it scored lower on SSIM (0.603) and MS-SSIM (0.557), indicating that it may introduce structural distortions while prioritizing foreground detection. Niblack once again ranked the lowest across all structure-based metrics, including an SSIM of 0.320 and FSIM of 0.586, reaffirming its sensitivity to noise and its limited adaptability to local contextual variations.
Figure 6 provides a visual comparison of these structural metrics in bar chart form, enabling clearer distinctions between methods. The difference between Sauvola and the rest is most pronounced in MS-SSIM, where it reaches 0.800, far above the next highest method. This suggests that Sauvola is not only locally effective but also consistent across scales, which is critical in segmenting multi-size scripts typical in palm leaf manuscripts. FSIM patterns further support this trend, highlighting that Sauvola excels in preserving edge-related information crucial for human readability. Interestingly, although Otsu and Global Otsu have comparable structural scores to ISODATA and Kmeans, they appear slightly better in SSIM and MS-SSIM, suggesting greater local stability. The GMSD values offer a subtle yet important insight; the low GMSD of 0.304 achieved by the Sauvola method, in contrast to the high GMSD of 0.438 recorded by Niblack, highlights the critical importance of gradient consistency in maintaining visual quality, especially in historical manuscripts where the clarity of edges directly affects the legibility of characters.
Based on the radar chart evaluation (Figure 7), which illustrates the comparative performance of all ten thresholding methods across multiple evaluation metrics, the Sauvola method clearly stands out as the most effective technique. It demonstrates superior consistency and balance across both pixel-based metrics (such as IoU, Dice, Accuracy, and Recall) and structure-based metrics (including SSIM, FSIM, and MS-SSIM). This indicates that Sauvola not only excels in accurately identifying text regions in the palm leaf manuscript but also in preserving the visual and structural integrity of the ancient scripts. Li’s Minimum Cross Entropy method ranks second, performing well in Recall and Dice, though it falls short in maintaining visual consistency, as seen in lower SSIM and GMSD values.
Conversely, methods like Niblack and K-Means showed weak performance across the majority of evaluation metrics, particularly SSIM and GMSD, indicating their vulnerability to noise and limited ability to preserve edge details. Adaptive Mean and Adaptive Gaussian methods showed relatively stable performance but lacked the local adaptivity required for complex degradation patterns. The radar chart vividly illustrates these performance gaps, reinforcing that locally adaptive methods like Sauvola are best suited for historical document segmentation with uneven illumination and faded text. This comprehensive evaluation provides a strong foundation for future digital preservation strategies using forensic-based approaches for ancient manuscripts.
4. Discussion
According to the results of this study, it was found that no single thresholding technique is universally optimal; instead, effectiveness depends on the balance between local adaptivity, global contrast, and structural preservation. The success of the Sauvola method can be attributed to its local adaptation mechanism, which dynamically responds to regional contrast and texture. Furthermore, Sauvola's method is recognized for its excellent segmentation performance in degraded document images, making it particularly suitable for ancient manuscripts that often suffer from various forms of damage and noise [62,63]. Previous research in ancient Jawi document segmentation also reported strong results when using Sauvola [64]. Its effectiveness in the current study underscores its relevance across language systems and cultural documentation formats. These parallels highlight the method’s versatility and affirm its standing in forensic manuscript analysis.
In comparison, Li’s Minimum Cross Entropy method showed strong pixel-wise performance, especially in Recall and Dice, but struggled with preserving structural integrity, as evidenced by lower SSIM and MS-SSIM scores. This suggests that although Li’s method effectively identifies foreground text, it may compromise the fidelity of thin or complex character strokes—critical aspects in the accurate representation of historical scripts [46,47]. These values align with prior studies, which observed similar outcomes when applying entropy-based methods to some degraded documents [65]. This reinforces the method’s robustness in handling unevenly faded documents and suggests its potential for broader applications in ancient script analysis. This thresholding method also proves effective for segmenting other degraded objects in cultural heritage studies, such as in inscription analysis [66].
Meanwhile, thresholding techniques such as Niblack consistently underperformed across both visual inspection and quantitative evaluation due to their heightened sensitivity to noise and limited adaptability to local variations in illumination and texture [25]. This often led to the introduction of false positives and fragmentation of character strokes, ultimately diminishing the legibility and reliability of the segmented manuscript outputs. The study findings align with earlier research on ancient document processing, which reported that Niblack frequently produced noisy segmentation results, thereby reducing the effectiveness of downstream tasks such as optical character recognition (OCR) when compared to more adaptive methods like Sauvola [43]. Nevertheless, some studies have suggested that combining Niblack with complementary techniques, such as Sauvola, may enhance overall segmentation performance by balancing Niblack’s detail sensitivity with Sauvola’s robustness to degradation [64].
The broader implication of these findings lies in the integration of digital forensics into cultural heritage preservation workflows. By applying a structured evaluation framework combining pixel-level accuracy with structural similarity metrics, this study demonstrates how computational techniques can enhance the readability and interpretability of degraded manuscripts without altering the original artifact. Furthermore, this research reinforces the growing body of literature that supports the use of adaptive thresholding for ancient document processing, aligning with works by Li and Tam [46], and recent segmentation strategies proposed in heritage studies [15].
5. Conclusions
This study has demonstrated the effectiveness of applying various thresholding techniques for the segmentation and enhancement of the Terumbalan palm leaf manuscript, a culturally significant artifact in Balinese heritage. Through a systematic evaluation of ten different methods, the research identified the strengths and limitations of each approach in addressing the visual challenges posed by ancient manuscripts, such as faded ink, organic leaf textures, and intricate scripts. The results confirm that no single thresholding technique is universally optimal; effectiveness depends largely on the degree of degradation and structural complexity of the manuscript. These findings offer valuable insights to guide best practices in image preprocessing for digital preservation projects and underscore the importance of integrating digital forensic principles into cultural heritage analysis. Nevertheless, the Sauvola method, which achieved the highest scores across nearly all evaluation metrics, proves highly promising and can serve as a strong baseline for future segmentation systems for ancient manuscripts.
Beyond its technical contributions, this study also highlights the broader significance of integrating computational tools into heritage conservation efforts. The ability to digitally recover and interpret historical texts at risk of deterioration presents new opportunities for scholars, archivists, and cultural stakeholders. By employing thresholding-based segmentation as a non-invasive and replicable approach, this research establishes a foundational framework for future initiatives in the restoration, documentation, and analysis of other historical artifacts. Overall, this study represents an important step toward the wider adoption of digital forensic methodologies for preserving Southeast Asia’s intangible cultural legacy, offering a replicable model that can be adapted for other visually complex manuscripts.
As a direction for future research, the thresholding approach can be further developed through hybrid methods, for example by combining locally adaptive techniques like Sauvola with machine learning models to improve segmentation accuracy and adaptability across varied data. Machine learning-based approaches, such as convolutional neural networks (CNNs) or ensemble models, can be employed to automatically learn complex patterns in ancient texts that are difficult to capture with conventional thresholding. Additionally, exploration into deep learning-based preprocessing techniques and data augmentation strategies may strengthen model generalization across diverse manuscript types. By combining modern computational power with forensic insights, the development of smarter and more context-aware systems will further enhance the digital preservation of ancient manuscripts.
Author Contributions
Conceptualization, I.Y., K.N., and A.T.A.; methodology, K.N.; validation, K.N., N.U.N. and Y.A.H.; resources, I.Y.; data curation, K.N.; writing—original draft preparation, K.N.; writing—review and editing, I.Y., N.U.N., A.T.A., and C.C.H; visualization, K.N.; supervision, I.Y., A.T.A., C.C.H. and Y.A.H.; project administration, I.Y.; funding acquisition, I.Y. All authors have read and agreed to the published version of the manuscript.
Funding
This research was funded by Airlangga University through Airlangga Research Fund 2024, under the Scheme of International Research Collaboration Top #100 according to The Rector of UNAIR's Decree No. 672/UN3/2024.
Data Availability Statement
The data in this study are available and can be freely accessed in the digital collection of the National Library of Indonesia via the page https://khastara.perpusnas.go.id/koleksi-digital/detail/?catId=1290335.
Acknowledgments
The authors acknowledge the use of ChatGPT as a tool to assist in dataset handling and result interpretation throughout the development of this study. All outputs generated through the platform were carefully reviewed, refined, and integrated by the authors, who assume full responsibility for the accuracy and integrity of the final content presented in this publication.
Conflicts of Interest
The authors declare that there are no financial, professional, or other conflicts of interest.
Abbreviations
The following abbreviations are used in this manuscript:
| IoU | Intersection over Union |
| SSIM | Structural Similarity Index Measure |
| MS-SSIM | Multi scale Structural Similarity Index Measure |
| FSIM | Feature Similarity Index Measure |
| ISODATA | Iterative Self-Organizing Data Analysis Technique |
| GMSD | Gradient Magnitude Similarity Deviation |
References
- Wilson, E.B.; Rice, J.M. Palm Leaf Manuscripts in South Asia [Post-doc and Student Scholarship]. Syracuse University; 2019.
- Khadijah, U.L.S.; Winoto, Y.; Shuhidan, S.M.; Anwar, R.K.; Lusiana, E. Community Participation in Preserving the History of Heritage Tourism Sites. Journal of Law and Sustainable Development. 2024 Jan 18;12(1):e2504. [CrossRef]
- Sudarsan, D.; Sankar, D. An Overview of Character Recognition from Palm Leaf Manuscripts. In: 2023 3rd International Conference on Smart Data Intelligence (ICSMDI). IEEE; 2023. p. 265–72. [CrossRef]
- Krithiga, R.; Varsini, S. ; Joshua. R.G.; Kumar, C.U.O. Ancient Character Recognition: A Comprehensive Review. IEEE Access. 2023;1–1. [CrossRef]
- Dewi, D.A.S.; Arsa, D.M.S.; Putri, G.A.A.; Setiawati, N.L.P.L.S. Ensembling Deep Convolutional Neural Neworks For Balinese Handwritten Character Recognition. ASEAN Engineering Journal. 2023 Aug 30;13(3):133–9. [CrossRef]
- Bannigidad, P.; Sajjan, S.P. Restoration of Ancient Kannada Handwritten Palm Leaf Manuscripts Using Image Enhancement Techniques. In 2023. p. 101–9. [CrossRef]
- Khafidlin, K. Ancient Manuscript Preservation of Museum Ranggawarsita Library Collection Semarang Central Java. Daluang: Journal of Library and Information Science. 2021 May 31;1(1):52. [CrossRef]
- Maheswari, S.U.; Maheswari, P.U.; Aakaash, G.R.S. An intelligent character segmentation system coupled with deep learning based recognition for the digitization of ancient Tamil palm leaf manuscripts. Herit Sci. 2024 Oct 1;12(1):342. [CrossRef]
- Lian, X.; Yu, C.; Han, W.; Li, B.; Zhang, M.; Wang, Y.; et al. Revealing the Mechanism of Ink Flaking from Surfaces of Palm Leaves (Corypha umbraculifera). Langmuir. 2024 Mar 26;40(12):6375–83. [CrossRef]
- Yuadi, I.; Halim, Y.A.; Asyhari, A.T.; Nisa’, K.; Nazikhah, N.U.; Nihaya, U. Image Enhancement and Thresholding for Ancient Inscriptions in Trowulan Museum’s Collection Mojokerto, Indonesia. In: 2024 7th International Conference of Computer and Informatics Engineering (IC2IE). IEEE; 2024. p. 1–6. [CrossRef]
- Sudarsan, D.; Sankar, D. Enhancing Malayalam Palm Leaf Character Segmentation: An Improved Simplified Approach. SN Comput Sci. 2024 May 23;5(5):577. [CrossRef]
- Sudarsan, D.; Sankar, D. A Novel Complete Denoising Solution for Old Malayalam Palm Leaf Manuscripts. Pattern Recognition and Image Analysis. 2022 Mar 18;32(1):187–204. [CrossRef]
- Yuadi, I.; Nihaya, U.; Pratiwi, F.D. Digital Forensics to Identify Damaged Part of Palm Leaf Manuscript. In: 2023 6th International Conference of Computer and Informatics Engineering (IC2IE). IEEE; 2023. p. 319–23. [CrossRef]
- Selvan, M.; Ramar, K. Development of optimized ensemble machine learning-based character segmentation framework for ancient Tamil palm leaf manuscripts. Eng Appl Artif Intell. 2025 Apr;146:110235. [CrossRef]
- Paulus, E.; Burie, J.C.; Verbeek, F.J. Text line extraction strategy for palm leaf manuscripts. Pattern Recognit Lett. 2023 Oct;174:10–6. [CrossRef]
- Damayanti, F.; Suprapto, Y.K.; Yuniarno, E.M. Segmentation of Javanese Character in Ancient Manuscript using Connected Component Labeling. In: 2020 International Conference on Computer Engineering, Network, and Intelligent Multimedia (CENIM). IEEE; 2020. p. 412–7. [CrossRef]
- Yu, Y.; Wang, C.; Fu, Q.; Kou, R.; Huang, F.; Yang, B.; et al. Techniques and Challenges of Image Segmentation: A Review. Electronics (Basel). 2023 Mar 2;12(5):1199. [CrossRef]
- Pravesjit, S.; Seng, V. Segmentation of Background and Foreground for Ancient Lanna Archaic from Palm Leaf Manuscripts using Deep Learning. In: 2021 Joint International Conference on Digital Arts, Media and Technology with ECTI Northern Section Conference on Electrical, Electronics, Computer and Telecommunication Engineering. IEEE; 2021. p. 220–4. [CrossRef]
- Tzortzi, J.N.; Saxena, I. Threshold Spaces: The Transitional Spaces Between Outside and Inside in Traditional Indian Dwellings. Heritage. 2024 Nov 27;7(12):6683–711. [CrossRef]
- Yuadi, I.; Yudistira, N.; Habiddin, H.; Nisa’, K. A Comparative Study of Image Processing Techniques for Javanese Ancient Manuscripts Enhancement. IEEE Access. 2025;13:36845–57. [CrossRef]
- Otsu, N. A Threshold Selection Method from Gray-Level Histograms. IEEE Trans Syst Man Cybern. 1979 Jan;9(1):62–6. [CrossRef]
- Sauvola, J.; Pietikäinen, M. Adaptive document image binarization. Pattern Recognition. 2000 Feb;33(2):225–36. [CrossRef]
- Li, C.H.; Lee, C.K. Minimum cross entropy thresholding. Pattern Recognition. 1993 Apr;26(4):617–25. [CrossRef]
- Kesiman, M.W.A.; Burie, J.C.; Ogier, J.M.; Grangé, P. Knowledge Representation and Phonological Rules for the Automatic Transliteration of Balinese Script on Palm Leaf Manuscript. Computación y Sistemas. 2018 Jan 1;21(4). [CrossRef]
- Niblack, W. An Introduction to Digital Image Processing. Birkeroed: Strandberg Publishing Company; 1985.
- Torres-Monsalve, A.F.; Velasco-Medina, J. Hardware implementation of ISODATA and Otsu thresholding algorithms. In: 2016 XXI Symposium on Signal Processing, Images and Artificial Vision (STSIVA). IEEE; 2016. p. 1–5. [CrossRef]
- Jailingeswari, I.; Gopinathan, S. Tamil handwritten palm leaf manuscript dataset (THPLMD). Data Brief. 2024 Apr;53:110100. [CrossRef]
- Sudarsan, D.; Sankar, D. A Novel approach for Denoising palm leaf manuscripts using Image Gradient approximations. In: 2019 3rd International conference on Electronics, Communication and Aerospace Technology (ICECA). IEEE; 2019. p. 506–11. [CrossRef]
- Fred, A.L.; Kumar, S.N.; Haridhas, A.K.; Daniel, A.V.; Abisha, W. Evaluation of local thresholding techniques in Palm-leaf Manuscript images. International Journal of Computer Sciences and Engineering. 2018 Apr 30;6(4):124–31. [CrossRef]
- Jayanthi, N.; Indu, S. Application of Gaussian as Edge Detector for Image Enhancement of Ancient Manuscripts. IOP Conf Ser Mater Sci Eng. 2017 Aug;225:012149. [CrossRef]
- Jayanthi, J.; Maheswari, P.U. Comparative Study: Enhancing Legibility of Ancient Indian Script Images from Diverse Stone Background Structures Using 34 Different Pre-Processing Methods. Herit Sci. 2024 Feb 20;12(1):63. [CrossRef]
- Siountri, K.; Anagnostopoulos, C.N. The Classification of Cultural Heritage Buildings in Athens Using Deep Learning Techniques. Heritage. 2023 Apr 13;6(4):3673–705. [CrossRef]
- Xu, H.; Huang, Q.; Liao, H.; Nong, G.; Wei, W. MFFP-Net: Building Segmentation in Remote Sensing Images via Multi-Scale Feature Fusion and Foreground Perception Enhancement. Remote Sens (Basel). 2025 May 28;17(11):1875. [CrossRef]
- Kaneko, H.; Ishibashi, R.; Meng, L. Deteriorated Characters Restoration for Early Japanese Books Using Enhanced CycleGAN. Heritage. 2023 May 14;6(5):4345–61. [CrossRef]
- Lontar Terumbalan. National Library of Indonesia. https://khastara.perpusnas.go.id/koleksi-digital/detail/?catId=1290335.
- Yuadi, I.; Koesbardiati, T.; Wicaksono, R.P.R.W.; Gurushankar, K.; Nisa’, K. Digital Forensic Analysis of Tooth Wear in Prehistoric and Modern Humans. Archaeology, Ethnology & Anthropology of Eurasia. 2025 Apr 3;53(1):145–54. [CrossRef]
- Zheng, Y.; Li, S.; Xiang, Y.; Zhu, Z. Crack Defect Detection Processing Algorithm and Method of MEMS Devices Based on Image Processing Technology. IEEE Access. 2023;11:126323–34. [CrossRef]
- Nayak, J.; Naik, B.; Pelusi, D. ; Das, AK, editors. Handbook of Computational Intelligence in Biomedical Engineering and Healthcare. Elsevier; 2021. [CrossRef]
- Ahmed, S.; Islam, S. Methods in detection of median filtering in digital images: a survey. Multimed Tools Appl. 2023 Nov 26;82(28):43945–65. [CrossRef]
- Gonzalez, RC.; Woods, RE. Digital Image Processing. 4th ed. Edinburgh: Pearson Education; 2018.
- Justusson, B.I. Median Filtering: Statistical Properties. In: Two-Dimensional Digital Signal Prcessing II. Berlin/Heidelberg: Springer-Verlag; 2006. p. 161–96. [CrossRef]
- Davies, E.R. The Role of Thresholding. Computer Vision. 2018;93–118. [CrossRef]
- Khurshid, K.; Siddiqi, I.; Faure, C.; Vincent, N. Comparison of Niblack Inspired Binarization Methods for Ancient Documents. In: Berkner K, Likforman-Sulem L, editors. 2009. p. 72470U. [CrossRef]
- Farid, S.; Ahmed, F. Application of Niblack’s method on images. In: 2009 International Conference on Emerging Technologies. IEEE; 2009. p. 280–6. [CrossRef]
- Trier, O.D.; Jain, A.K. Goal-directed evaluation of binarization methods. IEEE Trans Pattern Anal Mach Intell. 1995;17(12):1191–201. [CrossRef]
- Li, C.H.; Tam, P.K.S. An iterative algorithm for minimum cross entropy thresholding. Pattern Recognit Lett. 1998 Jun;19(8):771–6. [CrossRef]
- Abbas, A.; Cadenbach, A.H.; Salimi, E. A Kullback–Leibler View of Maximum Entropy and Maximum Log-Probability Methods. Entropy. 2017 May 19;19(5):232. [CrossRef]
- Feng, X.; Lv, J. Minimum Cross-Entropy Transform of Risk Analysis. In: 2011 International Conference on Management and Service Science. IEEE; 2011. p. 1–4. [CrossRef]
- Magid, A.; Rotman, S.R.; Weiss, A.M. Comments on Picture thresholding using an iterative selection method. IEEE Trans Syst Man Cybern. 1990 Sep;20(5):1238–9. [CrossRef]
- Song, J.; Li, F.; Li, R. Improved K-means Algorithm Based on Threshold Value Radius. IOP Conf Ser Earth Environ Sci. 2020 Jan 1;428(1):012001. [CrossRef]
- Roy, P.; Dutta, S.; Dey, N.; Dey, G.; Chakraborty, S.; Ray, R. Adaptive thresholding: A comparative study. In: 2014 International Conference on Control, Instrumentation, Communication and Computational Technologies (ICCICCT). IEEE; 2014. p. 1182–6. [CrossRef]
- Yazid, H.; Arof, H. Gradient based adaptive thresholding. J Vis Commun Image Represent. 2013 Oct;24(7):926–36. [CrossRef]
- Rehman, N.A.; Haroon, F. Adaptive Gaussian and Double Thresholding for Contour Detection and Character Recognition of Two-Dimensional Area Using Computer Vision. In: INTERACT 2023. Basel Switzerland: MDPI; 2023. p. 23. [CrossRef]
- Erwin.; Noorfizir, A.; Rachmatullah, M.N.; Saparudin.; Sulong G. Hybrid Multilevel Thresholding-Otsu and Morphology Operation for Retinal Blood Vessel Segmentation. Engineering Letters. 2020;28(1):180–91.
- Seidenthal, K.; Panjvani, K.; Chandnani, R.; Kochian, L.; Eramian, M. Iterative image segmentation of plant roots for high-throughput phenotyping. Sci Rep. 2022 Oct 4;12(1):16563. [CrossRef]
- Wang, Z.; Bovik, A.C.; Sheikh, H.R.; Simoncelli, E.P. Image Quality Assessment: From Error Visibility to Structural Similarity. IEEE Transactions on Image Processing. 2004 Apr;13(4):600–12. [CrossRef]
- Lin, L.; Chen, H.; Kuruoglu, E.E.; Zhou, W. Robust structural similarity index measure for images with non-Gaussian distortions. Pattern Recognit Lett. 2022 Nov;163:10–6. [CrossRef]
- Guo, Y.; Wang, Y.; Meng, K.; Zhu, Z. Otsu Multi-Threshold Image Segmentation Based on Adaptive Double-Mutation Differential Evolution. Biomimetics. 2023 Sep 8;8(5):418. [CrossRef]
- Zhang, L.; Zhang, L.; Mou, X.; Zhang, D. FSIM: A Feature Similarity Index for Image Quality Assessment. IEEE Transactions on Image Processing. 2011 Aug;20(8):2378–86. [CrossRef]
- Wang, Z.; Simoncelli, E.P.; Bovik, A.C. Multi-scale structural similarity for image quality assessment. In: Conference Record of the Asilomar Conference on Signals, Systems and Computers. Pacific Grove, CA, United States: IEEE; 2003. p. 1398–402.
- Xue, W.; Zhang, L.; Mou, X. ; Bovik. A.C. Gradient Magnitude Similarity Deviation: A Highly Efficient Perceptual Image Quality Index. IEEE Transactions on Image Processing. 2014 Feb;23(2):684–95. [CrossRef]
- Najafi, M.H.; Salehi, M.E. A Fast Fault-Tolerant Architecture for Sauvola Local Image Thresholding Algorithm Using Stochastic Computing. IEEE Trans Very Large Scale Integr VLSI Syst. 2016 Feb;24(2):808–12. [CrossRef]
- Li, Z.; Wang, W.; Cai, Z. Historical Document Image Binarization Based on Edge Contrast Information. In 2020. p. 614–28. [CrossRef]
- Saddami, K.; Afrah, P.; Mutiawani, V.; Arnia, F. A New Adaptive Thresholding Technique for Binarizing Ancient Document. In: 2018 Indonesian Association for Pattern Recognition International Conference (INAPR). IEEE; 2018. p. 57–61. [CrossRef]
- Ho, J.; Liu, M. Research on Document Image Binarization: A Survey. In: 2024 IEEE 7th International Conference on Electronic Information and Communication Technology (ICEICT). IEEE; 2024. p. 457–62. [CrossRef]
- Munivel, M. Enigo, VSF. Performance of Binarization Algorithms on Tamizhi Inscription Images: An Analysis. ACM Transactions on Asian and Low-Resource Language Information Processing. 2024 May 31;23(5):1–29. [CrossRef]
Figure 1.
The Sample of the original image of Terumbalan Palm leaf Manuscripts [35].
Figure 1.
The Sample of the original image of Terumbalan Palm leaf Manuscripts [35].
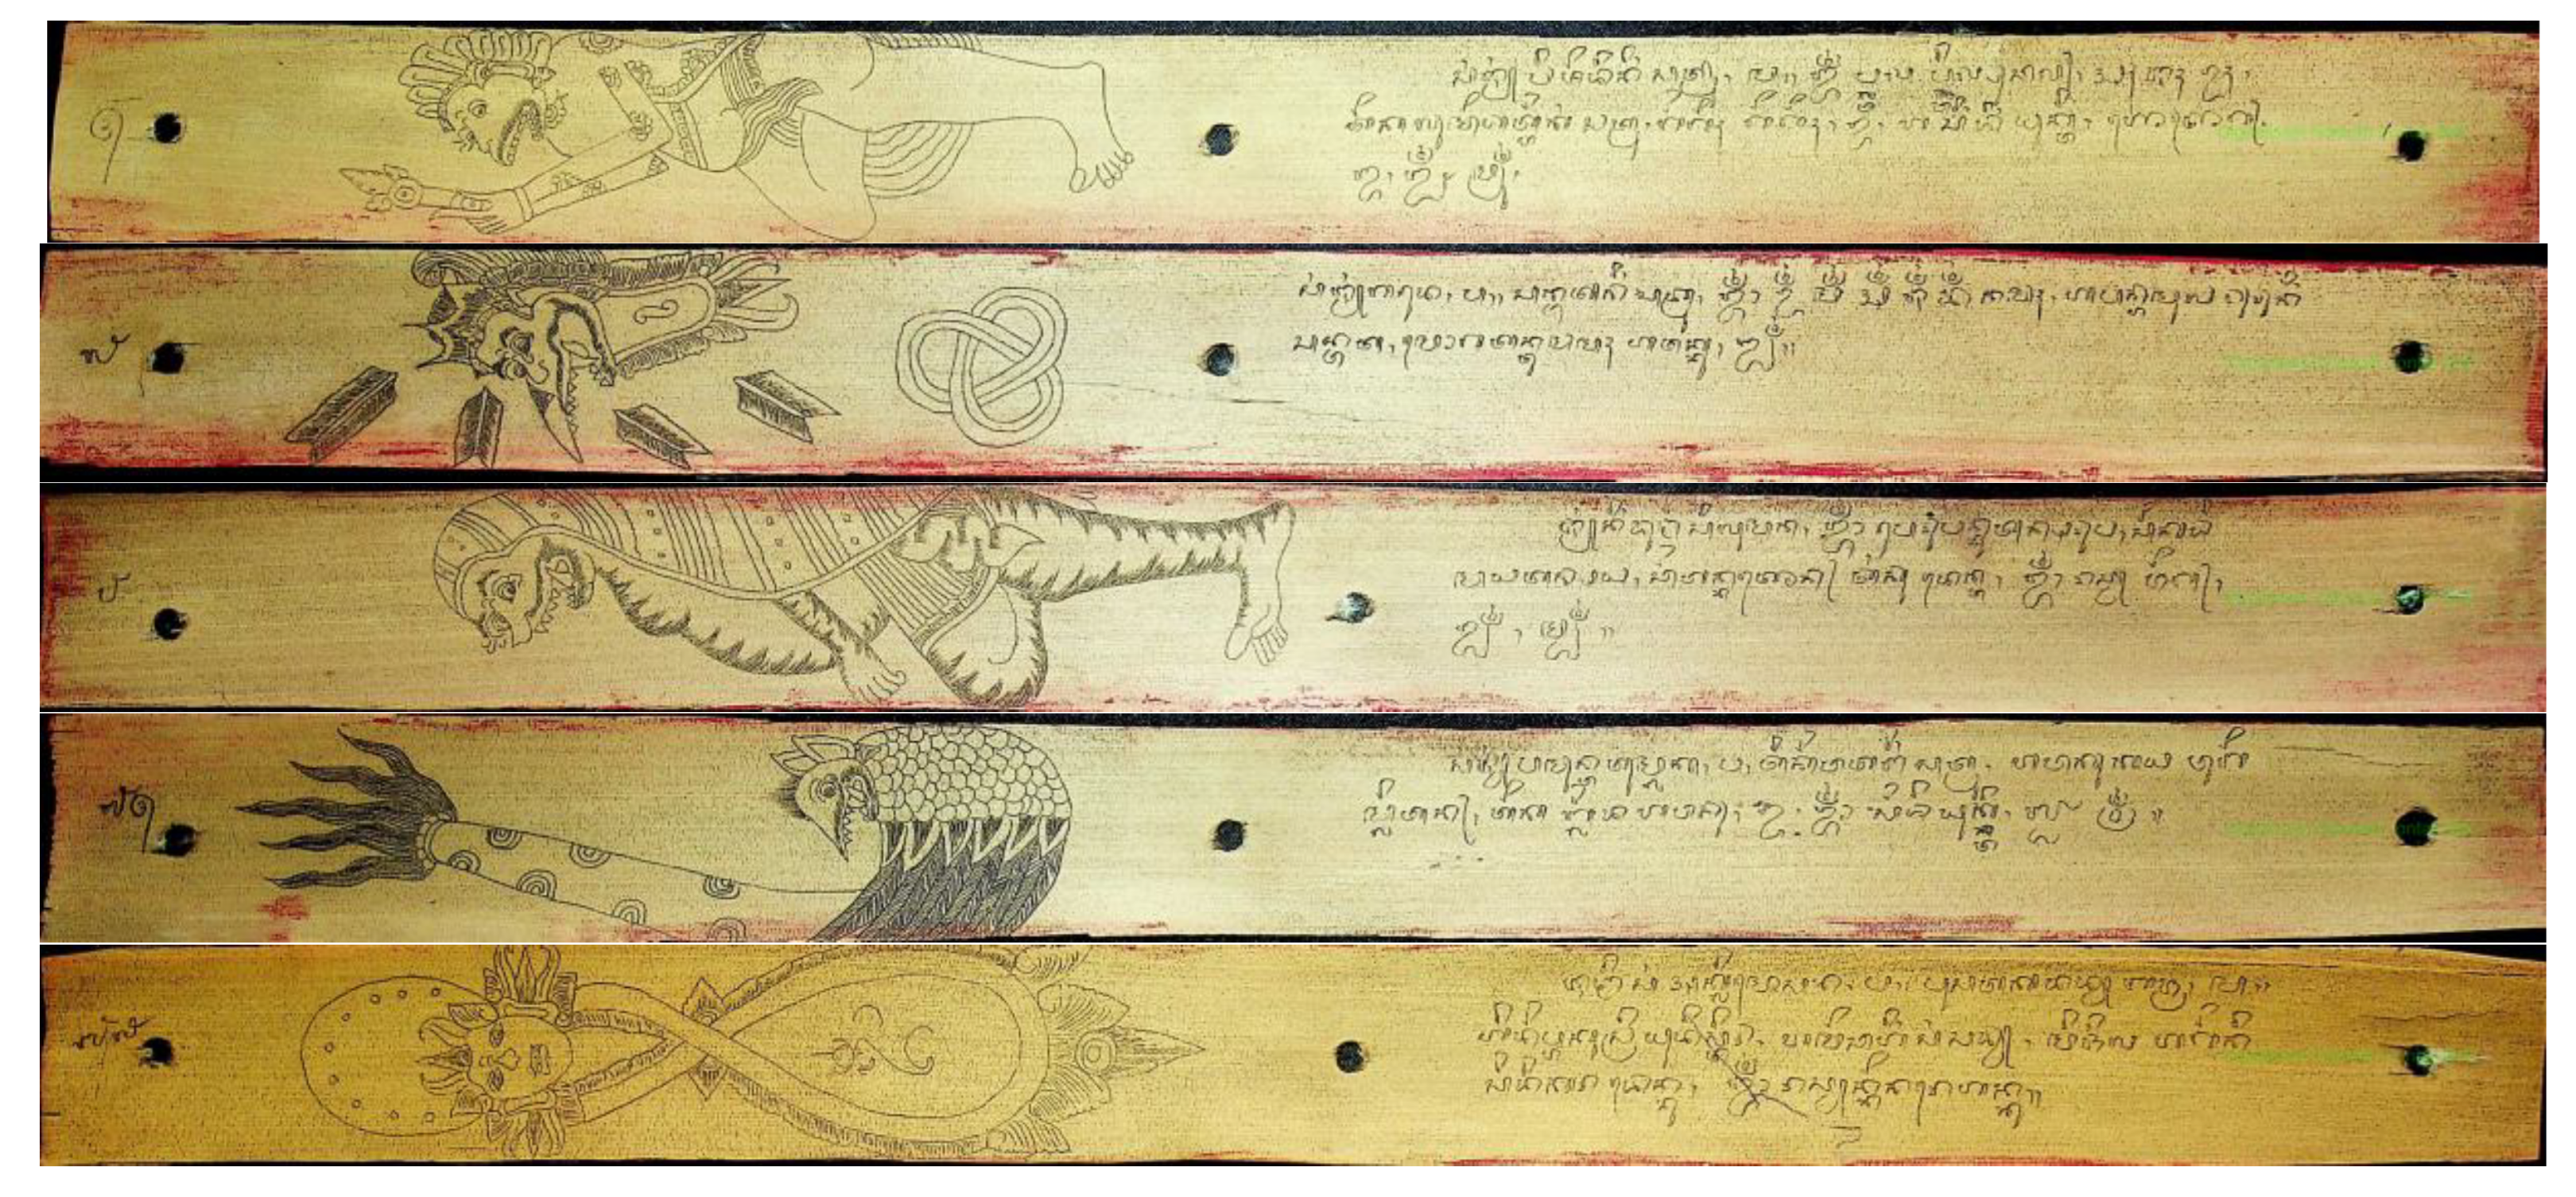
Figure 2.
Proposed Method.
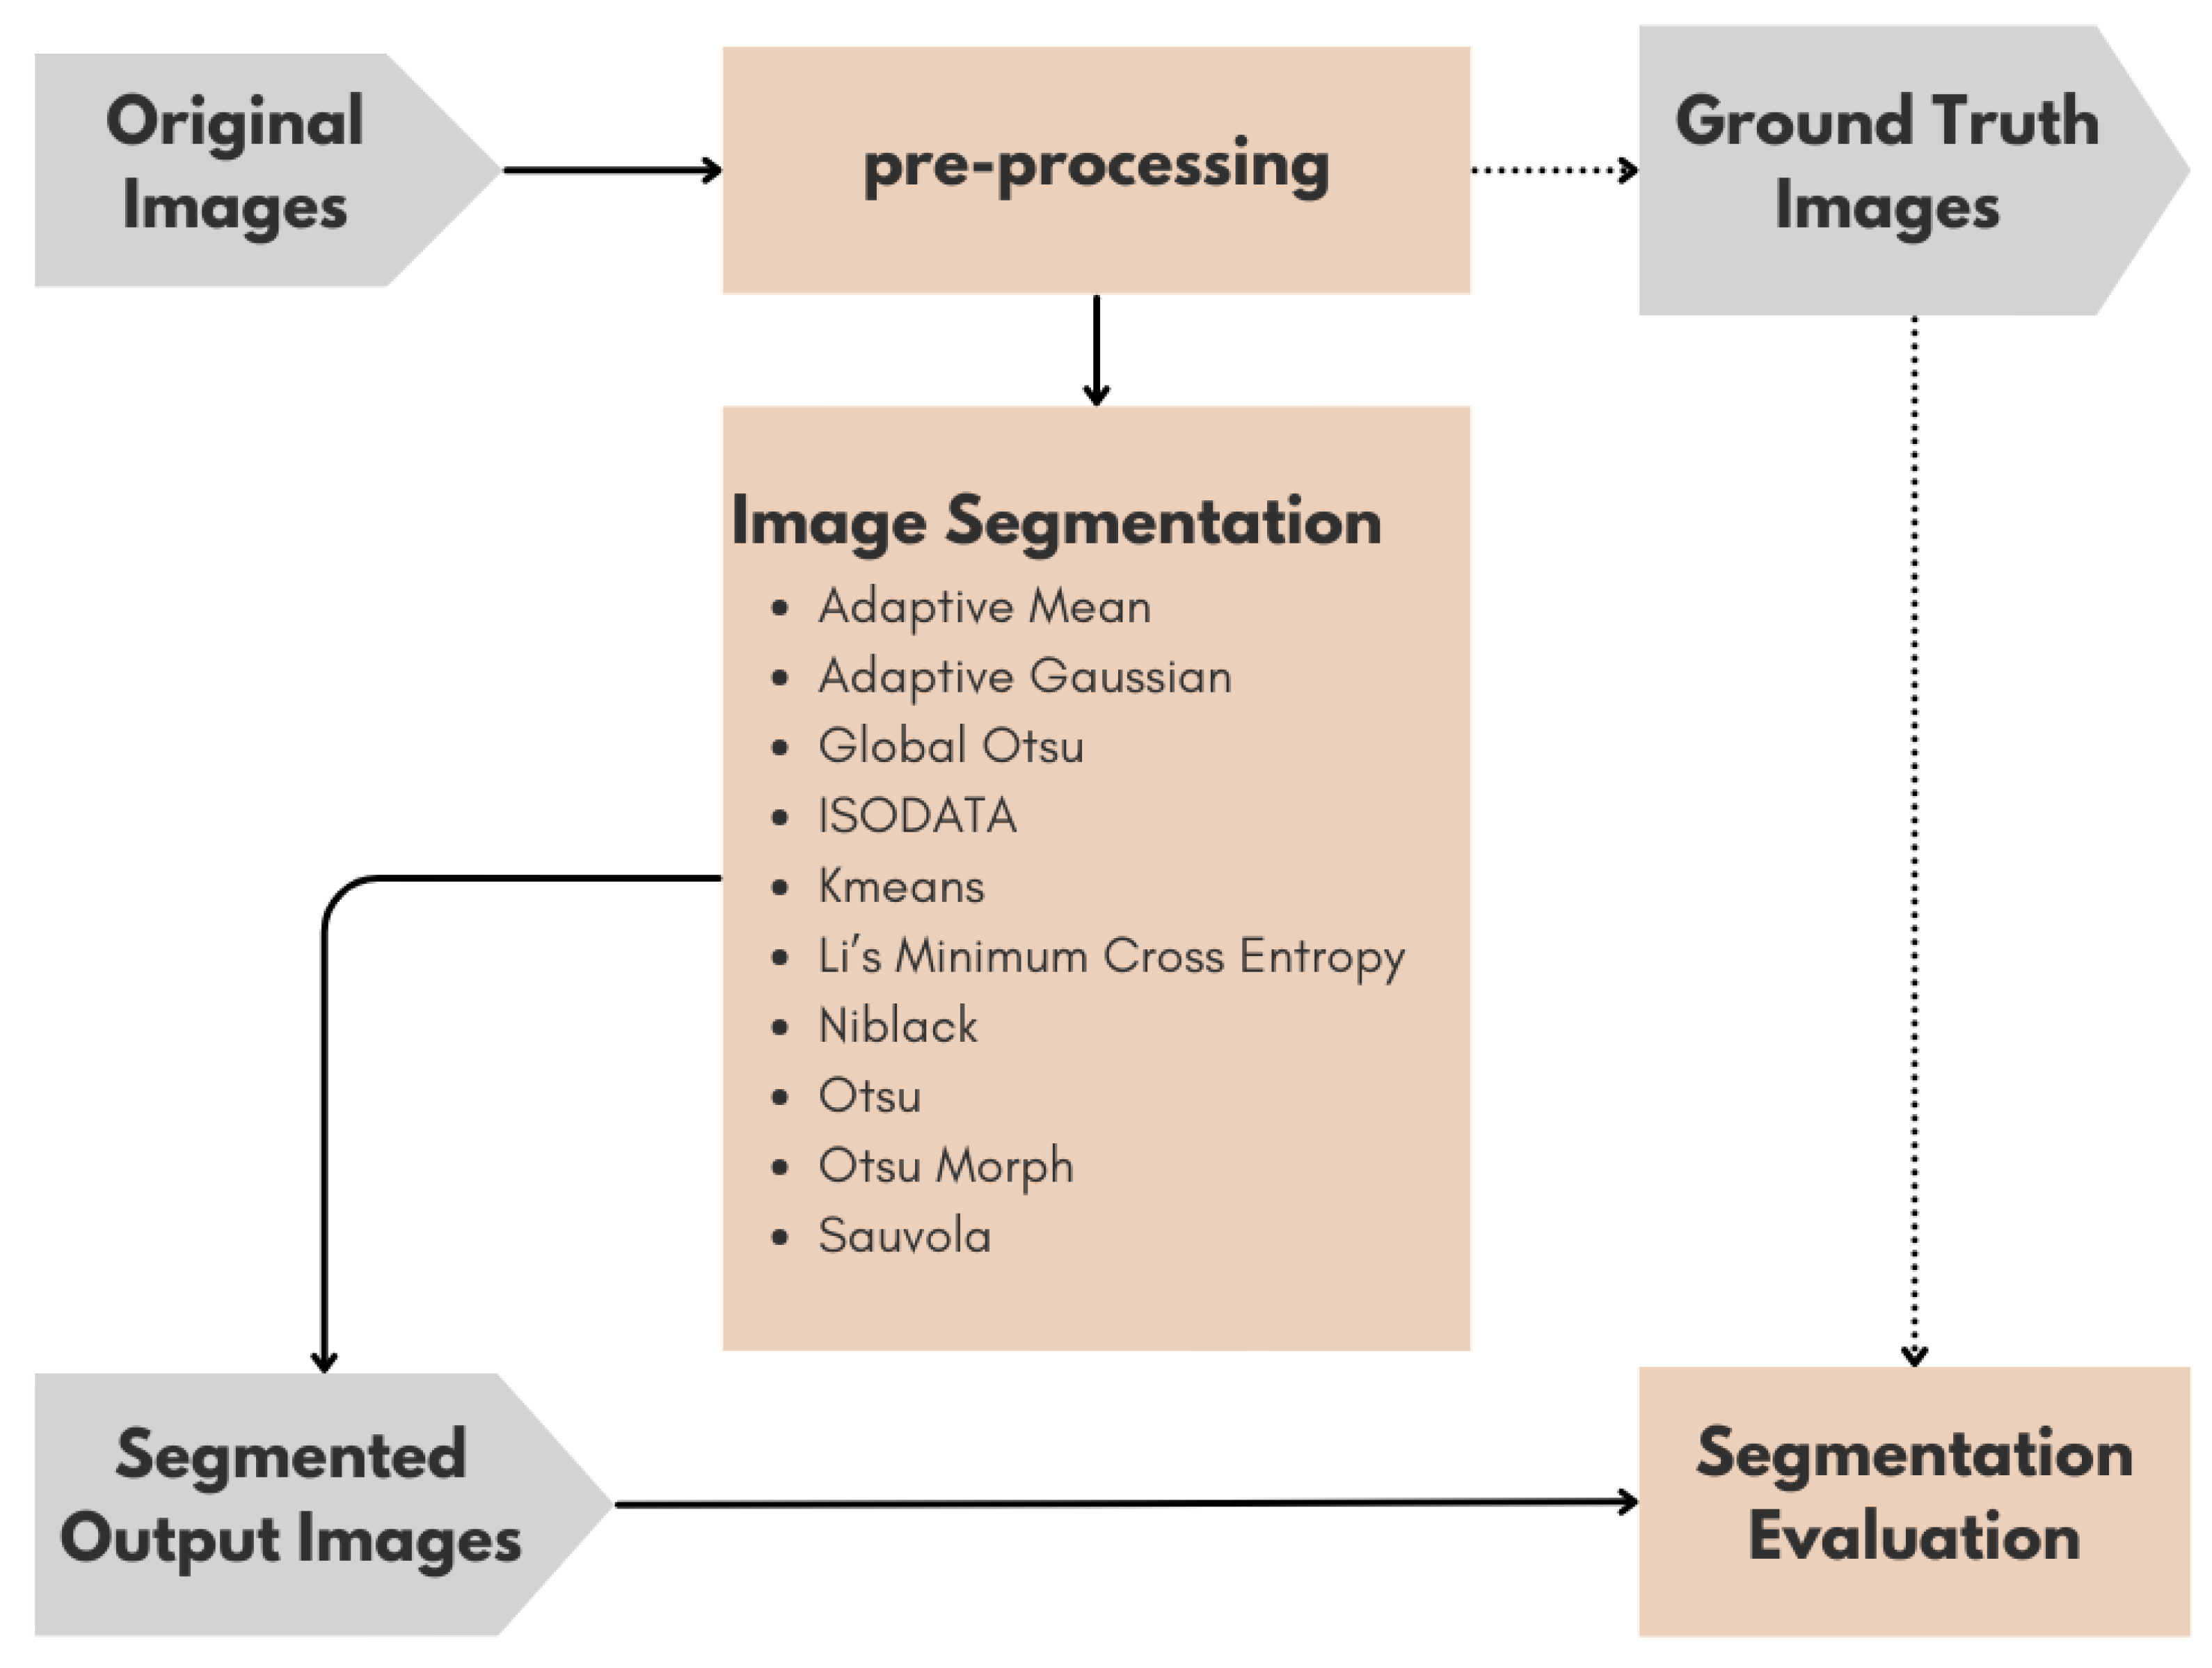
Figure 3.
The Sample of Pre-processing Result (a) Grayscale; (b) Median Filter.
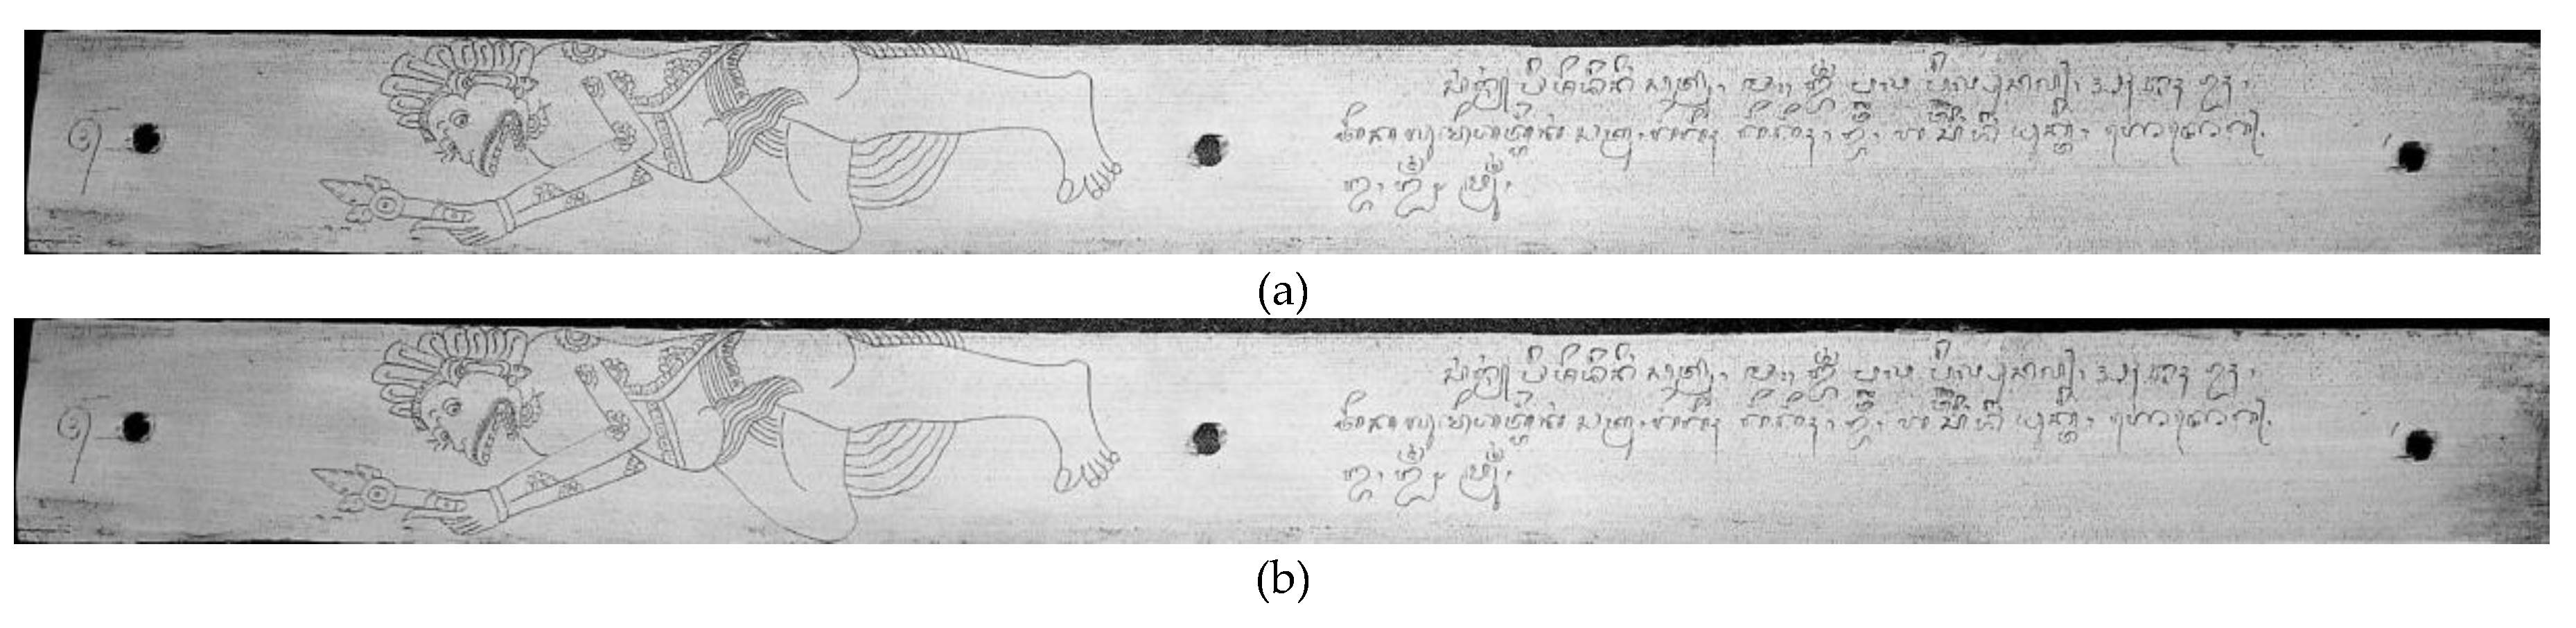
Figure 4.
Sample of Segmentation Result using Thresholding Method, (a) Adaptive Gaussian; (b) Adaptive Mean; (c) Global Otsu; (d) ISODATA; I K-Means; (f) Li’s Minimum Cross-Entropy; (g) Niblack; (h) Otsu; (i) Otsu Morph; (j) Sauvola.
Figure 4.
Sample of Segmentation Result using Thresholding Method, (a) Adaptive Gaussian; (b) Adaptive Mean; (c) Global Otsu; (d) ISODATA; I K-Means; (f) Li’s Minimum Cross-Entropy; (g) Niblack; (h) Otsu; (i) Otsu Morph; (j) Sauvola.
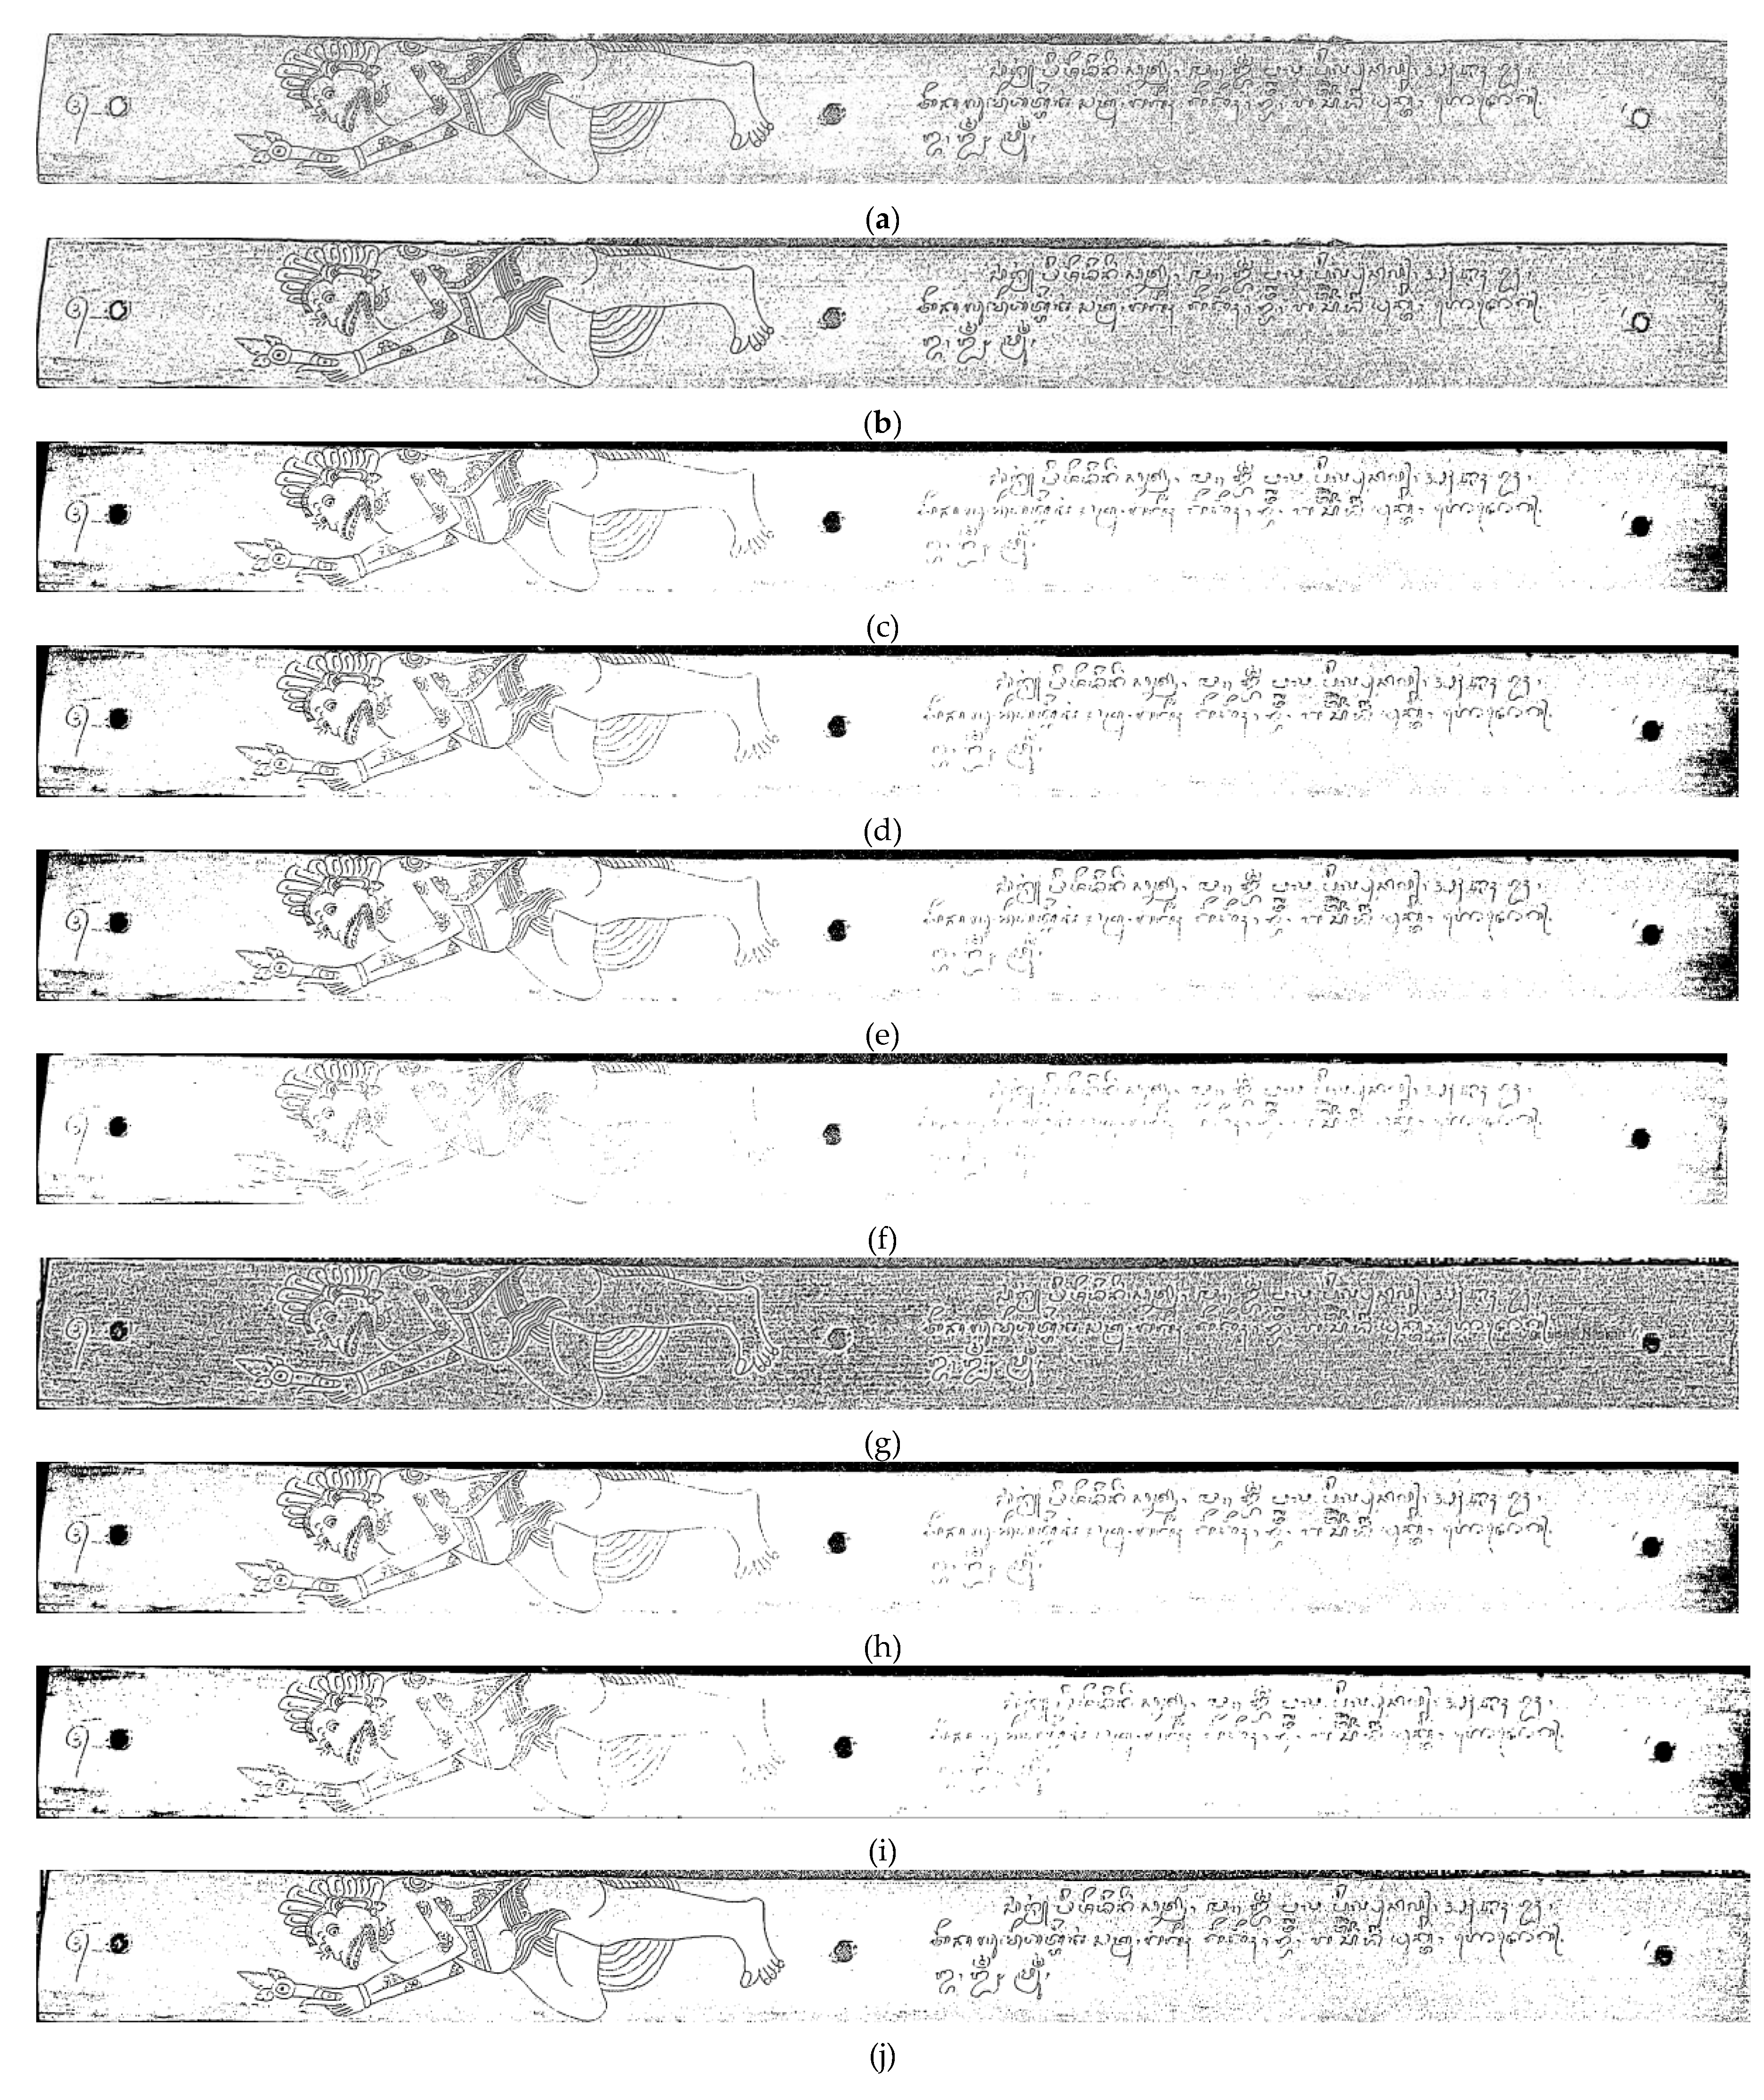
Figure 5.
Histogram Visualization of Confusion Matrix-Based Metrics Evaluation (a) IoU; (b) Dice; (c) Recall; (d) Accuracy.
Figure 5.
Histogram Visualization of Confusion Matrix-Based Metrics Evaluation (a) IoU; (b) Dice; (c) Recall; (d) Accuracy.
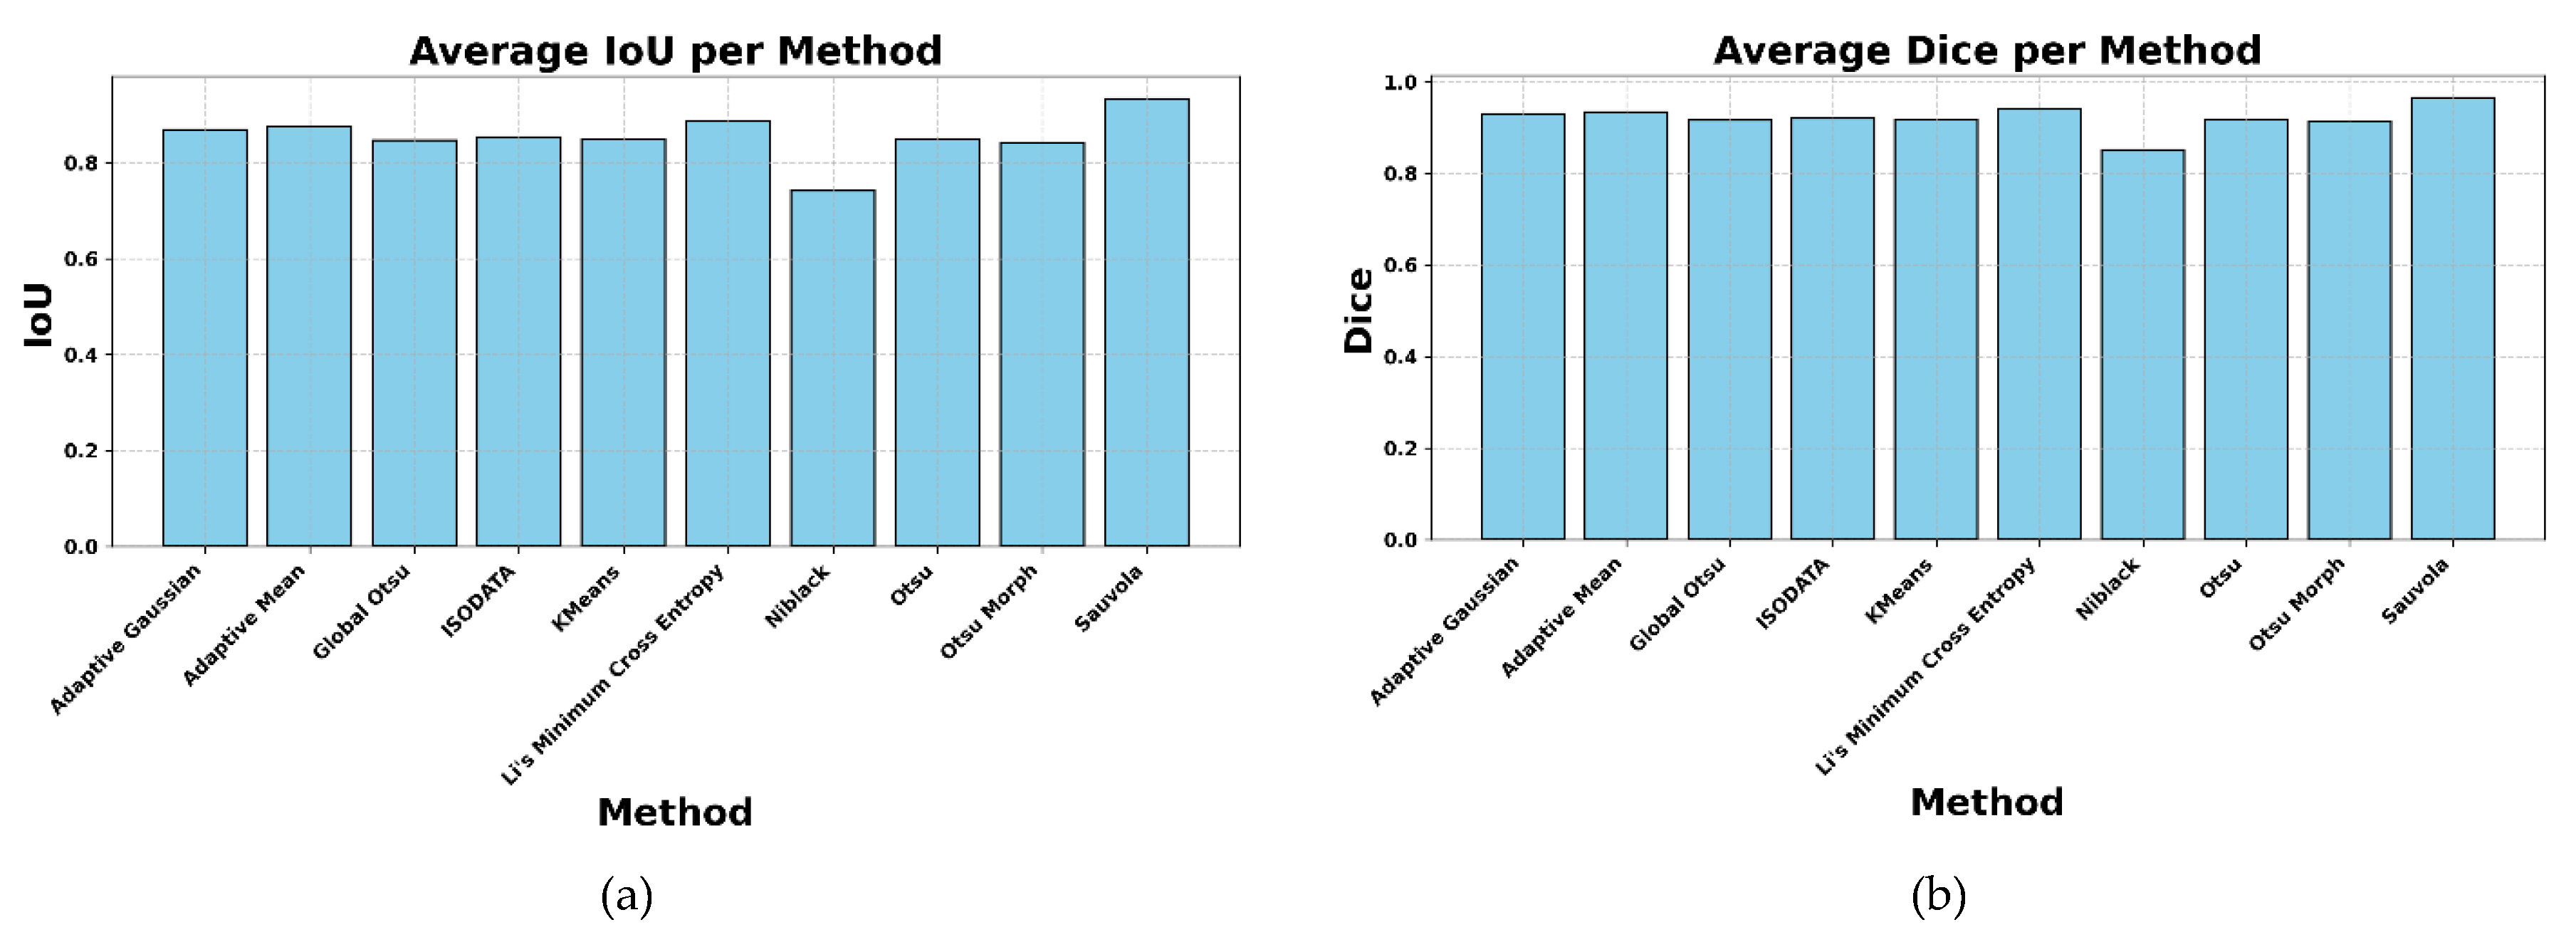
Figure 6.
Histogram Visualization of Structure-Based Similarity Metrics Evaluation (a) SSIM; (b) FSIM; (c) MS-SSIM; (d) GMSD.
Figure 6.
Histogram Visualization of Structure-Based Similarity Metrics Evaluation (a) SSIM; (b) FSIM; (c) MS-SSIM; (d) GMSD.
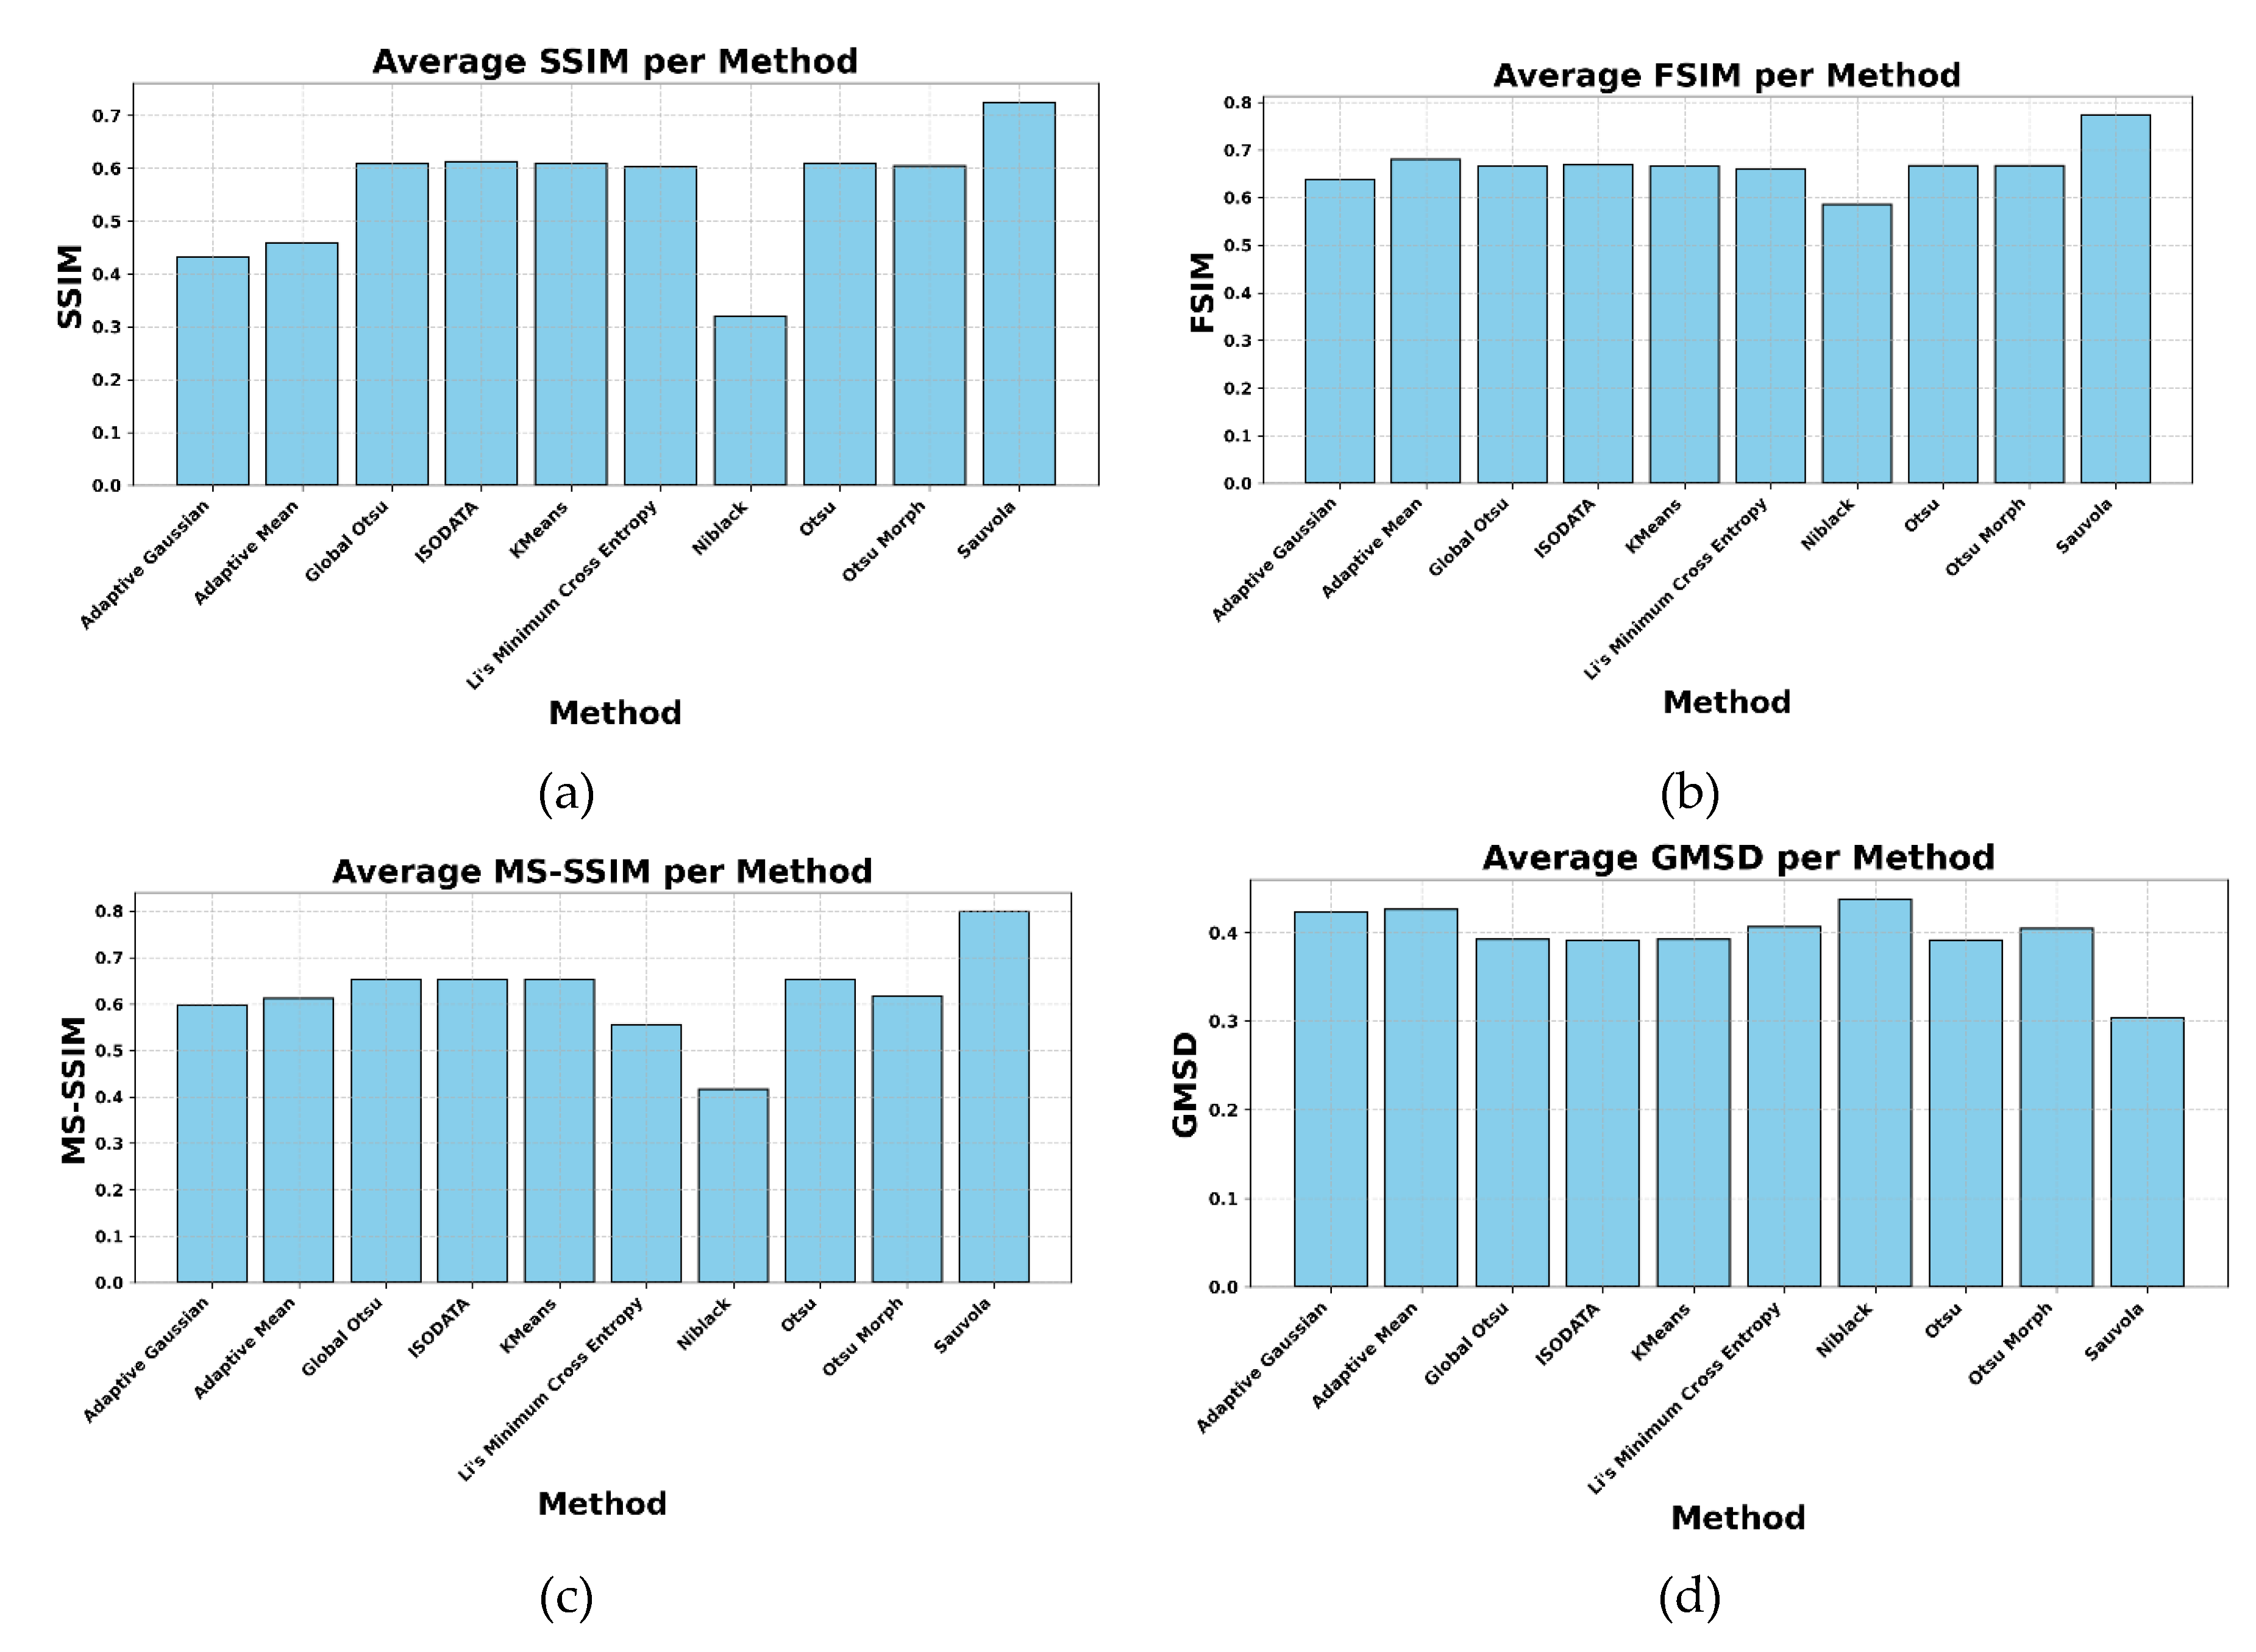
Figure 7.
Radar Chart Evaluation.
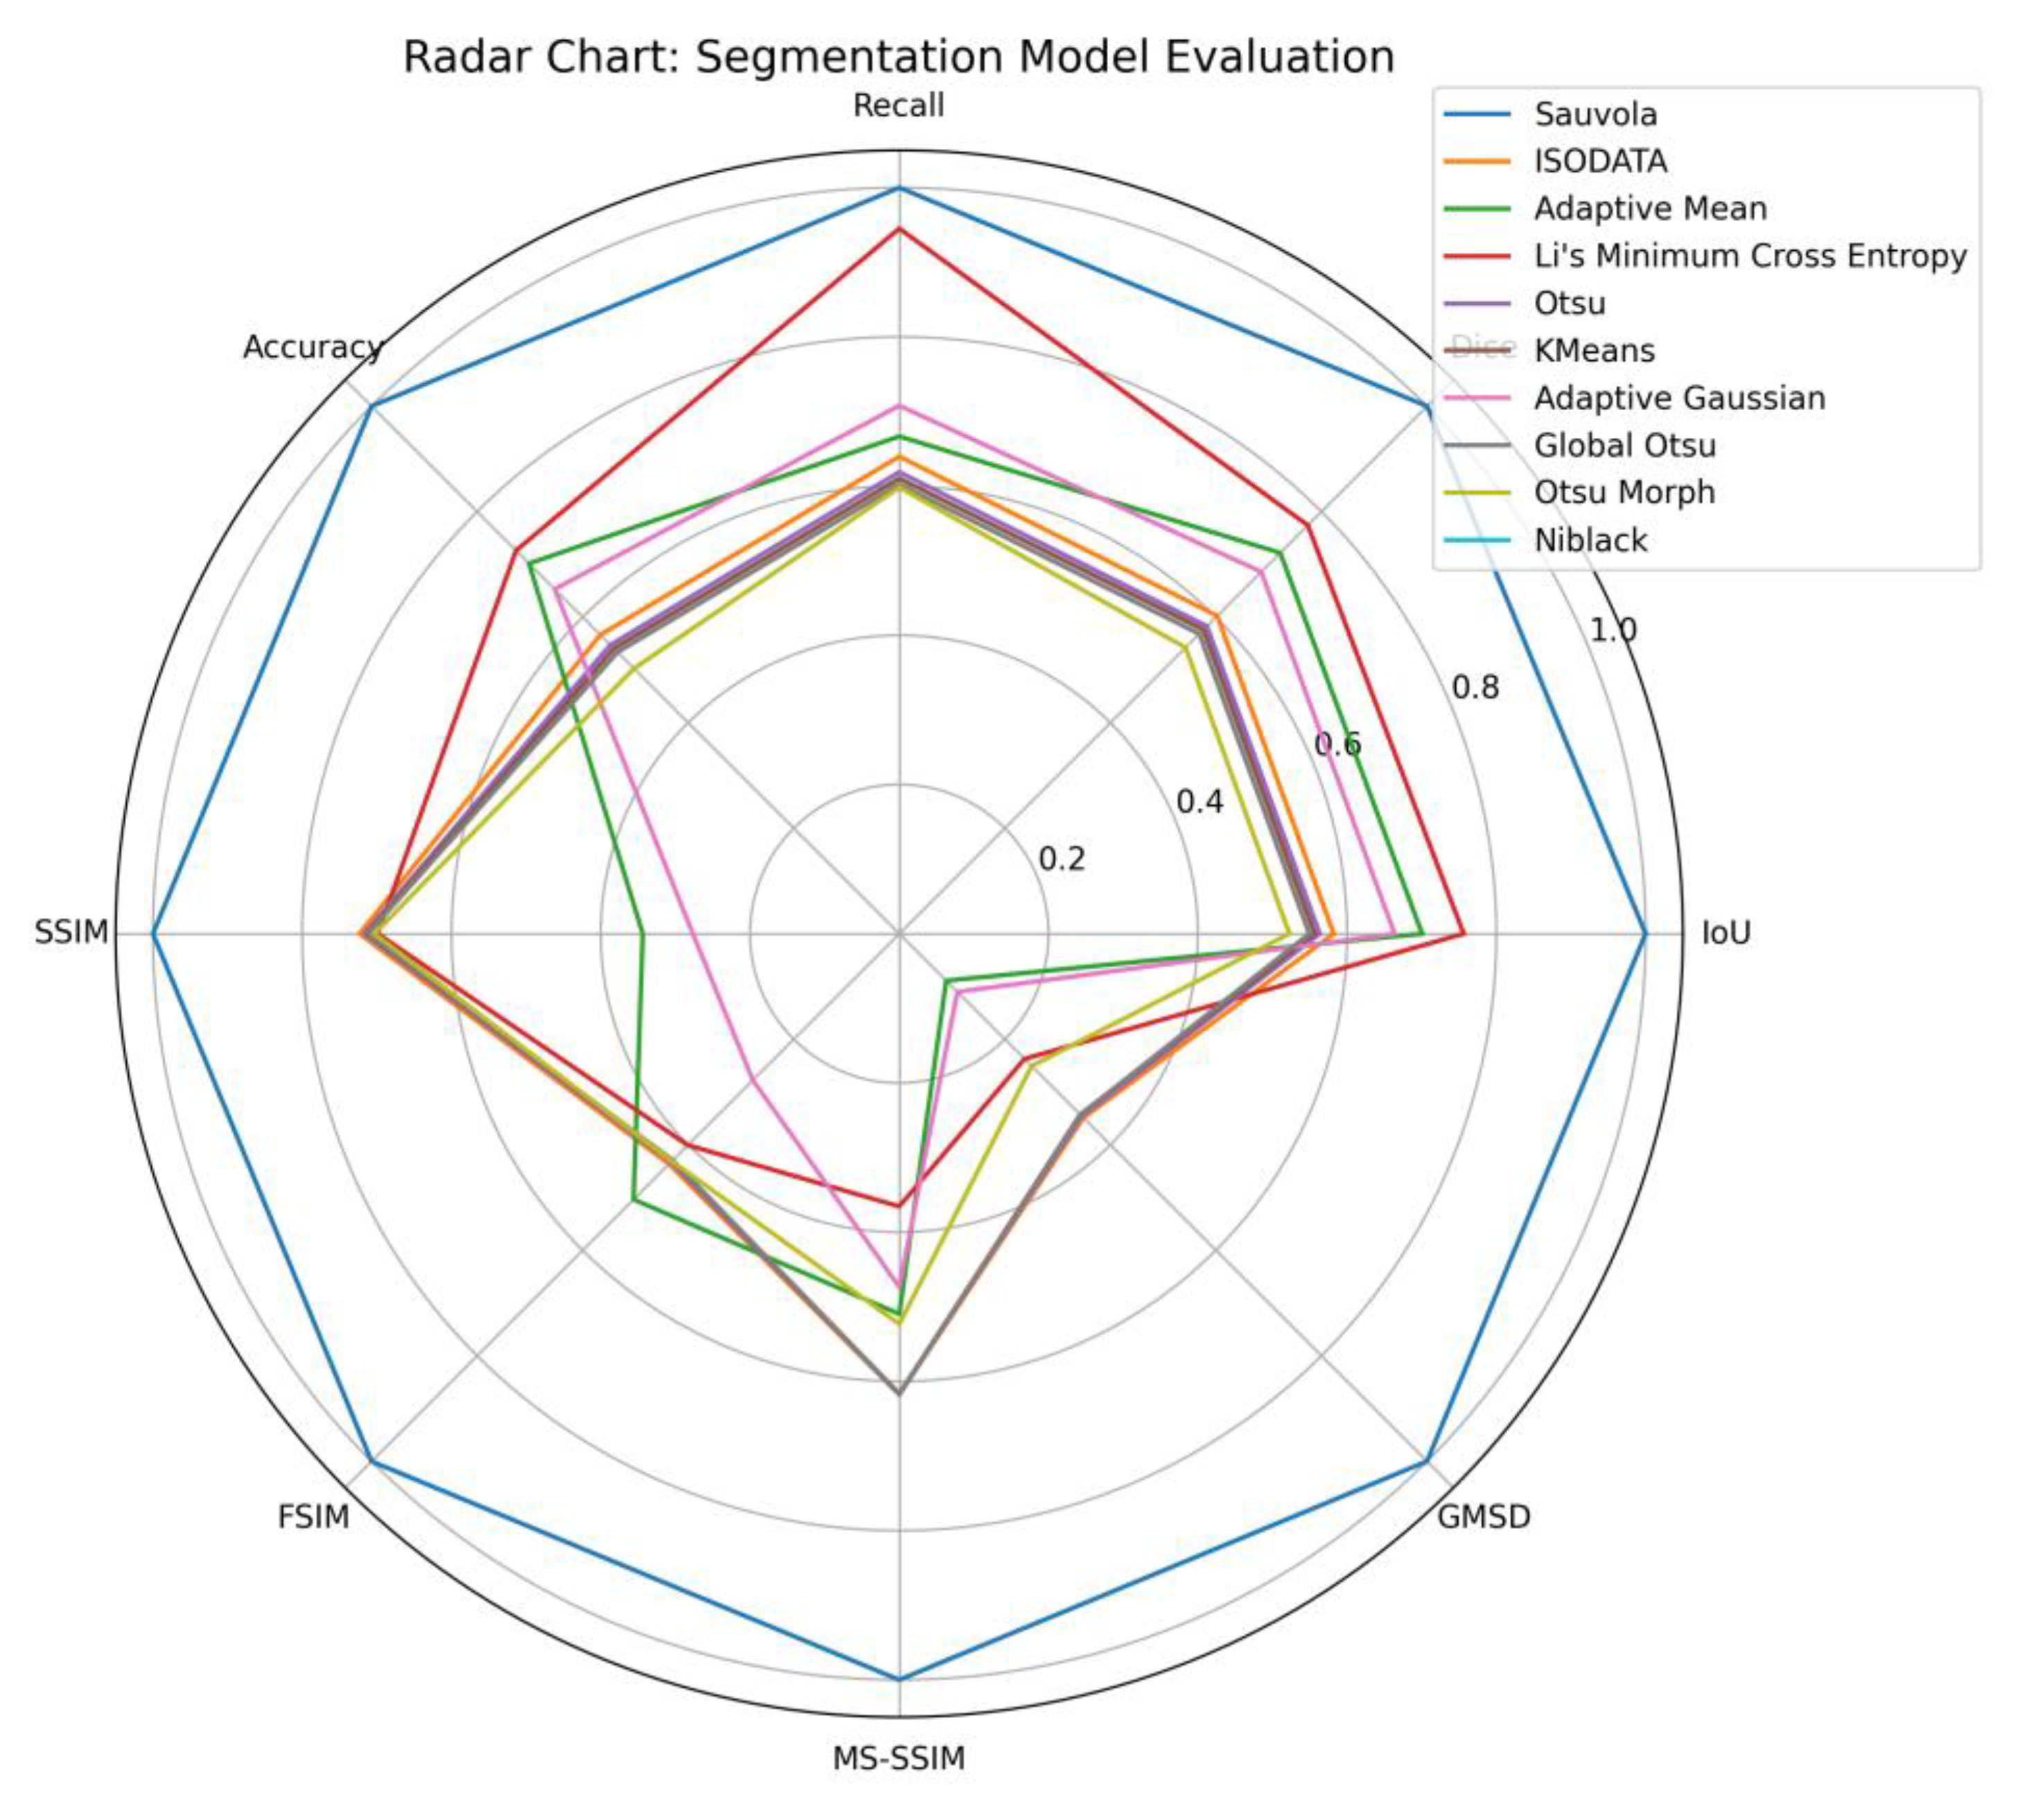

Table 1.
Average Result of Evaluation Metrics Based on Confusion Matrix.
| Method | IoU | Dice | Recall | Accuracy |
|---|---|---|---|---|
| Adaptive Gaussian | 0.869 | 0.930 | 0.908 | 0.884 |
| Adaptive Mean | 0.876 | 0.934 | 0.899 | 0.892 |
| Global Otsu | 0.847 | 0.916 | 0.885 | 0.864 |
| ISODATA | 0.853 | 0.920 | 0.893 | 0.870 |
| Kmeans | 0.848 | 0.917 | 0.887 | 0.865 |
| Li’s Minimum Cross Entropy | 0.887 | 0.940 | 0.959 | 0.896 |
| Niblack | 0.741 | 0.851 | 0.755 | 0.775 |
| Otsu | 0.850 | 0.918 | 0.889 | 0.866 |
| Otsu Morph | 0.842 | 0.913 | 0.884 | 0.859 |
| Sauvola | 0.934 | 0.966 | 0.971 | 0.942 |
Table 2.
Average Result of Evaluation Metrics Based on Structural Analysis.
| Method | SSIM | FSIM | MS-SSIM | GMSD |
|---|---|---|---|---|
| Adaptive Gaussian | 0.432 | 0.638 | 0.598 | 0.423 |
| Adaptive Mean | 0.459 | 0.681 | 0.612 | 0.426 |
| Global Otsu | 0.608 | 0.667 | 0.653 | 0.392 |
| ISODATA | 0.613 | 0.668 | 0.653 | 0.391 |
| KMeans | 0.609 | 0.667 | 0.653 | 0.392 |
| Li’s Minimum Cross Entropy | 0.603 | 0.661 | 0.557 | 0.406 |
| Niblack | 0.320 | 0.586 | 0.416 | 0.438 |
| Otsu | 0.610 | 0.667 | 0.653 | 0.392 |
| Otsu Morph | 0.605 | 0.667 | 0.617 | 0.404 |
| Sauvola | 0.725 | 0.774 | 0.800 | 0.304 |
Disclaimer/Publisher’s Note: The statements, opinions and data contained in all publications are solely those of the individual author(s) and contributor(s) and not of MDPI and/or the editor(s). MDPI and/or the editor(s) disclaim responsibility for any injury to people or property resulting from any ideas, methods, instructions or products referred to in the content. |
© 2025 by the authors. Licensee MDPI, Basel, Switzerland. This article is an open access article distributed under the terms and conditions of the Creative Commons Attribution (CC BY) license (http://creativecommons.org/licenses/by/4.0/).
Copyright: This open access article is published under a Creative Commons CC BY 4.0 license, which permit the free download, distribution, and reuse, provided that the author and preprint are cited in any reuse.


