
Submitted:
05 June 2025
Posted:
06 June 2025
You are already at the latest version
Abstract
Blue carbon ecosystems, particularly mangroves, seagrasses, and salt marshes, play a crucial role in climate regulation by capturing and storing huge stocks of carbon. Together with serving as habitat for fish and other wildlife, protecting shoreline from erosion, as well as providing harvestable wood and non-wood resources to society, blue carbon ecosystems offer investment opportunities through carbon markets, thus supporting climate change mitigation and sustainable livelihoods. The current study assessed above- and below-ground biomass, sediment carbon stocks, and sequestration potential of blue carbon ecosystems in Lamu and Kwale counties, Kenya; using 2020 as the baseline year. This was followed by mapping of hotspot areas of degradation and the identification of investment opportunities in blue carbon credits. Carbon densities in mangroves of Lamu and Kwale were estimated at 560.23 Mg C ha⁻¹ and 526.34 Mg C ha⁻¹, respectively, with over 70% stored in sediments. Seagrass carbon densities in Lamu (171.65 Mg C ha⁻¹) and Kwale (220.29 Mg C ha⁻¹) exceed the national average but align with global estimates. Mangrove cover is declining at 0.49% yr⁻¹ in Kwale and 0.16% yr⁻¹ in Lamu, while seagrass loss in Lamu is 0.67% yr⁻¹, with a 0.34% yr⁻¹ increase in Kwale. Under a business-as-usual scenario, mangrove loss over 30 years will result in emissions of 4.43 million tCO₂e in Kwale and 18.96 million tCO₂e in Lamu. Effective interventions could enhance sequestration from 0.12 to 3.86 million tCO₂e in Kwale and 0.62 to 19.52 million tCO₂e in Lamu. Seagrass loss in Lamu could emit 5.21 million tCO₂e. With a carbon price of $20 per tCO₂e, projected annual revenues from carbon credits amount to $3.59 million in Lamu and $216,040 in Kwale. These findings highlight the substantial climate and financial benefits of investing in blue carbon ecosystem conservation and restoration.
Keywords:
blue carbon
; carbon sequestration
; mangroves
; seagrasses
; climate mitigation
; ecosystem restoration
; carbon credits
; investment opportunities
; Kenya
1. Introduction
Coastal wetlands such as mangroves, seagrasses, and salt marshes capture and store huge stocks of organic carbon in both above- and below-ground components (Nellenmann et al., 2009; Duarte et al., 2013). These blue carbon ecosystems (BCEs) offer a variety of essential goods and services and play a crucial role in addressing the triple planetary crisis. Despite covering less than 1.0% of the ocean's surface, BCE contributes 50-70% of the oceanic carbon (McLeod et al., 2011). Conserving and sustainably managing these ecosystems could provide up to 21% of the global emission reductions needed by 2050, to limit temperature increases to the 1.5°C target (Hoegh-Guldberg et al., 2019). However, BCEs are being lost and degraded globally at an alarming rate of 1-7% per year (Pendleton et al., 2012), which is significantly higher than the global loss of tropical forests, estimated at 0.5% per year (Pendleton et al., 2012). When blue carbon ecosystems are lost or degraded, they not only halt taking up more carbon but also release the already stored carbon back into the atmosphere, leading to global warming (Nellenmann et al., 2009).
The "carbon sink" service is just one of the many crucial benefits these ecosystems offer for human well-being, including food security, improved water quality, raw materials, and shoreline protection, among others (Nagelkerken et al., 2008). For example, the decline in coastal fisheries is directly linked to losses and degradation of BCE (Howard et al., 2017; UNEP-WCMC, 2024). Restoring and protecting BCEs is, therefore, essential for biodiversity conservation, sustainable livelihoods, and climate change mitigation and adaptation (Howard et al., 2017). Several countries have incorporated measures to utilize these benefits in their development and climate change agendas (Friess et al., 2020; Fu et al., 2024).
In Kenya, mangroves and seagrasses are the major blue carbon ecosystems. While these ecosystems provide numerous benefits to society, they continue to be lost and degraded due to a combination of natural and human factors. According to Kenya's national mangrove ecosystem management plan (2017-2027), about 40% of mangroves were lost between 1996 and 2015 (GoK, 2017). Although the rate of degradation is reported to be declining, localized over-exploitation of mangrove resources remains common across the country (Bosire et al., 2016; Hamza et al., 2020).
Beyond their ecological importance, blue carbon ecosystems also offer significant economic opportunities through carbon markets. The voluntary carbon market, particularly through mechanisms such as Verified Carbon Standard (VCS) under Verra, has opened avenues for financing blue carbon conservation and restoration initiatives. Carbon credits generated from verified blue carbon projects can be sold to companies and organizations aiming to offset their carbon footprints, providing a sustainable funding model for community-led conservation efforts. The growing demands for high-quality, nature-based carbon credits presents an opportunity to integrate blue carbon into sustainable financing frameworks, attracting investors and stakeholders in climate finance. Additionally, compliance markets, such as those driven by national or regional emissions trading schemes, are increasingly recognizing the role of blue carbon in meeting climate targets (State of the Blue Carbon Market, 2024). To further strengthen blue carbon financing, emerging mechanisms such as blue bonds and payments for ecosystem services (PES) are gaining traction. Additionally, blended finance models, which combine public, private, and philanthropic funding, are being explored to scale up investment in blue carbon initiatives (UNEP, 2021). With increasing corporate commitments to achieving net-zero emissions, the blue carbon market stands as a critical pathway to unlocking climate finance while supporting biodiversity conservation and coastal resilience.
Limited studies exist in Kenya quantifying blue carbon reservoirs, sequestration rates, and possible emissions in response to disturbance. To improve our understanding of the climate change mitigations and adaptation potential of blue carbon in Kenya, the present study was carried out to: (a) Assess status, conditions and trends of blue carbon ecosystems; and identify degradation hotspots in Kwale and Lamu Counties, (b) Determine blue carbon stocks in biomass and soil, (c) Estimate blue carbon sequestration rates and emission projections over the next 30 years, (d) Estimate carbon credit potential for mangrove conservation as well as reforestation over the next 20 years in Kwale and Lamu Counties, Kenya.
2. Materials and Methods
2.1. Description of the Study Area
Kenya has an approximately 600 km long coastline extending from the Kenya-Tanzania border in the south to the Kenya-Somalia border in the north; between latitudes 1°40΄S and 4°25΄S and longitudes 41°34΄E and 39°17΄E. Along this coastline, mangroves are a common feature in creeks, protected bays, lagoons, and estuaries of major rivers (Figure 1). According to the national mangrove ecosystem management plan (2017 - 2027), the total mangrove area in Kenya is estimated at 61,271 ha, represented by nine species (GoK, 2017). Kwale and Lamu Counties constitute over 70% of the total mangroves in Kenya.
Seagrasses along the Kenyan coast are represented by 12 species and cover approximately 33,600 ha of intertidal and subtidal areas (UNEP, 2009). Approximately 80% of these seagrasses are found in Lamu and Kwale Counties (Table 1). This study focused on mangroves and seagrasses in Kwale and Lamu Counties (Figure 1).
2.2. Mangrove of Kwale County
There are about 8,354 ha of mangrove forests in Kwale County. These forests are dominated by pure and mixed stands of Ceriops tagal, Rhizophora mucronata, and Avicennia marina. Major mangrove areas in Kwale County occur in Gazi Bay and the Vanga-Funzi system, including Sii Island. Even though mangrove harvesting is banned in Kwale County, increased demand for mangrove wood products has promoted illegal harvesting activities, leading to forest degradation in many parts of the County. According to the national mangrove management plan, the restoration potential of mangrove forests in Kwale County is estimated at 3,725 ha (GoK, 2017).
2.3. Seagrasses of Kwale County
Seagrass beds of Kwale cover approximately 9,920 ha and are dominated by pure and mixed stands of Thalassodendron ciliatum, Thalassia hemprichii, Enhalus acoroides, and Syringodium isoetifolium that are found growing in both intertidal and subtidal areas (GIZ, 2024). Extensive seagrass beds are found in the Diani-Chale lagoon, Gazi Bay, and the Funzi-Vanga seascape. Tourism activities and artisanal fishing are major economic activities in seagrass beds. Extensive loss of seagrass, especially for the dominant Thalassodendron ciliatum, has been proliferated by illegal fishing activities and herbivory by sea urchins (Uku et al., 2021). Most of the artisanal fishermen commonly use boat seine and drag nets, which have resulted in the detrimental impacts and ongoing removal of seagrasses (Harcourt et al., 2008).
2.4. Mangroves of Lamu County
The mangroves of Lamu County cover approximately 37,350 ha, equivalent to 59% of the total mangroves in Kenya. These forests are dominated by mixed stands of Rhizophora mucronata, as well as pure stands of Avicennia marina and Ceriops tagal. For management purposes, mangroves in Lamu are classified into five management blocks, namely Northern swamps, Pate Island swamps, Northern Central swamps, Southern swamps, and Mongoni-Dodori Creek swamps. Part of the Northern Central swamp forests and the entire Northern swamp forests are within the Kiunga Marine Biosphere Reserve, where mangrove harvesting is regulated.
Commercial mangrove logging is a livelihood activity for communities in Northern Central, Pate Island, and Southern swamps, where most of the licensed harvesting occurs. Unlicensed harvesting of mangrove wood for use in traditional lime making has further depleted mangroves at Pate, Yowea, and Manda Islands (GoK, 2017).
2.5. Seagrasses of Lamu County
Lamu seagrass meadows cover approximately 21,067 ha (TNC, 2024), dominated by monospecific communities of Thalassodendron ciliatum found in deeper subtidal areas, while multispecies seagrass communities occur in shallow intertidal zones. This is in addition to Cymodea serrulata, Halodule wrightii, Enhalus acoroides, Halophila ovalis, Halophila stipulaceae, Thalassia hemprichii, and Syringodium isoetifolium (Uku et al., 2021). Fishing is the most prevalent economic activity in Lamu seagrass beds. Human disturbances such as sand harvesting, dredging for infrastructure development, illegal mangrove harvesting, and increased sea urchin herbivory are having devastating effects on seagrass distribution and health (Eklöf et al., 2008).
2.6. Sampling Strategy
This study aimed to assess the total ecosystem carbon of mangrove and seagrass ecosystems in Lamu and Kwale Counties. Three key carbon pools were considered for the study, including: above- and below-ground biomass carbon, and soil organic carbon. This was followed by validation exercises of the satellite images to ascertain the extent, conditions, and trends of these critical ecosystems.
A total of six sites were assessed for each ecosystem type in Kwale County, whereas three sites were evaluated in Lamu County (Figure 1). Site selection was determined according to the following criteria: (i) Structural attributes appeared to be typical of other sites in the area, (ii) Different status and conditions of the habitats, and (iii) Ease of access and navigation for logistical purposes.
2.7. Quantification of Carbon Storage, Sequestration, and Emissions
A systematic literature review was conducted using widely used databases, including Web of Science, Google Scholar, PubMed, JSTOR, Science Direct, as well as institutional repositories and government reports to generate existing data and information on the status, conditions, and trends of blue carbon ecosystems in Kenya. The following search words were used: “Coastal ecosystems”, “Mangroves”, “Seagrass”, “Carbon stocks”, “Carbon emissions”, “Kenya AND Lamu”, “Kenya AND Kwale”, “Carbon AND sequestration”, “Carbon AND markets”. The returned search records included 32 peer-reviewed publications and three KMFRI databases containing information on blue carbon in Kenya (Supplementary Table 1).
This was supplemented by primary data generated from the two field campaigns using Kauffman and Donato (2012) protocols, whose application can be found in Kairo et al. (2021). At each site mangrove species were identified, position marked, and data on tree height (m), stem diameter (cm), and cover (%) were recorded. From this information, the following vegetation attributes were derived: basal area (m2 ha-1), stand density (stems ha-1), above-and below-ground biomass (Mg ha-1), and total ecosystem carbon (Mg C ha-1).
Our scope of inference was defined as all above-ground carbon pools plus below-ground components, up to a maximum depth of 1.0 m in mangroves and 50 cm in seagrasses. Mangrove deforestation rates were derived from Compound Annual Growth Rate (CAGR) as outlined in FAO (1995), and using the relations:
where A1 and A2 are the forest cover at time t1 and t2, respectively (the unit: per year or percentage per year).
Projections of cover and carbon dynamics were made over 30 years with and without the project scenarios.
Carbon stocks were derived from primary and secondary data archived at KMFRI database (Supplementary Table 1). Carbon sequestration of mangroves was estimated using Tier 1 and 2 or IPCC (Hiraishi et al., 2014), while that of seagrasses was estimated using the global averages (Fourqurean et al., 2012). Carbon emissions of both mangroves and seagrasses were estimated using existing global estimates (Andreetta et al., 2014; Ochieng & Erftemeijer, 2003).
In estimating mangrove cover/cover change, one challenge we had to overcome was the availability of consistent cloud-free satellite images for the period under consideration. To resolve this, we used the 1990 to 2020 period to establish cover and cover changes, blue carbon stocks, and emission levels projected to 2050. The choice of 2020 baseline and the projections up to 2050 align well with key national, regional and global targets, including; Kenya’s updated Nationally Determined Contributions (NDCs), which emphasize long-term commitments to climate actions; the UN’s Decade on Ecosystem Restoration (2020-2030), and Kunming-Montreal Global Biodiversity Framework, among others.
3. Results
3.1. Mangrove and Seagrass Cover Change in Kwale and Lamu Counties
The current area of mangroves in Kenya is estimated at 54,304 ha. This is slightly lower than the 61,271 ha used in the development of the National Mangrove Ecosystem Management Plan (GoK, 2017). On the other hand, the area of seagrasses in Kenya was estimated at 39,693 ha; a value higher than the 31,700 ha reported by Harcourt et al. (2018). These differences could have arisen due to differences in methodologies used, period of data acquisition, and data sources. Harcourt et al. (2018) as well as the present study utilized Landsat imagery, whereas data used in the mangrove management plan were generated through use of medium-scale high-resolution aerial photography (Ochieng & Erftemeijer, 2003).
Kwale and Lamu Counties account for approximately 80% of Kenya’s blue carbon ecosystems (Table 1). These ecosystems have experienced losses and gains over the years. At the country level, for instance, the rate of mangrove loss between 1990 and 2020 was estimated at 0.5% yr-1, with disproportionately higher losses experienced in peri-urban systems. In Lamu County, mangroves declined from 37,417 to 35,678 ha, translating to a rate of 0.16% yr-1 (Table 1). This is notably lower than in Kwale County, where mangroves recorded a 0.49% yr-1 reduction. Hotspot areas of mangrove changes in Lamu County were identified in Manda, Kililana, Njia ya Ndovu, Hidiyo, Bori, Pate, Mkokoni, and Ndau areas. Whereas in Kwale County, the highest mangrove losses and degradation occurred in Majoreni, Kiwegu, Bazo, Bodo, Munje, Mkurumudzi, and Chale areas (Figure 2).
There was a 12.4% increase in seagrass coverage in Kwale County between 1986 and 2020; compared to the 20.4% net reduction in Lamu County (Table 1). Hotspot areas for seagrass changes were observed within Kiunga, Shanga, Mkokoni, Faza, Pate, and partly along the Mongoni-Dodori Creeks, Manda Toto, and Kipungani-Kiongwe areas. In Kwale County, hotspot areas of change were identified at Bazo, Spaki, Kubisu, Mwangani, Shimoni, Wasini, Msambweni, Gazi, and along Chale-Diani Shoreline areas (Figure 3). Causes of mangrove and seagrass losses and degradation in the study areas were found to be over-exploitation of resources, habitat conversion, illegal fishing activities, and climate change.
3.2. Carbon Stocks and Emission Levels from BCEs in Kwale and Lamu Counties
3.2.1. Carbon Stocks
In Lamu County, the above- and below-ground mangrove biomass carbon is estimated at 127.85 and 38.72 Mg C ha-1, respectively. Together with soil organic carbon of 393.66 Mg C ha-1, the total mangrove carbon density in Lamu becomes 560.23 Mg C ha-1. Considering the entire 35,678 ha of mangroves, the total mangrove ecosystem carbon in Lamu becomes 19,987,885.94 Mg C (Table 2). On the other hand, the standing biomass of mangrove blue carbon in Kwale County is estimated at 64.94 Mg C ha-1, with a below-ground carbon stock of 24.30 Mg C ha-1. The soil organic carbon stock in Kwale's mangroves is estimated at 437.10 Mg C ha-1, giving a total mangrove carbon density of 526.34 Mg C ha-1. Considering the entire 7,220 ha of mangroves in Kwale County, the total mangrove ecosystem carbon becomes 3,800,174.80 Mg C. The spatial distribution of above-ground mangrove carbon in Kwale and Lamu Counties is given in Figure 4.
In Kwale, the seagrasses have an above- and below-ground biomass carbon of 0.5 Mg C ha⁻¹ and 5.1 Mg C ha⁻¹, respectively, resulting in a total biomass carbon of 5.6 Mg C ha⁻¹. The soil carbon is notably higher at 214.69 Mg C ha⁻¹, bringing the total ecosystem carbon stock to 220.29 Mg C ha⁻¹ and a total carbon stock of approximately 2,185,276.8 Mg C. In Lamu, the seagrass ecosystems exhibit an above-ground carbon of 0.65 Mg C ha⁻¹ and BGB carbon of 5.9 Mg C ha⁻¹, leading to a total biomass carbon of 6.55 Mg C ha⁻¹. The soil carbon is 165.1 Mg C ha⁻¹, resulting in a total ecosystem carbon stock of 171.65 Mg C ha⁻¹ and a total carbon stock of around 3,616,150.55 Mg C. On average, the seagrasses in both counties have an AGB carbon of 0.58 Mg C ha⁻¹ and BGB carbon of 5.5 Mg C ha⁻¹, and a total biomass carbon of 6.08 Mg C ha⁻¹. The soil carbon averages 189.90 Mg C ha⁻¹, resulting in a total ecosystem carbon stock of 195.97 Mg C ha⁻¹ and a combined total carbon stock of 5,801,427.35 Mg C. As expected, much of this carbon is stored in the sediment (Table 2).
3.3. Potential Emissions
In estimating potential emissions from blue carbon ecosystems in Kenya, we used a conservative approach by IPCC (2014), whose application may be found in Kairo et al. (2021). This approach focuses on standing carbon pools as well as sediment carbon in the top meter of sediment. These pools are most susceptible to land-use changes and are termed as ‘near-surface’ carbon (Adame et al., 2021). The fate of 'near-surface carbon' is estimated from 25 to 100% emissions to the atmosphere, depending on land use types (Pendleton et al., 2012; Hamilton & Friess, 2018). The high end of 100% would apply if most land uses tend toward extreme impacts that convert the system to a qualitatively different state that removes and prevents recovery of near-surface carbon. The low end of 25% would apply if most land uses are relatively light-handed and retain, bury, or merely redistribute most near-surface carbon (Duarte et al., 1998). Using the low end of 25% emissions, the current carbon emissions from mangroves in Kwale and Lamu were estimated at 482.92 and 514.01 MgCO2e ha-1, respectively. For seagrasses, the current emission is estimated at 202.71 and 151.48 MgCO2e ha-1 in Kwale and Lamu Counties, respectively. These values could be used to estimate potential emissions from these blue carbon ecosystems over a projected period of time.
3.4. Cumulative Blue Carbon Stocks, Sequestration, and Emissions Projections in Lamu and Kwale Counties over the Next 30 Years
Mangroves and seagrasses in Kenya are being lost at rates of 0.5% yr-1 and 0.18% yr-1, respectively (Table 1). Rates of decline vary across the sites, with mangrove cover declining at 0.47 and 0.16% yr-1 in Kwale and Lamu Counties, respectively. Seagrass cover in Lamu County is declining at 0.67% yr-1, while the same is increasing in Kwale County at 0.34% yr-1. To enable comparison with other assessments, the carbon values were expressed in terms of CO2-equivalent by multiplying them by 3.67, the molecular weight of C in CO2. Using the approach by Adame et al. (2021), and taking 2020 as a base year for carbon stocks and emission levels in Kwale and Lamu Counties, we can project over 30 years; assuming; (i) cover change and sequestration rates per year remains constant, and (ii) rates of carbon emissions with respect to base year depends on the rate of change in the area and the rate of emissions is at the limit for maximum carbon that could be emitted per hectare. Cumulative carbon stocks, sequestration, and emission levels were projected over the 30 years with and without the project scenario analysis (Table 3). Management interventions were derived from both the national mangrove management plan as well as the seagrass strategy (GoK, 2015; 2017).
Under the business-as-usual (BAU) scenario, mangrove cover in Kwale and Lamu Counties is projected to decline by 13.8% and 4.7%, respectively, over the 30-year period from 2020 to 2050. This decline would reduce total ecosystem carbon stocks from 13.22 to 11.40 million tCO₂e in Kwale, and from 73.35 to 69.94 million tCO₂e in Lamu. In contrast, with targeted management interventions, mangrove cover is expected to increase by 6.5% in Kwale and 4.8% in Lamu, resulting in corresponding increases in carbon stocks to 14.08 million tCO₂e and 76.90 million tCO₂e, respectively. Sequestered carbon also shows notable gains under intervention scenarios, rising from 0.12 to 3.86 million tCO₂e in Kwale, and from 0.62 to 19.52 million tCO₂e in Lamu (Table 3). In Kwale, the BAU pathway leads to net carbon emissions of -0.83 million tCO₂e, equating to a negative carbon value of US$ -16.6 million. However, with interventions, net sequestration reaches 1.38 million tCO₂e, translating to a positive value of US$ 27.6 million. In Lamu County, where the mangrove extent and carbon stocks are significantly higher, the BAU scenario results in net emissions of -0.28 million tCO₂e (valued at US$ -5.6 million). Management interventions, however, yield net carbon gains of 7.38 million tCO₂e, generating a substantial value of US$ 147.6 million. These findings highlight the considerable climate mitigation potential and economic value of investing in mangrove restoration and conservation, especially in Lamu.
Under the business-as-usual (BAU) scenario, seagrass ecosystems in Lamu County are projected to decline by 18% in cover over the next 30 years, resulting in cumulative carbon emissions of 5.21 million tCO₂e. At a carbon price of US$20 per tCO₂e, this equates to a potential economic loss of US$104.2 million. However, with project interventions, seagrass cover in Lamu is expected to recover significantly, reducing emissions by 5.12 million tCO₂e and generating climate benefits valued at approximately US$102.4 million, while also delivering ecological and community co-benefits. In Kwale County, seagrass carbon dynamics remain relatively stable under both BAU and intervention scenarios. Project interventions lead to a modest increase in sequestered carbon (0.64 million tCO₂e) and a corresponding net carbon value of US$2.6 million, identical to the BAU outcome. This indicates low carbon loss risk and limited additionality for intervention-based gains. Overall, while Kwale’s seagrass ecosystems show resilience, Lamu’s systems are at greater risk under BAU conditions, but also present greater potential for carbon and economic gains through targeted conservation and restoration actions.
3.5. Carbon Credit Potential for Mangrove Conservation and Restoration in Kwale and Lamu Counties over a 20-Year Period (2024-2044)
Restoration and protection of degraded mangrove and seagrass carbon ecosystems offer relatively low-cost opportunities to mitigate CO2 emissions. Incentive-based schemes associated with blue carbon present a potential revenue stream to compensate those involved in mangrove and seagrass conservation activities. Assuming a crediting price of US$20/tCO2e for high-quality blue carbon credits, the estimated benefit following interventions (avoided deforestation and restoration) for mangroves and seagrasses in Lamu and Kwale Counties over the next 30 years is estimated at US$ 114,173,700 (Table 4). This is in addition to the value of blue carbon ecosystems to shoreline protection, biodiversity conservation, livelihood support, among others (Table 5).
3.6. Mangrove Restoration Potential in Kwale and Lamu Counties
Drivers of mangrove changes in Kwale and Lamu Counties have been identified as over-exploitation of wood products, habitat encroachment and conversion, herbivory, poor land uses in the hinterlands, and climate change. These have cumulatively created huge contiguous blank areas with inadequate natural regeneration. To mitigate losses and degradation of mangrove forests, priority interventions for Kwale and Lamu include enrichment planting, avoided deforestation, increased surveillance and law enforcement, fencing to keep livestock away, hydrological restoration, and monitoring. The total restoration potential of mangroves in Kwale and Lamu Counties has been estimated at 2,661 and 7,714 ha, respectively. In Lamu County, the largest intervention involves avoided deforestation and protection (6,569 ha), supplemented by direct and enrichment planting (454 ha), fencing with hydrological restoration (373 ha), and combined actions including law enforcement (220 ha). Research activities cover 46 ha. In Kwale County, natural regeneration covers 2,396 ha, with direct planting (64 ha), combined direct and enrichment planting (81 ha), enrichment alone (95 ha), hydrological restoration (26 ha), and research (3.2 ha).
4. Discussion
4.1. Cover/cover Change Analysis of Mangroves in Kwale and Lamu
Blue carbon ecosystems in Lamu and Kwale Counties are in different status and conditions. The area of mangrove forests in Lamu and Kwale have been estimated at 35,678 ha and 7,220 ha, respectively, both representing over 70% of total mangrove area in Kenya (Table 1). Our results reveal a net reduction in mangrove cover of 0.16% yr-1 and 0.49% yr-1 in Lamu and Kwale respectively; which is lower than the 0.5% yr-1 national average, but higher than the rates reported for Western Indian Ocean region (0.1% yr-1) and the global average (0.13% yr-1) (FAO, 2022). The loss in Lamu (0.16% yr-1) can be termed as medium, suggesting a concerning trend but not alarming. This is in contrast to the 0.49% yr-1 reduction in Kwale that can be termed as severe, indicating a critical and unsustainable decline in mangrove cover. The underlying root causes for the loss and degradation of mangroves in Kenya have been identified as population increase, economic drivers and inequality, poor governance, and climate change (Bosire et al., 2016; GoK, 2017; Harcourt et al., 2018). Any conservation interventions should target addressing these root causes to be sustainable.
Area of seagrasses in Lamu County has been estimated at 21,067 ha, and 9,920 ha in Kwale (Table 1). Lamu County is losing seagrasses at a rate of 0.67% yr-1, while in Kwale, there is a net gain of 0.34% yr-1. Losses of seagrasses in Lamu were higher than the national average (-0.18% yr-1), but lower than the global average (-1.5% yr-1) (see Table 1). Seagrass losses in Lamu could be attributed to human and natural causes, including poor fishing activities, coastal development, boating activities, herbivory by urchins, and climate change (Harcourt et al., 2018). The gains in seagrass cover in Kwale, on the other hand, could be due to concerted efforts by community, civil society, and the government through increased education and awareness on the values of seagrasses and the need to restore and protect them for nature and community livelihood.
4.2. Carbon Stocks from Blue Carbon Ecosystems in Kwale and Lamu Counties
Total Ecosystem Carbon (TEC) of mangroves in Lamu and Kwale Counties were estimated at 560.23 Mg C ha-1 and 526.34 Mg C ha-1, respectively. These values are slightly higher than the country average (498.9 Mg C ha-1) but lower than the global estimate (Alongi, 2020) of 755.6 Mg C ha-1 (see Table 2). As expected, most of this carbon is stored in the sediment and the balance in the biomass carbon (Table 6). This is consistent with other mangrove carbon studies in Kenya (Kirui et al., 2013), as well as the global estimates that indicate more than 70% of mangrove carbon is being stored in the sediment.
In seagrasses, TEC values for Lamu (171.65 Mg C ha-1) and Kwale (220.29 Mg C ha-1) are higher than country's average (140.21 Mg C ha-1) but consistent with the global average (195.98 Mg C ha-1) - see Table 2. At least 97% of carbon stocks in seagrasses is represented in sediment while the rest is in vegetation carbon (Table 6). This is consistent with global estimates whereby more than 90% of seagrass carbon is captured in seagrass sediment while the rest is stored in above- and below-ground biomass carbon pools (Duarte et al., 1998; Fourqurean et al., 2012).
4.3. Cumulative Carbon Storage, Sequestration, and Emissions Projections in Mangrove and Seagrasses in Kwale and Lamu Counties Between 2024-2044
The stability of mangrove and seagrass ecosystems is influenced by factors emanating from within and outside the system. These ecosystems capture and store huge stocks of carbon; in addition to providing habitat for fish and other wildlife, protecting shorelines, and supporting livelihood. However, these ecosystems are still facing threats from both natural and human factors.
A summary table of blue carbon ecosystems in Kwale and Lamu compared in Kenya and elsewhere is provided in Table 6. Lamu's mangroves exhibit higher biomass carbon (166.57 tC ha-1) than Kwale (89.24 tC ha-1) and global average (92.7 tC ha-1). Soil carbon stocks in Kwale (437.10 tC ha-1) are higher than in Lamu (393.66 tC ha-1), and both exceed the global average (335.7 tC ha-1). Lamu's seagrass vegetation carbon stock (6.55 tC ha-1) is higher than Kwale's (5.6 tC ha-1), but much lower than the global average for seagrasses (36.69 tC ha-1). Soil carbon stocks are higher in Kwale (214.69 tC ha-1) compared to Lamu (165.1 tC ha-1), and both were higher than the global average for seagrasses (70 tC ha-1)-Table 6. On an area basis, mangroves in Kwale and Lamu have much higher carbon stocks when compared to their terrestrial counterparts in Kenya and elsewhere (Table 6).
5. Conclusions
This study assessed the status, conditions, and trends of blue carbon in Kwale and Lamu Counties in Kenya. The emissions and sequestration levels were subjected to a 20-30 years crediting period to establish their investment potentials in the two Counties. Mangroves and seagrasses can capture and store 6.65 and 0.88 tCO2 ha-1yr-1, respectively. Over a 20-year crediting period, mangroves in Kwale and Lamu could sequester up to 2.57 million tCO2e and 13.01 million tCO2e, respectively. Seagrasses also demonstrate notable carbon sequestration potentials of up to 6.4 million tCO2e and 0.37 million tCO2e in Kwale and Lamu Counties over the same period. These blue carbon sequestration potentials present investment opportunities with multiple co-benefits. With an estimated market price of $20/tCO2e for ‘high-quality’ blue carbon credits, the potential revenue to be generated from sales of mangrove and seagrass carbon credits in Kwale and Lamu will be about US$3,589,750 and US$216,040 yr-1, respectively. By determining blue carbon stocks, sequestration rates, degradation hotspots, and emissions projections over the next 20 years, this study lays the foundation for potential investments in blue carbon for the benefit of nature and communities. The combination of financial incentives in the conservation of management of blue carbon ecosystems presents a viable opportunity for impactful investment in the fight against climate change, while unlocking substantial ecological and societal benefits.
Author Contributions
Conceptualization, J.K, A.M., and G.N.,.; methodology, J.K., J.K.S.L., A.M., G.N., and A.S.E.,.; software, A.M., F.M., J.K.S.L., and G.N.; validation, F.M., A.M., G.N., G.K., and B.K.,.; formal analysis, J.K.S.L., A.M., F.M., and G.N.,.; investigation, F.M., A.M., G.N., and B.K.,.; resources, J.K.; data curation, A.M., F.M., G.N., and J.S.K.L.; writing—original draft preparation, J.K., A.M., F.M., G.N., G.K., and B.K.,.; writing—review and editing, A.S.O., J.S.K.L., and L.O.,.; visualization, F.M., J.S.K.L., A.M., G.N.,.; supervision, L.O and A.S.E.,.; project administration and funding acquisition, J.K., L.O., and A.S.E.,. All authors have read and agreed to the published version of the manuscript.
Funding
This research was funded by GIZ-Kenya under the IKI Kwale Tanga Project, and GIZ Germany, under the business development project Finance and Insurance for Nature-based Solutions, Tender Reference No: 83451583. Additional support was through PEGASuS 5.1. Future Earth subgrant project funded by Gordon and Betty Moore Foundation, PTE Future Earth Award No. 3839 and The Nature Conservancy (Grant No. F107291-KMFRI-20230203).
Data Availability Statement
The raw data supporting the findings of this study is available upon reasonable request to the corresponding author. The data is not publicly available due to privacy reasons. .
Acknowledgments
The authors are grateful to Kisilu Mary, Gilbert Kosgei, and Hamisi Kirauni (all of KMFRI) for their cooperation and support during data collection. We further appreciate the Kenya Forest Service, Lamu and Kwale, for logistical support during fieldwork. We would like to express our warm gratitude to all the people who directly or indirectly contributed to the successful completion of this study.
Conflicts of Interest
The authors declare no conflicts of interest.
References
- Nellemann, C. , & Corcoran, E. (Eds.). (2009). Blue carbon: the role of healthy oceans in binding carbon: a rapid response assessment. UNEP/Earthprint. https://www.grida.no/publications/145.
- Duarte, C. M. , Losada, I. J., Hendriks, I. E., Mazarrasa, I., & Marbà, N. (2013). The role of coastal plant communities for climate change mitigation and adaptation. Nature Climate Change, 3(11), 961-968. [CrossRef]
- Mcleod, E. , Chmura, G. L., Bouillon, S., Salm, R., Björk, M., Duarte, C. M.,... & Silliman, B. R. (2011). A blueprint for blue carbon: toward an improved understanding of the role of vegetated coastal habitats in sequestering CO2. Frontiers in Ecology and the Environment, 9(10), 552-560. [CrossRef]
- Hoegh-Guldberg, O. , Jacob, D., Taylor, M., Guillén Bolaños, T., Bindi, M., Brown, S.,... & Zhou, G. (2019). The human imperative of stabilizing global climate change at 1.5 °C. Science, 365(6459), eaaw6974. [CrossRef]
- Pendleton L, Donato DC, Murray BC, Crooks S, Jenkins WA, Sifleet S, Craft C, Fourqurean JW, Kauffman JB, Marbà N, Megonigal P, Pidgeon E, Herr D, Gordon D, Baldera A (2012) Estimating global blue carbon emissions from conversion and degradation of vegetated coastal ecosystems. PloS ONE 7(e43542):1–7. [CrossRef]
- Nagelkerken, I. S. J. M. , Blaber, S. J. M., Bouillon, S., Green, P., Haywood, M., Kirton, L. G.,... & Somerfield, P. J. (2008). The habitat function of mangroves for terrestrial and marine fauna: a review. Aquatic botany, 89(2), 155-185. [CrossRef]
- UNEP-WCMC. (2024). Understanding how mangrove loss threatens biodiversity. United Nations Environment Programme World Conservation Monitoring Centre. Retrieved from https://www.unep-wcmc.org/en/news/understanding-how-mangrove-loss-threatens-biodiversity.
- Howard, J. , Sutton-Grier, A., Herr, D., Kleypas, J., Landis, E., McLeod, E.,... & Simpson, S. (2017). Clarifying the role of coastal and marine systems in climate mitigation. Frontiers in Ecology and the Environment, 15(1), 42-50. [CrossRef]
- Friess, D. A. , Krauss, K. W., Taillardat, P., Adame, M. F., Yando, E. S., Cameron, C.,... & Sillanpää, M. (2020). Mangrove blue carbon in the face of deforestation, climate change, and restoration. Annual Plant Reviews, 3(10.1002). [CrossRef]
- Fu, C. , Steckbauer, A., Mann, H., & Duarte, C. M. (2024). Achieving the Kunming–Montreal global biodiversity targets for blue carbon ecosystems. Nature Reviews Earth & Environment, 5(7), 538-552. [CrossRef]
- GoK (2017). National mangrove ecosystem management plan. Kenya Forest Service: Nairobi, Kenya. Retrieved from http://www.kenyaforestservice.org/documents/MANGROVE_MANAGEMENT_PLAN.pdf.
- UNEP. (2021). State of Finance for Nature: Tripling investments in nature-based solutions by 2030. https://wedocs.unep.org/20.500.11822/36145.
- UNEP. (2009). The Natural Fix? The role of Ecosystems in climate mitigation, A UNEP Rapid Response Assessment-United Nations Environment Programme, UNEP-WCMC, Cambridge, UK. B. Title of the chapter. In Book Title, 2nd ed.; Editor 1, A., Editor 2, B., Eds.; Publisher: Publisher Location, Country, 2007; Volume 3, pp. 154–196. Retrieved from https://www.unep.org/resources/report/natural-fix-role-ecosystems-climate-mitigation.
- Ochieng, C. A. , & Erftemeijer, P. L. A. (2003). Kenya and Tanzania. World atlas of seagrasses, 82. https://www.researchgate.net/profile/Paul-Erftemeijer/publication/305402549_The_Seagrasses_of_Kenya_and_Tanzania/links/578dc4bf08ae7a588ef3e637/The-Seagrasses-of-Kenya-and-Tanzania.pdf.
- GIZ (2024). Blue Carbon and Fishery Potential in Kwale and Lamu Counties, Kenya. GIZ, Kenya. https://www.kmfri.go.ke/images/2025/pdf/blue%20Carbon%20and%20Fishery%20Potential%20in%20Kenya.pdf.
- Uku, J., Daudi, L., Muthama, C., Alati, V., Kimathi, A., & Ndirangu, S. (2021). Seagrass restoration trials in tropical seagrass meadows of Kenya. Western Indian Ocean Journal of Marine Science, 20(2), 69-79. [CrossRef]
- Harcourt, W. D. , Briers, R. A., & Huxham, M. (2018). The thin (ning) green line? Investigating changes in Kenya's seagrass coverage. Biology letters, 14(11), 20180227. [CrossRef]
- TNC (2024). OCEAN CLIMATE ACTIONS IN THE PARIS AGREEMENT: Incorporating Ocean Climate Actions in the Revised Kenya’s Nationally Determined Contributions (NDCs). Technical Report.
- Eklöf, J. S. , De la Torre-Castro, M., Gullström, M., Uku, J., Muthiga, N., Lyimo, T., & Bandeira, S. O. (2008). Sea urchin overgrazing of seagrasses: a review of current knowledge on causes, consequences, and management. Estuarine, Coastal and Shelf Science, 79(4), 569-580. [CrossRef]
- Kauffman, J. B. , & Donato, D. C. (2012). Protocols for the measurement, monitoring, and reporting of structure, biomass, and carbon stocks in mangrove forests (Vol. 86, p. 7). Bogor, Indonesia: Cifor. https://citeseerx.ist.psu.edu/document?repid=rep1&type=pdf&doi=73ed3110a79d21d71e26ebca3ac0d66395cc69d1.
- FAO (2007). The World's Mangroves 1980-2005 (FAO Forestry Paper No. 153). Rome, Forest Resources Division, FAO. pp. 77. ISBN: 978-92-5-105856-5. https://www.fao.org/4/a1427e/a1427e00.htm?
- Kirui, K. B. , Kairo, J. G., Bosire, J., Viergever, K. M., Rudra, S., Huxham, M., & Briers, R. A. (2013). Mapping of mangrove forest land cover change along the Kenya coastline using Landsat imagery. Ocean & Coastal Management, 83, 19-24. [CrossRef]
- Erftemeijer, P. , de Boer, M., & Hilarides, L. (2022). Status of mangroves in the Western Indian Ocean region. Wetlands International, 1-67. https://www.nairobiconvention.org/clearinghouse/sites/default/files/wetlands-international_mangrove-report_2022-1.pdf.
- Lang'at, J. K. S. , Kairo, J. G., Mencuccini, M., Bouillon, S., Skov, M. W., Waldron, S., & Huxham, M. (2014). Rapid losses of surface elevation following tree girdling and cutting in tropical mangroves. Plos one, 9(9), e107868. [CrossRef]
- Tamooh, F. , Huxham, M., Karachi, M., Mencuccini, M., Kairo, J. G., & Kirui, B. (2008). Below-ground root yield and distribution in natural and replanted mangrove forests at Gazi Bay, Kenya. Forest Ecology and Management, 256(6), 1290-1297. [CrossRef]
- Andreetta, A. , Fusi, M., Cameldi, I., Cimò, F., Carnicelli, S., & Cannicci, S. (2014). Mangrove carbon sink. Do burrowing crabs contribute to sediment carbon storage? Evidence from a Kenyan mangrove system. Journal of Sea Research, 85, 524-533. [CrossRef]
- Cohen, R. , Kaino, J., Okello, J. A., Bosire, J. O., Kairo, J. G., Huxham, M., & Mencuccini, M. (2013). Propagating uncertainty to estimates of above-ground biomass for Kenyan mangroves: A scaling procedure from tree to landscape level. Forest Ecology and Management, 310, 968-982. [CrossRef]
- Gress, S. K. , Huxham, M., Kairo, J. G., Mugi, L. M., & Briers, R. A. (2017). Evaluating, predicting and mapping belowground carbon stores in Kenyan mangroves. Global change biology, 23(1), 224-234. [CrossRef]
- Bosire, J. O. , Dahdouh-Guebas, F., Walton, M., Crona, B. I., Lewis Iii, R. R., Field, C.,... & Koedam, N. (2008). Functionality of restored mangroves: a review. Aquatic botany, 89(2), 251-259. [CrossRef]
- Poli, S. (2018). Using invest model for the evaluation of carbon sequestration in Kenyan mangrove forests. https://www.politesi.polimi.it/retrieve/a81cb05d-7319-616b-e053-1605fe0a889a/2019_12_Poli.pdf.
- Githaiga, M. N. (2013). Structure and biomass accumulation of natural mangrove forest at Gazi Bay, Kenya (Doctoral dissertation, Kenyatta University). http://41.89.240.73/handle/embuni/3405.
- Lang'at, J. K. S. (2013). Impacts of tree harvesting on the carbon balance and functioning in mangrove forests (Doctoral dissertation). http://hdl.handle.net/1834/7654.
- Mungai, F. , Kairo, J., Mironga, J., Kirui, B., Mangora, M., & Koedam, N. (2019). Mangrove cover and cover change analysis in the transboundary area of Kenya and Tanzania during 1986–2016. Journal of the Indian Ocean Region, 15(2), 157–176. [CrossRef]
- Nyamao, W. N. (2015). Carbon emissions from degraded mangroves of Tudor and Mwache creeks, Mombasa, Kenya (Doctoral dissertation, Egerton University). Retrieved from https://ir-library.egerton.ac.ke/handle/123456789/1434.
- Mugi, L. M. (2015). Carbon stocks of the mangrove forest in Mwache Creek, Mombasa, Kenya (Doctoral dissertation, Egerton University). http://41.89.96.81:4000/bitstreams/6c36f9ff-6708-4aac-9199-a78fc080d108/download.
- Bosire, J. O. , Kaino, J. J., Olagoke, A. O., Mwihaki, L. M., Ogendi, G. M., Kairo, J. G.,... & Macharia, D. (2014). Mangroves in peril: unprecedented degradation rates of peri-urban mangroves in Kenya. Biogeosciences, 11(10), 2623-2634. [CrossRef]
- Alemayehu, F. , Richard, O., James, K. M., & Wasonga, O. (2014). Assessment of mangrove covers change and biomass in Mida Creek, Kenya. Open Journal of Forestry, 4(4), 398-413. [CrossRef]
- Ibrahim, A. S. , & Ngigi, T. G. (2017). Assessment of mangrove spatial-temporal dynamics and biomass by remotely sensed data case study Kilifi County: Kenya. Journal of Geosciences and Geomatics, 5(1), 24-36. [CrossRef]
- Kairo, J. , Mbatha, A., Murithi, M. M., & Mungai, F. (2021). Total ecosystem carbon stocks of mangroves in Lamu, Kenya; and their potential contributions to the climate change agenda in the country. Frontiers in Forests and Global Change, 4, 709227. [CrossRef]
- Dahdouh-Guebas, F. , Coppejans, E., & Van Speybroeck, D. (1999). Remote sensing and zonation of seagrasses and algae along the Kenyan coast. Hydrobiologia, 400, 63-73. [CrossRef]
- Traganos, D. , Pertiwi, A. P., Lee, C. B., Blume, A., Poursanidis, D., & Shapiro, A. (2022). Earth observation for ecosystem accounting: spatially explicit national seagrass extent and carbon stock in Kenya, Tanzania, Mozambique, and Madagascar. Remote Sensing in Ecology and Conservation, 8(6), 778-792. [CrossRef]
- Githaiga, M. N. , Gilpin, L., Kairo, J. G., & Huxham, M. (2016). Biomass and productivity of seagrasses in Africa. Botanica marina, 59(2-3), 173-186. [CrossRef]
- Mwikamba, E. M. , Githaiga, M. N., Briers, R. A., & Huxham, M. (2024). A review of seagrass cover, status and trends in Africa. Estuaries and Coasts, 47(4), 917-934. [CrossRef]
- Juma, G. A. , Magana, A. M., Michael, G. N., & Kairo, J. G. (2020). Variation in seagrass carbon stocks between tropical estuarine and marine mangrove-fringed creeks. Frontiers in Marine Science, 7, 696. [CrossRef]
- Githaiga, M. N. (2017). The role of seagrass meadows in Gazi Bay, Kenya as carbon sinks (Doctoral dissertation, Edinburgh Napier University). http://41.89.240.73/handle/embuni/3404.
- Omollo, D. J. , Wang’ondu, V. W., Githaiga, M. N., Gorman, D., & Kairo, J. G. (2022). The contribution of subtidal seagrass meadows to the total carbon stocks of Gazi Bay, Kenya. Diversity, 14(8), 646. [CrossRef]
- Githaiga, M. N. , Frouws, A. M., Kairo, J. G., & Huxham, M. (2019). Seagrass removal leads to rapid changes in fauna and loss of carbon. Frontiers in Ecology and Evolution, 7, 62. [CrossRef]
- Duarte, C. M. , Merino, M., Agawin, N. S., Uri, J., Fortes, M. D., Gallegos, M. E.,... & Hemminga, M. A. (1998). Root production and belowground seagrass biomass. Marine Ecology Progress Series, 171, 97-108. [CrossRef]
- Ochieng, C. A. , & Erftemeijer, P. L. (1999). Accumulation of seagrass beach cast along the Kenyan coast: a quantitative assessment. Aquatic botany, 65(1-4), 221-238. [CrossRef]
- FAO. (1995). Forest resources assessment 1990. https://agris.fao.org/search/en/providers/122621/records/647228a469d6cbfdd4a36133.
- Hiraishi, T. , Krug, T., Tanabe, K., Srivastava, N., Baasansuren, J., Fukuda, M., & Troxler, T. G. (2014). 2013 supplement to the 2006 IPCC guidelines for national greenhouse gas inventories: Wetlands. IPCC, Switzerland. FAO. Available at: https://www.ipcc.ch/publication/2013-supplement-to-the-2006-ipcc-guidelines-for-national-greenhouse-gas-inventories-wetlands/.
- Fourqurean, J. W. , Duarte, C. M., Kennedy, H., Marbà, N., Holmer, M., Mateo, M. A.,... & Serrano, O. (2012). Seagrass ecosystems as a globally significant carbon stock. Nature Geoscience, 5(7), 505-509. [CrossRef]
- IPCC (2014). 2013 supplement to the 2006 IPCC guidelines for national greenhouse gas inventories: Wetlands. IPCC, Switzerland. Available at: https://www.ipcc.ch/publication/2013-supplement-to-the-2006-ipcc-guidelines-for-national-greenhouse-gas-inventories-wetlands/.
- Adame, M. F. , Connolly, R. M., Turschwell, M. P., Lovelock, C. E., Fatoyinbo, T., Lagomasino, D.,... & Brown, C. J. (2021). Future carbon emissions from global mangrove forest loss. Global change biology, 27(12), 2856-2866. [CrossRef]
- Hamilton, S. E. , & Friess, D. A. (2018). Global carbon stocks and potential emissions due to mangrove deforestation from 2000 to 2012. Nature Climate Change, 8(3), 240-244. [CrossRef]
- GoK (2015). Coral Reef and Seagrass Ecosystems Management Strategy 2015-2019. Kenya Wildlife Service. https://reefresilience.org/wp-content/uploads/Kenya-National-Coral-Reef-Restoration-Protocol.pdf.
- Murray, B. C. , Pendleton, L., Jenkins, W. A., & Sifleet, S. (2011). Green payments for blue carbon: economic incentives for protecting threatened coastal habitats. https://www.forest-trends.org/publications/green-payments-for-blue-carbon/.
- FAO. (2022). FRA 2020 Remote Sensing Survey. FAO Forestry Paper No. 186. Rome. [CrossRef]
- Bosire, J. O. , Mangora, M. M., Bandeira, S. O., Rajkaran, A., Ratsimbazafy, R., Appadoo, C., & Kairo, J. G. (2016). Mangroves of the Western Indian Ocean: status and management. Available at: https://www.wiomsa.org/publications/mangroves-of-the-western-indian-ocean-status-and-management/.
- Hamza, A. J. , Esteves, L. S., Cvitanovic, M., & Kairo, J. (2020). Past and present utilization of mangrove resources in Eastern Africa and drivers of change. Journal of Coastal Research, 95(SI), 39-44. [CrossRef]
- State of the Blue Carbon Market (2024). Washington DC: Forest Trends Association. Available at: https://www.forest-trends.org/publications/state-of-the-blue-carbon-market/.
- Alongi, D. M. (2020). Global significance of mangrove blue carbon in climate change mitigation. Sci, 2(3), 67. [CrossRef]
- Bunting, P. , Rosenqvist, A., Hilarides, L., Lucas, R. M., & Thomas, N. (2022). Global mangrove watch: Updated 2010 mangrove forest extent (v2. 5). Remote Sensing, 14(4), 1034. [CrossRef]
- Siikamäki, J. , Sanchirico, J. N., & Jardine, S. L. (2012). Global economic potential for reducing carbon dioxide emissions from mangrove loss. Proceedings of the National Academy of Sciences, 109(36), 14369-14374. [CrossRef]
- Rodríguez-Veiga, P. , Carreiras, J., Smallman, T. L., Exbrayat, J. F., Ndambiri, J., Mutwiri, F.,... & Balzter, H. (2020). Carbon stocks and fluxes in Kenyan forests and wooded grasslands derived from earth observation and model-data fusion. Remote Sensing, 12(15), 2380. [CrossRef]
Figure 1.
Map showing the location of the study areas.
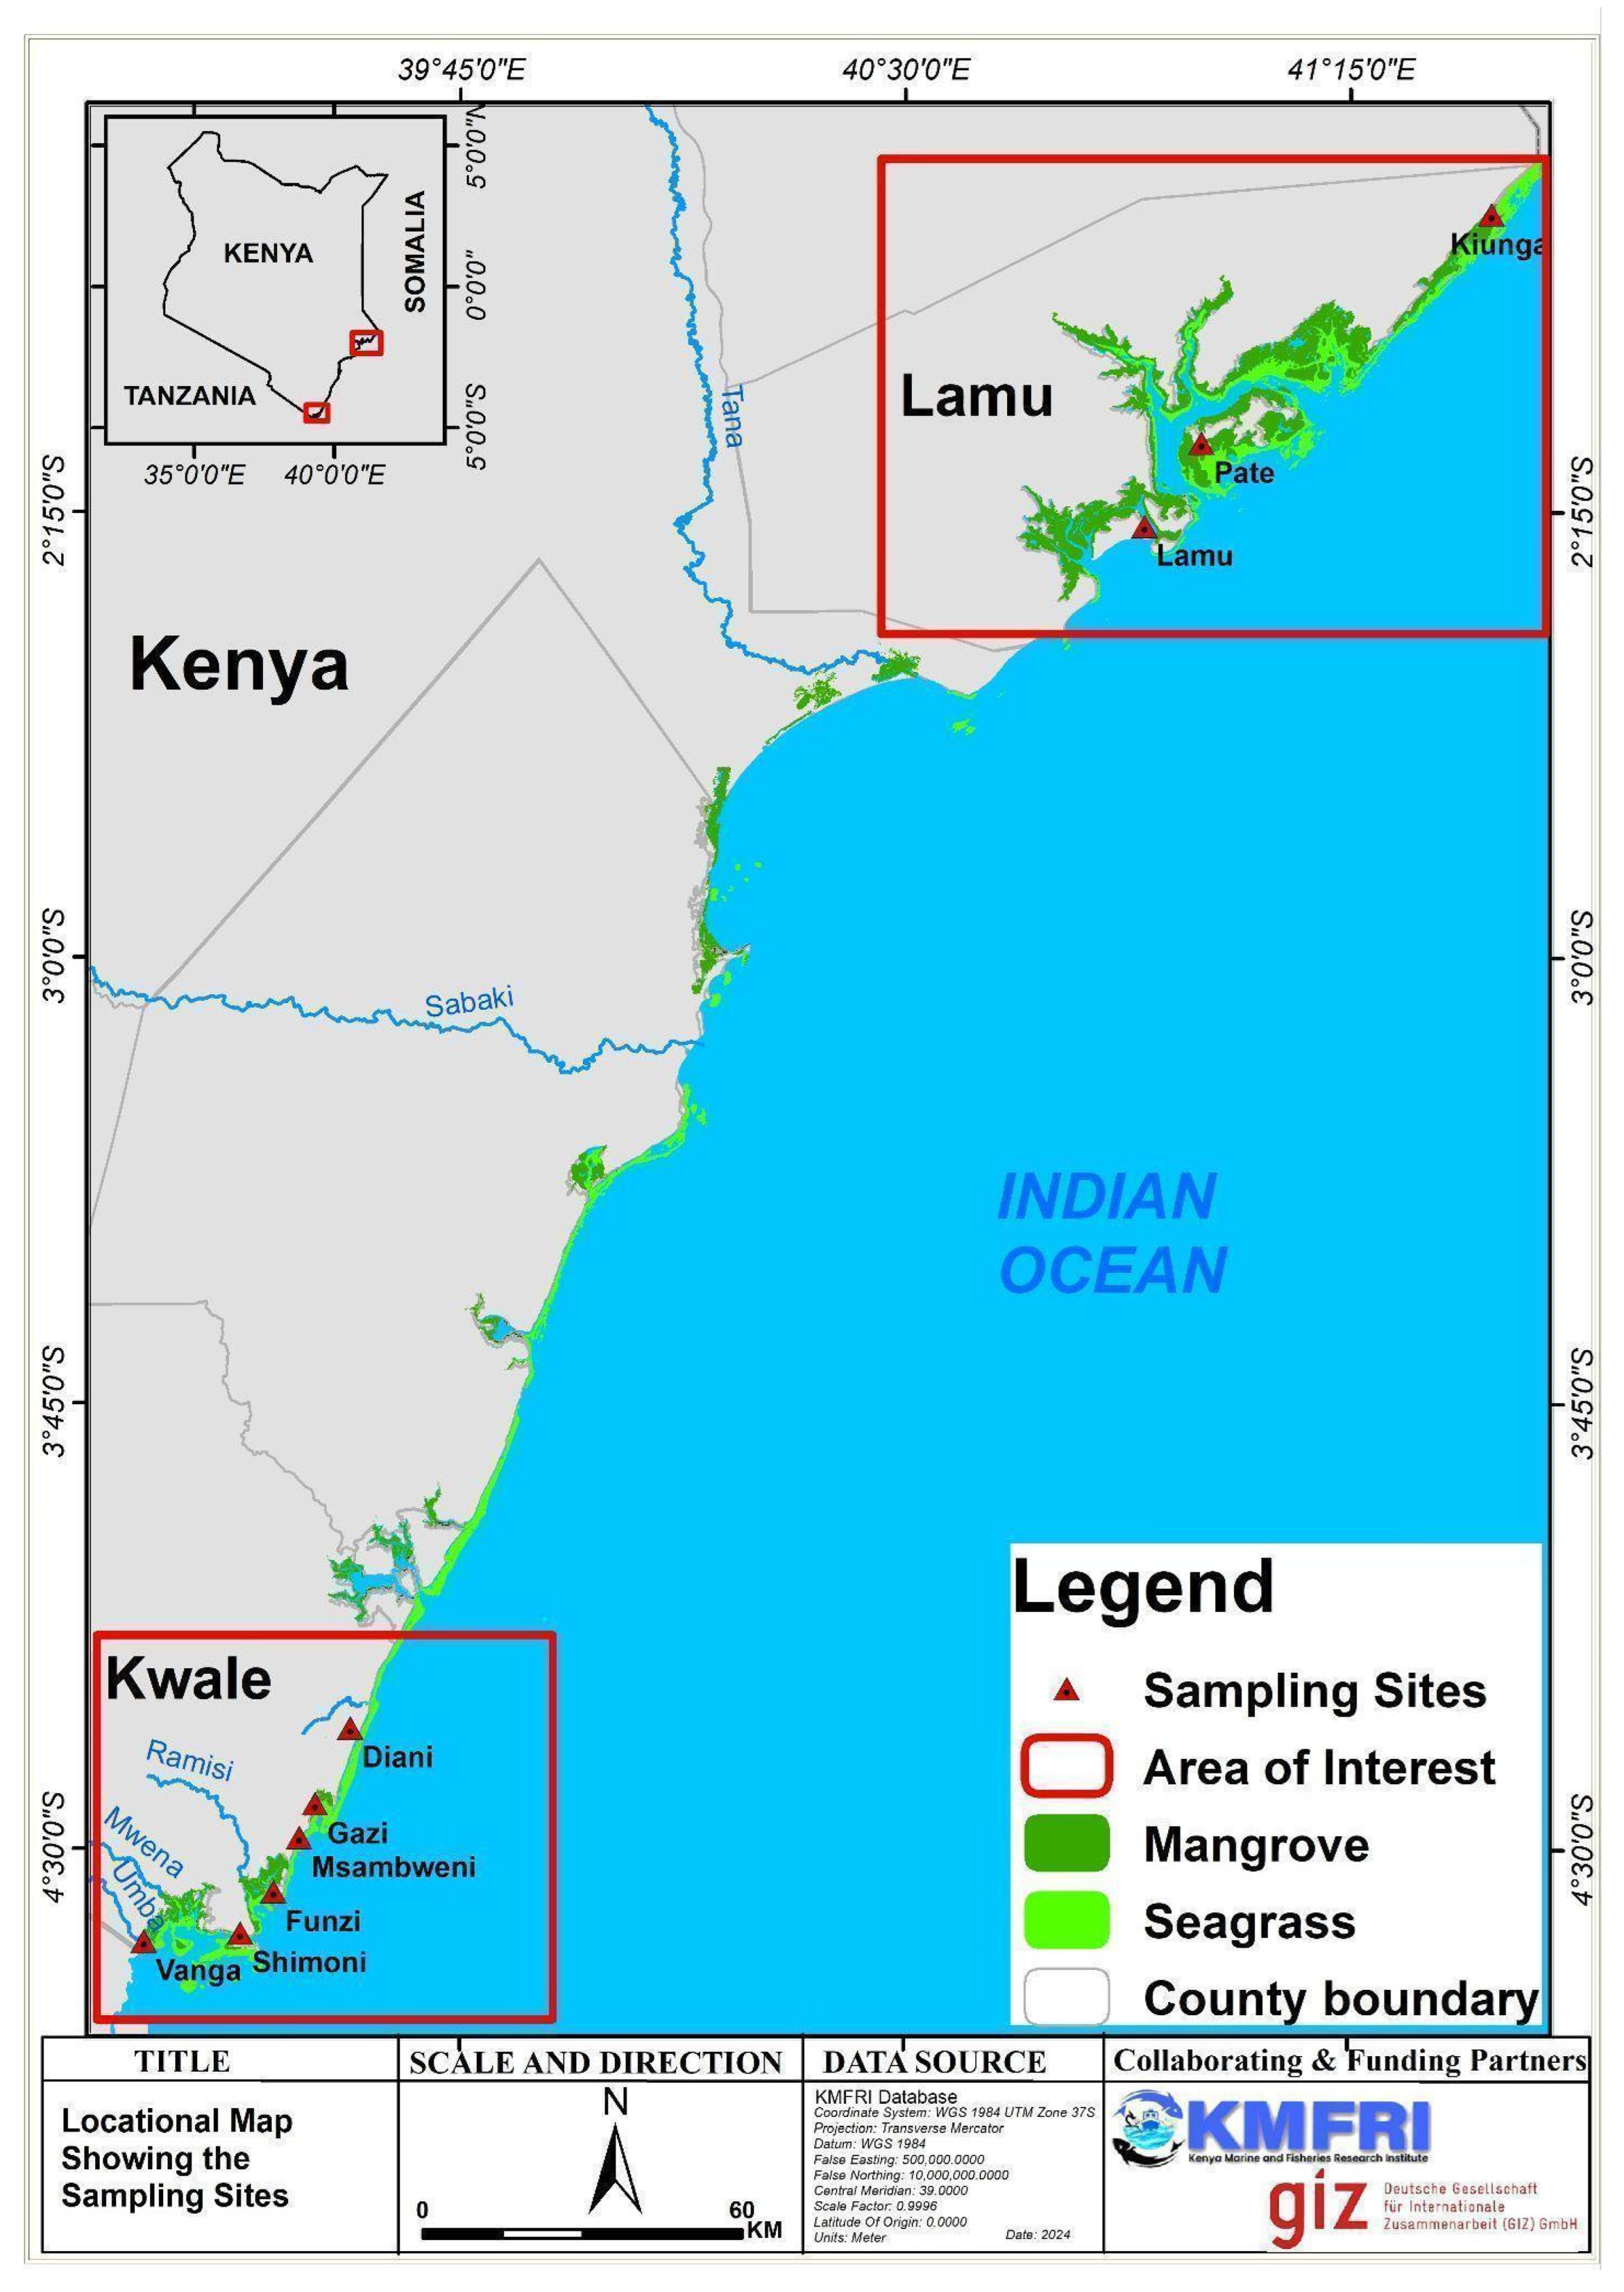
Figure 2.
Hotspot areas of mangrove changes (1990 and 2020) in (i) Lamu and (ii) Kwale Counties.
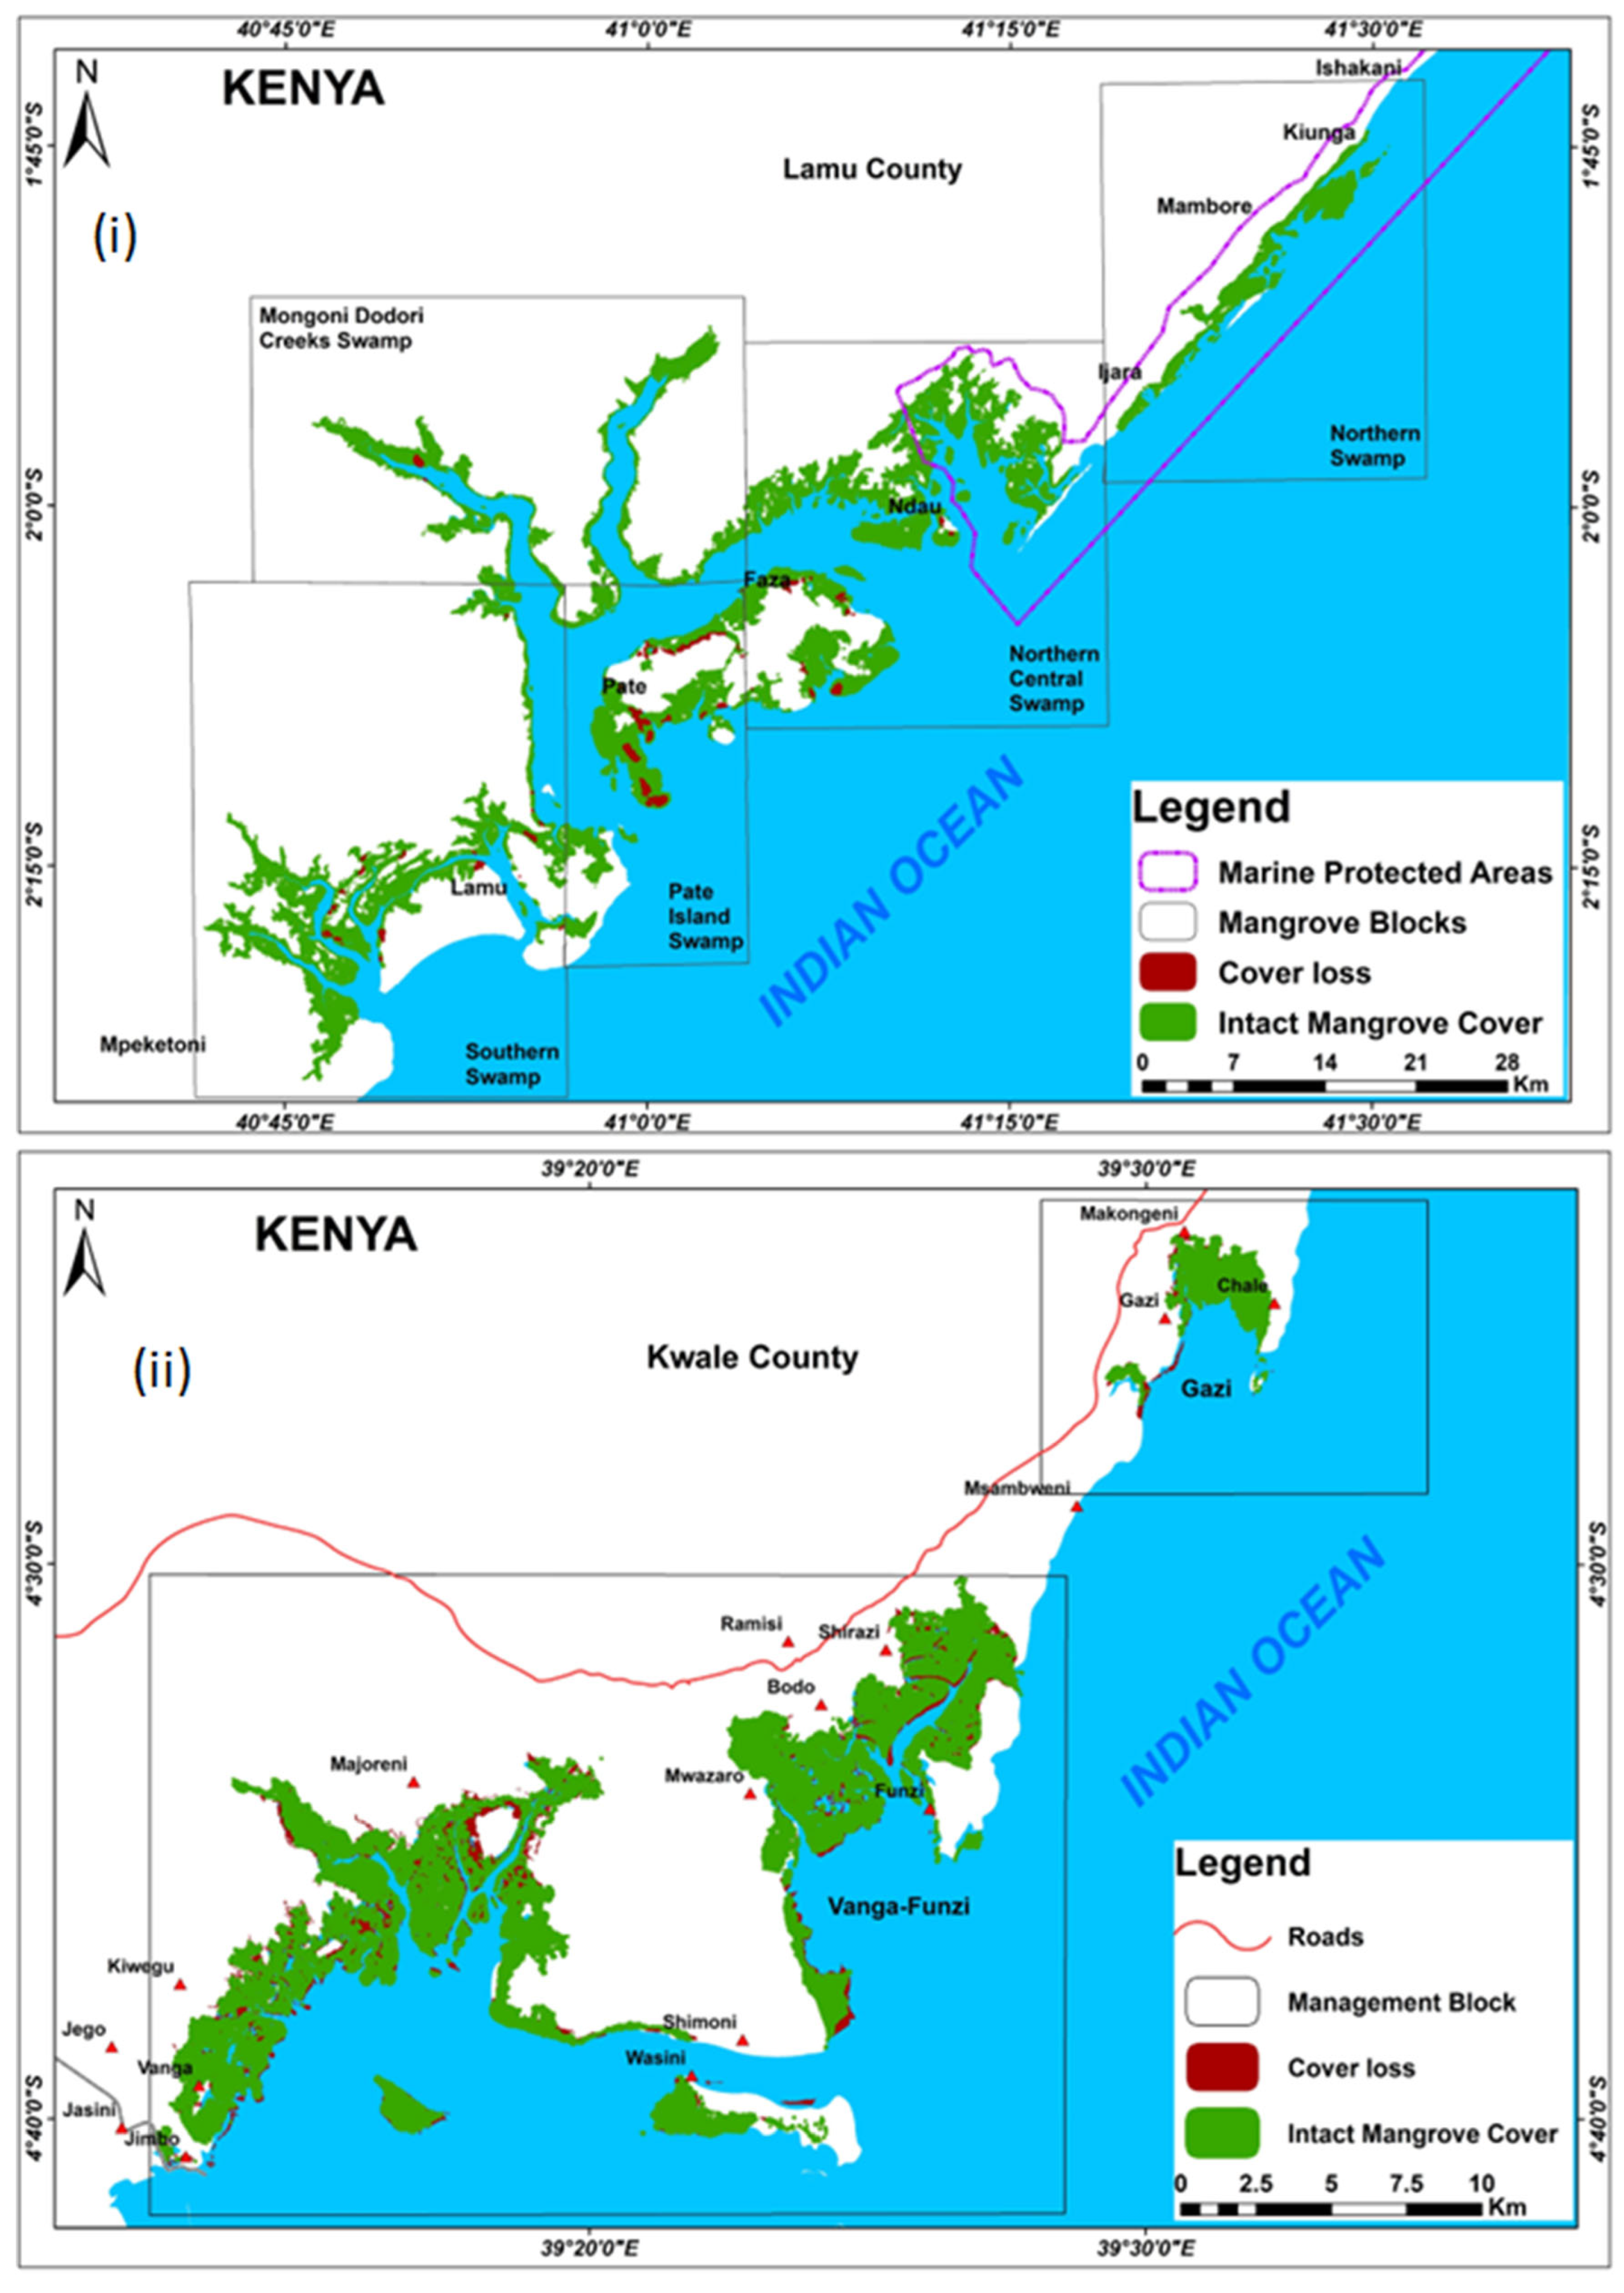
Figure 3.
Hotspot areas of seagrass changes (1986 and 2020) in (i) Lamu and (ii) Kwale Counties.
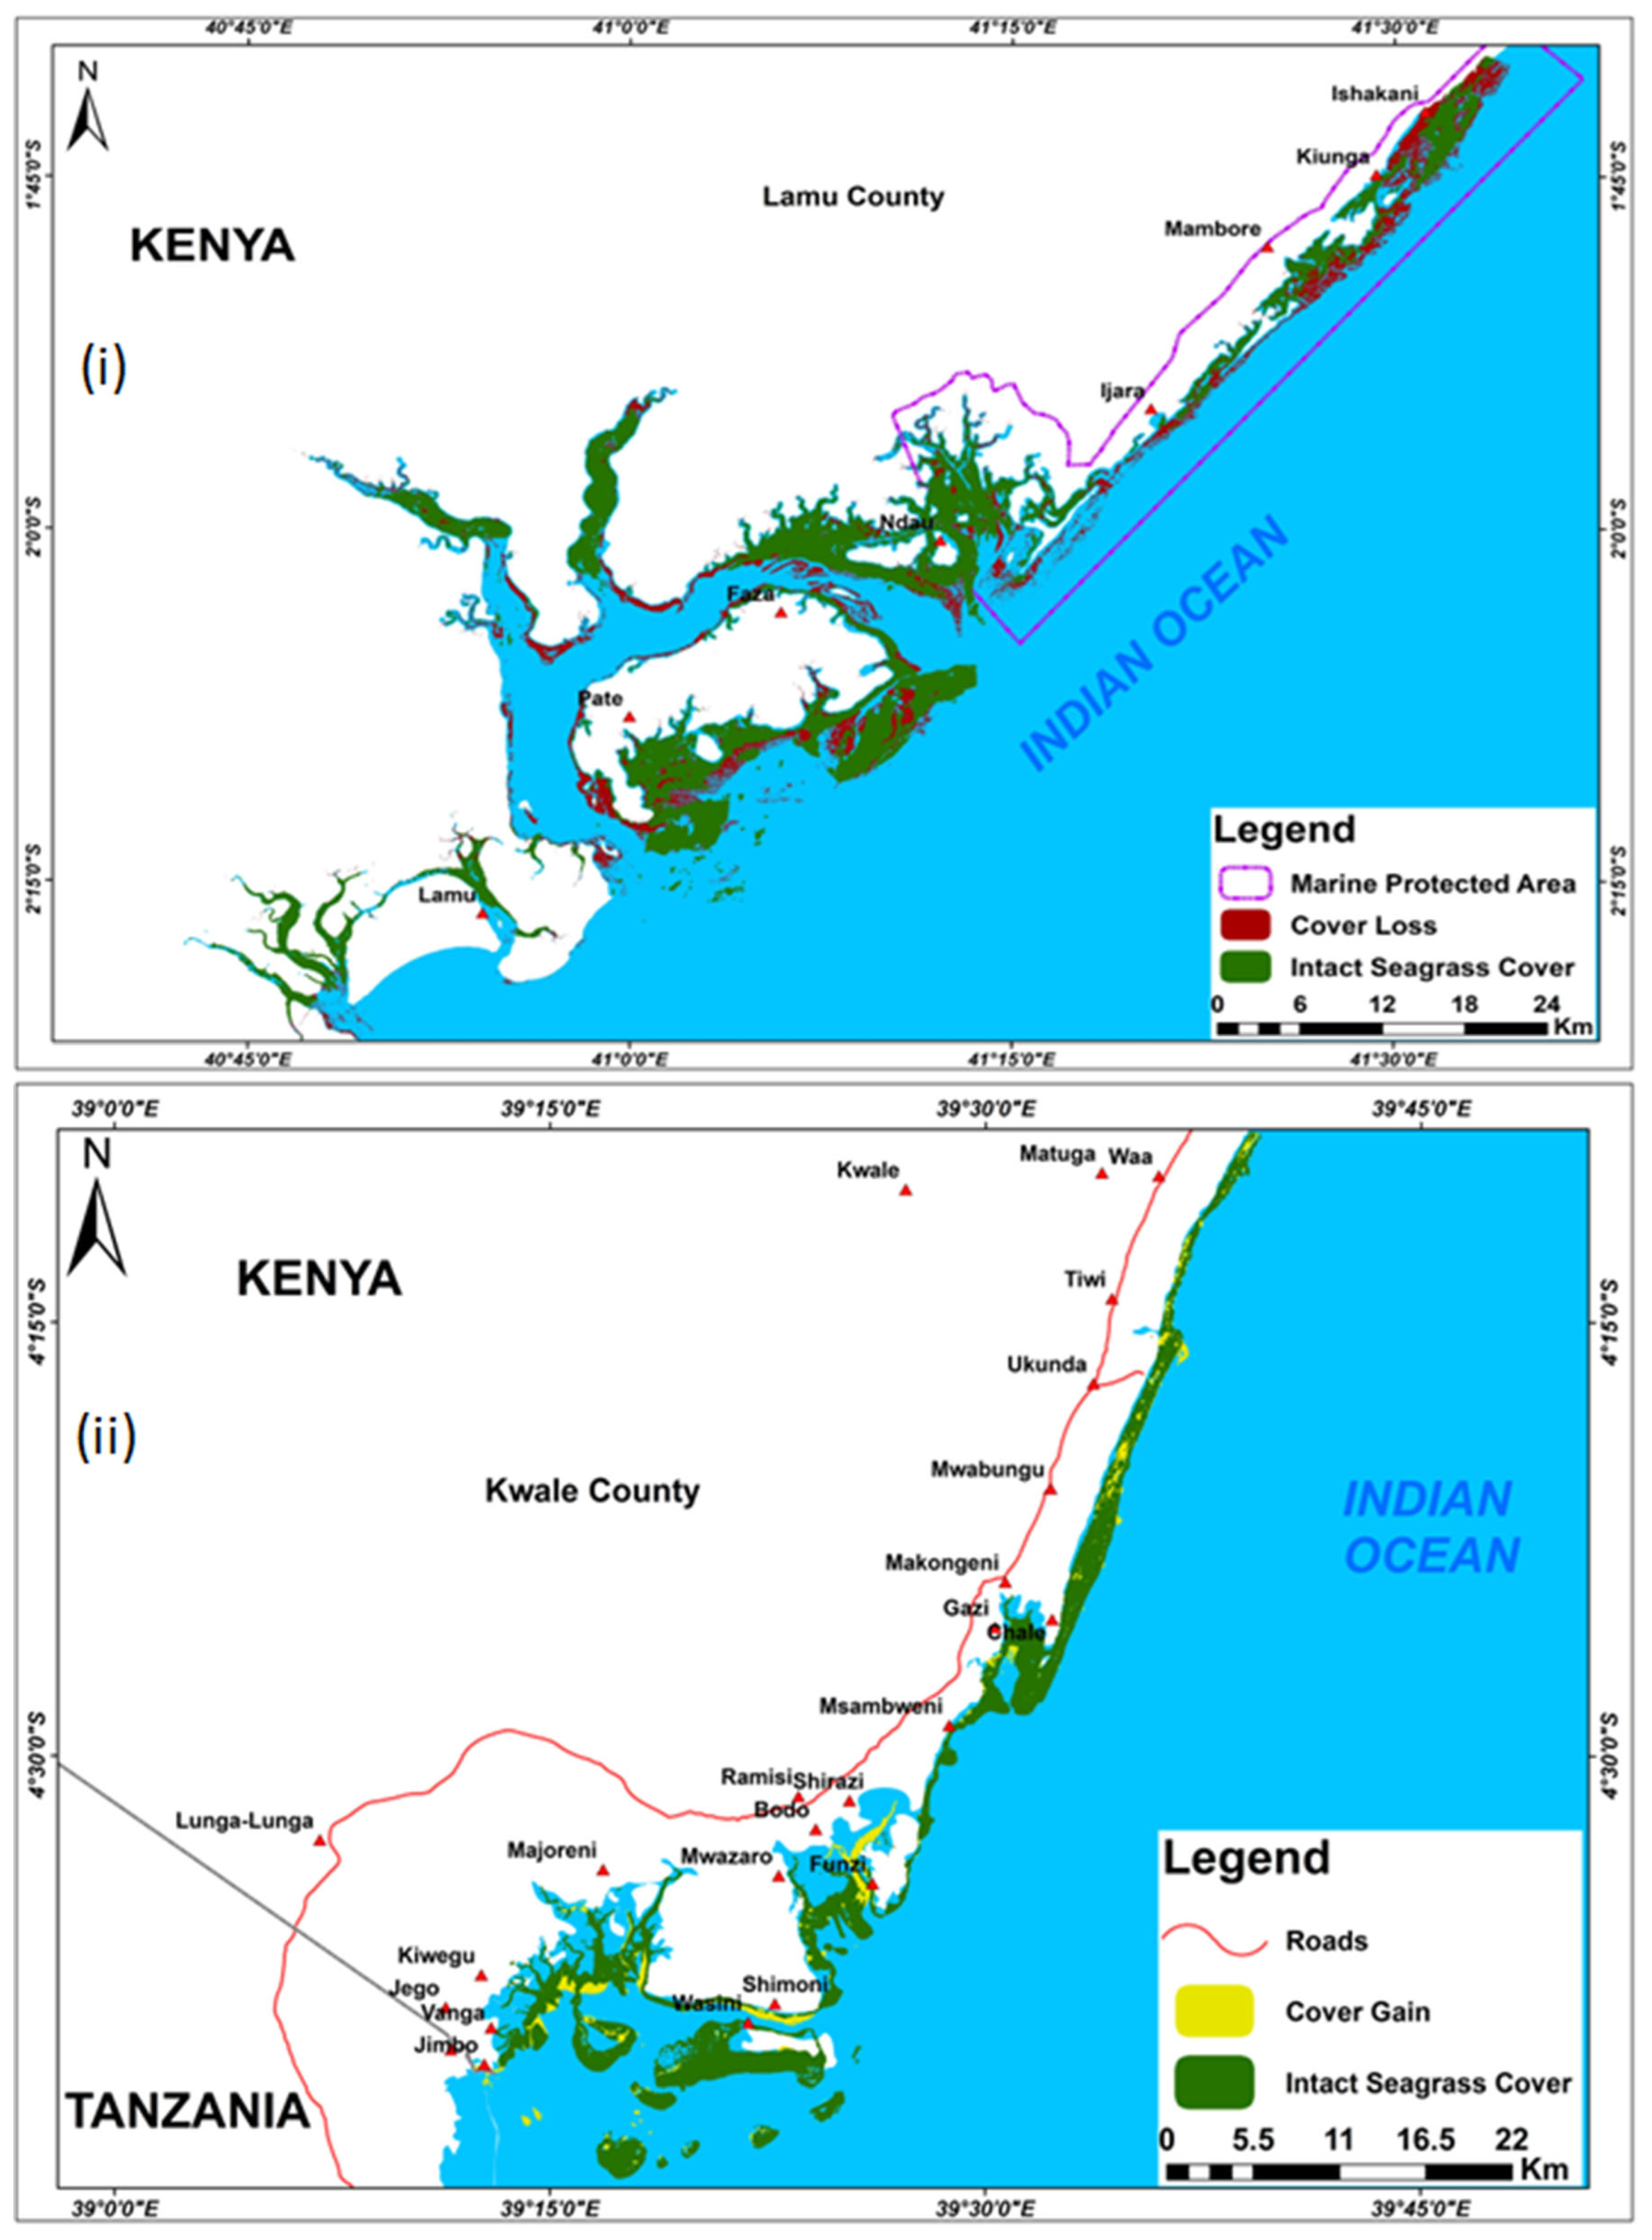
Figure 4.
Above-ground biomass distribution in Lamu and Kwale Counties in 2024.
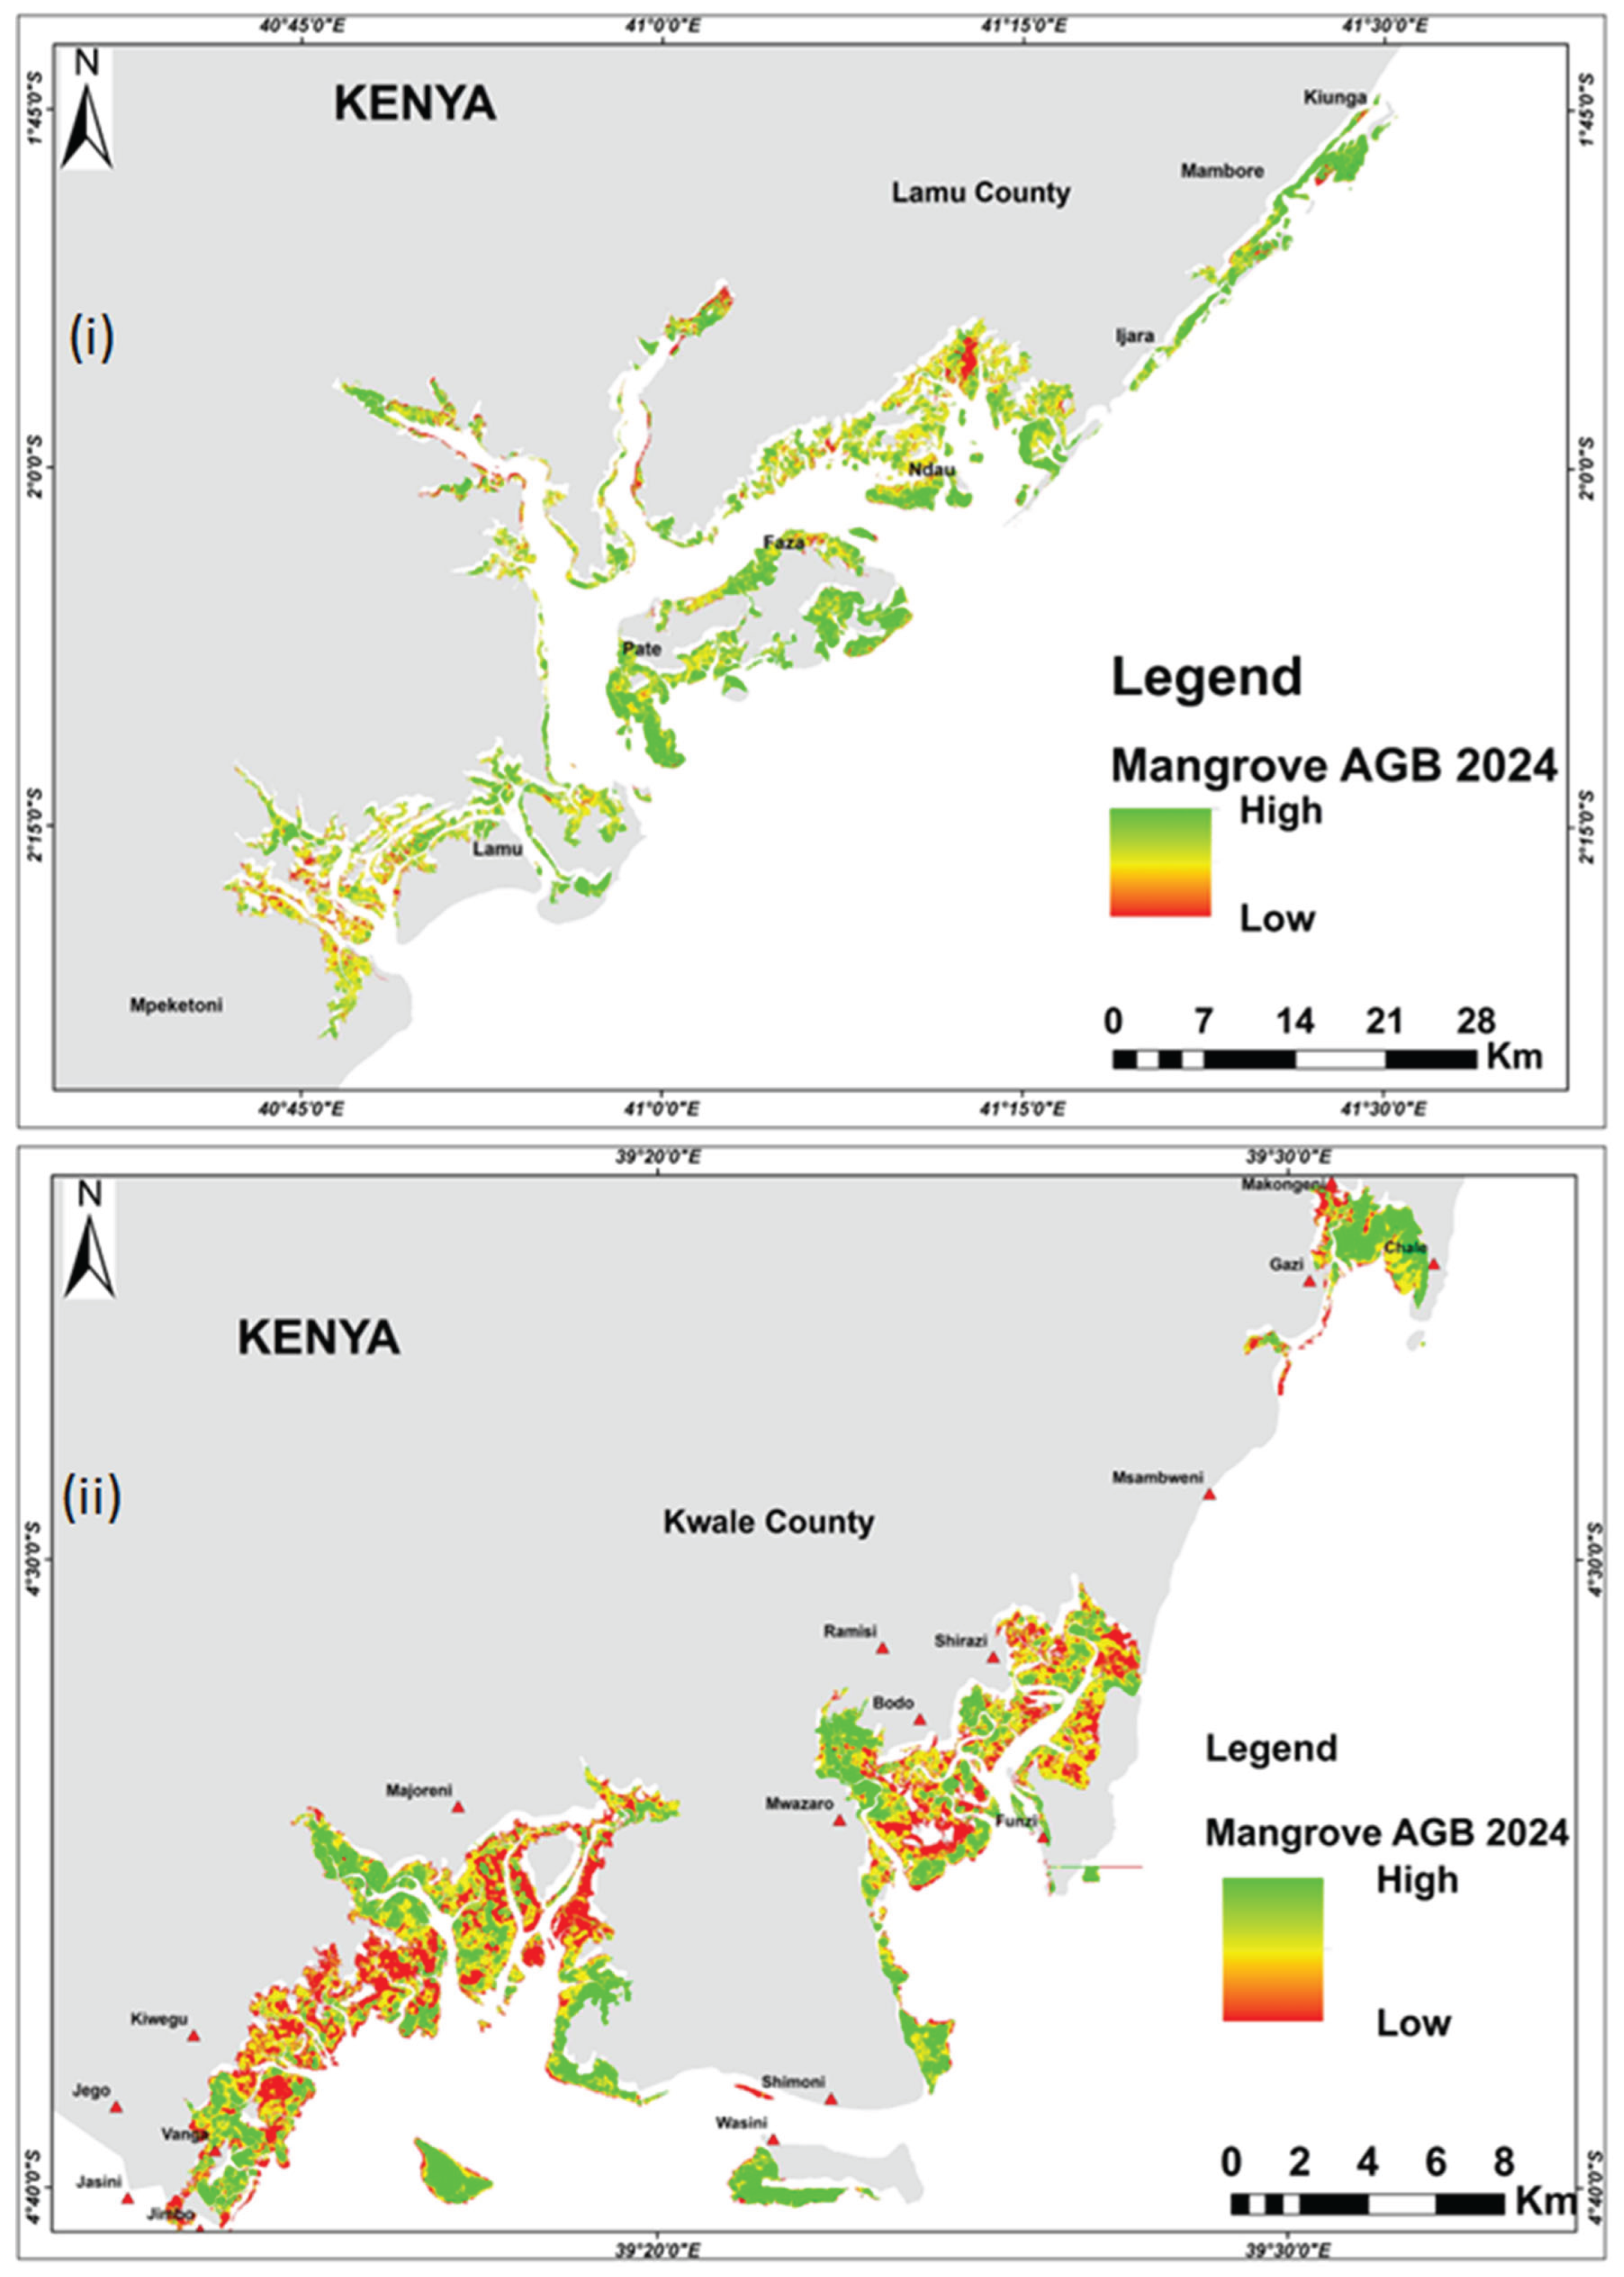

Table 1.
Cover and cover change analysis of blue carbon ecosystems in Kwale and Lamu Counties in Kenya.
Table 1.
Cover and cover change analysis of blue carbon ecosystems in Kwale and Lamu Counties in Kenya.
| Ecosystem | Area | Cover (ha) | Rate (CAGR) (% yr-1) | |||
| Mangroves | 1990 | 2000 | 2010 | 2020 | ||
| Country level | 63,167 | 44,670 | 53,886 | 54,304 | -0.5 | |
| Lamu County | 37,417 | 25,970 | 36,940 | 35,678 | -0.16 | |
| Kwale County | 8,371 | 6,897 | 6,344 | 7,220 | -0.49 | |
| Seagrasses | 1986 | 2000 | 2016 | 2020 | ||
| Country level | 42,170 | 40,278 | 31,363 | 39,693 | -0.18 | |
| Lamu County | 26,468 | 21,329 | 18,653 | 21,067 | -0.67 | |
| Kwale County | 8,827 | 9,669 | 7,506 | 9,920 | +0.34 | |
Table 2.
Total ecosystem C stocks of BCEs in Kwale and Lamu Counties in Kenya.
| Ecosystem | County |
Above - ground biomass Carbon (Mg C ha-1) a |
Below - ground biomass Carbon (Mg C ha-1) b |
Total biomass carbon (Mg C ha-1) (a+b) |
Soil C (Mg C ha-1) c |
Total Ecosystem Carbon (Mg C ha-1) ((a+b)+c) |
Area (ha)d | Total Carbon Stock (Mg C) ((a+b)+c)*d |
| Mangroves | Kwale | 64.94 | 24.3 | 89.24 | 437.10 | 526.34 | 7,220 | 3,800,174.80 |
| Lamu | 127.85 | 38.72 | 166.57 | 393.66 | 560.23 | 35,678 | 19,987,885.94 | |
| Mean/total | 96.40 | 31.51 | 127.38 | 415.38 | 543.29 | 21,449 | 23,788,060.74 | |
| Seagrasses | Kwale | 0.5 | 5.1 | 5.6 | 214.69 | 220.29 | 9,920 | 2,185,276.8 |
| Lamu | 0.65 | 5.9 | 6.55 | 165.1 | 171.65 | 21,067 | 3,616,150.55 | |
| Mean/toal | 0.58 | 5.50 | 6.08 | 189.90 | 195.97 | 15,493.5 | 5,801,427.35 |
Table 3.
Mangroves and seagrass carbon dynamics in Kwale and Lamu counties over a 30-year projection (2020 - 2050).
Table 3.
Mangroves and seagrass carbon dynamics in Kwale and Lamu counties over a 30-year projection (2020 - 2050).
| Mangroves: | ||||||||
| County | Component | 2020 | 2050 | |||||
| Baseline | BAU | Interventions | ||||||
| Kwale | Cover (ha) | 7,220 | 6,224.98 | 7,687.85 | ||||
| Total Ecosystem C storage (Million tCO2e) | 13.22 | 11.4 | 14.08 | |||||
| Sequestered C (Million tCO2e) | 0.12 | 3.6 | 3.86 | |||||
| C emissions (Million tCO2e) | 0.13 | 4.43 | 2.48 | |||||
| Net C (Million tCO2e) | -0.01 | -0.83 | 1.38 | |||||
| Net C (tCO2e/ha/yr) | -4.44 | 5.98 | ||||||
| Net value (US$ million) | 0 | -16.6 | 27.6 | |||||
| Lamu | Cover (ha) | 35,678.00 | 34,018.54 | 37,400.84 | ||||
| Total Ecosystem C storage (Million tCO2e) | 73.35 | 69.94 | 76.90 | |||||
| Sequestered C (Million tCO2e) | 0.62 | 18.69 | 19.52 | |||||
| C emissions (Million tCO2e) | 0.5 | 18.96 | 12.14 | |||||
| Net C (Million tCO2e) | 0.02 | -0.28 | 7.38 | |||||
| Net C (tCO2e/ha/yr) | -0.27 | 6.58 | ||||||
| Net value (US$ million) | 0 | -5.6 | 147.6 | |||||
| Seagrass: | ||||||||
| County | Component | 2020 | 2050 | |||||
| Baseline | BAU | Interventions | ||||||
| Kwale | Cover (ha) | 9,920.00 | 10,861.56 | 10,864.36 | ||||
| Total Ecosystem C storage (Million tCO2e) | 8.04 | 8.81 | 8.81 | |||||
| Sequestered C (Million tCO2e) | 0.01 | 0.64 | 0.64 | |||||
| C emissions (Million tCO2e) | 0.05 | 0.51 | 0.51 | |||||
| Net C (Million tCO2e) | -0.05 | 0.13 | 0.13 | |||||
| Net value (US$ million) | 0 | 2.6 | 2.6 | |||||
| Lamu | Cover (ha) | 21,067.00 | 17,212.76 | 20,784.60 | ||||
| Total Ecosystem C storage (Million tCO2e) | 17.08 | 13.96 | 16.85 | |||||
| Sequestered C (Million tCO2e) | 0.04 | 1.17 | 1.28 | |||||
| C emissions (Million tCO2e) | 0.11 | 6.38 | 1.26 | |||||
| Net C (Million tCO2e) | -0.07 | -5.21 | 0.02 | |||||
| Net value (US$ million) | -0.7 | -104.2 | 0.4 | |||||
BAU = business as usual scenarios, Interventions = with project interventions. Sequestered C = cumulative carbon sequestration over 30 years, and C emissions = cumulative carbon emissions over 30 years.
Table 4.
Carbon credit investment opportunity and projected income from Blue Carbon Ecosystems in Kwale and Lamu Counties, Kenya.
Table 4.
Carbon credit investment opportunity and projected income from Blue Carbon Ecosystems in Kwale and Lamu Counties, Kenya.
| Investment opportunity | County |
Intervention area (ha)a |
Carbon sequestration (tCO₂e ha-1yr-1)b |
Potential returns per year (US$ yr-1) @$20/tCO₂ec | Potential returns between 2020 and 2050 (US$)(a x b x c x 30) | Risks |
| Mangrove carbon credits | Kwale | 2,661 | 17.3a | 920,706 | 27,621,180; **24,859,062 | Market volatility, regulatory changes, land use changes, etc |
| Lamu | 7,714 | 17.3a | 2,669,044 | 80,071,320; **72,064,188 | ||
| Seagrass carbon credits* | Lamu | 2,700.5 | 4d | 216,040 | 6,481,200; **5,833,080 | |
| Total | 114,173,700**102,756,330 | |||||
| a = IPCC (2014), b= Murray et al. (2011). 1 Carbon credit = 1 CO2e. *Only data on Lamu is used here as this is where loss on cover was observed. **Adjusted returns after risk deduction (% buffer): Verified Carbon Standard (VCS) provides a Carbon buffer percentage of 10-20% to cover unforeseen losses and ensure credit integrity. In the present study, we used a 10% buffer. | ||||||
Table 5.
Co-benefits of Kenya’s mangroves.
| Mangrove co-benefit | Value (US$ ha-1 yr-1) |
| Fisheries | 6,020 |
| Shoreline protection | 4,212 |
| Research and education | 1,520 |
| Aesthetic value | 1,037 |
| Biodiversity | 710 |
| Tourism | 205 |
(Modified from TNC, 2024).
Table 6.
Comparison of Kwale and Lamu blue carbon attributes with national, Western Indian Ocean (WIO) region, global values, and tropical forests.
Table 6.
Comparison of Kwale and Lamu blue carbon attributes with national, Western Indian Ocean (WIO) region, global values, and tropical forests.
| Component | Mangroves | Seagrasses | Tropical forests | ||||||||||
| Kwale | Lamu | Kenya | WIOa,b | Globalb, c | Kwale | Lamu | Kenya | Globalc, d | Kenyae | Globale | |||
| This study | This study | Lang’at et al., in press | GMWa | This study | This study | Lang’at et al., in press | |||||||
|
Cover change (% yr-1) |
-0.49 | -0.16 | -0.57 | -0.1 | -0.14 | -0.14 | +0.34 | -0.67 | -0.26 | -1.5 | -0.43 | ||
| Vegetation C (tC ha-1) | 89.24 | 166.57 | 108.69 | - | 92.7 | 147.49 | 5.6 | 6.55 | 6.25 | 1.84 | 36.69 | 54 | |
| Soil C(tC ha-1) | 437.10 | 393.66 | 390.21 | - | 335.7 | 20.00 | 214.69 | 165.1 | 214.69 | 70 | - | 55 | |
| Total C(tC ha-1) | 526.34 | 560.23 | 498.90 | - | 28.4 | 467.49 | 220.29 | 171.65 | 20.94 | 71.84 | - | 109 | |
| Sources: a = Erftemeijer et al., 2022, b = Bunting et al., 2022, c = Siikamäki et al., 2012, d = Fourqurean et al., 2012, & e = Rodríguez-Veiga et al., 2020. GMW = Global Mangrove Watch | |||||||||||||
Disclaimer/Publisher’s Note: The statements, opinions and data contained in all publications are solely those of the individual author(s) and contributor(s) and not of MDPI and/or the editor(s). MDPI and/or the editor(s) disclaim responsibility for any injury to people or property resulting from any ideas, methods, instructions or products referred to in the content. |
© 2025 by the authors. Licensee MDPI, Basel, Switzerland. This article is an open access article distributed under the terms and conditions of the Creative Commons Attribution (CC BY) license (http://creativecommons.org/licenses/by/4.0/).
Copyright: This open access article is published under a Creative Commons CC BY 4.0 license, which permit the free download, distribution, and reuse, provided that the author and preprint are cited in any reuse.


