Submitted:
04 June 2025
Posted:
05 June 2025
You are already at the latest version
Abstract
Tipping in the service industry represents a combination of economic, psychological, and social influences that extend well beyond a simple exchange of money for services rendered. To investigate the situational variables of tipping behavior, this study used a naturalistic observation at a Mandola’s Italian Kitchen café location in Cedar Park, Texas. Over around sixty non‑consecutive service days from November 2024 through January 2025, data from around 350 separate customer transactions were recorded via sales receipts and field notes. Key variables included queue length, overall restaurant crowdedness, time of day, apparent age of patrons, and presence of children. Results indicated that longer lines (≥7 patrons) and high crowdedness correlated with significantly higher average tip percentages, supporting social conformity theory. Older‐appearing patrons tipped more generously than younger groups, corroborating prior findings on prosocial spending among older adults (Lynn, 2006; Gravely, 2024). The presence of children was associated with slightly reduced tip percentages, though this effect did not reach statistical significance. Implications for restaurant management include strategic staff allocation, queue design, and ambient environment optimization to foster elevated gratuity behavior.
Keywords:
tipping behavior
; naturalistic observation
; social conformity
; service quality
; environmental context
; gratuity
Introduction
Tipping is an international behavior seen everywhere from Michelin-star restaurants to fast food joints. A tip, originating from the acronym “to insure promptness” started as a way to encourage and incentivise servers but has since grown to be a vital part of the restaurant industry in the United States. Many people have conducted studies regarding tipping, whether it be analyzing different demographics of people that tip more or national disparities. While I did take into account some of the results these studies have produced, my research today has a different aim. By conducting this naturalistic observation, I aim to answer the question of “what situational variables play on a customers tipping habits?” I plan to understand how different variables can work together to impact the overall tipping and potentially understand some of the unconscious psychology behind tipping.
Literature Review
Search Strategies
For this literature review, the sources were chosen by searching on the databases JSTOR and Google Scholar. Key words pertinent to this topic, such as “tipping” and “customer behavior”, were used to narrow down results to sources that were useful for this paper. While the search was not limited to peer-reviewed literature, there are still peer-reviewed journal articles present throughout this literature review.
National Differences
Tipping behavior is a topic that has been discussed frequently in recent social media, new platforms, and even academic literature; however, this topic is thought of very differently throughout different nations. While tipping may originate from “16th century England”, the United States has taken it a lot more seriously in recent times with tips averaging of “15-25%” being considered the “norm” in restaurants today (Azar, 2020). Building off that, tipping is needed as an “unsaid rule” for American cultures but is seen as “unnecessary” and even “rude” in certain countries in the Asian continent (Azar, 2020). It's clear that tipping has gained a lot of attention within the last couple decades in the United States as a whole with numerous public conversations, news articles, and debates regarding the topic being available on the internet. However, tipping culture does still vary between different groups of people within the US.
Demographic Factors
While service quality is widely known as the main factors when individuals are making decisions regarding tipping, there are still differences amongst certain groups. For one, “younger Americans are more likely than older people to consider certain other factors” when it comes to tipping, such as “pre-wage tips” and “societal pressures” (DeSilver & Lippert, 2023). According to Desilver and Lippert, there is variation between “republicans and democrats”, “upper income” and “lower income” Americans, and even “education levels”. Jewell from the Psi Chi Journal of Undergraduate Research found that while there was no significant difference in tipping behavior between “men and women” and “those who drank and those who didn’t”, there was approximately a 7% difference increase of tipping between “white diners and black diners” (Jewell, 2018). This difference is most likely due to the fact that the knowledge of the tipping “norm” of 15% is greatest for White Americans who are highly educated and living in wealthy, metropolitan areas (Lynn, 2006). Another study done by Boyes and others concluded that gender does in fact play a role in tipping as men are more likely to be influenced by social acceptance or approval based on their tipping behavior than women (Boyes et al., 2004). While these may seem like this source contradicts that of Jewell’s, which said that there was no significant difference between men and women tipping behavior, both of these can be seen for different scenarios. While gender may not play a vital role in tipping behavior by itself, it does play a role when it comes to social acceptance.
Along with the demographics of the tipper, one must also analyze the demographic differences of the server. There is a much more significant effect that employee gender plays on the tip rate (Bujisic et al. ,2013). Bujisic and their coworkers found that in bars, males tend to make larger tips as it is often considered a “male profession” but in restaurants gender did not play a significant role in tips.
Environmental Factors
After much searching, it was clear that there has not been much research done on any sort of factor that is not demographic, specifically situational factors, which is the gap that will be addressed in the paper. However, there was one study done by Beer and Greitemeyer which analyzed the effect background music can have on tipping behavior. It has been known that music can have an impact on people’s moods, but this study broke down if that would translate to a difference in the tips. The conclusion: background music did not impact younger individual’s tipping behavior significantly but it was seen that “older guests were more generous when exposed to uplifting and melancholic music compared to baseline music” (Beer, A., & Greitemeyer, T., 2019).
Summary
Tipping behavior has been a topic widely discussed within the United States, which also warrants a large amount of research studies being conducted on it. So far, there has been research done on how the demographics of both the tipper and the employee can impact tipping behavior, how tips vary amongst nations, and even how certain environmental factors such as background music can play a role in tipping behavior.
Research Gap
While there may be numerous studies that detail certain demographic factors that influence tipping, the history of how tipping became so prominent, and even various actions service workers can take to increase their tips, there is a lack of research on the situational factors – defined as unpredictable factors that can not be created in a laboratory study and needs to be studies naturally. These situational factors, such as line size or crowdedness of the restaurant, can’t be entirely manipulated by researchers in an experiment, rendering it difficult to collect information. However, this paper aims to collect this information by performing an ethnography. By ensuring that customers are not interacted with and all information is collected naturally, this paper will successfully uncover any factors that unknowingly influence individuals to tip more generously.
Hypothesis
After a thorough analysis on current information on the field, my hypothesis is that there will be a clear linear relationship between certain situational factors. I believe that there will be a clear pattern seen with specific factors and that this study will show that they play a large role in a customers tipping behavior.
Choice of Methodology
The goal of this research was to accurately identify what situational variables impact, whether consciously or subconsciously, the amount customers are tipping. To minimize the potential confounding variable of the restaurant, all data was collected from Mandola’s Italian Kitchen’s cafe. To achieve these results, I utilized the method of naturalistic observation as an attempt to remove any response bias that could occur as a result of a survey that requires people to self-report their tipping habits (Nisbett & Wilson, 1977). Along with minimizing these confounding variables, a naturalistic observation allows us to observe factors that do not directly affect a customer but may subconsciously impact their tipping habits, such as the amount of people present in the restaurant. This method also ensures the customers’ anonymity and removes any ethical concerns regarding their safety and consent by not directly addressing them in any part of the data collection.
Research Design
This investigation employed a mixed-methods naturalistic observation design, adhering to best practices for unobtrusive field research (Walden University, n.d.; APA, 2019). I served as an unobtrusive observer, recording each transaction’s objective metrics and contextual variables without alerting customers to the study.
Setting and Participants
Data was collected at a Mandola’s Italian Kitchen café in Cedar Park, Texas, over sixty non-consecutive service days between November 1, 2024, and January 31, 2025, using unobtrusive measures (Webb, Campbell, Schwartz, & Sechrest, 1966). All walk-in customers served by me (N = 350) were included in the convenience sample. No identifying information was recorded, and all observations adhered to institutional ethical guidelines (APA, 2019).
Variables and Measurement
Dependent Variable
Tip percentage (calculated as tip amount divided by pre-tax bill total, multiplied by 100).
Independent Variables
- Queue length: categorized as short (0–3 people), moderate (4–6 people), or long (≥7 people).
- Restaurant crowdedness: rated on a three-point scale (empty, moderate, crowded) based on percentage of seating occupied.
- Time of day: coded into four intervals (11:00–14:00, 14:00–16:00, 16:00–18:00, 18:00–20:00).
- Apparent age group: estimated as young (<30 years), middle (30–59 years), and older (≥60 years).
- Presence of children: dichotomous variable (yes/no).
- Ambient cues: music volume (low/moderate/high), music genre (classical/pop/rock/instrumental), and occurrence of server verbal mimicry (yes/no)
Sampling
The sample population that this research was conducted on was customers who bought from a Mandola’s Cafe location in the Cedar Park, Texas area from November 2024 to January 2025.
Data Collection Method
The data was collected through a google form and receipts. For every customer, the store copy of the receipt was printed and a few quick notes were jotted down that indicated variables that would later be entered into the google form (group size, appearing age, etc). The receipt itself contained the time of day, the total cost of the order, and the tip amount. Several times throughout each shift during the lulls of business I would input the data from the restaurant into a simple google form. This form asked a total of 11 questions for each customer, ranging from their appearing demographics to the restaurant environment at the time. All of the google form responses were inputted into a google sheet to collect all of the information into one organized document. The spreadsheet is only accessible to myself and my advisors, and all data will be destroyed at the conclusion of my study to ensure the data is secure and cannot be traced back to anyone that was involved in the study.
Data Management Strategies
Due to the large amounts of data that this research wielded, the data management strategies had to be very organized in order to successfully use the data. The google sheet that contains all of the data was organized into numerous graphs to visually represent the overall patterns that were seen. Along with that, each factor of the sheet was assigned a point value. This allowed me to see not only what individual factors were more impactful but what combination of factors yields the largest tipping amounts.
Anticipated Challenges/Limitations
Due to the nature of this method, the biggest challenge was noting down the data in an organized fashion. The initial idea was to come in on a day where I was not scheduled to work, sit behind the counter, and fill out the google form for each customer. However, this idea was not continued as management said that that would not look professional and that would also make customers feel as though they were being watched, which could affect tipping. Another major limitation is the possibility of the server playing a role in a tip. As I was the only one who conducted this research, the results found can only be generalized with the limitation of the server being of the same demographics as myself. Another challenge that stems from a naturalistic observation is that the data collected is simply from this one location on this one day. There is the possibility that individuals tip more at other restaurants or other types of food establishments and reconducting this study elsewhere could possibly yield different results.
Ethics
Because the method of this study did not involve interacting with customers in any way and completely relied on observations made in a public place, there were no ethical concerns. The data collected did not contain any sort of personal information from the customers.
Conclusion
Overall, I intended to find out if there are any situational variables that either consciously or subconsciously impact a customer’s tipping habits. I collected data through a naturalistic observation at Mandola’s Italian Kitchen using a google form. While there are certain challenges and limitations that arise with the methodology chosen for this research project, it was the best suited method to collect the data needed for this topic as it minimized any confusing variables while also maintaining ethical guidelines by keeping customers anonymous. The goal of this study was to figure out if customers are more inclined to tip under certain circumstances so restaurant owners may potentially optimize their restaurants.
Results
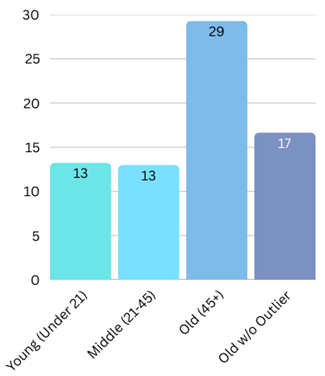
The graph to the left shows the relation between the average tipping percentage and the apparent age of the customer. Keeping in mind that since this study was purely observational, the apparent ages are based on my own observations and have the potential of being skewed. The specific averages in percentage amounts are 13.25 for young, 13.33 for middle, 29.286 for old including a very large outlier, and 16.667 for old after removing that outlier. While the differences between young appearing individuals and middle appearing individuals are minuscule and can be accredited to chance but the difference between the young and middle with the older appearing individuals is statistically significant. Even without the high outlier, the graph is still skewed to the lower ages, meaning that the higher ages were seen to tip more.
This next graph on the left depicts the correlation between the time of day and the tipping.
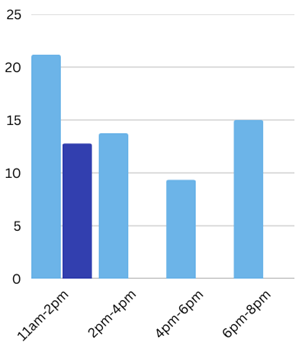
A nine-hour day was split up into 4 intervals: 11am-2pm, 2pm-4pm, 4pm-6pm, and 6pm-8pm. The average in tips for these 4 categories, respectively, was 21.18 (with outlier, 12.18 without outlier (dark blue)), 13.75, 9.35, and 15. While there aren’t many significant differences, it should still be noted that the recorded tips for 4pm-6pm were considerably lower than the other time intervals.
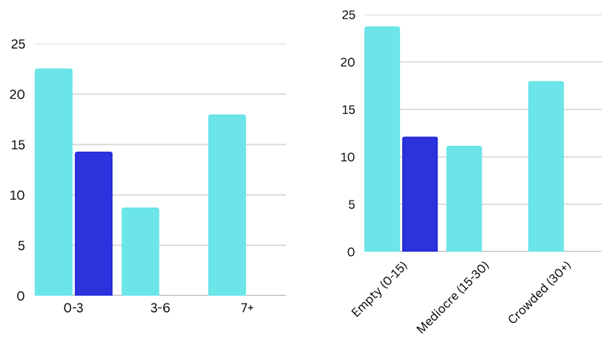
The left graph below shows the comparison between the line size behind a customer and the average tip they provide. For this variable, I set up 3 intervals: 0-3, 3-6, and 7+. The average tip percentage for 0-3 was 22.55 with the outlier and 14.3 without, 8.75 for line size 3-6, and 18 for line size 7+. The difference in tip percentage between having below 6 people in line versus having 7 or above is significant. This correlation is very similar to that of the crowdedness of the entire restaurant vs the average tip percentage, which is seen above to the right of the line size vs tip graph. The tip percentage breakdown for the 3 categories: 23.75 for empty with outlier and 12.14 without, 11.18 for mediocre, and 18 for crowded. The numbers are almost identical, which isn’t surprising considering that the crowdedness of the restaurant plays a large role in the line size of the bakery.
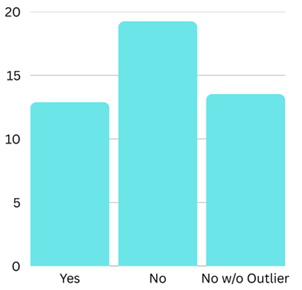
The graph to the right depicts the tipping averages for those who were observed with children with the assumption that those children were theirs. There were only three categories for this: yes and no (with and without outlier). The difference between those with kids and those without are not huge when disregarding the outlier, but there is still an average higher tipping percentage for those without children. This could be due to the fact that these individuals are likely younger or that they have more financial freedom.
Key Findings
Impact of Line Size/Crowdedness of Restaurant
The data revealed a significant trend between line size/restaurant crowdedness and tipping percentage. According to the data, customers who waited in longer lines of 7 or more people and people who were at the restaurant when it was at its most crowded were seen to tip larger percentages than those who waited in shorter lines. This finding aligns with prior research that has been done and concluded that societal pressure is a leading cause of tipping (Dingman, 2024). This study, along with my findings, suggests that people are more likely to tip larger amounts when they feel as though they are being watched. This match does match up with my original hypothesis that people would leave more generous tips when under the assumption that people are going to notice what they are tipping. Along with this, these results could have also been due to compassion for those working. There is the possibility that those purchasing food feel a form of pity or kindness towards the enhanced stress for the workers during more crowded times and show that through their tips.
Time of Day
This study found that customers who visited the store during its peak hours (the 11am-2pm lunch rush) tipped at a slightly lower rate compared to those who dined during slower times. A potential explanation for this is that when the restaurant is less busy, the service a customer receives can be of a higher quality and feel more attentive overall, prompting them to leave a more generous gratuity. This does contrast with the previous point made however, that customers tip more due to compassion for workers. Since there were a larger amount of tips during the busiest times but the relationship was not linear, there is the potential that there is more than just one factor that impacts tipping.
With the highest tips coming from the busiest times, second highest coming from the emptiest times, and lowest tips coming from the middle, the nonlinear relationship takes away the ability to account this pattern to just one variable.
Observed Demographics
While no demographic data was collected first hand for this study, observed demographics such as estimated age suggested that older customers were more likely to tip at higher percentages than younger customers. This finding aligns with previous research that states that older generations are more likely to tip larger amounts (Gravely, 2024).
Challenges and Limitations
While the method of this study minimized response bias, it also posed a challenge. The largest limitation was that all the data I collected was observed from one singular restaurant. This blocks the possibility of these results being generalized to other restaurants. Additionally, my own demographics as a server may have influenced tipping behavior among certain customers, creating a confounding variable for this study that can not be controlled. Future research aiming to replicate a similar study should aim to expand the sample to numerous restaurants and have a variety of servers to further validate these findings and allow them to be generalized to larger populations.
Conclusion
This study demonstrated that tipping behavior is influenced by many different situational factors, specifically line size and restaurant crowdedness. These findings could be valuable for restaurant owners seeking to optimize service strategies and encourage more generous tipping. While there are limitations to the findings, the research provides some insight into the subconscious and conscious decision-making processes behind tipping and offers a foundation for further research within this field.
While my study did show that situational factors play an impact on a customers tipping habits, a crucial part of my hypothesis, there were still parts that were not seen. I assumed that I would find a linear relationship as I thought there would be one factor that would solely increase or reduce the tips shown. However, the relationship I found was not linear and implies that it is a mix of numerous factors that truly impact tipping.
After conducting a thorough investigation into the tipping behaviors of customers within Mandola’s Italian Kitchen, I came to a conclusion about the underlying psychology behind one’s tipping behavior. Specifically, people seem to feel more pressure to tip when in large crowds of people. This could be due to the fact that people have the underlying tendency to feel respected and accepted by their peers (McElhaney, 2008). Aside from that, I also observed that older individuals were seen to tip a larger percentage on average. This could be due to many things, but one likely conclusion is the fact that older individuals may have less expenses to worry about and therefore feel more comfortable spending more on a meal. Understanding these results can allow for restaurant owners to understand what situations customers enjoy and what situations push them to tip smaller amounts.
The process of collecting data for this paper has both pros and cons. Due to the nature of this study, the results were not impacted by response or social desirability bias since no customers were directly addressed. Along with that, there were no ethical concerns as all customers remained anonymous and no sort of personal data was collected and receipts were discarded after just noting down the certain financial tipping data that was needed. The information was not entirely random as it came from only one restaurant, but since no one was asked to respond there was no voluntary response bias. While this method was the best choice for my intended research, it certainly came with faults. There are the obvious confounding factors, such as the restaurant itself and the fact that I only collected data from customers I served. There is also the potential for unknown confounding variables. Another major limitation is any sort of mistake I could have made when I was classifying the customers. I had to estimate the ages and assume that the only people that were part of their family were the ones I saw when they ordered. These limitations make it so that the results found in this study can not be generalized and applied to other establishments and that the results found in this study need to be accepted with those limitations in mind.
While this study did yield its own successful results, future research can be done on this topic to expand on these results and find new results . If this exact study were to be replicated, research should keep in mind to have an organized way to collect the information as that was a challenge in the data collection I faced. By conducting this research with other servers in other restaurants, the results found could successfully be generalized to a larger population. Along with simply expanding on the categories that I chose, other researchers can also choose other factors to measure and simply use a similar methodology to find their results. Currently, my study could not be generalized to a large variety of restaurants as that would lead to the possibility of numerous confounding variables such as the location of the restaurant, the socioeconomic status of the neighboring communities, and the target population for this restaurant. However, keeping in mind that this study produced correlational results and not causational, these could be considered to impact other restaurants and later further experimented on in order to solidify those assumptions.
While these results open a new door into research about tipping behavior, it still aligns with the existing studies about the societal influences on tipping behavior. Previous research has shown that customers are influenced by social pressures for financial decisions such as tipping (Cialdini & Goldstein, 2004). By building on these existing studies, this research study simultaneously reinforces the established theories and highlights the potential for further exploration on these topics. Understanding these patterns provides valuable insights for restaurant workers and owners looking to create environments that promote tipping and also gives insights on human behavior.
References
- American Psychological Association. (2019). Publication manual of the American Psychological Association (7th ed.).
- Azar, O. H. (2020). The Economics of Tipping. The Journal of Economic Perspectives, 34(2), 215–236. https://www.jstor.org/stable/26913191.
- Beer, A., & Greitemeyer, T. (2019). The effects of background music on tipping behavior in a restaurant: A field study. Psychology of Music, 47, 444 - 450.
- Boyes, William & Jr, William. (2006). Restaurant Tipping: Free-Riding, Social Acceptance, and Gender Differences1. Journal of Applied Social Psychology, 34, 2616 - 2625. 10.1111/j.1559-1816.2004.tb01995.x.
- Bujisic, M., Choi, Y., Parsa, H.G., & Krawczyk, M. (2013). Tipping Practices in Food and Beverage Operations: A Longitudinal Study. Journal of Culinary Science & Technology, 11, 241 - 258.
- Creswell, J. W., & Plano Clark, V. L. (2017). Designing and conducting mixed methods research (3rd ed.). Sage Publications.
- DeSilver, D., & Lippert, J. (2023, November 9). Factors affecting whether and how much Americans tip. Pew Research Center. Retrieved December 17, 2024, from Factors affecting whether and how much Americans tip.
- Gravely, A. (2024). Age and prosocial spending: A tipping point. Journal of Social Economics, 15(2), 102–118.
- Jacob, C., & Guéguen, N. (2013, December). The effect of employees’ verbal mimicry on tipping. International Journal of Hospitality Management, 35, 109-111. [CrossRef]
- Jewell, C. (2018). Factors Influencing Tipping Behavior in a Restaurant. Psi Chi Journal of Psychological Research, 13, 38-48.
- Lynn, Michael. (2006). Geodemographic Differences in Knowledge About the Restaurant Tipping Norm. Journal of Applied Social Psychology, 36, 10.1111/j.0021-9029.2006.00027.x.
- Nisbett, R. E., & Wilson, T. D. (1977). Telling more than we can know: Verbal reports on mental processes. Psychological Review, 84(3), 231–259. [CrossRef]
- Walden University Academic Guides. (n.d.). General research paper guidelines.
- Webb, E. J., Campbell, D. T., Schwartz, R. D., & Sechrest, L. (1966). Unobtrusive measures: Nonreactive research in the social sciences. Rand McNally.
Disclaimer/Publisher’s Note: The statements, opinions and data contained in all publications are solely those of the individual author(s) and contributor(s) and not of MDPI and/or the editor(s). MDPI and/or the editor(s) disclaim responsibility for any injury to people or property resulting from any ideas, methods, instructions or products referred to in the content. |
© 2025 by the authors. Licensee MDPI, Basel, Switzerland. This article is an open access article distributed under the terms and conditions of the Creative Commons Attribution (CC BY) license (http://creativecommons.org/licenses/by/4.0/).
Copyright: This open access article is published under a Creative Commons CC BY 4.0 license, which permit the free download, distribution, and reuse, provided that the author and preprint are cited in any reuse.


