Submitted:
30 May 2025
Posted:
02 June 2025
You are already at the latest version
Abstract
Vaccination infrastructure planning in low- and middle-income countries remains a critical challenge for strategic management, particularly in large and diverse nations such as Nigeria. This study presents a structured decision-support approach for locating regional vaccine distribution centers using Multi-Criteria Decision Making/Aiding (MCDM/A), specifically the ELECTRE III method. Publicly available data were used to construct a context-specific set of criteria involving healthcare access, infrastructure, population density, economic capacity, and security conditions. These were quantified, normalized, and weighted using the Rank Order Centroid method. Thresholds were statistically derived based on criterion variability. Two state-level allocation strategies were compared: one combining minimum geographic fairness with ELECTRE rankings, and one based solely on ELECTRE outputs. The first method, which includes a baseline of one center per state and caps allocations at four, proved more equitable across Nigeria’s vast territory. At the Local Government Area level, the most suitable administrative units within each state were selected based on localized criteria. The results offer a practical and replicable framework for data-driven planning of vaccination infrastructure and demonstrate how MCDM/A can support strategic public health decision-making under data and capacity constraints.
Keywords:
multi-criteria decision making/aiding
; vaccine distribution centers location problem
; strategic decision-making
; strategic management
; Nigeria
; ELECTRE III
; vaccination campaign infrastructure
; regional health access
; decision support systems
1. Introduction
Ensuring adequate vaccination coverage across Africa remains a crucial healthcare objective due to the high proportion of the population susceptible to infectious diseases. Research indicates that more than 40% of the inhabitants are still partially unvaccinated [1]. This situation can result from several factors: a lack of laboratory facilities, insufficient data to facilitate a reliable strategy for vaccine distribution and inadequate logistics infrastructure [2]. Furthermore, according to the article contributing to the immunization services approach in Africa [3], vaccination strategy recommendations should be tailored to individual countries or even regions due to the vast discrepancies in the reasons for the lack of vaccination. According to the World Health Organization (WHO), countries with pre-prepared vaccination programmes improve their efficiency in immunization campaigns; the results are even better when the processes involved in vaccination campaigns are supported by digital tools [4]. The importance of enhancing immunity is also emphasized by the United Nations through the Sustainable Development Goals (SDGs): Goal 3 specifically targets the prevention of children and newborn mortality, the eradication of epidemics of several diseases, and the support for vaccine research and development [5]. The challenges of vaccination campaigns also affect Nigeria, the most populous African country, with a significant number of citizens lacking vaccination. Although progress has been made, financial constraints and infrastructure deficiencies still affect vaccination strategies [6]. Immunization, especially among children, remains a high-priority issue. Evidence suggests that focusing vaccination efforts on the level of healthcare facilities enhances effectiveness [7].
Proper recognition of both current and emerging challenges in vaccine supply chains is essential for addressing them using decision support tools. Among the most significant logistical issues identified are dynamic demand and buffer stock management, which have been shown to hinder the effectiveness of immunization efforts [8] [9]. As this paper focuses exclusively on logistics and management issues, works mainly concerned with biological and medical aspects of vaccination campaigns were excluded from the state-of-the-art analysis. Several notable developments in the optimization and upgrading of vaccine supply chains warrant attention. The use of Micro-Array Patch was explored as a possible alternative to expensive cooling systems for vaccines in cold vaccine supply chains [10]. The case of Mozambique showcased a significant reduction in logistical costs per vaccine dose using the HERMES modeling system [11]. Another study showed that an approach focused on projecting systems may help identify supply chain components where targeted changes could yield substantial benefits [12]. Beyond technical innovations, government support has emerged as a key enabler for enhancing both vaccine supply and demand [13]. In the area of Multi-Criteria Decision-Making/Aiding (MCDM/A), applications have primarily focused on the evaluation and improvement of existing supply chain structures. Distribution-wise, it was mainly focused on proper dosage, but there were exceptions. For example, M. Rastegar et al. [14] discussed vaccine warehouse location problem. However, it focuses mainly on the most vulnerable groups and transportation efficiency as a criterion.
Several studies referenced in this work apply diverse methodological approaches to comparable vaccination challenges. For example, a mixed-integer nonlinear programming (MINLP) model, simplified to a mixed-integer linear programming (MILP) formulation, demonstrated that within a given operational cost, the number of opened vaccination points can be drastically increased. More importantly, the efficiency of the system would still be sufficient even under the 50% growth in birth rate [15]. Coverage models such as the Maximal Covering Location Problem (MCLP) are proven useful for locating small outreach vaccination centers in rural, sparsely populated areas [16]. Furthermore, it should be noted that the proper vaccination strategy targeting a specific goal, such as reducing mortality, can lead to noticeable improvements in population immunization [17]. The use of parametric predictive models to forecast the spread of the epidemic, such as the Susceptible-Exposed-Infectious-Recovered-Dead (SEIRD) [18], also takes into account the allocation of vaccination centers. For that reason, the article by S. Roy et al. [18] served in the research to which this paper refers as a reference for choosing usable criteria in the location of distribution centers.
This paper presents a regional vaccine distribution center location problem within Nigerian Local Government Areas (LGAs) modeled using MCDM/A with various economic and social criteria. While the facility location problem represents only a segment of decision-making in the overall vaccine supply chain, narrowing the scope enabled a more in-depth study of this particular strategic decision-making problem. The chosen methodological approach is Multi-Criteria Decision Making/Aiding (MCDM/A), which was identified as the most suitable approach given the complexity and multi-dimensional nature of the problem [19]. The criteria against which each potential location was assessed were developed through extensive literature research. The emphasis was mainly on finding a wide spectrum of contradicting criteria. While this broader perspective allows us to examine the general impact of potential changes, it also necessitates some level of generalization and simplification. This was particularly evident in accounting for factors such as Nigeria’s size, population density, regional conflicts, corruption, and economic instability—issues. These had to be treated at a higher level of abstraction to maintain feasibility within the study’s time and resource constraints. Based on the literature search and analysis supported by the Undermind AI tool [20], the main contribution of this paper is a broad, strategic view of location planning in vaccine distribution. This contrasts with the prevailing literature, which emphasizes narrower logistical issues and rarely addresses location decisions from a system-wide perspective. This paper addresses the research gap by focusing on the entirety of Nigeria and applies a structured MCDM/A methodology to real-world data, providing a useful base for further studies. It also considers evidence suggesting that "direct-to-facility" deliveries are beneficial in routine vaccinations [21].
To guide the study and address the identified research gap, the following research questions were formulated:
Main Research Question (MRQ): How can the decision about the fair location of regional vaccine distribution centers throughout Nigeria be supported by decision-making methods, so that equitable, efficient, and data-driven results can be obtained?
To address MRQ, we investigated the following Detailed Research Questions (DRQ):
DRQ01: What are context-relevant and data-supported criteria for vaccine distribution center location planning formulated based on the literature review?
DRQ02: How can the criteria be appropriately quantified and incorporated into an MCDM/A model to be solved using ELECTRE III?
The remainder of this paper is as follows: In Section 2 the methodology is presented, including the overall research framework together with data acquisition and preparation: in Section 2.3, Section 2.3.4, and Section 2.3.5 the application of MCDM/A is presented for the Vaccination Distribution Centers Location Problem in Nigeria. In contrast, Section 2.3.3 describes the issue of data deficits and strategy in dealing with missing information. In Section 3, the results, that is, the locations of the vaccination distribution centers, are presented for two cases that differ in the level of granulation: states and Local Government Areas (LGAs). The results are critically analyzed and discussed. Finally, in Section 4 the conclusions and recommendations are drawn and the directions of the future research are indicated.
2. Materials and Methods
The Multi-Criteria Decision Making/Aiding (MCDM/A) methodology [22] applied in this study follows a two-stage approach: a macro-level analysis followed by a micro-level refinement [23]. In the first stage, the ELECTRE III method is used to allocate vaccine distribution centers across Nigeria at the state level. Only states that are assigned at least one distribution center proceed to the second stage. In this micro-level phase, data from LGAs within the selected states are analyzed using the same method to determine the optimal placement of centers. For the implementation, we used the J-ELECTRE-v3.0 software, an established tool for solving MCDM problems. This software is distributed under the GNU General Public License [24]. It offers robust support for analyzing conflicting criteria, a key requirement in our research [25]. The input data for the ELECTRE III method was adjusted by dividing each criterion by a relevant population-based factor. This approach allowed us to capture the relative differences between LGAs more effectively.
2.1. Multi-Criteria Decision Making/Aiding
Multi-Criteria Decision Making/Aiding (MCDM/A) refers to a family of methods developed to support the decision-making processes, particularly when multiple, and often conflicting, criteria must be considered. These methods are especially effective in real-world applications where structured evaluation is essential [26], as demonstrated in the context of the research referenced in this paper. As shown by Baczkiewicz et al. [27] MCDM/A techniques, such as the ELECTRE (Elimination Et Choix Traduisant la REalité) family, enable systematic and transparent data evaluation, which is crucial for ensuring the credibility of results. Specifically, we selected the ELECTRE III method, as it is particularly well-suited to real-world problems and allows for the integration of thresholds, making it an appropriate choice for the complexities of our analysis [28]. One of ELECTRE III’s key features is its capacity to deal with imprecise or uncertain preferences by introducing three types of thresholds for each criterion: indifference, preference, and veto. The indifference threshold defines the level below which the difference between alternatives is not considered meaningful. The preference threshold identifies the point at which one alternative is better. The veto threshold allows a single poor score on a criterion to prevent one alternative from outranking another, even if its overall performance is otherwise superior [22,29,30]. ELECTRE III constructs an outranking relation, which reflects the extent to which one alternative can be considered at least as good as another. Instead of producing a strict total ranking, it yields a partial pre-order, balancing both concordance (support among criteria) and discordance (opposition from individual criteria). This capacity to model conflicting and often qualitative criteria, while allowing flexible input through thresholds, makes ELECTRE III particularly appropriate for decision contexts characterized by uncertainty and the need for expert judgment, such as strategic location planning [31,32,33].
2.2. Data Acquisition
The data used in this research were mainly sourced from official Nigerian government sources (e.g., the Central Bank of Nigeria, the National Bureau of Statistics) as well as well-established reputable international organizations (e.g., the World Bank, UNICEF). Due to limitations in data availability, the dataset includes information from various years. However, since the study showcases how the MCDM/A model can be applied to identify structural dependencies and relative differences between states and LGAs rather than analyzing year-specific trends, using data from different periods is considered acceptable. For analytical consistency, the Federal Capital Territory (FCT) is treated as a state, bringing the total number of States to 37. The study further assumes the placement of 100 regional vaccine distribution centers across Nigeria. This number reflects a hypothetical but plausible national capacity and corresponds to an average of approximately three centers per state, offering a balanced and scalable analytical framework. All data used in the study have been made publicly available via the RODBUK Cracow Open Research Data Repository [34].
To enhance the diversity and comparability of the data, the final input values for the ELECTRE analysis were scaled by dividing each criterion by a population-based factor. These scaling factors were not uniform across all criteria; instead, they were individually tailored. This was necessary due to substantial discrepancies in the underlying datasets and the presence of outliers, which resulted in varying data ranges and distributions. The tailored approach allowed each criterion to contribute meaningfully to the analysis without being disproportionately influenced by extreme values.
Prior to analysis, all criteria were normalized to ensure comparability within the ELECTRE framework. We applied the Linear Max normalization technique, which has been proven to be a leading solution in the normalization of MCDM/A problem data[35]. The formulas used in the Linear Max normalization technique are presented in Table 1.
Where:
- — normalized value of criterion for alternative i
- — original (raw) value for alternative i
- — maximum value across all alternatives
2.3. Criteria Preparation
A more detailed description of the data preparation process is provided in the following sections. Table 2 presents a complete classification of the criteria into two categories: "benefit" and "cost". A criterion is considered a benefit when higher values indicate greater suitability for locating a distribution center. For example, a higher demand for vaccination due to poor healthcare quality or the number of cases of vaccine preventable diseases in the area justifies prioritizing a given area. The cost criterion is where lower values are more desirable. An example is the criterion "distance from existing shipping infrastructure", measured in kilometers: shorter distances are advantageous for reducing logistical challenges. Similarly, the criterion "security risks": lower major crime rates signal lower security risks, making such areas more favorable for investment.
2.3.1. State Level
Table 3 presents a breakdown of the state-level criteria into their constituent components, along with brief explanations to clarify their content. An additional state-level criterion, the population density (the number of people per square kilometer), is not included in the table, as it functions as a standalone variable [36]. For the combined criteria, arithmetic averages were used to aggregate the underlying indicators. This approach was chosen due to the absence of a clear rationale for assigning differential weights to individual components.
Regarding energy infrastructure, only power plants with an output exceeding 10 MW were considered. This threshold was applied because vaccine distribution centers require a stable and substantial energy supply. Reliance on generators or mini-grids was deemed too unreliable to meet the operational demands of such facilities.
2.3.2. LGA Level
In contrast to the state-level criteria, where several indicators were combined into broader categories, LGA-level criteria were treated as independent, standalone measures. This approach was adopted because, at the LGA level, each criterion captures a distinct and essential aspect of distribution center suitability. The criteria were selected based on the available sources of reliable data. The criteria are described as follows:
- Road Access. These data were obtained from the geoBoundaries open database [46]. Using these data [47], each LGA was analyzed for the presence of major roads (e.g., highways, motorways, expressways). The goal was to identify at least two roads to ensure alternative routing options. If a suitable major road was found within the LGA, a value of "1" was assigned to its row. If no such road was found, neighboring LGAs were examined. If a major road was found in a neighboring LGA, a value of "2" was assigned instead. This procedure was repeated for all 774 LGAs. The best scenario was when both columns for a given LGA contained a "1", indicating direct access to two major roads. The worst scenario was when no major roads were found within the LGA or its surroundings.
- Shipping Infrastructure Proximity The same administrative data from geoBoundaries was used[47], together with the locations of the ports and the aiports [48,49]. To obtain normalized values, the centroid of each LGA was calculated, and the Euclidean distance to the nearest port and airport in Nigeria was measured.
- Health Infrastructure [50] The national database of healthcare facilities was used to count the number of relevant healthcare centers in each LGA. Facilities not directly involved in vaccine provision, such as research institutes, teaching hospitals, and veterinary clinics, were excluded.
- Population Density [36] Population density, calculated as the number of people per square kilometer, was included as a standalone criterion due to its direct relevance to service coverage and demand.
- Vaccine-Preventable Cases [51] Some disease data, such as AFP (no vaccine for some diseases causing it) or cholera (only mid-term immunization), were excluded from our criteria. We considered only conditions that are proven to be long-term vaccine-preventable.
- Security Risks [52] was treated as a critical criterion, reflecting the impact of regional instability on project feasibility. The dataset includes reports of serious incidents, such as armed insurgencies, road blockades, and drone attacks, but excludes minor crimes. In high-risk regions, such instability significantly affects the viability of the vaccine distribution infrastructure.
2.3.3. Data Deficits
To ensure consistency and comparability across all administrative units, our research required complete data coverage at both the state and LGA levels. Consequently, missing data had to be addressed systematically. In some cases, such as with Borno State, data gaps were identified, primarily due to security challenges that hinder data collection in the region. To manage these deficiencies, missing values were imputed using the median of the corresponding indicator calculated from neighboring states or LGAs. This method was preferred over mean substitution, as it reduces the influence of outliers and better reflects local conditions. Given the substantial regional variation within Nigeria, this approach allowed us to derive more contextually realistic estimates, thereby enhancing the robustness of the final analysis. The complete table containing all administrative units along with their averaged figures is available in the companion data repository [34].
2.3.4. Weights
Due to the lack of access to domain experts, the importance of criteria had to be assessed subjectively by the authors of this study. The criteria were first ranked from most to least important based on the authors’ judgment. Subsequently, the Rank-Order Centroid (ROC) method was applied using Formula (1). This method is widely recognized as an appropriate technique for estimating weights in MCDM problems when expert input is unavailable [53]. Using this approach, we derived an analytically grounded approximation of the criteria weights (see Table 4).
Where:
- – the normalized weight assigned to the ranked criterion,
- n – total number of criteria,
- – the rank position of the criterion (with being the most important),
- k – index of summation from j to n.
2.3.5. Thresholds
The thresholds in the ELECTRE III method are parameters that define how differences between values in a given criterion are interpreted. Threshold Q represents the minimum difference considered meaningful. Threshold P points to strong preference between values, and threshold V stands for veto - too large discrepancies are blocked to prevent alternatives with too big an advantage from being considered better. Standard deviation is a well-established method in defining threshold values [54]. Table 5 contains specific multipliers used for each threshold.
3. Results and Discussion
The results of the analysis and the ELECTRE III output are presented in two stages, depending on the level of granulation: state-level division of vaccine distribution centers and LGA-level final allocation of these centers across Nigeria. Input data, including normalized criteria values, weights, thresholds, and final scores, are openly available via the RODBUK AGH data repository [34]. The last part of this section considers two center allocation strategies, compares them, and highlights potential strengths and weaknesses.
3.1. State Level Distribution
Table 8 presents a key segment of the ELECTRE output. For ease of reference, the entries are organized alphabetically by state name. The column labeled “Average” displays the final aggregated scores for each state, with lower values indicating greater suitability for hosting a vaccine distribution center. These scores serve as the foundation for the subsequent allocation of distribution centers across the country, as discussed later in this section.
In Figure 1, the arcs in the graph represent preference relations between each pair of states, as determined by the ELECTRE III method. Higher-ranked alternatives are positioned toward the top of the graph, reflecting their relative superiority. States positioned at the same horizontal level are considered to be equally ranked. In cases where two states are represented as a single node (e.g., a2; a18), this indicates that they are indistinguishable based on the evaluated criteria and applied thresholds.
Table 9 presents the allocation of 100 vaccine distribution centers across Nigerian states using two distinct methods. Method 1 relies on 3 basic rules:
- A fairness rule: each state must receive at least one center.
- A needs-based rule: the remaining 63 centers are distributed according to ELECTRE III results.
- A capacity constraint: no state can get more than 4 centers.
As can be seen, Method 1 ensures fairness by establishing the baseline of one distribution center for each of 37 states without taking into account the ELECTRE III results. The remaining 63 centers are divided proportionally according to the state evaluation results. Also, no state can have more than 4 centers to avoid unnecessary clusters in some areas. On the other hand, Method 2 skips the fairness rule and instantly moves to the division of all 100 centers between states. While Method 2 may appear mathematically more consistent, it also creates a risk of a major geographic imbalance. Being almost twice as large as France, distances in Nigeria can create significant accessibility barriers if not properly dealt with. A comparison of results between the two methods brought the following observations:
- Kaduna and Jigawa States receive 3 centers under Method 1, but 4 in Method 2 — indicating that a needs-only approach would heavily favor them, possibly at the expense of spatial equity.
- Yobe State is also impacted, method 2 placed 1 center less in it. This is an even more significant difference due to the lower spread of centers in the north-eastern part of Nigeria (which Yobe State is a part of) compared to the rest of the country.
- Kebbi State stands out with the largest relative reduction: 2 centers in Method 1 vs. just 1 in Method 2 — a 50% cut. Such a reduction may severely affect service coverage in a sparsely populated region, such as Kebbi State.
- All other states have consistent results through both methods, confirming an adequate level of prioritization in these.
Given these results, Method 1 is more justifiable both practically and ethically. It balances the objective needs of each state, as indicated by the ELECTRE results, while ensuring that no broader region is excluded from strategic planning. It is important to note that these findings pertain solely to the state-level allocation. The actual placement of distribution centers occurs at the LGA level, where additional and more granular criteria are incorporated into the decision-making process.
3.2. LGA Level Distribution
Figure 2 and Figure 3 contain maps of Nigeria with LGA administrative level boundaries. The maps were prepared with open source QGIS software [55]. Green and blue dots represent the locations of the vaccine distribution centers in Methods 1 and 2, respectively. For each state, the LGA with the most favorable score was selected to host a distribution center. In cases where placing centers in proposed locations is not possible due to any real-world constraints, we recommend referring to the next best-ranked LGAs within the given state.
It should be emphasized that this study does not propose specific locations, such as cities or streets, for vaccine distribution centers. We focused on identifying the most suitable LGAs across the states. The results presented in this paper are based on a fixed assumption of deploying exactly 100 centers nationwide, and do not consider the existing infrastructure of vaccine distribution centers. Each LGA was assessed holistically in terms of general suitability, operational viability, and geographic equity. A key methodological assumption was that every state must receive at least one center, with the allocation determined at the LGA level. Although this MCDM/A model is tailored for the present use case, the underlying approach is flexible and can be adapted to other decision-making scenarios. Importantly, this MCDM/A model is intended to serve as a decision support tool, not as a standalone solution. Final decisions should be made by competent authorities or responsible decision-makers. Due to a limitation of the ELECTRE III method, the requirement for a minimum of one center per state could not be encoded directly in the model and had to be applied manually during the results interpretation stage. Furthermore, an upper limit of four centers per state was imposed to ensure a fair distribution. Without this constraint, the allocation would have been highly uneven, with some states receiving no centers, while others could have received disproportionately high numbers. Lastly, the adaptability of this methodology is notable: it relies on open-source tools, publicly available data, and modest computational resources, making it accessible and applicable in a variety of regional and thematic contexts.
4. Conclusions
The output of this work primarily addresses two areas: a set of valuable decision-support criteria and two proposed final allocations of vaccine distribution centers across Nigeria. These allocations were derived through extensive research in the development of criteria and the application of appropriate MCDM/A methods and tools. The final results provide a strong foundation for further, more in-depth research and offer a robust methodology for future use. In response to the research questions posed in the first part of this paper, the efficient allocation of vaccine distribution centers across Nigeria can indeed be effectively supported through MCDM/A methods (MRQ). Context-relevant criteria were identified through a literature review and based on data availability, encompassing healthcare access, infrastructure, population needs, and security (DRQ01). These criteria were quantified using normalization techniques, weighted with the Rank Order Centroid method, and integrated with statistically defined thresholds (DRQ02). This approach enabled a transparent, data-driven allocation process that balances equity and efficiency while ensuring adequate geographic coverage.
While the final results are not without limitations, they provide a solid foundation for developing a fair and effective solution. The analysis was based on publicly available data, an informed understanding of Nigeria’s national context, and insights from relevant sector literature. The selected criteria are non-overlapping and mutually consistent; however, we acknowledge that the set is not optimal, as it reflects both methodological choices and data availability constraints. The criteria were appropriately quantified to suit the requirements of the ELECTRE method, with corresponding weights and thresholds duly defined. ELECTRE III was selected for its ability to compare alternatives and analyze their interrelationships, as well as its capacity to support scenario variation through adjustments to weights and thresholds. This approach addresses a research gap in the application of MCDM/A methods to vaccine distribution center planning. Although the topic has been discussed in existing literature, it has not been approached in the manner presented here. Previous studies typically relied on exact methods that require predefined locations; in contrast, our method operates one step earlier in the decision-making process by identifying broader regions suitable for subsequent, more detailed site selection.
Author Contributions
Conceptualization, K.Ł. and K.G.; methodology, K.Ł.; software, K.G.; validation, K.Ł. and K.G..; formal analysis, K.G.; investigation, K.Ł.; data curation, K.Ł.; writing—original draft preparation, K.Ł. and K.G.; writing—review and editing, K.Ł. and K.G.; visualization, K.Ł.; supervision, K.G.; funding acquisition, K.G.. All authors have read and agreed to the published version of the manuscript.
Funding
The APC was financed by a subsidy for the maintenance and development of the research potential of the AGH University of Krakow, Faculty of Management.
Institutional Review Board Statement
Not applicable.
Informed Consent Statement
Not applicable.
Data Availability Statement
The original data presented in the study are openly available in RODBUK AGH data repository at [https://doi.org/10.58032/AGH/TIE3Q6 ]
Conflicts of Interest
The authors declare no conflicts of interest. The funders had no role in the design of the study; in the collection, analyses, or interpretation of data; in the writing of the manuscript; or in the decision to publish the results.
Abbreviations
The following abbreviations are used in this manuscript:
| WHO | World Health Organization |
| MINLP | Multi-objective mixed-integer nonlinear programming |
| MILP | Mixed-integer linear programming |
| MCLP | Maximal Covering Location Problem |
| SEIRD | Susceptible, Exposed, Infected, Recovered, Deceased |
| MCDM/A | Multi-Criteria Decision Making/Aiding |
| FCT | Federal Capital Territory |
| LGA | Local Government Area |
| UNICEF | United Nations International Children’s Emergency Fund |
| AFP | Acute Flaccid Paralysis |
References
- Okesanya, O.; Olatunji, G.; Olaleke, N.; Mercy, M.; Ilesanmi, A.; Kayode, H.; Manirambona, E.; Ahmed, M.; Ukoaka, B.; Lucero-Prisno III, D. Advancing Immunization in Africa: Overcoming Challenges to Achieve the 2030 Global Immunization Targets. Adolescent Health, Medicine and Therapeutics 2024, Volume 15, 83–91. [CrossRef]
- Mihigo, R.; Okeibunor, J.; Anya, B.; Mkanda, P.; Zawaira, F. Challenges of immunization in the African Region. The Pan African medical journal 2017, 27, 12. [CrossRef]
- D, N. Routine immunization services in Africa: back to basics. Journal of Vaccines & Immunization 2013, 1, 6–12. [CrossRef]
- World Health Organization, R.O.f.A. Key lessons from Africa’s COVID-19 vaccine rollout, 2021.
- United Nations. 70/1. Transforming our world: the 2030 Agenda for Sustainable Development Transforming our world: the 2030 Agenda for Sustainable Development Preamble. Technical report, United Nations, 2015.
- Sarley, D.; Mahmud, M.; Idris, J.; Osunkiyesi, M.; Dibosa-Osadolor, O.; Okebukola, P.; Wiwa, O. Transforming vaccines supply chains in Nigeria. Vaccine 2017, 35. [CrossRef]
- Utazi, C.E.; Olowe, I.D.; Chan, H.M.; Dotse-Gborgbortsi, W.; Wagai, J.; Umar, J.A.; Etamesor, S.; Atuhaire, B.; Fafunmi, B.; Crawford, J.; et al. Geospatial Variation in Vaccination Coverage and Zero-Dose Prevalence at the District, Ward and Health Facility Levels Before and After a Measles Vaccination Campaign in Nigeria. Vaccines 2024, 12. [CrossRef]
- Vahdani, B.; Mohammadi, M.; Thevenin, S.; Gendreau, M.; Dolgui, A.; Meyer, P. Fair-split distribution of multi-dose vaccines with prioritized age groups and dynamic demand: The case study of COVID-19. European Journal of Operational Research 2023, 310, 1249–1272. [CrossRef]
- Yang, Y.; Bidkhori, H.; Rajgopal, J. Optimizing vaccine distribution networks in low and middle-income countries. Omega (United Kingdom) 2021, 99. [CrossRef]
- Bozorgi, A.; Fahimnia, B. Transforming the vaccine supply chain in Australia: Opportunities and challenges. Vaccine 2021, 39. [CrossRef]
- Lee, B.Y.; Haidari, L.A.; Prosser, W.; Connor, D.L.; Bechtel, R.; Dipuve, A.; Kassim, H.; Khanlawia, B.; Brown, S.T. Re-designing the Mozambique vaccine supply chain to improve access to vaccines. Vaccine 2016, 34. [CrossRef]
- Prosser, W.; Spisak, C.; Hatch, B.; McCord, J.; Tien, M.; Roche, G. Designing supply chains to meet the growing need of vaccines: evidence from four countries. Journal of Pharmaceutical Policy and Practice 2021, 14. [CrossRef]
- Adida, E.; Dey, D.; Mamani, H. Operational issues and network effects in vaccine markets. European Journal of Operational Research 2013, 231. [CrossRef]
- Rastegar, M.; Tavana, M.; Meraj, A.; Mina, H. An inventory-location optimization model for equitable influenza vaccine distribution in developing countries during the COVID-19 pandemic. Vaccine 2021, 39. [CrossRef]
- Li, X.; Pan, Y.; Jiang, S.; Huang, Q.; Chen, Z.; Zhang, M.; Zhang, Z. Locate vaccination stations considering travel distance, operational cost, and work schedule. Omega (United Kingdom) 2021, 101. [CrossRef]
- Lim, J.; Claypool, E.; Norman, B.A.; Rajgopal, J. Coverage models to determine outreach vaccination center locations in low and middle income countries. Operations Research for Health Care 2016, 9, 40–48. [CrossRef]
- Miura, F.; Leung, K.Y.; Klinkenberg, D.; Ainslie, K.E.; Wallinga, J. Optimal vaccine allocation for COVID-19 in the Netherlands: A data-driven prioritization. PLoS Computational Biology 2021, 17. [CrossRef]
- Roy, S.; Dutta, R.; Ghosh, P. Optimal time-varying vaccine allocation amid pandemics with uncertain immunity ratios. IEEE Access 2021, 9, 15110–15121. [CrossRef]
- Chakraborty, S.; Raut, R.D.; Rofin, T.M.; Chakraborty, S. A comprehensive and systematic review of multi-criteria decision-making methods and applications in healthcare, 2023. [CrossRef]
- Undermind AI. Undermind – Research co-pilot for experts, 2024. Retrieved from https://www.undermind.ai/.
- Aina, M.; Igbokwe, U.; Jegede, L.; Fagge, R.; Thompson, A.; Mahmoud, N. Preliminary results from direct-to-facility vaccine deliveries in Kano, Nigeria. Vaccine 2017, 35. [CrossRef]
- Roy, B. The outranking approach and the foundations of electre methods. Theory and Decision 1991, 31, 49–73. [CrossRef]
- Zak, J. The application of the multiple criteria decision making/aiding methodology to evaluation and redesign of logistics systems. Decision Making in Manufacturing and Services 2019, 13, 33–54. [CrossRef]
- Free Software Foundation. GNU General Public License, Version 3. https://www.gnu.org/licenses/gpl-3.0.html, 2007.
- Taherdoost, H.; Madanchian, M. A Comprehensive Overview of the ELECTRE Method in Multi Criteria Decision-Making. Journal of Management Science & Engineering Research 2023, 6. [CrossRef]
- Zak, J. Multiple-Criteria and Group-Decision Making in the Fleet Selection Problem for a Public Transportation System. In Proceedings of the Transportation Research Procedia. Elsevier B.V., 2017, Vol. 27, pp. 43–52. [CrossRef]
- Ba̧czkiewicz, A.; Watrobski, J.; Sałabun, W. Towards MCDA Based Decision Support System Addressing Sustainable Assessment. Isd 2021.
- Pereira, V.; Dias, L.; Nepomuceno, O. J-ELECTRE v3.0 User Guide. Technical report, 2021.
- Figueira, J.; Mousseau, V.; Roy, B., Electre Methods. In Multiple Criteria Decision Analysis: State of the Art Surveys; Springer-Verlag, 2005; p. 133–153. [CrossRef]
- Takeda, E. A method for multiple pseudo-criteria decision problems. Computers & Operations Research 2001, 28, 1427–1439. [CrossRef]
- Cinelli, M.; Kadziński, M.; Gonzalez, M.; Słowiński, R. How to support the application of multiple criteria decision analysis? Let us start with a comprehensive taxonomy. Omega 2020, 96, 102261. [CrossRef]
- Karagiannidis, A.; Moussiopoulos, N. Application of ELECTRE III for the integrated management of municipal solid wastes in the Greater Athens Area. European Journal of Operational Research 1997, 97, 439–449. [CrossRef]
- Taherdoost, H.; Madanchian, M. A Comprehensive Overview of the ELECTRE Method in Multi Criteria Decision-Making. Journal of Management Science & Engineering Research 2023, 6, 5–16. [CrossRef]
- Gdowska, K.; Łygas, J. Multicriteria-Based Vaccine Distribution Center Planning in Nigeria Using ELECTRE III. RODBUK Cracow Open Research Data Repository 2025. [CrossRef]
- Vafaei, N.; Ribeiro, R.A.; Camarinha-Matos, L.M. Normalization techniques for multi-criteria decision making: Analytical hierarchy process case study. In Proceedings of the IFIP Advances in Information and Communication Technology, 2016, Vol. 470. [CrossRef]
- Frommert, Holger. Geo-Ref Nigeria Administrative Data, 2024. Retrieved from https://www.geo-ref.net/en/nga.htm.
- Open Data for Africa. Open Data for Africa - Nigeria Portal, n.d. Retrieved from https://nigeria.opendataforafrica.org/.
- Gabriel Okeowo, I.F. State of States Report 2022, 2022. Retrieved from https://stateofstates.budgit.org/ reports/details?year=2022.
- National Bureau of Statistics, Nigeria. National Bureau of Statistics - Report 1093, 2024-10-24. Retrieved from https://www.nigerianstat.gov.ng/elibrary/read/1093.
- National Bureau of Statistics, Nigeria. National Bureau of Statistics - Report 1123, n.d. Retrieved from https://www.nigerianstat.gov.ng/elibrary/read/1123.
- Ohiare, S. Expanding electricity access to all in Nigeria: a spatial planning and cost analysis, 2015. [CrossRef]
- World Bank. Nigeria Power Plants Dataset, 2023. Retrieved from https://datacatalog.worldbank.org/search/ dataset/0042336/Nigeria-Power-Plants.
- Oluseun Onigbinde, Vahyala Kwaga, E.O. State of States Report 2024, 2024. Retrieved from https://stateofstates.budgit.org/reports/details?year=2024.
- UNDP Nigeria.; National Bureau of Statistics. Nigeria Multidimensional Poverty Index 2022, 2022. Retrieved from https://www.undp.org/nigeria/publications/nigeria-multidimensional-poverty-index-2022.
- Central Bank of Nigeria. CBN Statistical Bulletin, 2024. Retrieved from https://www.cbn.gov.ng/documents/ Statbulletin.html.
- Runfola, D.; Anderson, A.; Baier, H.; Crittenden, M.; Dowker, E.; Fuhrig, S.; Goodman, S.; Grimsley, G.; Layko, R.; Melville, G.; et al. geoBoundaries: A global database of political administrative boundaries. PLOS ONE 2020, 15, e0231866. [CrossRef]
- GRID3. Nigeria - Local Government Area Boundaries (ADM2). https://data.grid3.org/datasets/grid3-nigeria-local-government-area-boundaries-1/explore?location=8.959048%2C8.685290%2C6.61, 2023. ISO-3166-1 (Alpha-3): NGA; Representative Year: 2022; Boundary Type: ADM2; Number of Units: 774; License: CC BY 4.0.
- Nigerian Ports Authority. Nigerian Ports Authority Official Website, n.d. Retrieved from https://nigerianports.gov.ng/.
- Okeke-Korieocha, I. Eight of 13 Nigerian Cargo Airports Inactive, 2022. Retrieved from https://businessday.ng/big-read/article/eight-of-13-nigerian-cargo-airports-inactive/.
- eHealth Africa. Nigeria Health Care Facilities (Primary, Secondary and Tertiary). https://gis-geonetwork.ehealthafrica.org/geonetwork/srv/en//metadata.show?uuid=e297dd24-1a09-42ac-b332-de07fd2a66d0, 2017. Spatial extent: 7.14°E–7.99°E, 4.82°N–6.04°N. Temporal extent: 2017-11-01 to 2018-12-31. Last updated: 2020-10-06.
- UNICEF Nigeria.; NEMA. NCDC EPIDEMICS DATA 2018 NATIONAL - UNICEF/NEMA Repository, 2024. Retrieved from https://nema-data-repository-unicef.hub.arcgis.com/documents/eb23ef00239f4b6293d82 adf6c170b28/about.
- UNICEF Nigeria.; NEMA. NGA 2024 Acled - UNICEF/NEMA Repository, 2024-10-24. Retrieved from https://nema-data-repository-unicef.hub.arcgis.com/datasets/dc7bd179b61e44539375e48746b1d282/about.
- Roszkowska, E. Rank Ordering Criteria Weighting Methods – a Comparative Overview. Optimum. Studia Ekonomiczne 2013. [CrossRef]
- Rogers, M.; Bruen, M. Choosing realistic values of indifference, preference and veto thresholds for use with environmental criteria within ELECTRE. European Journal of Operational Research 1998, 107. [CrossRef]
- QGIS Development Team. QGIS Geographic Information System: Documentation. Open Source Geospatial Foundation Project, 2024. Retrieved from https://www.qgis.org/resources/hub/#documentation.
Figure 1.
Outranking graph for Nigerian states generated from ELECTRE III results.
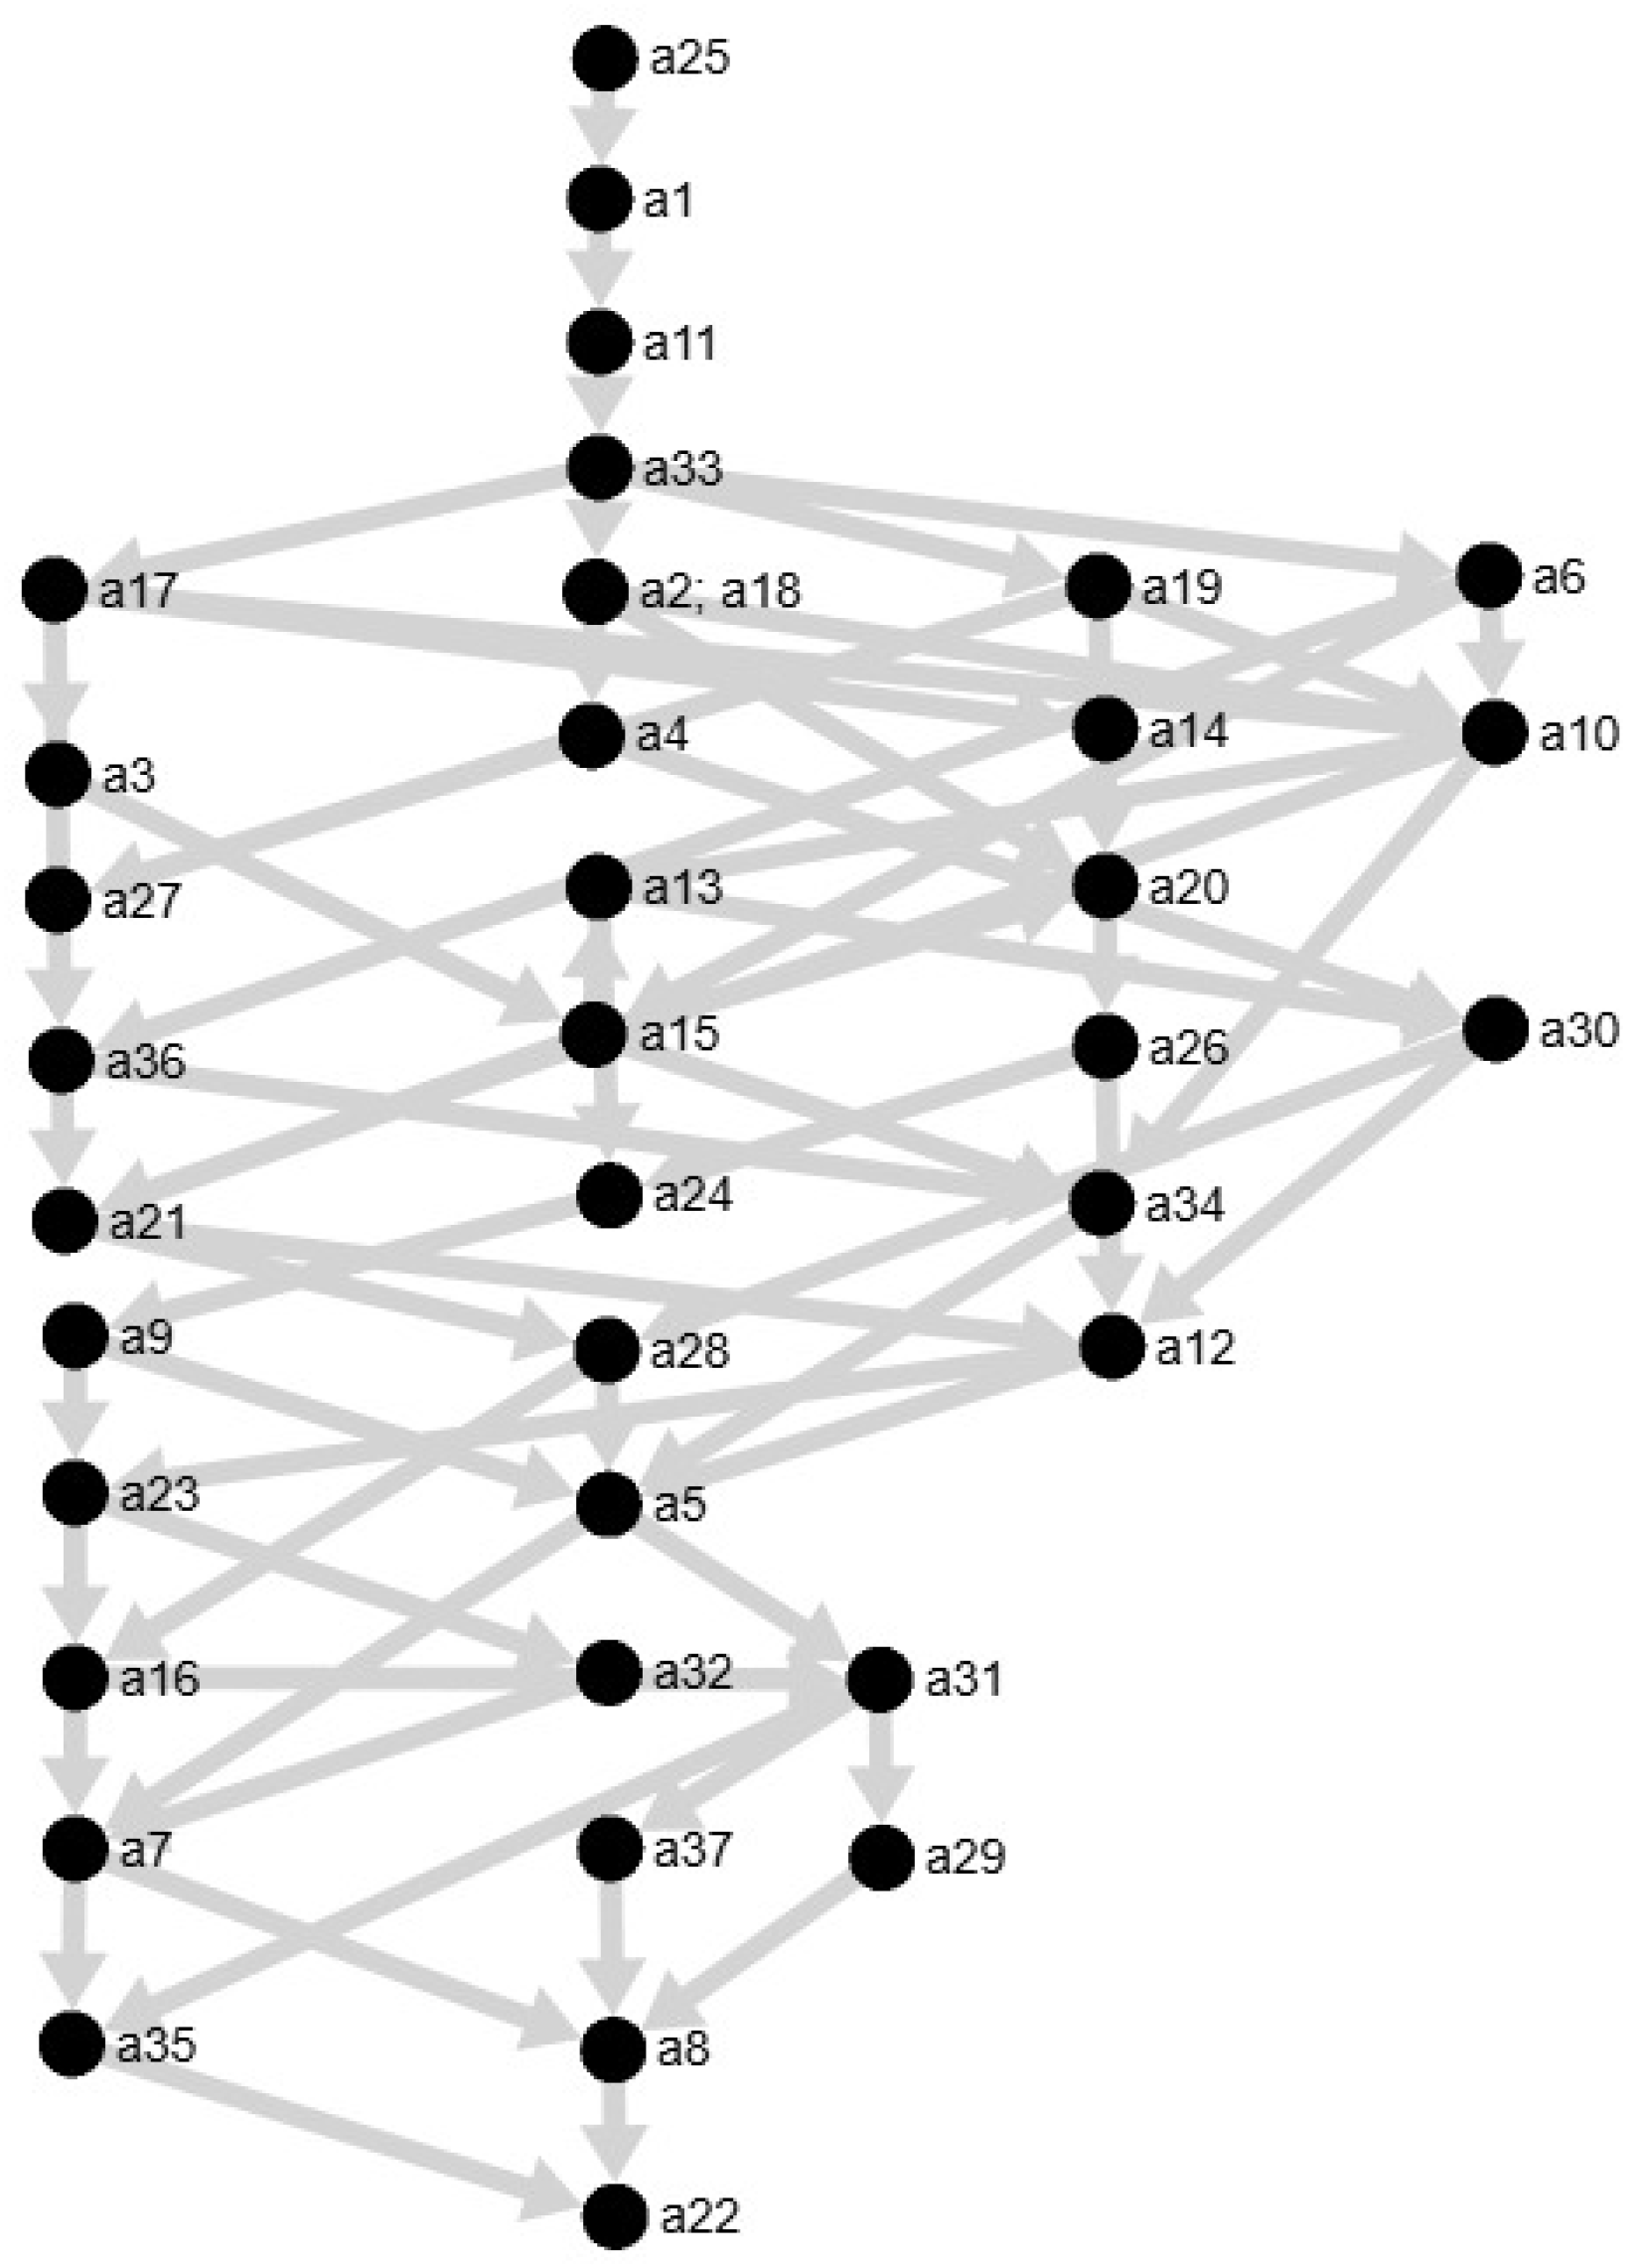
Figure 2.
Vaccine distribution centers coverage across Nigeria - Method 1.
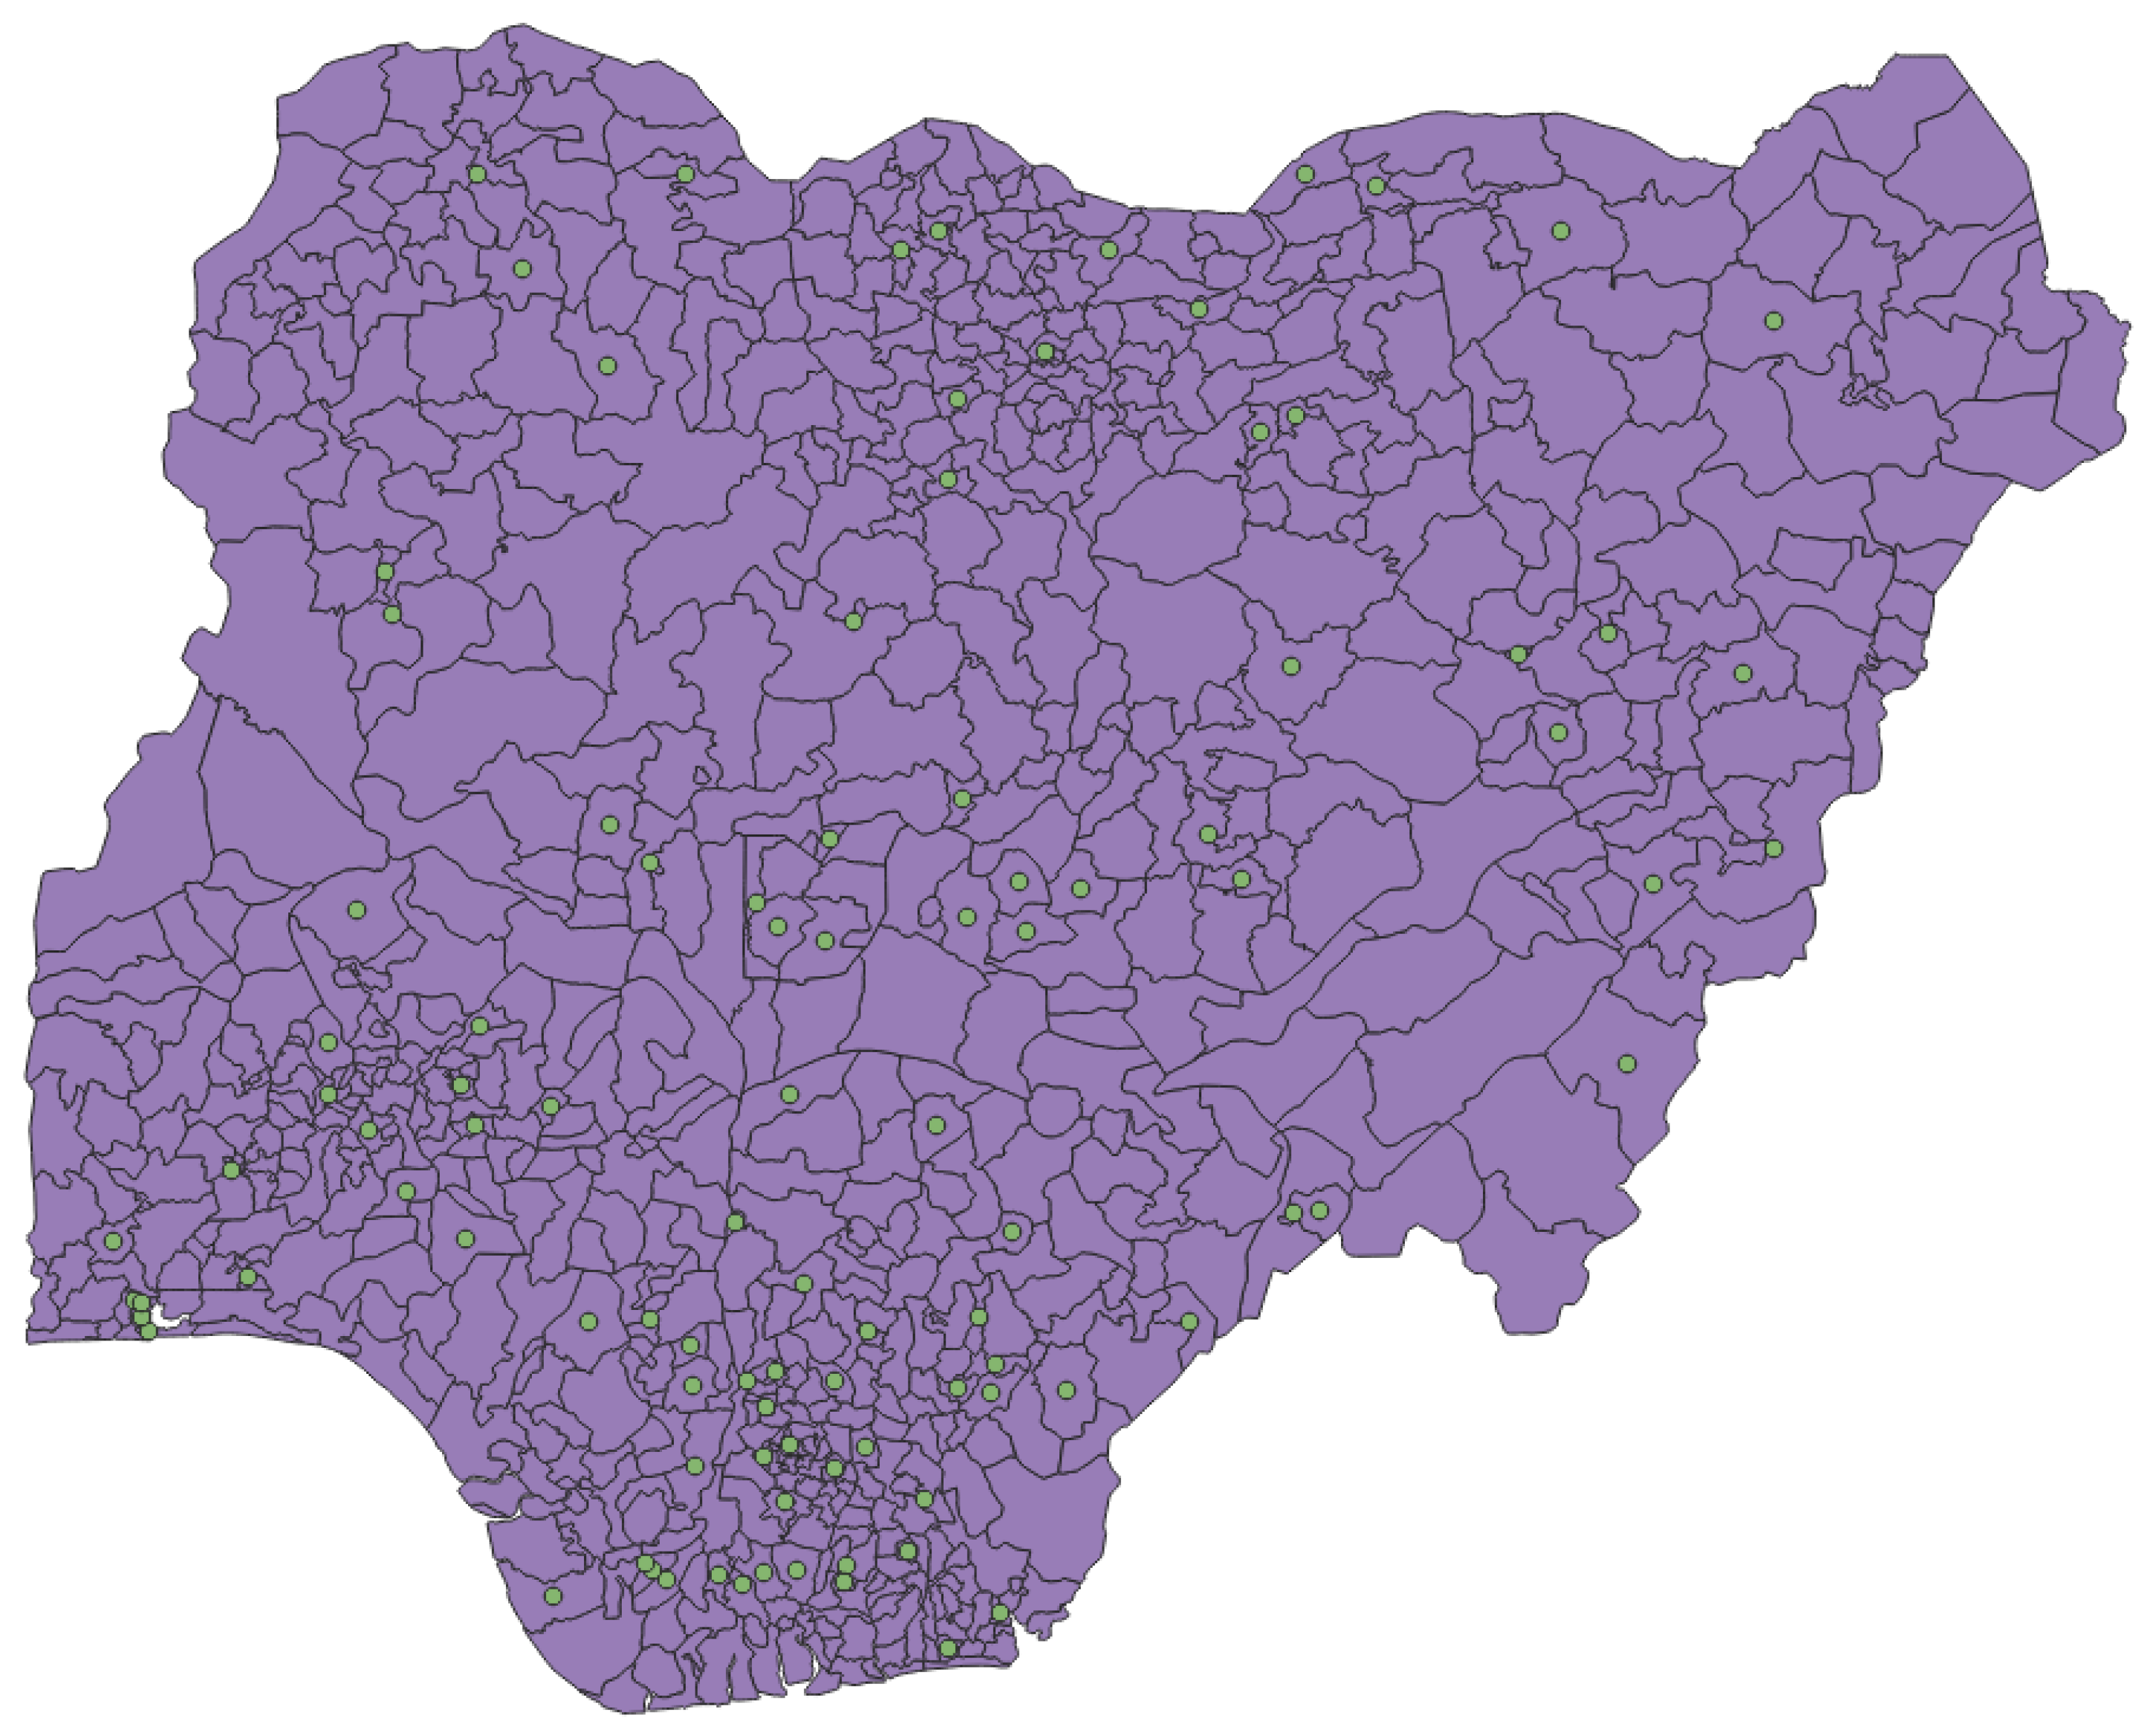
Figure 3.
Vaccine distribution centers coverage across Nigeria - Method 2.
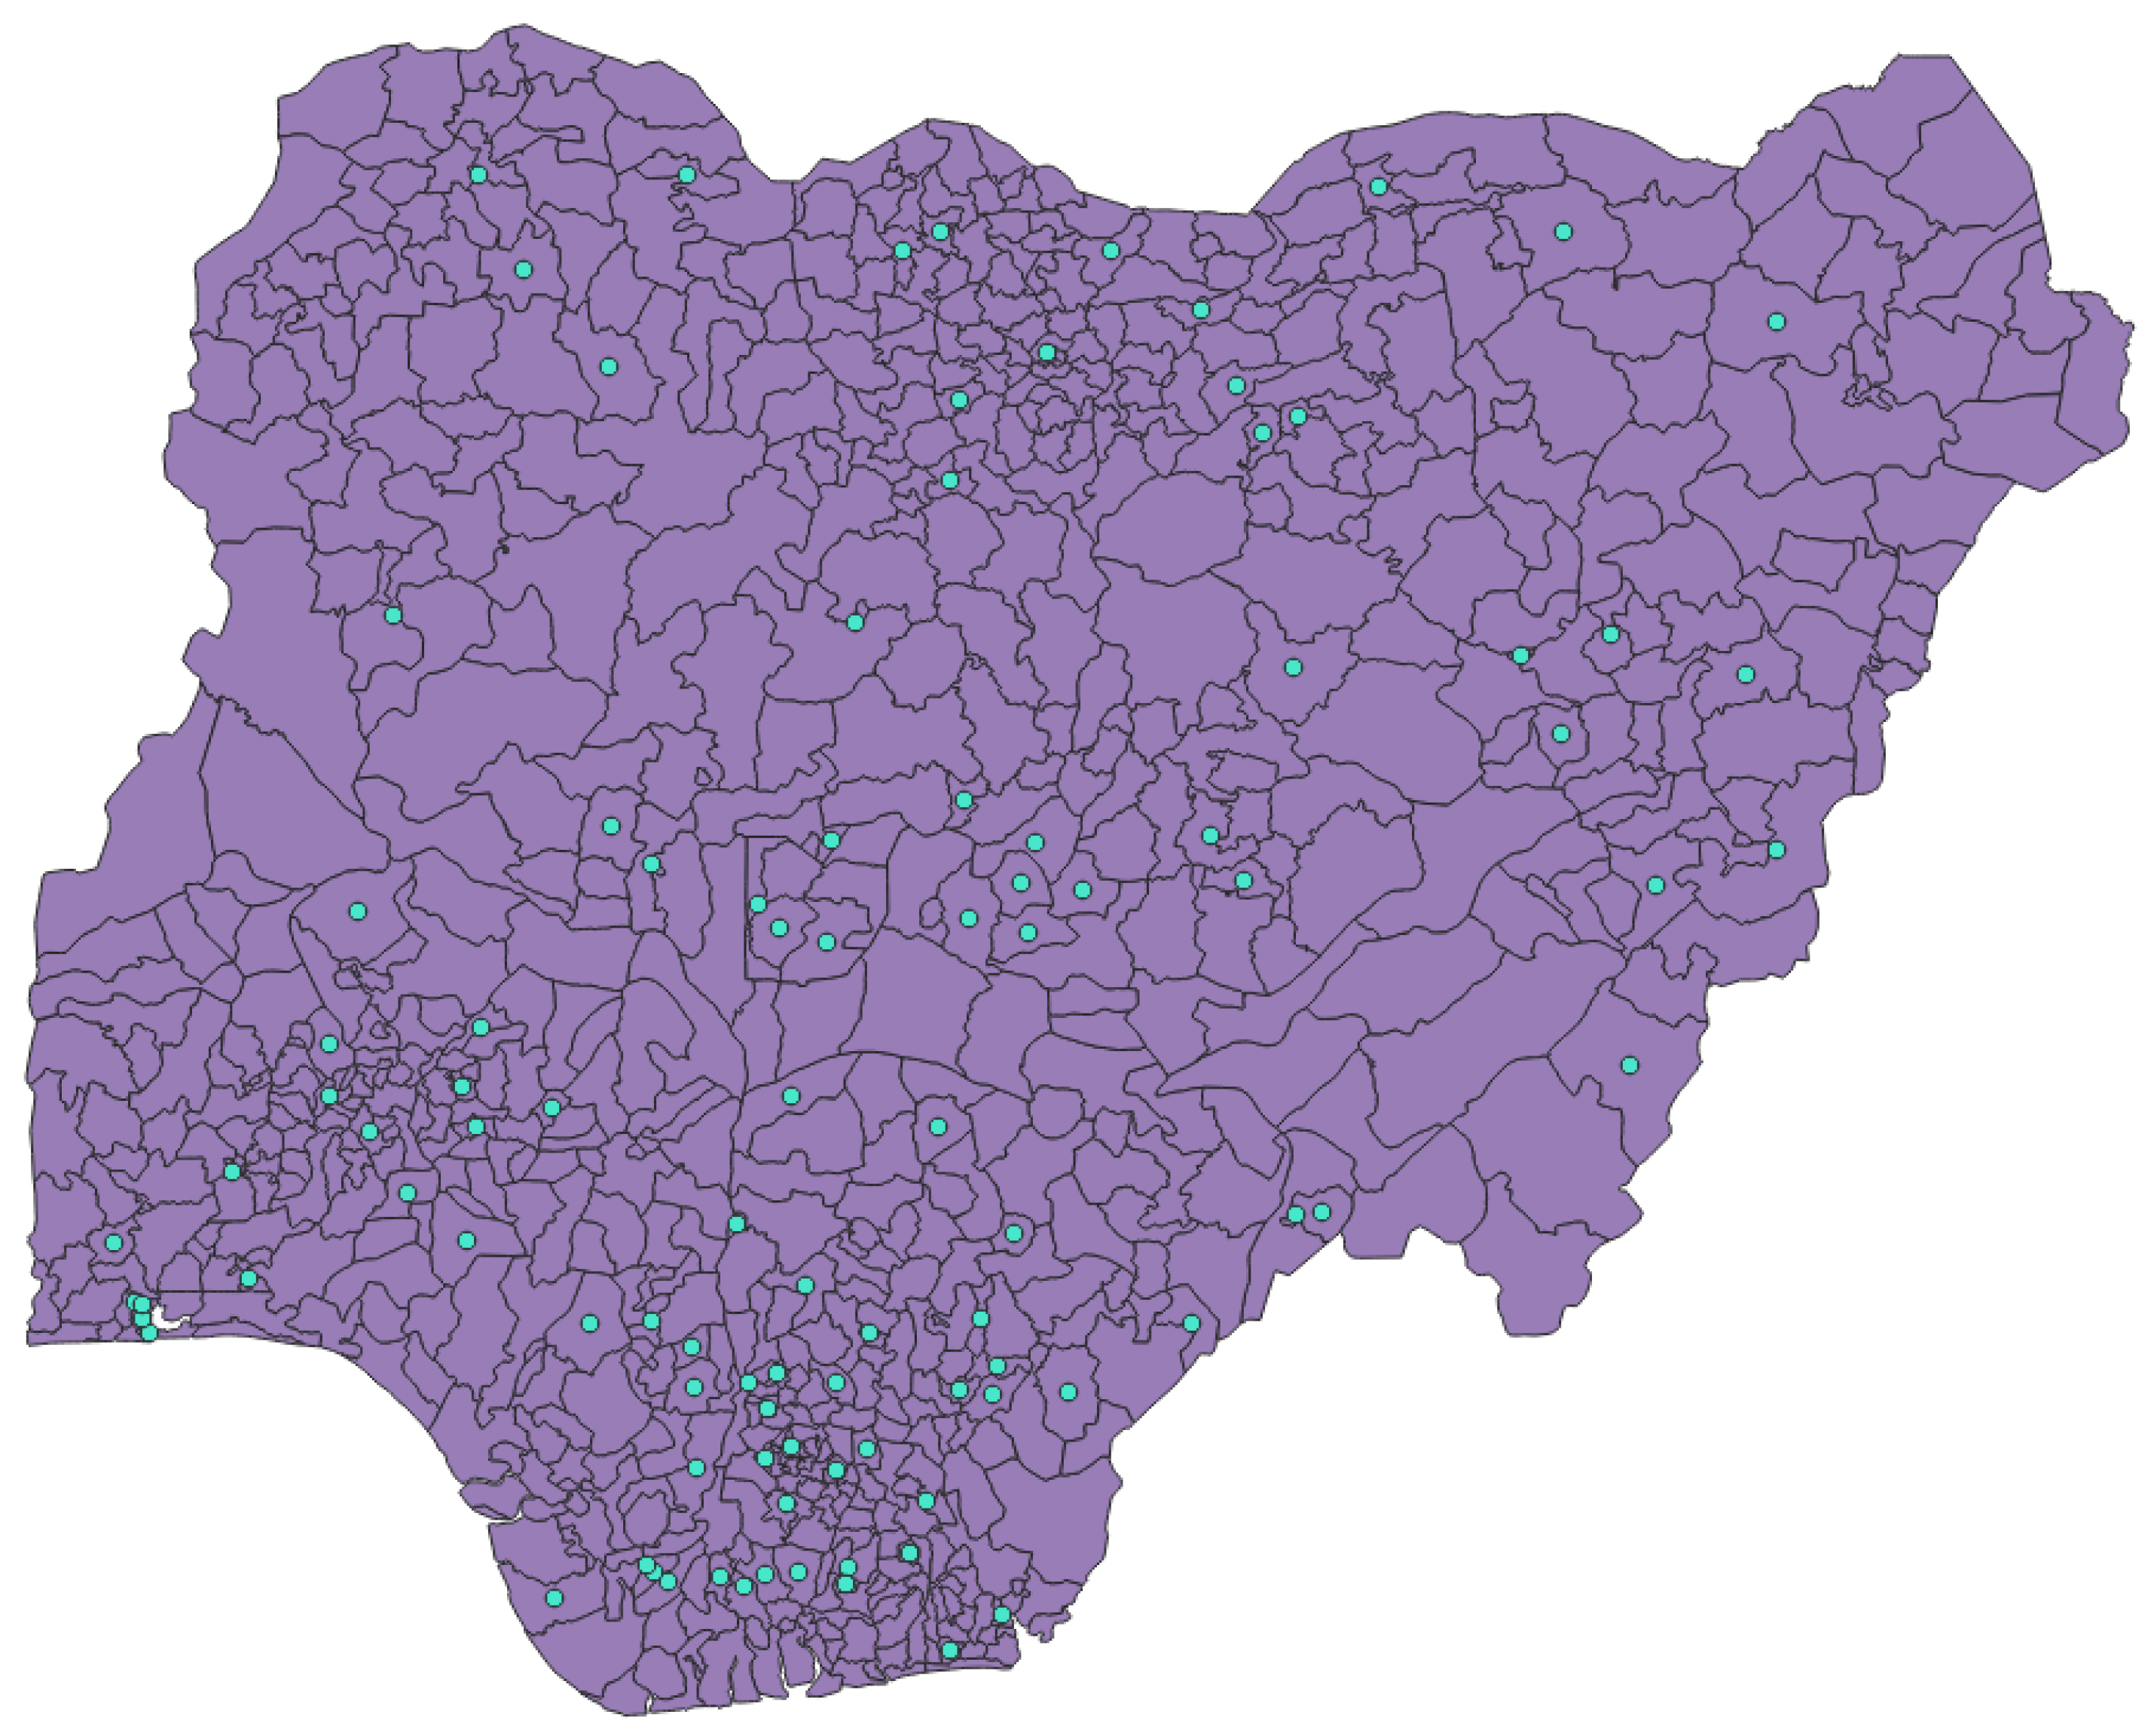

Table 1.
Equations used for linear max normalization of benefit and cost criteria, based on [35].
Table 1.
Equations used for linear max normalization of benefit and cost criteria, based on [35].
| Type of criteria | Formula |
|---|---|
| Benefit | |
| Cost |
Table 2.
Benefit/cost classification of each criterion divided by administrative level.
| Name of Criterion | Administrative Level | Criterion Type |
|---|---|---|
| Population Density | State | Benefit |
| Awareness and Water Access | State | Benefit |
| Health System Potential | State | Benefit |
| Electricity Access | State | Benefit |
| Economic Capacity | State | Benefit |
| Healthcare Disadvantages | State | Benefit |
| Road Access | LGA | Benefit |
| Shipping Infrastructure Proximity | LGA | Cost |
| Health Infrastructure | LGA | Benefit |
| Population Density | LGA | Benefit |
| Vaccine-Preventable Cases | LGA | Benefit |
| Security Risks | LGA | Cost |
Table 3.
Combined criteria with corresponding components and justification.
| Combined Criterion | Componential Criteria | Justification |
|---|---|---|
| Awareness and Water Access | Citizens using improved sources of water [%] [37] Citizens literate [%] [37] Citizens who have heard of AIDS [%] [37] |
These criteria reflect general health awareness and access to basic needs. |
| Health System Potential | Health Spendings per Capita [₦] [38] Infant mortality (per 1000 births) [37] Population below the poverty line [%] [39] |
This group assesses both the quality of existing healthcare and the regional population’s needs. |
| Electricity Access | Access to Electricity [%] [40] Access to National Grid [%] [41] Sum of MW per 100,000 citizens [42] |
Cross-referencing these criteria exemplifies each region’s electrical capabilities. |
| Economic Capacity | GDP per capita [₦] [38] Fiscal performance rank [43] Unemployment Rate [%] [44] Domestic debt of state [₦ Billion] [45] |
These show the region’s stability and sustainability regarding more demanding infrastructural projects. |
| Healthcare Disadvantages | Reasons for not accessing any health facility [%] [40] Too expensive [%] Poor quality of care [%] |
This group highlights barriers that prevent people from using healthcare services in Nigeria. |
Table 4.
Criteria importance and resulting weights at the state-level and the LGA-level.
| Criterion | Importance | Weight |
|---|---|---|
| State level | ||
| Population Density | 1 | 0.41 |
| Economic Capacity | 2 | 0.24 |
| Electricity Access | 3 | 0.16 |
| Health System Potential | 4 | 0.10 |
| Healthcare Disadvantages | 5 | 0.06 |
| Awareness and Water Access | 6 | 0.03 |
| LGA level | ||
| Health Infrastructure | 1 | 0.41 |
| Population Density | 2 | 0.24 |
| Security Risks | 3 | 0.16 |
| Road Access | 4 | 0.10 |
| Vaccine-Preventable Cases | 5 | 0.06 |
| Shipping Infrastructure Proximity | 6 | 0.03 |
Table 5.
Threshold formulas used in the ELECTRE III method.
| Threshold | Formula used |
|---|---|
| q | |
| p | |
| v |
Table 6.
Final threshold values for each criterion at the state level.
| Threshold Symbol |
Population Density |
Awareness and Water Access |
Health System Potential |
Electricity Access |
Economic Capacity |
Healthcare Disadvantages |
|---|---|---|---|---|---|---|
| q | 0.04 | 0.04 | 0.04 | 0.03 | 0.03 | 0.05 |
| p | 0.16 | 0.17 | 0.16 | 0.12 | 0.11 | 0.19 |
| v | 0.33 | 0.34 | 0.32 | 0.24 | 0.21 | 0.37 |
Table 7.
Final threshold values for each criterion at the LGA level.
| Threshold Symbol |
Road Access |
Shipping Infrastructure Proximity |
Health Infrastructure |
Population Density |
Vaccine-Preventable Cases |
Security Risks |
|---|---|---|---|---|---|---|
| q | 0.04 | 0.05 | 0.04 | 0.02 | 0.02 | 0.03 |
| p | 0.15 | 0.21 | 0.14 | 0.08 | 0.08 | 0.11 |
| v | 0.29 | 0.42 | 0.29 | 0.16 | 0.15 | 0.22 |
Table 8.
Final rankings of Nigerian states based on ELECTRE III results.
| State name | State ID | Ascend. | Descend. | Average |
|---|---|---|---|---|
| Abia | a1 | 2.0 | 2.0 | 2.0 |
| Adamawa | a2 | 3.0 | 11.0 | 7.0 |
| Akwa Ibom | a3 | 10.0 | 7.0 | 8.5 |
| Anambra | a4 | 3.0 | 17.0 | 10.0 |
| Bauchi | a5 | 19.0 | 25.0 | 22.0 |
| Bayelsa | a6 | 6.0 | 8.0 | 7.0 |
| Benue | a7 | 25.0 | 25.0 | 25.0 |
| Borno | a8 | 25.0 | 29.0 | 27.0 |
| Cross River | a9 | 18.0 | 16.0 | 17.0 |
| Delta | a10 | 9.0 | 14.0 | 11.5 |
| Ebonyi | a11 | 2.0 | 3.0 | 2.5 |
| Edo | a12 | 16.0 | 21.0 | 18.5 |
| Ekiti | a13 | 12.0 | 14.0 | 13.0 |
| Enugu | a14 | 13.0 | 6.0 | 9.5 |
| FCT | a15 | 10.0 | 9.0 | 9.5 |
| Gombe | a16 | 20.0 | 24.0 | 22.0 |
| Imo | a17 | 7.0 | 5.0 | 6.0 |
| Jigawa | a18 | 3.0 | 11.0 | 7.0 |
| Kaduna | a19 | 4.0 | 10.0 | 7.0 |
| Kano | a20 | 14.0 | 12.0 | 13.0 |
| Katsina | a21 | 11.0 | 21.0 | 16.0 |
| Kebbi | a22 | 27.0 | 29.0 | 28.0 |
| Kogi | a23 | 20.0 | 22.0 | 21.0 |
| Kwara | a24 | 17.0 | 15.0 | 16.0 |
| Lagos | a25 | 1.0 | 1.0 | 1.0 |
| Nasarawa | a26 | 15.0 | 13.0 | 14.0 |
| Niger | a27 | 5.0 | 19.0 | 12.0 |
| Ogun | a28 | 12.0 | 24.0 | 18.0 |
| Ondo | a29 | 23.0 | 28.0 | 25.5 |
| Osun | a30 | 12.0 | 18.0 | 15.0 |
| Oyo | a31 | 21.0 | 26.0 | 23.5 |
| Plateau | a32 | 24.0 | 23.0 | 23.5 |
| Rivers | a33 | 3.0 | 4.0 | 3.5 |
| Sokoto | a34 | 10.0 | 25.0 | 17.5 |
| Taraba | a35 | 26.0 | 27.0 | 26.5 |
| Yobe | a36 | 8.0 | 20.0 | 14.0 |
| Zamfara | a37 | 22.0 | 29.0 | 25.5 |
Table 9.
Comparison of center allocation between Method 1 (fairness and ELECTRE-based) and Method 2 (pure ELECTRE-based).
Table 9.
Comparison of center allocation between Method 1 (fairness and ELECTRE-based) and Method 2 (pure ELECTRE-based).
| State name | Method 1 | Method 2 |
|---|---|---|
| Abia | 4 | 4 |
| Adamawa | 4 | 4 |
| Bayelsa | 4 | 4 |
| Ebonyi | 4 | 4 |
| Imo | 4 | 4 |
| Lagos | 4 | 4 |
| Rivers | 4 | 4 |
| Jigawa | 3 | 4 |
| Kaduna | 3 | 4 |
| Akwa Ibom | 3 | 3 |
| Anambra | 3 | 3 |
| Delta | 3 | 3 |
| Ekiti | 3 | 3 |
| Enugu | 3 | 3 |
| FCT | 3 | 3 |
| Kano | 3 | 3 |
| Nasarawa | 3 | 3 |
| Niger | 3 | 3 |
| Yobe | 3 | 2 |
| Bauchi | 2 | 2 |
| Benue | 2 | 2 |
| Borno | 2 | 2 |
| Cross River | 2 | 2 |
| Edo | 2 | 2 |
| Gombe | 2 | 2 |
| Katsina | 2 | 2 |
| Kogi | 2 | 2 |
| Kwara | 2 | 2 |
| Ogun | 2 | 2 |
| Ondo | 2 | 2 |
| Osun | 2 | 2 |
| Oyo | 2 | 2 |
| Plateau | 2 | 2 |
| Sokoto | 2 | 2 |
| Taraba | 2 | 2 |
| Zamfara | 2 | 2 |
| Kebbi | 2 | 1 |
Disclaimer/Publisher’s Note: The statements, opinions and data contained in all publications are solely those of the individual author(s) and contributor(s) and not of MDPI and/or the editor(s). MDPI and/or the editor(s) disclaim responsibility for any injury to people or property resulting from any ideas, methods, instructions or products referred to in the content. |
© 2025 by the authors. Licensee MDPI, Basel, Switzerland. This article is an open access article distributed under the terms and conditions of the Creative Commons Attribution (CC BY) license (http://creativecommons.org/licenses/by/4.0/).
Copyright: This open access article is published under a Creative Commons CC BY 4.0 license, which permit the free download, distribution, and reuse, provided that the author and preprint are cited in any reuse.


