
Submitted:
30 May 2025
Posted:
02 June 2025
You are already at the latest version
Abstract
In this study we analyze the statistical characteristics of the human endogenous retroviruses (ERVs) database focusing on the subcase of positions and lengths of ERVs elements. We show that the positions and sizes of the ERV elements within chromosomes exhibit patterns that can be classified based on their complexity (or nonrandomness) characteristics as prescribed by the convolution of the abstract phase space with the tangible molecular space. A complexity factor, incorporating the Hurst exponent and the Tsallisian q-entropic index (used here as a molecular complexity index), captures evolutionary and physicochemical constraints acting on the geometry of ERV elements, defined by their positions and lengths. This reveals that ERV elements constitute a distinct subsystem that interacts with the entire genome and continuously influences its biological functionality. We found that complexity is more pronounced in positions than in lengths. A machine learning tool clustered the retrieved information to statistically capture chromosome functionality and differentiate between the subsystems of positions and lengths.
Keywords:
human endogenous retroviruses
; complexity
; phase space
; q-entropic index
1. Introduction
The DNA structure in the human genome is the outcome of evolutionary processes governed by the synchronization of biological and environmental components driving the system near or far from equilibrium (Bundschuh, 2006; Wong, 2020; Basu, 2021). The redundancy of information stored in the DNA structure is reflected in its sequence segments following q-Gaussian distributions (Pavlos, 2015; Karakatsanis, 2018; 2021, Correia, 2022, Tsallis, 2022). Changes in the underlying information landscape are detectable via Machine Learning (ML) models with supervised or unsupervised learning (Manogaran et al., 2018; Washburn et al., 2019; Varma et al., 2019; Frey et al., 2019; Libbrecht and Noble, 2015; Karakatsanis et al., 2021).
The embodiment of retroviral DNA sequences into the human genome represents a crucial and significant research area. In this direction, the authors of Gonzalez-Cao et al. (2016) explored the correlation between Human Endogenous Retroviruses (ERVs) and human cancer types, including melanoma, breast cancer, germ cell tumors, renal cancer, and ovarian cancer, which express HERV proteins, primarily HERV-K (HML6) and HERV-K (HML2). In ref Alldredge et al. (Alldredge, 2023) investigated the expression of ERVs in cervical cancers, using publicly available RNA-seq data from 63 cervical cancer patients. ERV expression signatures in tumor biopsies may therefore be useful to help identify patients at greater risk of recurrence. Calero-Layana et al. (Calero-Layana, 2022) investigated the evolutionary history of endogenous retroviruses associated with five human genes (INPP5B, DET1, PSMA1, USH2A, and MACROD2), which are located within intron sections. They proposed that these elements play a relevant role in gene expression regulation for tumorigenesis control. Chuong (Chuong, 2018) found that ERVs implicate an extensive yet understudied role for retroviruses in shaping the evolution of placental gene regulatory networks. Kojima et al. (Kojima, 2021) applied machine learning to analyze endogenous RNA virus sequence signatures, enabling the identification of viruses in the human genome that are either undetected or extinct. Jansz and Faulkner (Jansz and Faulkner, 2021) explored the ERV co-option in development and innate immunity, the aberrant contribution of ERVs to tumorigenesis, and the wider biomedical potential of therapies directed at ERVs. Vargiu et al. (Vargiu, 2016) conducted a systematic study on the human ERV classification and characterization. Moreover, Russ and Iordanskiy studied the implications of HERVs in relation to innate immunity and their association with various pathological disease states. In a very recent study Ivancevic et al. (Ivancevic, 2024) showed that endogenous retroviruses mediate transcriptional rewiring in response to oncogenic signaling in colorectal cancer.
All previous studies in retroviral DNA means that the spatial organization which produced the spatial information of DNA can be characterized by complex character and is affected by the sub-set of retroviral DNA. The observed spatial organization indicates structured, nonrandom distributions of ERV elements within genomic DNA. The complexity metrics used reveal patterns exhibiting fractal and multifractal characteristics. These features align with the concept of strange attractors from nonlinear dynamics, suggesting complex, self-organizing genomic arrangements. This opens the scientific field to study the contribution of the sub-set retroviral DNA in the human genome.
In this study we measured the spatial organization and the non-extensive statistical characteristics in the retroviral DNA Human Endogenous Retro Viruses (HERV) database of the human genome studying the distribution of the position distance and the length of the ERV elements. Spatial organization refers explicitly to the positional arrangements and distribution patterns of ERV elements across chromosomes. The HERV database is a comprehensive, curated repository containing detailed information about retroviral elements integrated into the human genome, including their genomic location, structural composition, and sequence characteristics.
Following the ref Pavlos et all (Pavlos, 2015), we consider a DNA walker, showing that the step size distribution encodes all relevant information. We introduced a complexity factor (COFA) (Karakatsanis, 2021), incorporated the Hurst exponent (Weron, 2002) and the q-entropic index, which underlies nonextensive statistical mechanics (Tsallis, 1988; 2004; 2009), and explored, using machine learning techniques, whether it can summarize common patterns across chromosomes.
The principal finding of this study is the identification of structured complexity and significant nonrandom patterns in the positions and lengths of ERV elements in the genome. This structured complexity is measurable using complexity metrics (Hurst exponent, Tsallis q-index, and COFA index). Such complexity potentially impacts genomic stability, functional adaptability, and evolutionary processes, highlighting the biological significance of ERV distribution patterns.
2. Theoretical Framework
2.1. Nonrandom DNA Walker
Let d be a collection of ordered coordinate centers representing molecular buildings blocks of a DNA molecule. d is the dimension of the embedding space and may be adjusted according to the observer’s scopes. Ordering means that the sequence i=0,1,...,N is the outcome of some optimization process running across an evolutionary time scale T.
The interevent vector, i.e., the vector connecting any pair of ordered A coordinates reads (Pavlos, 2015):
, where is some arbitrary norm operation, is intuitively understood as the size of the ’step’ that a DNA walker undertakes in the abstract configuration DNA space.
Let now denote the probability distribution function of the step size, r, at a given T. Note that for clarity and ease of reading, the subscript i is omitted in this instance and thereafter.
To define a dynamic equation for p, we base our approach on the following two assumptions.
First, we assume the influence of a linear constraint,
biasing the DNA walker towards shorter ’jumps’. Shorter steps restrict the DNA walker’s ability to traverse the genomic landscape swiftly, thereby limiting its exploration of distant configurations. While this reduced mobility may slow adaptation to dynamic environments, it simultaneously promotes the stability of existing, well-adapted functions by curbing excessive exploration and minimizing the risk of harmful changes. Consequently, γ reflects a delicate balance between evolutionary adaptability and the maintenance of functional robustness in the DNA system.
Second, we assume an isotropic diffusive force that ’disorients’ the DNA walker. Diffusion acts here as a moderator of the DNA walker’s motion by counteracting the bias introduced by (2). This ensures a nuanced exploration of DNA configuration space, where both localized and distant regions are probabilistically accessible, preventing the walker from becoming trapped in specific regions of the configuration space.
Given the pair of assumptions outlined above, the dynamics of p across T can be described by the following Fokker-Planck equation:
where D>0 is the diffusion coefficient, i.e., the ’disorientation strength’. Note that (3) describes a Uhlenbeck-Ornstein process initiated for δ(r0) (Tsallis & Bukman, 1995, Tsallis, 2009). q is the so-called q-entropic index introduced by C. Tsallis (Tsallis, 1998).
Its biophysical role is discussed below.
Solving 3 for p, yields (Tsallis & Bukman, 1995, Tsallis, 2009):
with,
- ,
1/β is the effective temperature of the DNA walk. Note that negative effective temperatures are also possible. This is rationalized on the basis that the DNA configuration space may be constrained within specific boundaries due to evolutionary pressures and/or thermodynamic limitations associated with DNA crumbling.
- Z is the strictly positive normalization function (partition sum) guaranteeing that,
- β and A are co-determined by the following equation:
To guarantee that , the sign of C0 is adjusted by requiring that β0 < 0 and β0 > 0 for 2 < q < 3 and 1<q <2, respectively.
For a sufficiently long evolutionary trajectory (i.e., for ), (4) can be written as:
with
- .
We notice that the amplitude of the absolute effective temperature is determined is proportional to . This implies that ’hot’ regions of the DNA configuration space are those having a high likelihood to be revisited, since a large value of γ (and/or a small value of D) discourages configuration exploration.
Also, (6) can be obtained as the solution of an optimization process where the following entropy functional:
is maximized (Tsallis, 2009). In the light of (7), it is clarified that q is indeed an entropic index.
- Generally, q can be understood as the degree of nonrandomness of the ordering process under scrutiny since for q → 1 the Boltzmann-Gibbs entropy functional is obtained:
with
- ,
- ,
indicating that as tend to be randomly ordered or equivalently that the DNA walker explores the configuration space in a nearly random fashion.
2.2. Data Acquisition
2.2.1. HERV Database
The Human Endogenous Retro Viruses database (HERVd) (see https://herv.img.cas.cz/) provides complex information on and analysis of retroviral elements found in the human genome. It can be used for searches of individual ERV families, identification of ERV parts, graphical output of ERV structures, comparison of ERVs and identification of retrovirus integration sites (Paces 2002; 2004).
2.2.2. Construction of Data
For each chromosome, we created some sequences from ERV elements, such as the ‘position distance’, and the ‘length’. The ‘position distance’ raw data (Figure 1a) corresponds to the distance between the start point of two consecutive repeats and the ‘length’ raw data (Figure 2a) corresponds to the length of each repeat. The idea here is to assess whether the location of each element and its length follow any pattern identifiable by the complexity metrics. Evaluating the patterns in positions and lengths of ERV elements through complexity metrics provides potential roles these elements may have in gene regulation and chromosomal stability.
4. Results
4.1. Hurst Exponent
The Hurst exponent was estimated, for both ‘position distance’ and ‘length’ sequences and for each chromosome. Figure 2 presents the estimated values of the Hurst exponent. The blue line corresponds to the ‘position distance’ while the orange one to the ‘length’ sequence.
A small value of Hurst exponent shows a higher fractal dimension and a rougher surface. Biologically, fractal dimension characterizes the complexity or irregularity of genomic element arrangements. A lower fractal dimension indicates a smoother, structured genomic landscape, likely associated with regions of high regulatory or functional importance. In contrast, higher fractal dimensions suggest complex, irregular arrangements, reflecting dynamic genomic interactions.
A larger Hurst exponent shows a smaller fractional dimension and a smoother surface. The values of the Hurst exponent range between 0 and 1. A value of 0.5 indicates a true random process (a Brownian raw data). A Hurst exponent value, between 0.5 and 1 indicates “persistent behavior”. A Hurst exponent value between 0 and 0.5 indicates “anti-persistent behavior”. As we observe from Figure 2, all chromosomes characterized by “persistent behavior”. Persistent behavior describes the sustained correlation of sequential genomic events or positions across genomic distances, indicating nonrandom, structured patterns. This persistence biologically implies evolutionary constraints and genomic functional stability, essential for maintaining genomic integrity and regulatory mechanisms.
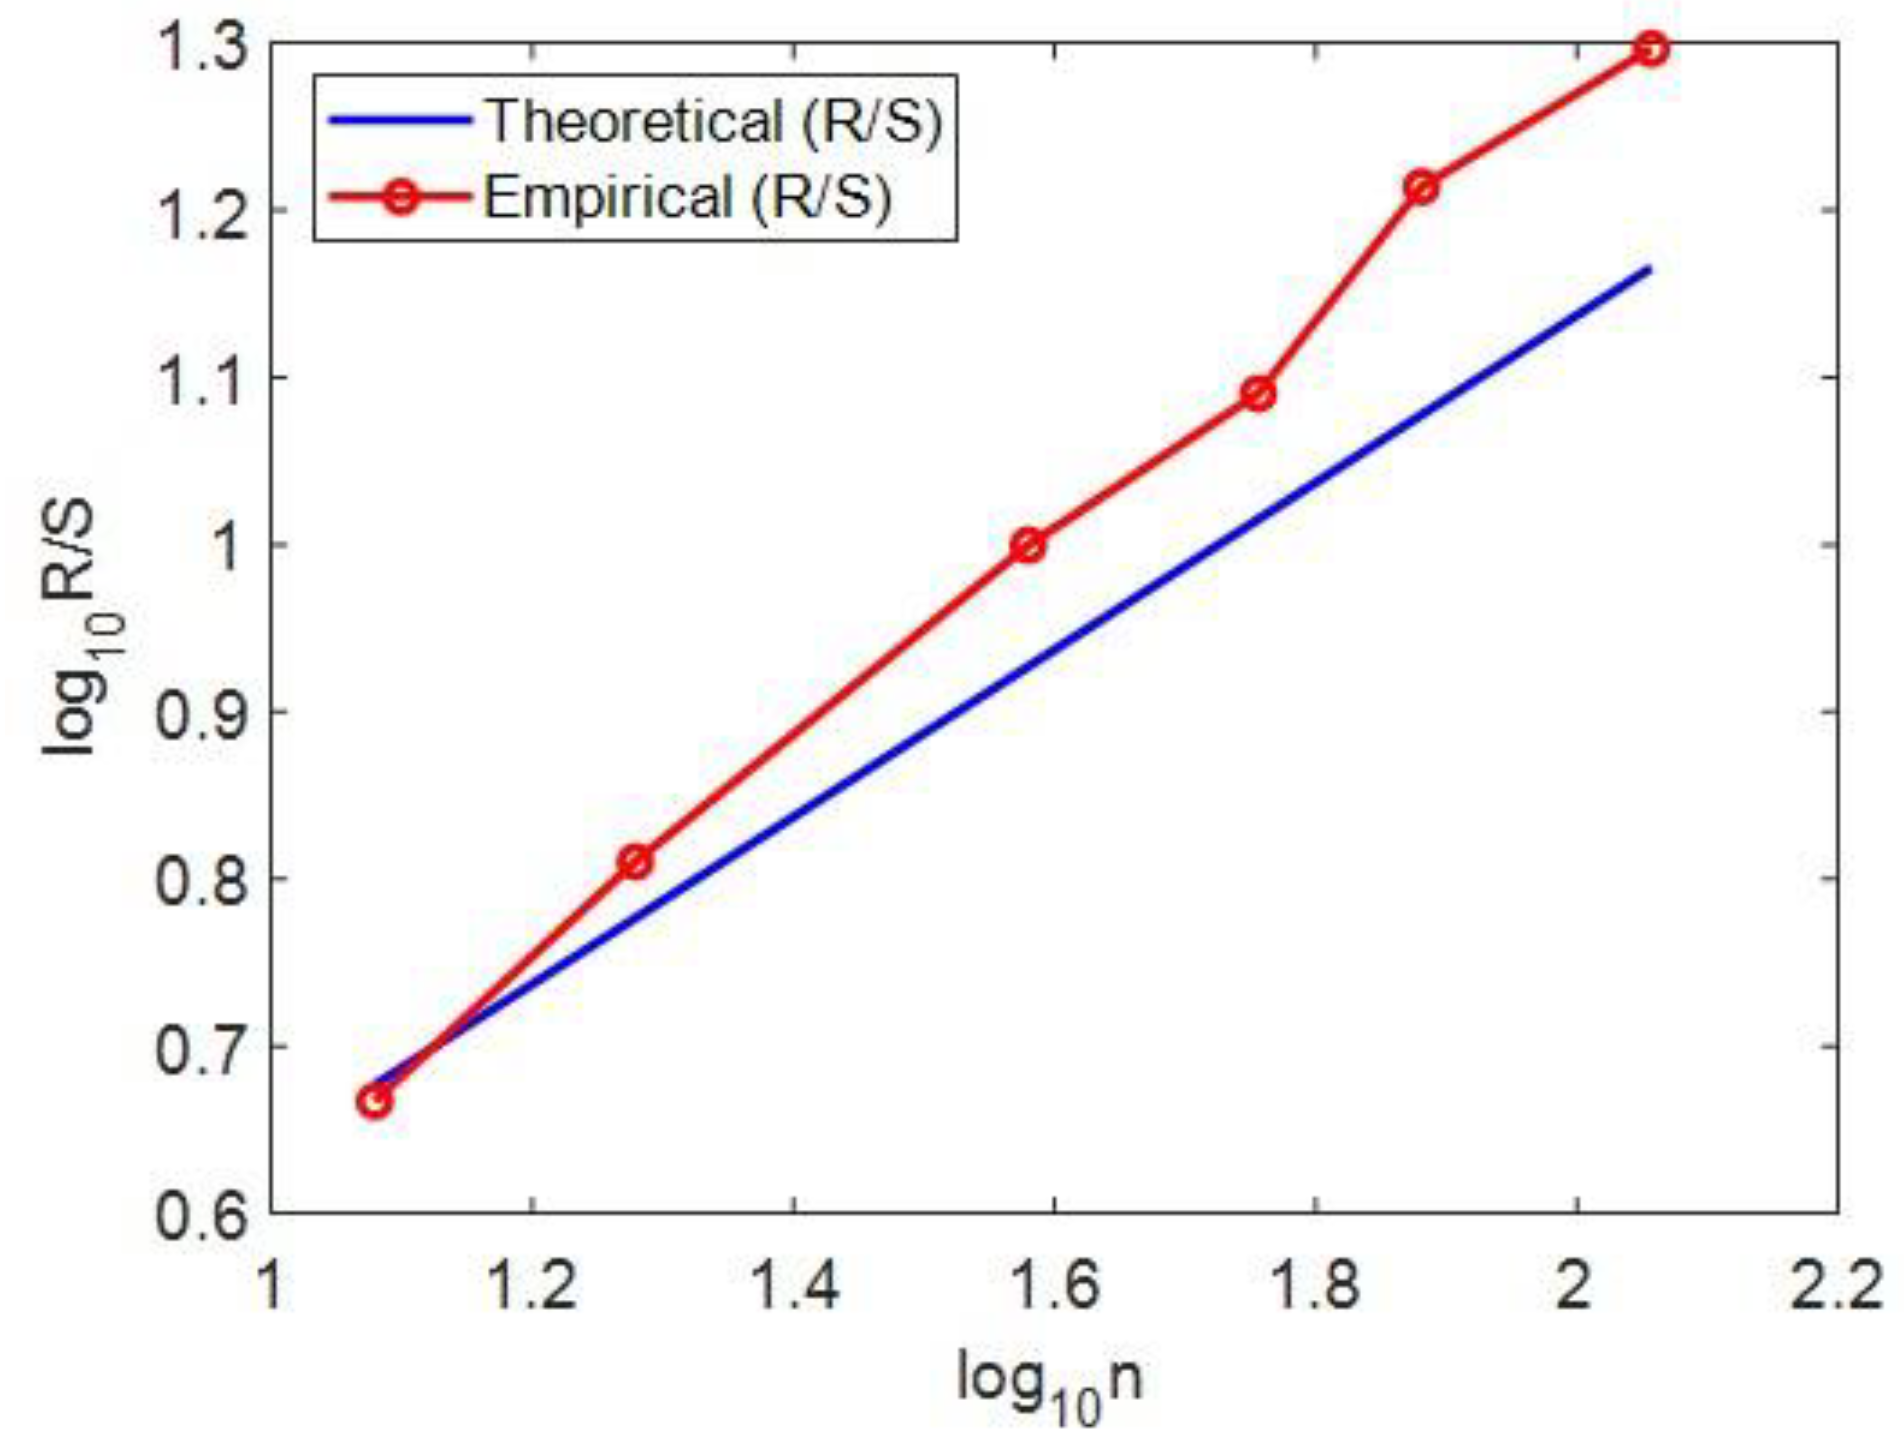
For the estimation of the Hurst exponent in this study we use Rescaled Range Analysis (R/S) (Weron, 2002). There is a clear discrimination profile of hurst in positions distance data and length data. The independent two-sample t-test was employed to statistically compare complexity metrics between 'position distance' and 'length' sequences. In t-test calculator, the t-value is 8.06309. The p-value is < .00001. The result is significant at p < .05. The p-values obtained (< 0.05) indicate statistically significant differences, validating distinct complexity profiles between these two types of genomic sequences.
Figure 3.
Example calculation of the Hurst exponent for chromosome 6, demonstrating the method used (Rescaled Range Analysis, R/S) and its interpretation for genomic complexity.
Figure 3.
Example calculation of the Hurst exponent for chromosome 6, demonstrating the method used (Rescaled Range Analysis, R/S) and its interpretation for genomic complexity.
4.2. q Stationary (Tsallis)
In Figure 4, we present the estimation of qstat index for both sequences and for all chromosomes. Concerning the qstat index, as one can see, the value in all chromosomes in both sequences are higher than 1 and suggests the presence of long-range correlations, a distinctive property of open nonequilibrium systems, with underlying spatiotemporal organization characterized by non-Gaussian (q Gaussian) distributions. The emphasis on non-equilibrium open systems illustrates that genomic organization is dynamically maintained, shaped by continuous external and internal genomic interactions, reflecting the ongoing adaptive and evolutionary processes.
As we observe, the qstat index in ‘position distance’ sequence is higher than the ‘length’ sequence for all chromosomes. This means that the non-extensive character of the spatial organization is higher in ‘position distance’ than the ‘length’ sequence and presents stronger long-range correlations in ‘position distance’ sequence. Long-range correlations describe dependencies and interactions among genomic positions widely separated within chromosomes. Biologically, these correlations imply that distant genomic regions influence each other's functional and structural characteristics, potentially affecting gene regulation, chromosomal stability, and adaptive genomic responses.
Moreover, in some chromosomes, we observe a significant differentiation of the qstat index between the two sequences (i.e. Chr 15, Chr21, Chr 22), while there is a high variation of the qstat index in Chromosomes 15-22 between the two sequences. There is a clear discrimination profile of qstat in positions distance data and length data. In t-test calculator, the t-value is 10.38241. The p-value is < .00001. The result is significant at p < .05. In Figure 5 we present a sample of the qstat index calculation for chromosome 6.
4.3. Complexity Factor (COFA)
The Complexity Factor (COFA) synthesizes diverse complexity metrics, offering a comprehensive measure of genomic organization connecting the real space with the phase space of the DNA structure. In Figure 6, the estimation of the technical term COFA per chromosome for both sequences is presented. There is a clear discrimination profile of COFA in positions distance data and length data. In t-test calculator, the t-value is 2.4071. The p-value is < .00001. The result is significant at p < .05.
4.4. K-Means Clustering
In this section we applied the unsupervised k-means clustering as an input in ML algorithms with the thought to see if the variation of the metrics that correspond to each HERVd entity for all chromosomes can be identified as a common dynamical feature which is characterizing these geometrical indices positions distance and lengths. We prepared the model using a distinct set of complexity metrics every time and we run the clustering process. To evaluate each clustering process, we used the Davies-Bouldin (DB) index (Davies, 1979). The DB index provide an internal evaluation schema (the score is based on the cluster itself and not on external knowledge such as labels) and is bounded from 0 to 1, where a lower score is better.
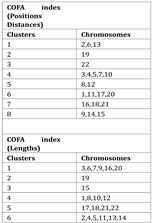
In Figure 7, the DB performance of clustering process for the Complexity Factor (COFA) position distance and lengths for different values of k parameter is presented. In COFA positions we calculate the best (lower) DB index performance for k = 8 parameter. Similarly, in COFA lengths we calculate the best (lower) DB index for k=6.
In Table 1 the clusters for the best DB index performance are presented. Each cluster included a set of different chromosomes with a common geometrical center of the variations of the COFA index. With this method of clustering based on the COFA index we discriminated sets of chromosomes, which appear to have similar complex behavior on position distance or lengths of retroviral elements as we observe in Figure 8.
The K-means clustering based on COFA values reveals groups of chromosomes with shared complexity profiles, reflecting potential structural, regulatory, or evolutionary constraints. These biologically meaningful clusters offer valuable insights into genomic architecture, suggest common functional or evolutionary patterns, and support hypotheses about coordinated gene regulation and evolutionary dynamics.
5. Discussion
In this study we analyze the statistical characteristics of the Human Endogenous Retro Viruses database (HERVd) focusing on the subcase of positions distances and lengths of ERVs elements, based on complexity metrics (Hurst exponent, q stationery index of Tsallis statistics and COFA technical index) for the purpose of understanding the degree of complexity behavior and internal organization of chromosomes in relation to the embodiment of retroviral DNA into the human genome. The internal organization refers to structured interactions and dependencies within the genome and the complexity behavior indicates measurable patterns of nonrandomness and structured organization that reflect underlying regulatory or adaptive genomic processes.
The analysis was based upon complexity metrics to phase or physical space with the estimation of Hurst exponent, q-stationary of Tsallis and COFA index and presented variations in the degree of complexity behavior per chromosomes in relation with the positions and lengths of ERVs elements. This analysis shows memory effects and long-range correlations in the distributions of ERVs elements in all chromosomes regarding their positions and lengths within the chromosomes. "Memory" in genomic sequences refers to the sustained positional correlations observed over long genomic distances, indicating functional links between distant regions potentially mediated by regulatory elements or structural constraints. This phenomenon, along with the "multiplicity" of roles that these positions can assume across various regulatory and structural contexts, plays a crucial role in maintaining genomic stability, adaptability, and overall functionality.
Moreover, the findings of this study reveal that the geometry of ERVs elements (positions and lengths) create a complex environment that communicates informationally with the spatial information of DNA as a separate subsystem that affects the biological functionality of the genome. Structured genomic complexity, characterized by ERV element positions and lengths, influences genomic functionality, potentially modulating gene expression and other cellular regulatory processes.
In this direction, complexity theory and computational tools can lead to further decoding of hidden information within the DNA. In addition, the Tsallis theory were used in this study showed the existence of the non-Gaussian character regarding the positions and lengths of ERVs elements and the embodiment of retroviral 261 DNA into the human genome.
The results of the Hurst exponent reveal that the size distributions of positions distance and lengths of retroviral elements in the genome are characterized by memory character or persistent behavior in all chromosomes. Specifically, this memory character has a differential profile so much between positions and lengths of retroviral elements among all chromosomes as well. It is observed that position distance retroviral elements maintain a higher Hurst exponent in all chromosomes suggesting that the distribution of position distance retroviral elements possess an enriched multiplicity character with a high degree of organization, as opposed to lengths of retroviral elements that maintain a lower degree of multiplicity and therefore a lower degree of organization. The above conclusion does not apply for the chromosomes 1,12,17,19,22 where the hurst exponent has approximately the same value. The above, in biological terms, may suggest that the positions of retroviral elements are engaged in multiple structural or functional roles, while lengths of retroviral elements are more limited. The multiplicity and the positional complexity refer to the capability of genomic elements, such as ERVs, to participate in diverse functional or structural roles within genomic contexts, reflecting versatility in regulatory and evolutionary dynamics.
The results of the q stationary reveal that the size distribution of the position distance and lengths of retroviral elements in all chromosomes is characterized by long range correlations. Non-extensive statistical mechanics refers to systems where traditional (extensive) thermodynamic relationships do not scale linearly with system size. In genomic terms, this implies that the observed complexity and correlations extend beyond local genomic segments, indicating widespread genomic interactions.
This non-extensive behavior is stronger in position distance of retroviral elements as compared to lengths of retroviral elements with some degree of variations per chromosome. Similarly, the variations are also significant in position distance data, reflecting long range correlations within chromosomes and specifically in chromosomes 15-22. Both position distance and lengths of retroviral elements distributions are independent of the chromosomal size except chromosomes 15-22. It seems that the long-range correlations are getting stronger in position distance data from the lengths data and specifically in chromosomes 15-22. These results would suggest that the positions distance of retroviral elements is coordinated with the position distance located in other distant regions of the same single chromosome and that all chromosomes have similar interactive structural relationships dictated by the same principles as suggested by the Tsallis q stationary index. The q stationary index clearly demonstrates that there is a coordination of the distributions of the position distance and lengths of retroviral elements within chromosomes characterized by specific profiles.
With COFA index and ML models we identify sets of position distance and lengths of retroviral elements among all chromosomes which present similar complex behavior. These new sets may contain interactions of information among chromosomes based on internal laws and geometrical symmetries that affect the biological functions of the cell. The reference to cellular processes emphasizes that structural genomic features, influenced by ERV distribution, likely affect gene expression and cellular functionality.
In future studies, we plan to analyze genomic information using sliding windows within the framework of Tsallis non-extensive entropy. By applying this lens with varying zoom levels (both zooming in and out), we aim to observe the distribution of complexity metrics and examine how these metrics vary across different regions of DNA chromosomes. Additionally, we will explore how these variations relate to the thermodynamics of the cell, providing insights into the relationship between genetic information and cellular energy.
Supplementary Materials
The following supporting information can be downloaded at the website of this paper posted on Preprints.org. The fundamentals of Complexity theory and the complexity metrics can be found in the accompanying supplemental file.
Author Contributions
L.P.K. and D.S.M. conceptualization; L.P.K. methodology; L.P.K., M.N.X., E.G.P. and G.T. software; L.P.K., E.G.P. and G.T. formal analysis; L.P.K. and E.G.P. investigation; L.P.K., E.G.P. and G.T. resources; L.P.K., and E.G.P. data curation; L.P.K., M.N.X., E.G.P., G.T. and D.S.M. writing-original draft preparation; L.P.K., M.N.X., E.G.P., G.T. and D.S.M. writing-review and editing; L.P.K., E.G.P. and G.T. visualization; L.P.K. and D.S.M. supervision; L.P.K. and D.S.M. project administration. All authors have read and agreed to the published version of the manuscript.
Funding
No funding was received for this study.
Data Availability Statement
All data needed to evaluate the results and conclusions are presented in the main text. Scripts related to this paper are available from the corresponding authors.
Data and Code Availability
The initial data we used in this study are taken from The Human Endogenous Retro Viruses database (HERVd) (see https://herv.img.cas.cz/).
Conflicts of Interest
The authors declare no conflict of interest.
References
- Albuquerque, H. A., Silva, R., & Alcaniz, J. S. (2004). Tsallis Statistics 335 and the Genetic Code. Physics Letters A. 324, 383–390.
- Alldredge, J.; Kumar, V.; Nguyen, J.; Sanders, B.E.; Gomez, K.; Jayachandran, K.; Zhang, J.; Schwarz, J.; Rahmatpanah, F. Endogenous Retrovirus RNA Expression Differences between Race, Stage and HPV Status Offer Improved Prognostication among Women with Cervical Cancer. Int. J. Mol. Sci. 2023, 24, 1492. [Google Scholar] [CrossRef] [PubMed]
- Basu, A.; Bobrovnikov, D.G.; Qureshi, Z.; Kayikcioglu, T.; Ngo, T.T.M.; Ranjan, A.; Eustermann, S.; Cieza, B.; Morgan, M.T.; Hejna, M.; et al. Measuring DNA mechanics on the genome scale. Nature 2020, 589, 462–467. [Google Scholar] [CrossRef] [PubMed]
- Bundschuh, R.; Gerland, U. Dynamics of intramolecular recognition: Base-pairing in DNA/RNA near and far from equilibrium. Eur. Phys. J. E 2006, 19, 319–329. [Google Scholar] [CrossRef] [PubMed]
- Calero-Layana, M., L´opez-Cruz, C., Ocan˜a, A., Tejera, E., & Armijos Jaramillo, V. (2022). Evolutionary analysis of endogenous intronic retroviruses in primates reveals an enrichment in transcription binding sites associated with key regulatory processes. PeerJ. 10, e14431.
- Chuong, E.B.; Elde, N.C.; Feschotte, C. Regulatory activities of transposable elements: from conflicts to benefits. Nat. Rev. Genet. 2016, 18, 71–86. [Google Scholar] [CrossRef] [PubMed]
- Chuong, E.B. The placenta goes viral: Retroviruses control gene expression in pregnancy. PLOS Biol. 2018, 16, e3000028. [Google Scholar] [CrossRef]
- Correia, J.; Silva, R.; Anselmo, D.; da Silva, J. Bayesian inference of length distributions of human DNA. Chaos, Solitons Fractals 2022, 160. [Google Scholar] [CrossRef]
- Davies, D.L. , and Bouldin, D.W. (1979). A cluster separation measure, IEEE transactions on Pattern Analysis and Machine Intelligence PAMI-1, 224-227.
- Ferri, G.L. , Reynoso Savio, M.F., and Plastino, A. (2010). Tsallis’ q triplet and the ozone layer. Physica A: Statistical Mechanics and Its Applications 389, 1829–1833.
- Frey, B.J. , Delong, A.T., and Xiong, H.Y. (2019). U.S. Patent Application No. 16/179, 280.
- Gonzalez-Cao, M. , Iduma, P., Karachaliou, N., Santarpia, M., Blanco, J., & Rosell, R. (2016). Human endogenous retroviruses and cancer. Cancer biology & medicine, 13, 483.
- Ivancevic, A.; Simpson, D.M.; Joyner, O.M.; Bagby, S.M.; Nguyen, L.L.; Bitler, B.G.; Pitts, T.M.; Chuong, E.B. Endogenous retroviruses mediate transcriptional rewiring in response to oncogenic signaling in colorectal cancer. Sci. Adv. 2024, 10, eado1218. [Google Scholar] [CrossRef]
- Jansz, N.; Faulkner, G.J. Endogenous retroviruses in the origins and treatment of cancer. Genome Biol. 2021, 22, 1–22. [Google Scholar] [CrossRef]
- Nath, A. , Li, W., Wang, T., Doucet-O’Hare, T., & Lee, M. (2019). A novel pathogenic role for “Junk DNA” in neurodegenerative diseases and neurodevelopmental tumors (S29. 006).
- Karakatsanis, L.P.; Pavlos, E.G.; Tsoulouhas, G.; Stamokostas, G.L.; Mosbruger, T.; Duke, J.L.; Pavlos, G.P.; Monos, D.S. Spatial constrains and information content of sub-genomic regions of the human genome. iScience 2021, 24, 102048. [Google Scholar] [CrossRef] [PubMed]
- Karakatsanis, L.; Pavlos, G.; Iliopoulos, A.; Pavlos, E.; Clark, P.; Duke, J.; Monos, D. Assessing information content and interactive relationships of subgenomic DNA sequences of the MHC using complexity theory approaches based on the non-extensive statistical mechanics. Phys. A: Stat. Mech. its Appl. 2018, 505, 77–93. [Google Scholar] [CrossRef]
- Kojima, S.; Yoshikawa, K.; Ito, J.; Nakagawa, S.; Parrish, N.F.; Horie, M.; Kawano, S.; Tomonaga, K. Virus-like insertions with sequence signatures similar to those of endogenous nonretroviral RNA viruses in the human genome. Proc. Natl. Acad. Sci. 2021, 118. [Google Scholar] [CrossRef] [PubMed]
- Li, W. (1992). Generating Nontrivial Long-Range Correlations and 1/f Spectra by Replication and Mutation. Physical Review A, 43, 5240-5260.
- Libbrecht, M.W.; Noble, W.S. Machine learning applications in genetics and genomics. Nat. Rev. Genet. 2015, 16, 321–332. [Google Scholar] [CrossRef] [PubMed] [PubMed Central]
- Manogaran, G.; Vijayakumar, V.; Varatharajan, R.; Kumar, P.M.; Sundarasekar, R.; Hsu, C.-H. Machine Learning Based Big Data Processing Framework for Cancer Diagnosis Using Hidden Markov Model and GM Clustering. Wirel. Pers. Commun. 2017, 102, 2099–2116. [Google Scholar] [CrossRef]
- Paces, Jan, Adam Pavl´ıcek, and V´aclav Paces. ”HERVd: database of human endogenous retroviruses.” Nucleic acids research 30, no. 1 (2002):205-206.
- Paces, Jan, Adam Pavl´ıˇcek, Radek Zika, Vladimir V. Kapitonov, Jerzy Jurka, and V´aclav Paˇces. ”HERVd: the human endogenous retroviruses database: update.” Nucleic acids research 32, no. suppl 1 (2004): D50-D50.
- Pavlos, G.; Karakatsanis, L.; Iliopoulos, A.; Pavlos, E.; Xenakis, M.; Clark, P.; Duke, J.; Monos, D. Measuring complexity, nonextensivity and chaos in the DNA sequence of the Major Histocompatibility Complex. Phys. A: Stat. Mech. its Appl. 2015, 438, 188–209. [Google Scholar] [CrossRef]
- Russ, E.; Iordanskiy, S. Endogenous Retroviruses as Modulators of Innate Immunity. Pathogens 2023, 12, 162. [Google Scholar] [CrossRef]
- Tsallis, C. (2004). Dynamical scenario for nonextensive statistical mechanics. In Physica A: Statistical Mechanics and its Applications 340,1–10.
- Tsallis, C. (2009). Introduction to Nonextensive Statistical Mechanics: Approaching a complex world (Springer).
- Tsallis, C. (2022). Entropy. Encyclopedia, 2, 264-300.
- Vargiu, L.; Rodriguez-Tomé, P.; Sperber, G.O.; Cadeddu, M.; Grandi, N.; Blikstad, V.; Tramontano, E.; Blomberg, J. Classification and characterization of human endogenous retroviruses; mosaic forms are common. Retrovirology 2016, 13, 1–29. [Google Scholar] [CrossRef]
- Varma, M.; Paskov, K.M.; Jung, J.-Y.; Chrisman, B.S.; Stockham, N.T.; Washington, P.Y.; Wall, D.P. Outgroup Machine Learning Approach Identifies Single Nucleotide Variants in Noncoding DNA Associated with Autism Spectrum Disorder. Proceedings of the Pacific Symposium. LOCATION OF CONFERENCE, United StatesDATE OF CONFERENCE; pp. 260–271.
- Washburn, J.D.; Mejia-Guerra, M.K.; Ramstein, G.; Kremling, K.A.; Valluru, R.; Buckler, E.S.; Wang, H. Evolutionarily informed deep learning methods for predicting relative transcript abundance from DNA sequence. Proc. Natl. Acad. Sci. 2019, 116, 5542–5549. [Google Scholar] [CrossRef]
- Weron, R. Estimating long-range dependence: finite sample properties and confidence intervals. Phys. A: Stat. Mech. its Appl. 2002, 312, 285–299. [Google Scholar] [CrossRef]
- Wong, F., & Gunawardena, J. (2020). Gene regulation in and out of equilibrium. Annual review of biophysics. 49, 199–226.
Figure 1.
Sample data illustrates (A) position distance (genomic distance between consecutive ERV start points) and (B) length of ERV elements on chromosome 1. These distributions are analyzed to identify complex patterns.
Figure 1.
Sample data illustrates (A) position distance (genomic distance between consecutive ERV start points) and (B) length of ERV elements on chromosome 1. These distributions are analyzed to identify complex patterns.
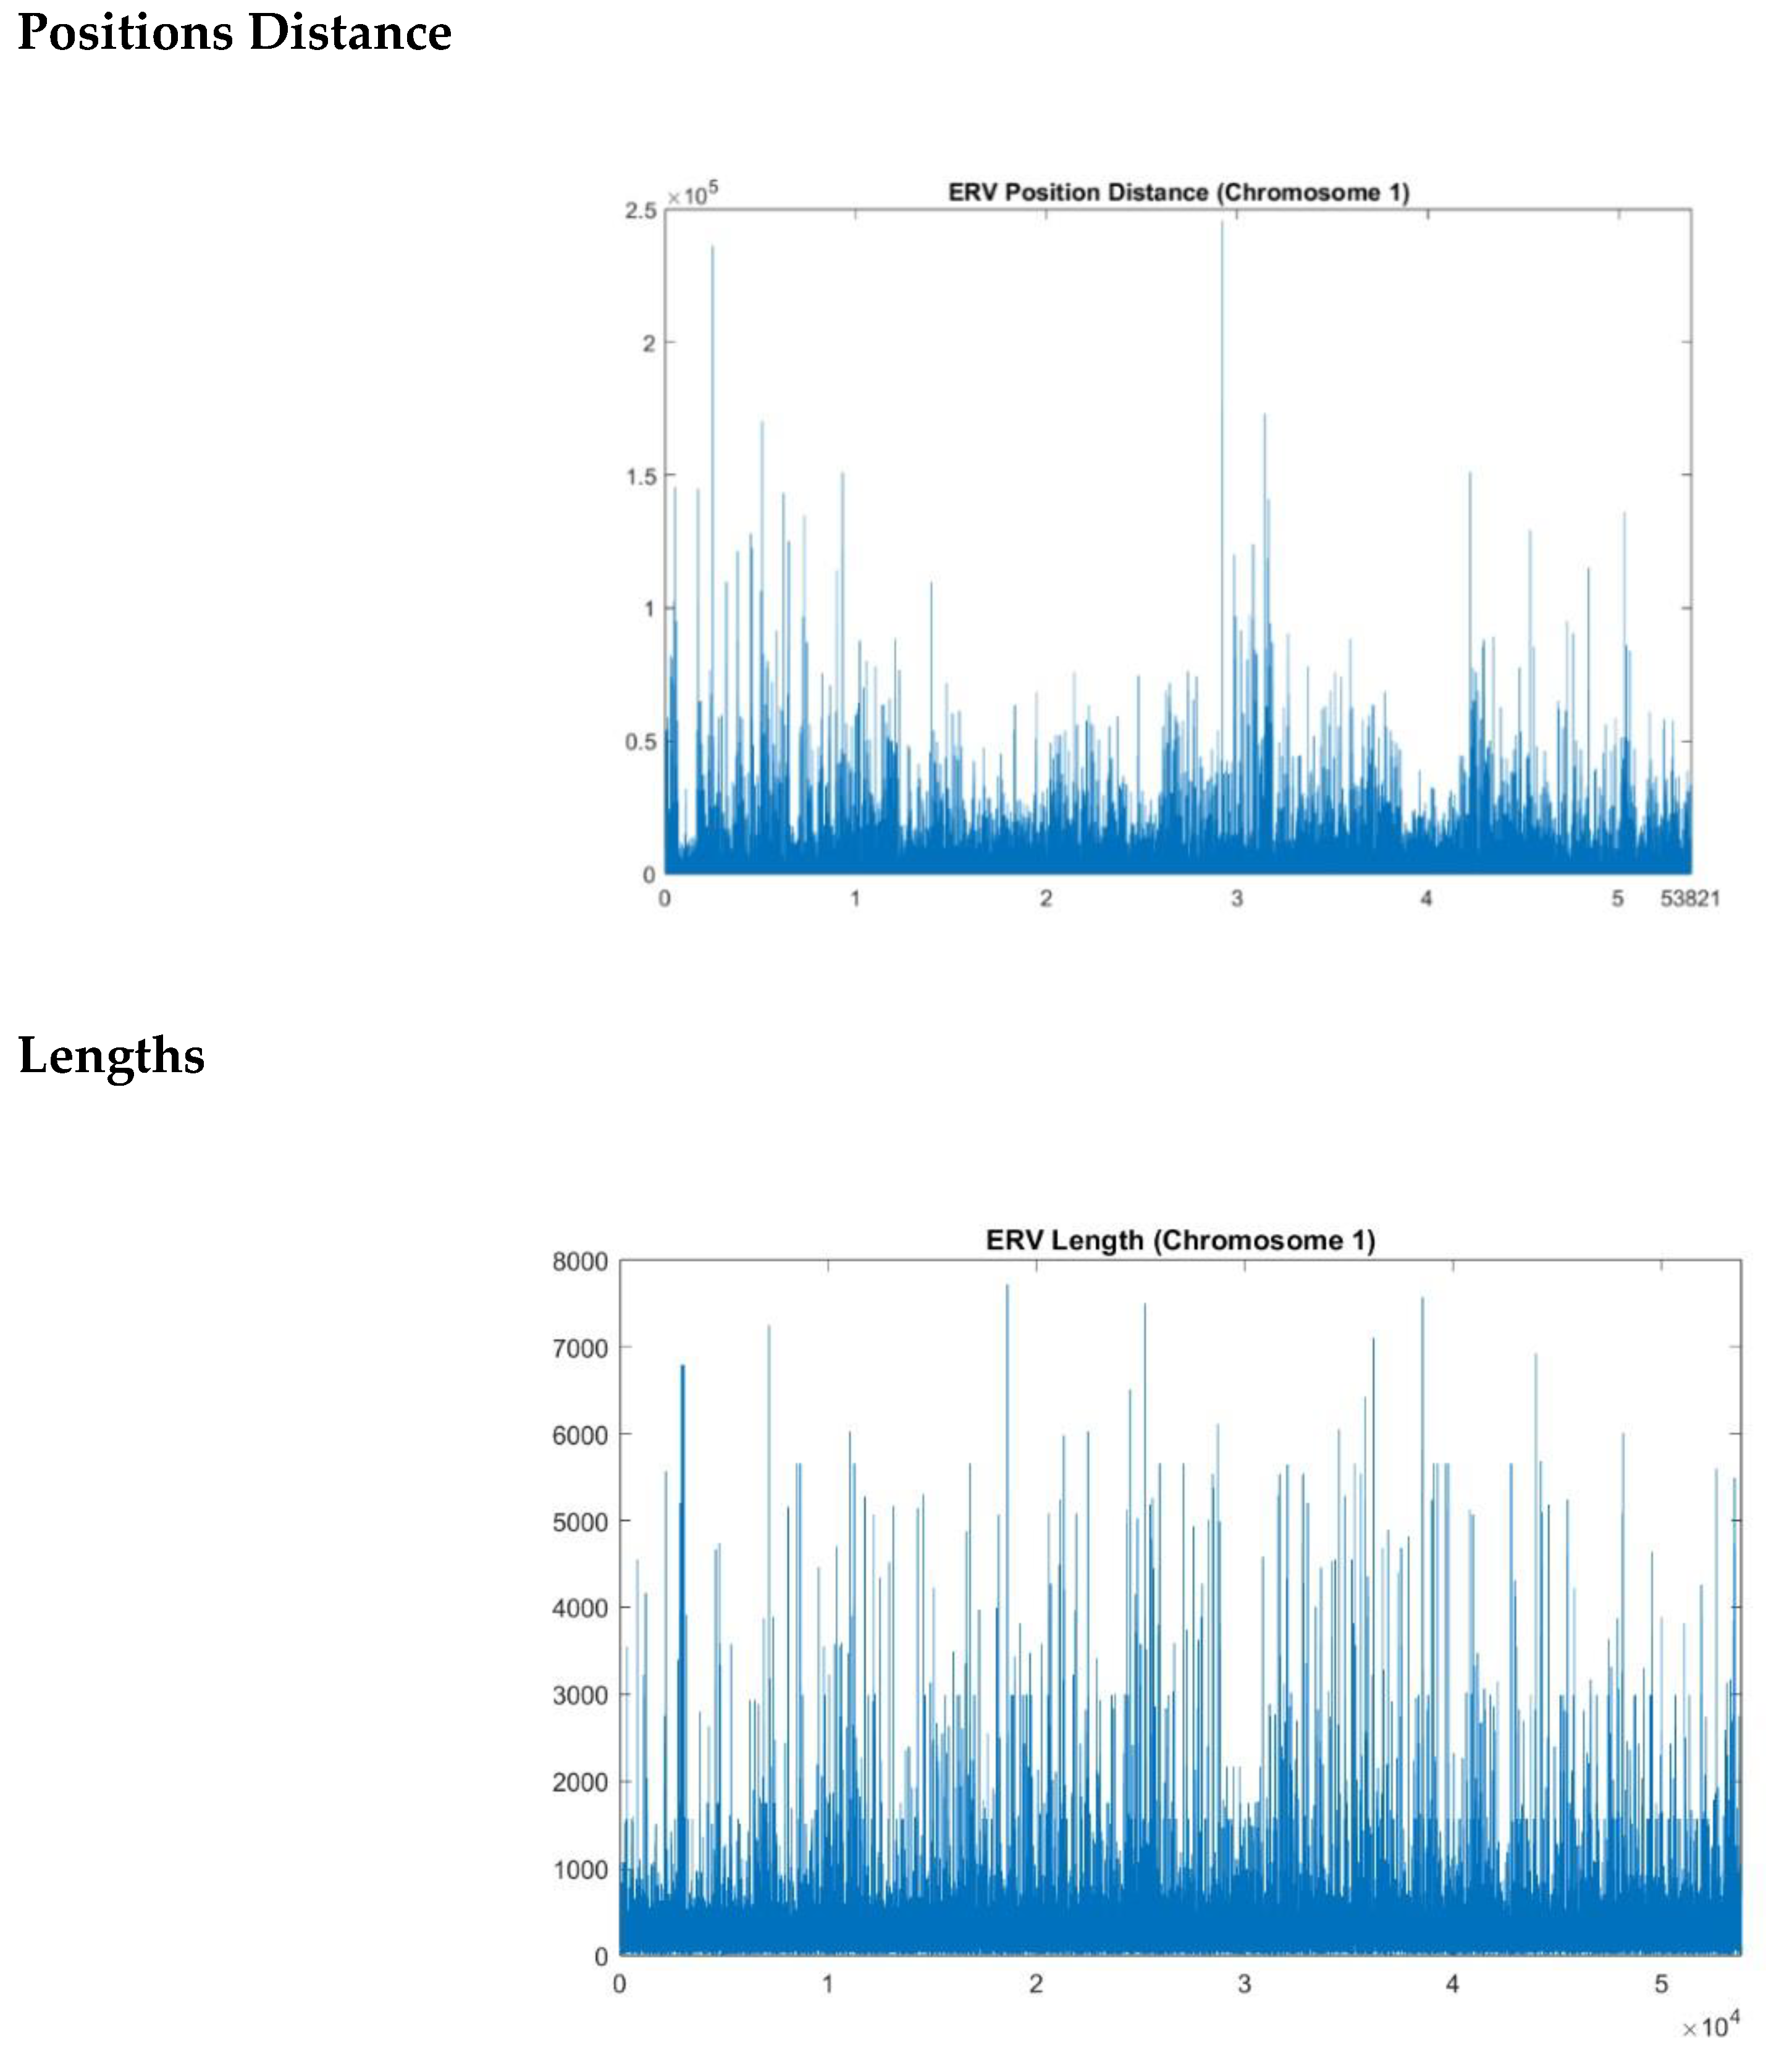
Figure 2.
Estimated Hurst exponent values per chromosome for position distances (blue line) and lengths (orange line) of ERV elements. Values indicate persistent (correlated) behavior with significant differences between sequences, reflecting differential organizational complexity.
Figure 2.
Estimated Hurst exponent values per chromosome for position distances (blue line) and lengths (orange line) of ERV elements. Values indicate persistent (correlated) behavior with significant differences between sequences, reflecting differential organizational complexity.
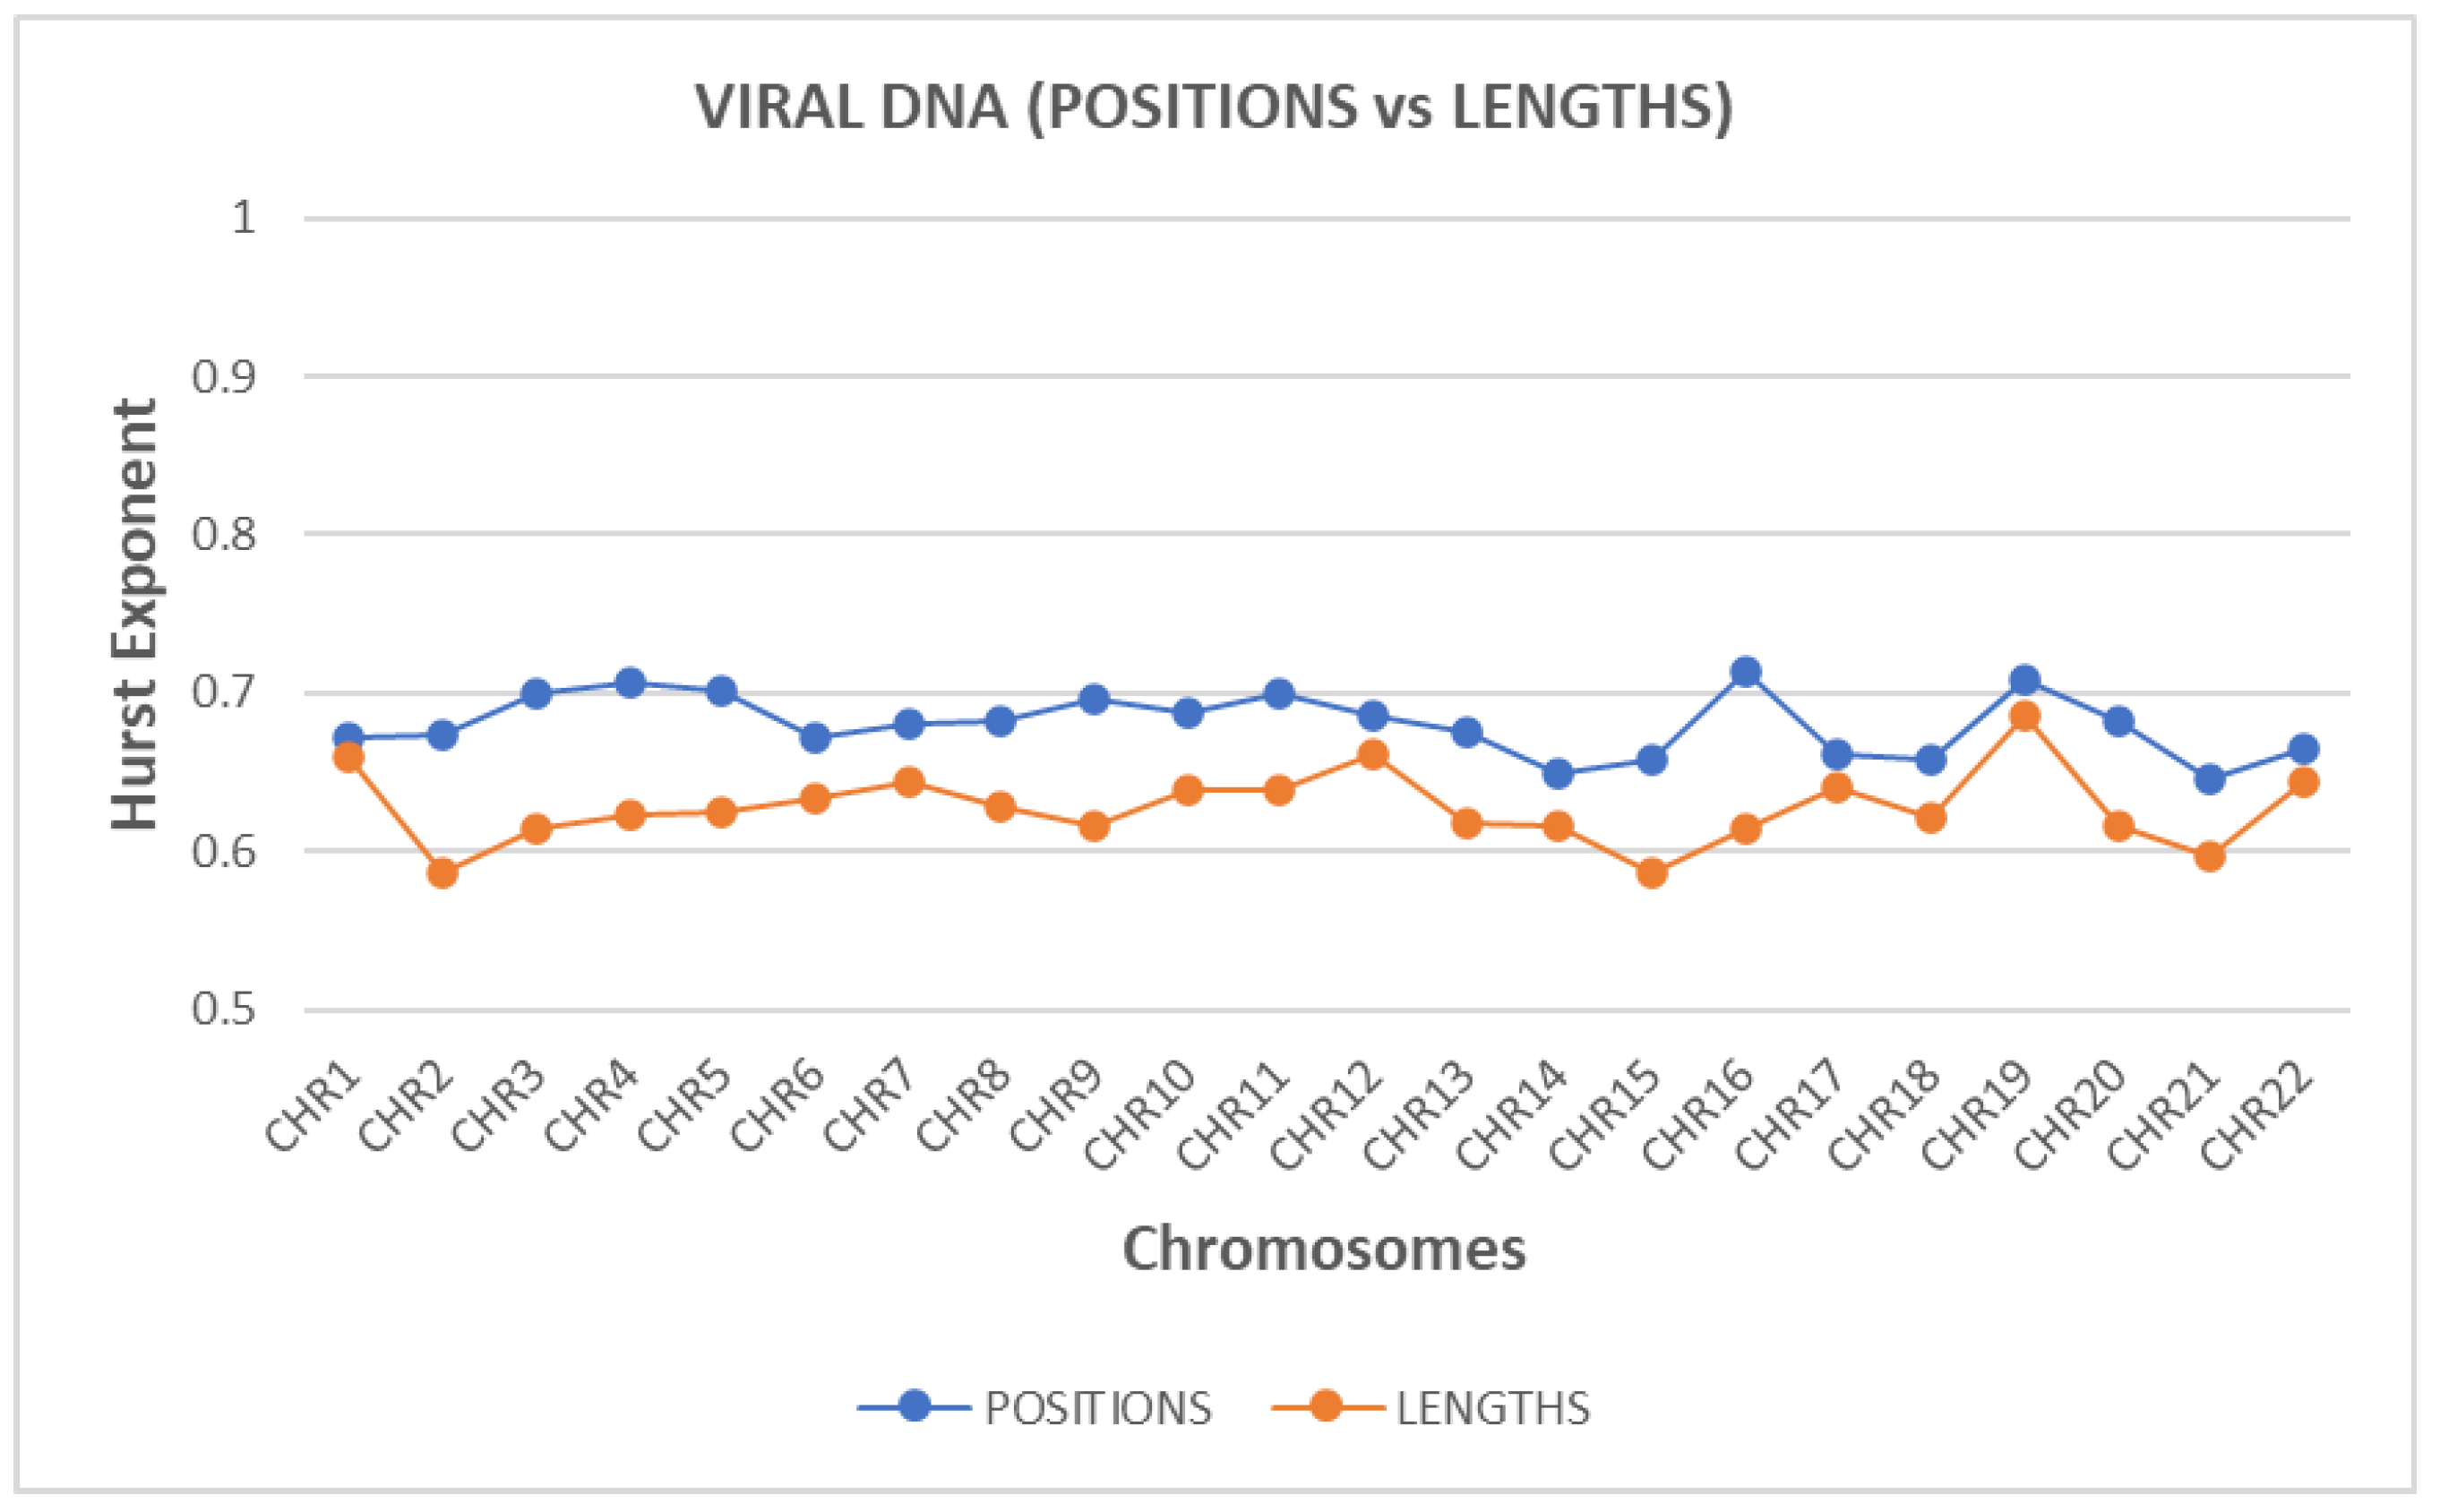
Figure 4.
Estimated qstat index per chromosome, showing higher non-extensive statistical characteristics for position distances compared to lengths, indicative of stronger long-range correlations in genomic ERV distribution.
Figure 4.
Estimated qstat index per chromosome, showing higher non-extensive statistical characteristics for position distances compared to lengths, indicative of stronger long-range correlations in genomic ERV distribution.
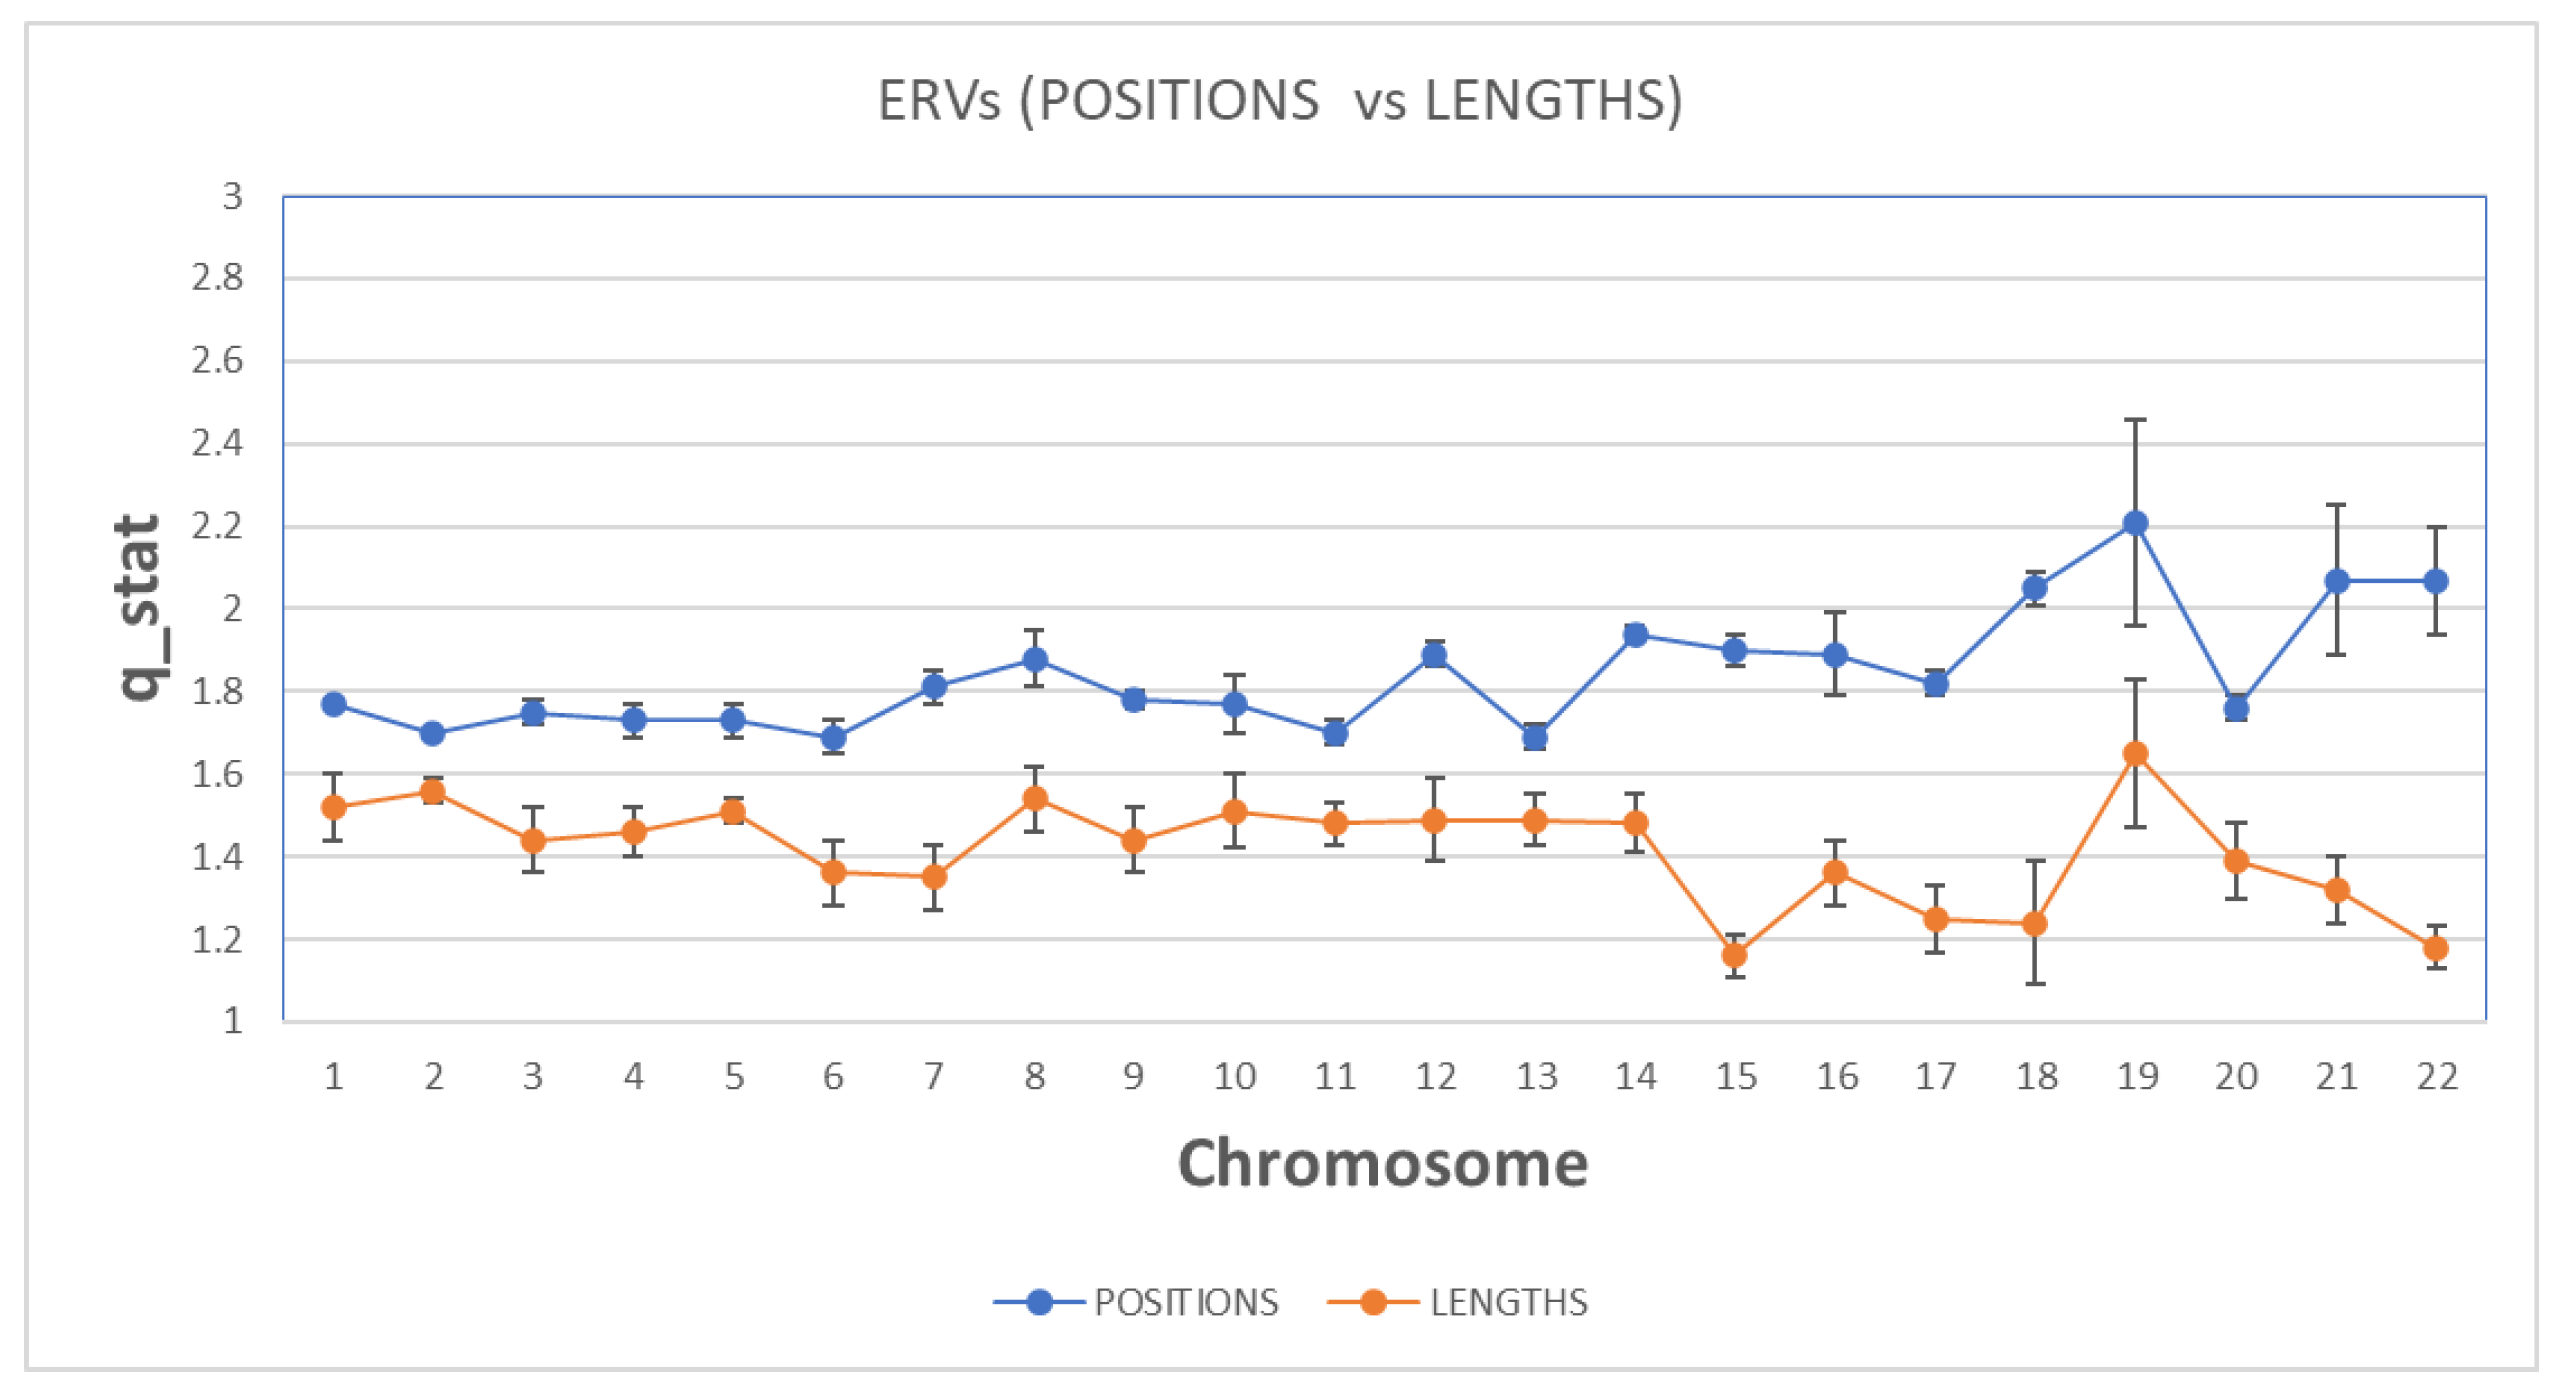
Figure 5.
Sample calculation of the qstat index for chromosome 6, illustrating the methodology and interpretation regarding non-extensive statistical mechanics.
Figure 5.
Sample calculation of the qstat index for chromosome 6, illustrating the methodology and interpretation regarding non-extensive statistical mechanics.
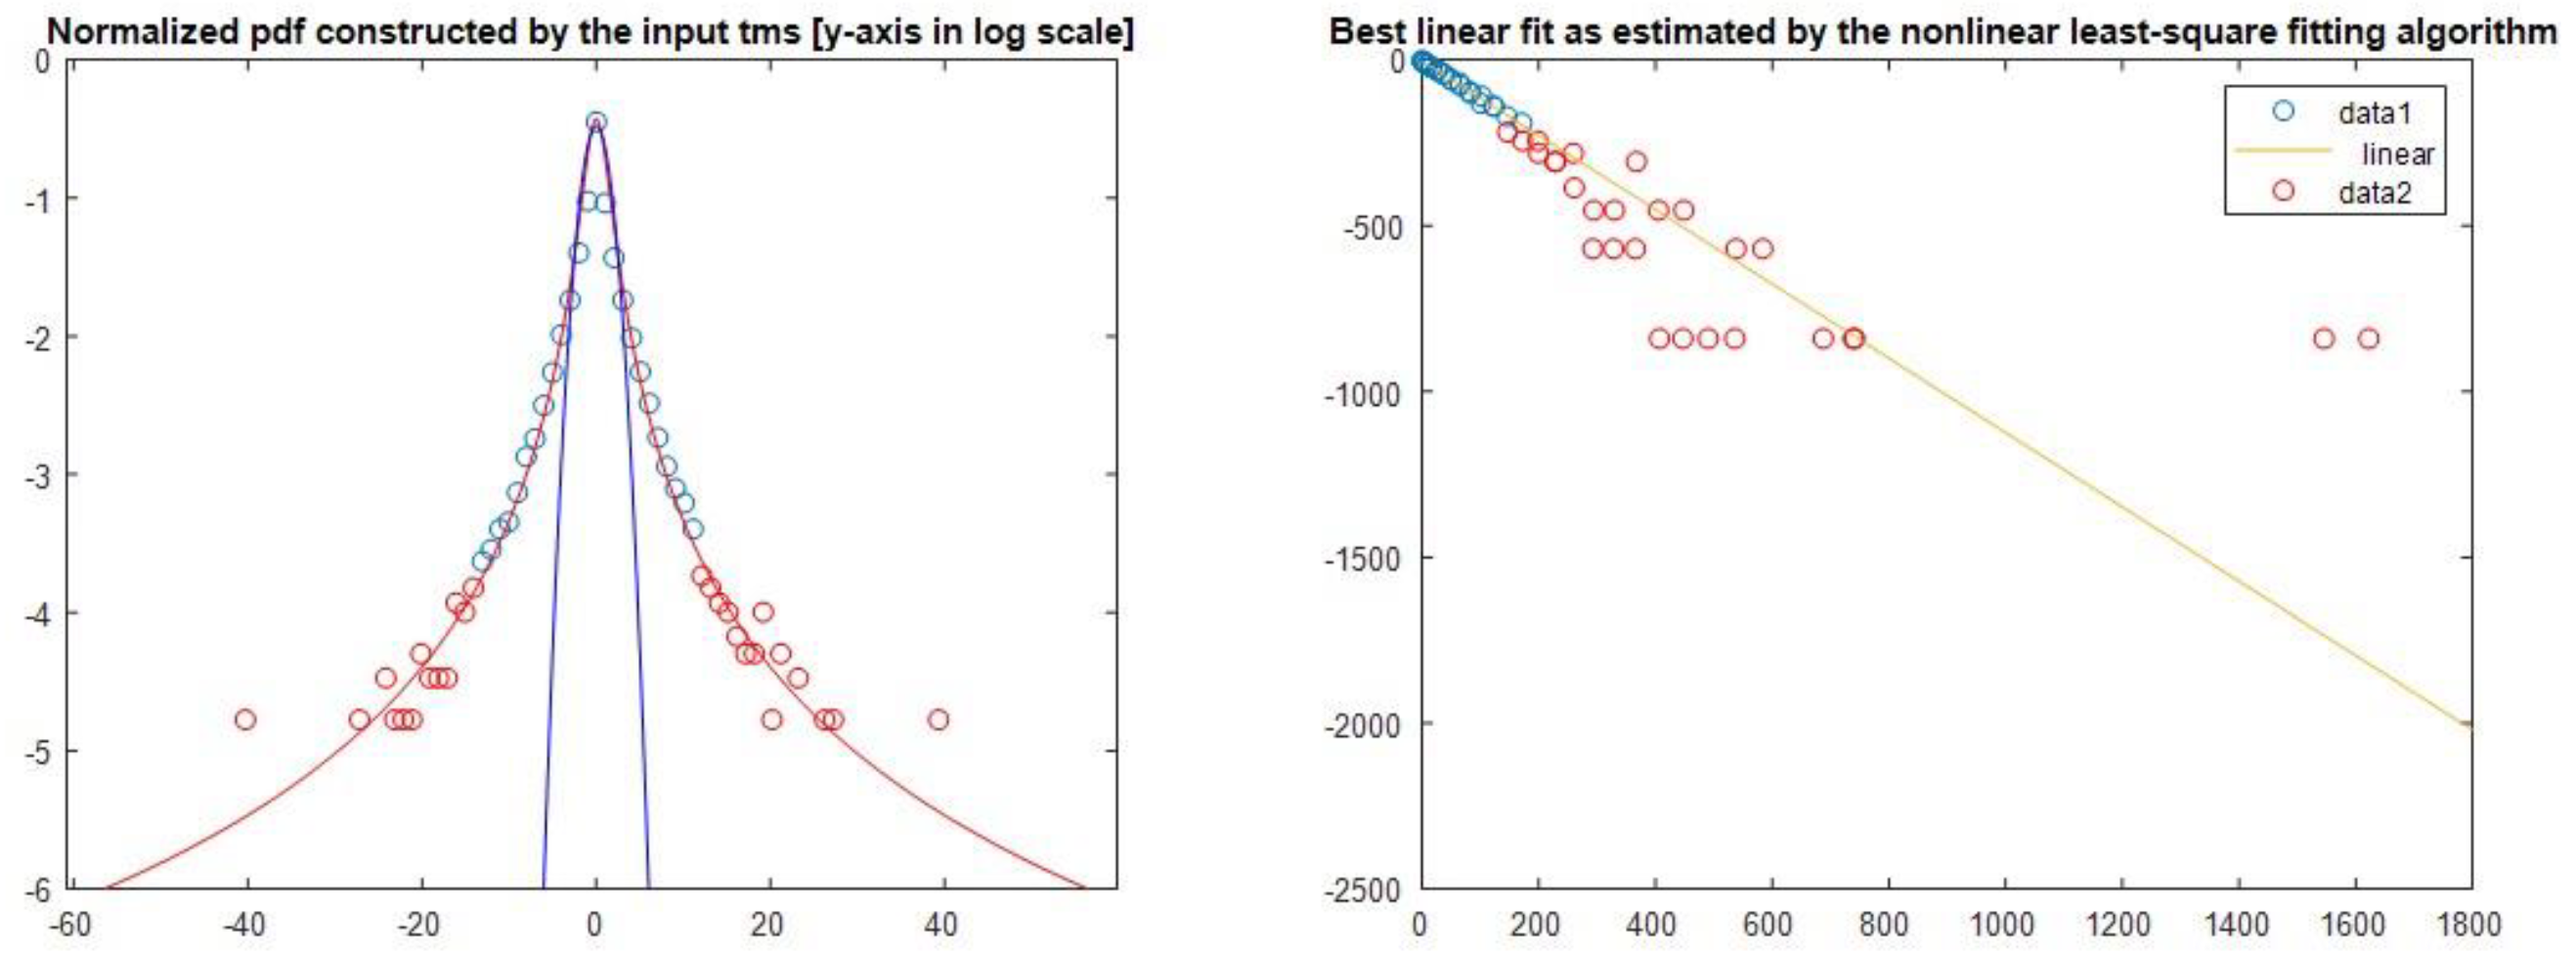
Figure 6.
Estimated Complexity Factor (COFA) per chromosome, clearly distinguishing the complex organizational profiles of position distances and lengths. COFA integrates multiple metrics indicating genomic complexity.
Figure 6.
Estimated Complexity Factor (COFA) per chromosome, clearly distinguishing the complex organizational profiles of position distances and lengths. COFA integrates multiple metrics indicating genomic complexity.
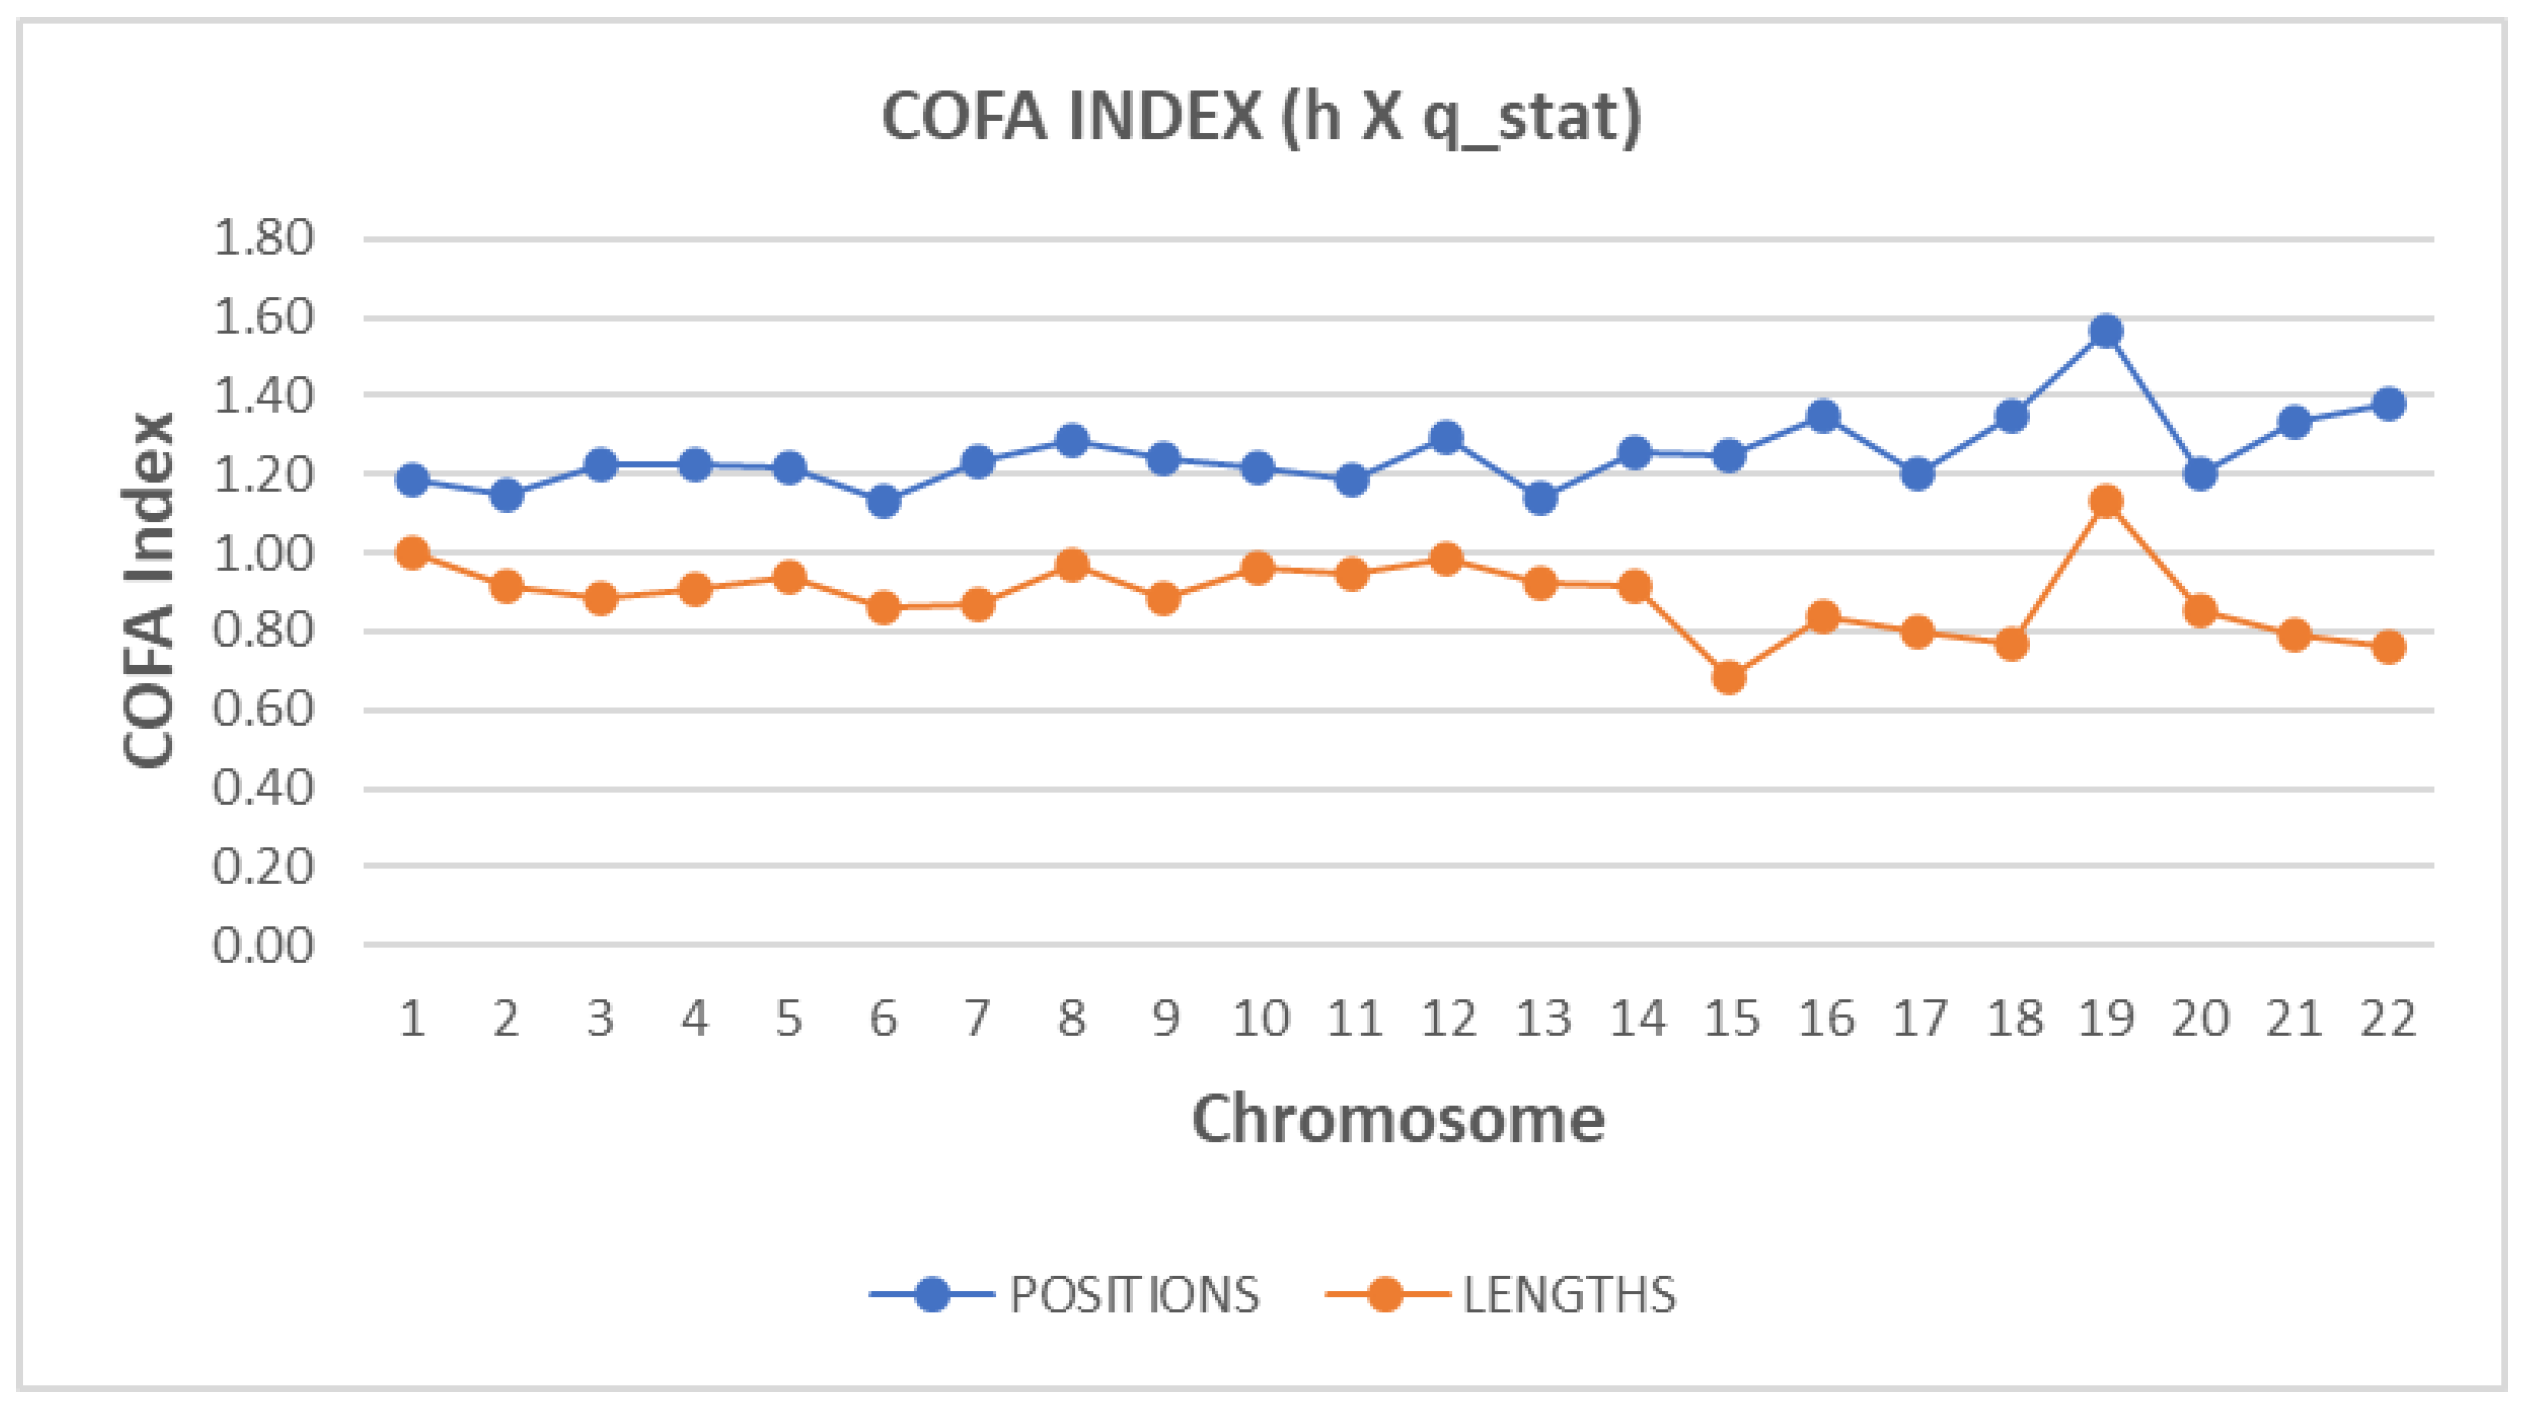
Figure 7.
Davies-Bouldin (DB) clustering index performance for Complexity Factor (COFA) across position distances and lengths. Optimal cluster numbers (k=8 for positions, k=6 for lengths) indicate biologically meaningful groupings of chromosomes based on complexity metrics.
Figure 7.
Davies-Bouldin (DB) clustering index performance for Complexity Factor (COFA) across position distances and lengths. Optimal cluster numbers (k=8 for positions, k=6 for lengths) indicate biologically meaningful groupings of chromosomes based on complexity metrics.
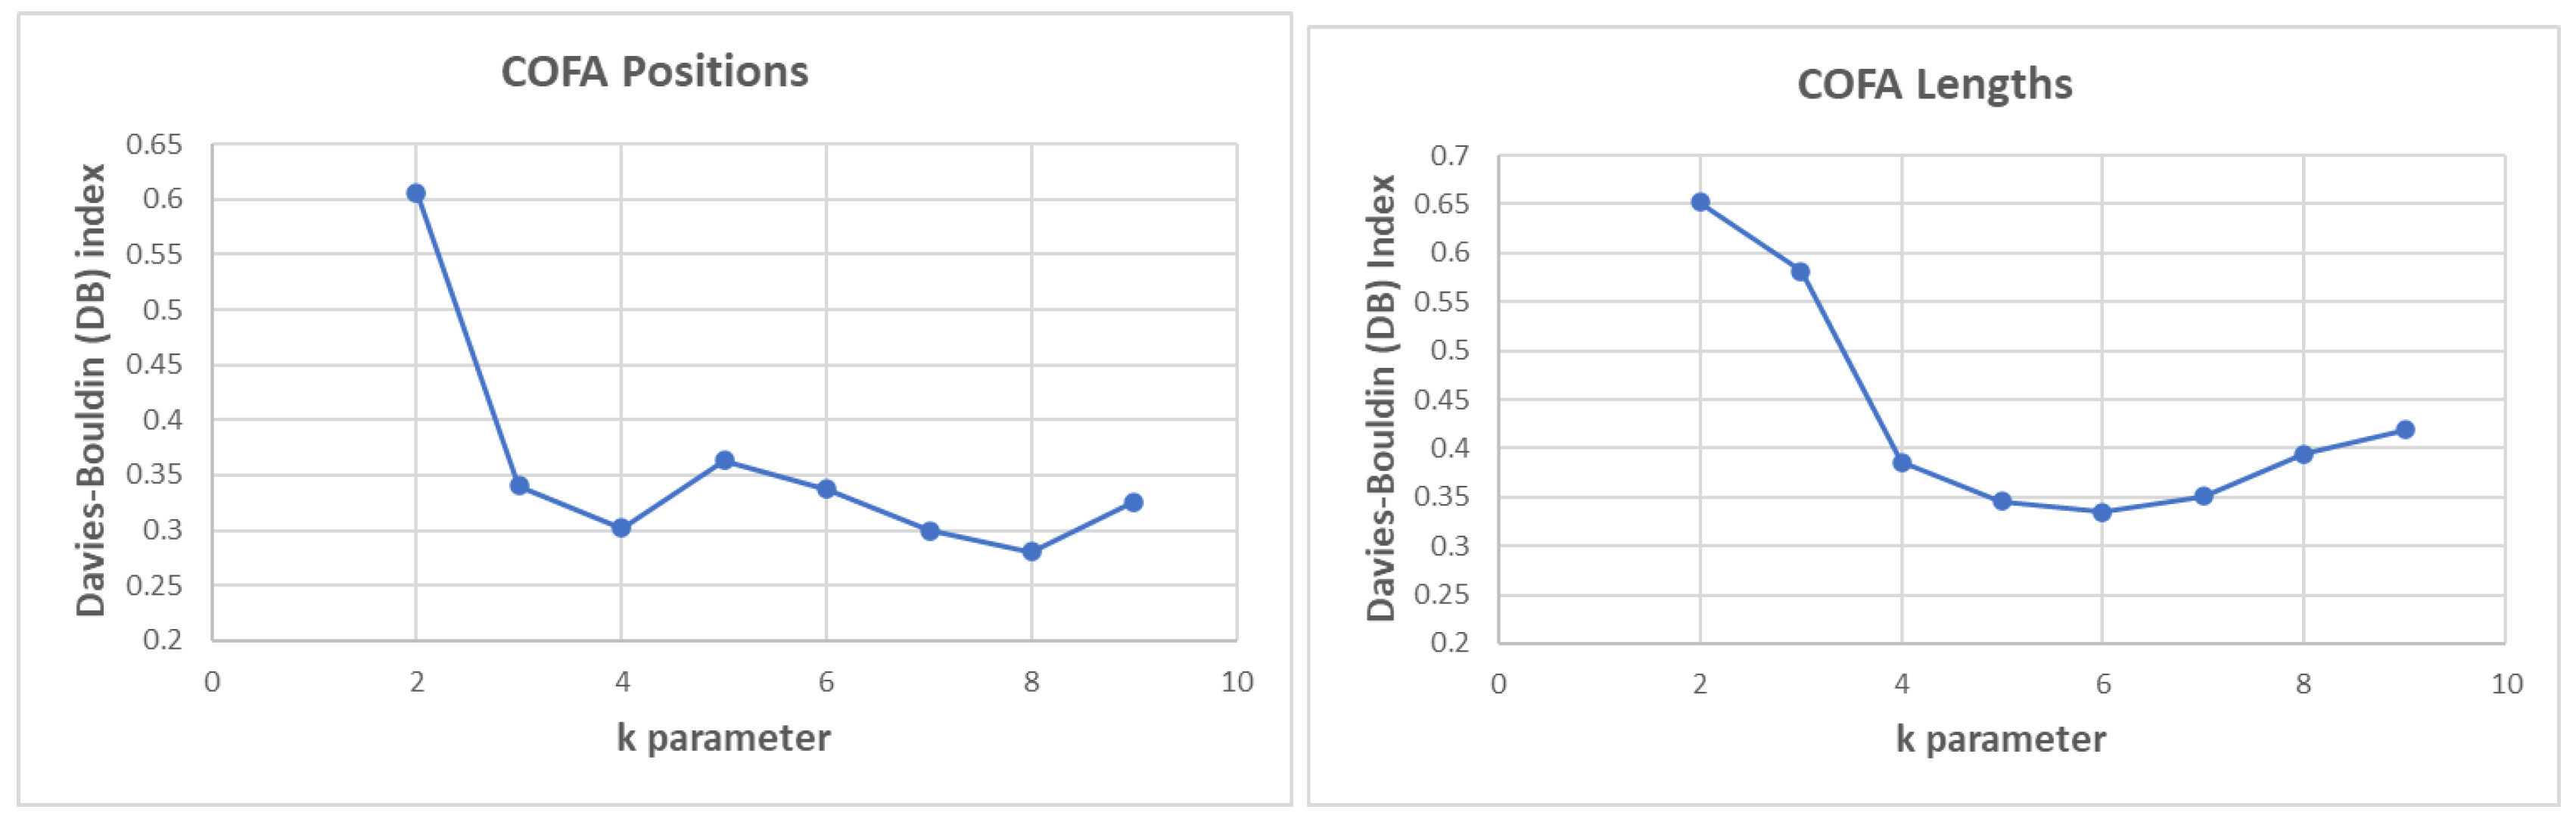
Figure 8.
K-means clustering results for Complexity Factor (COFA) on (A) position distances and (B) lengths. Identified clusters represent chromosomes with similar complexity behaviors, suggesting shared genomic regulatory or evolutionary constraints.
Figure 8.
K-means clustering results for Complexity Factor (COFA) on (A) position distances and (B) lengths. Identified clusters represent chromosomes with similar complexity behaviors, suggesting shared genomic regulatory or evolutionary constraints.
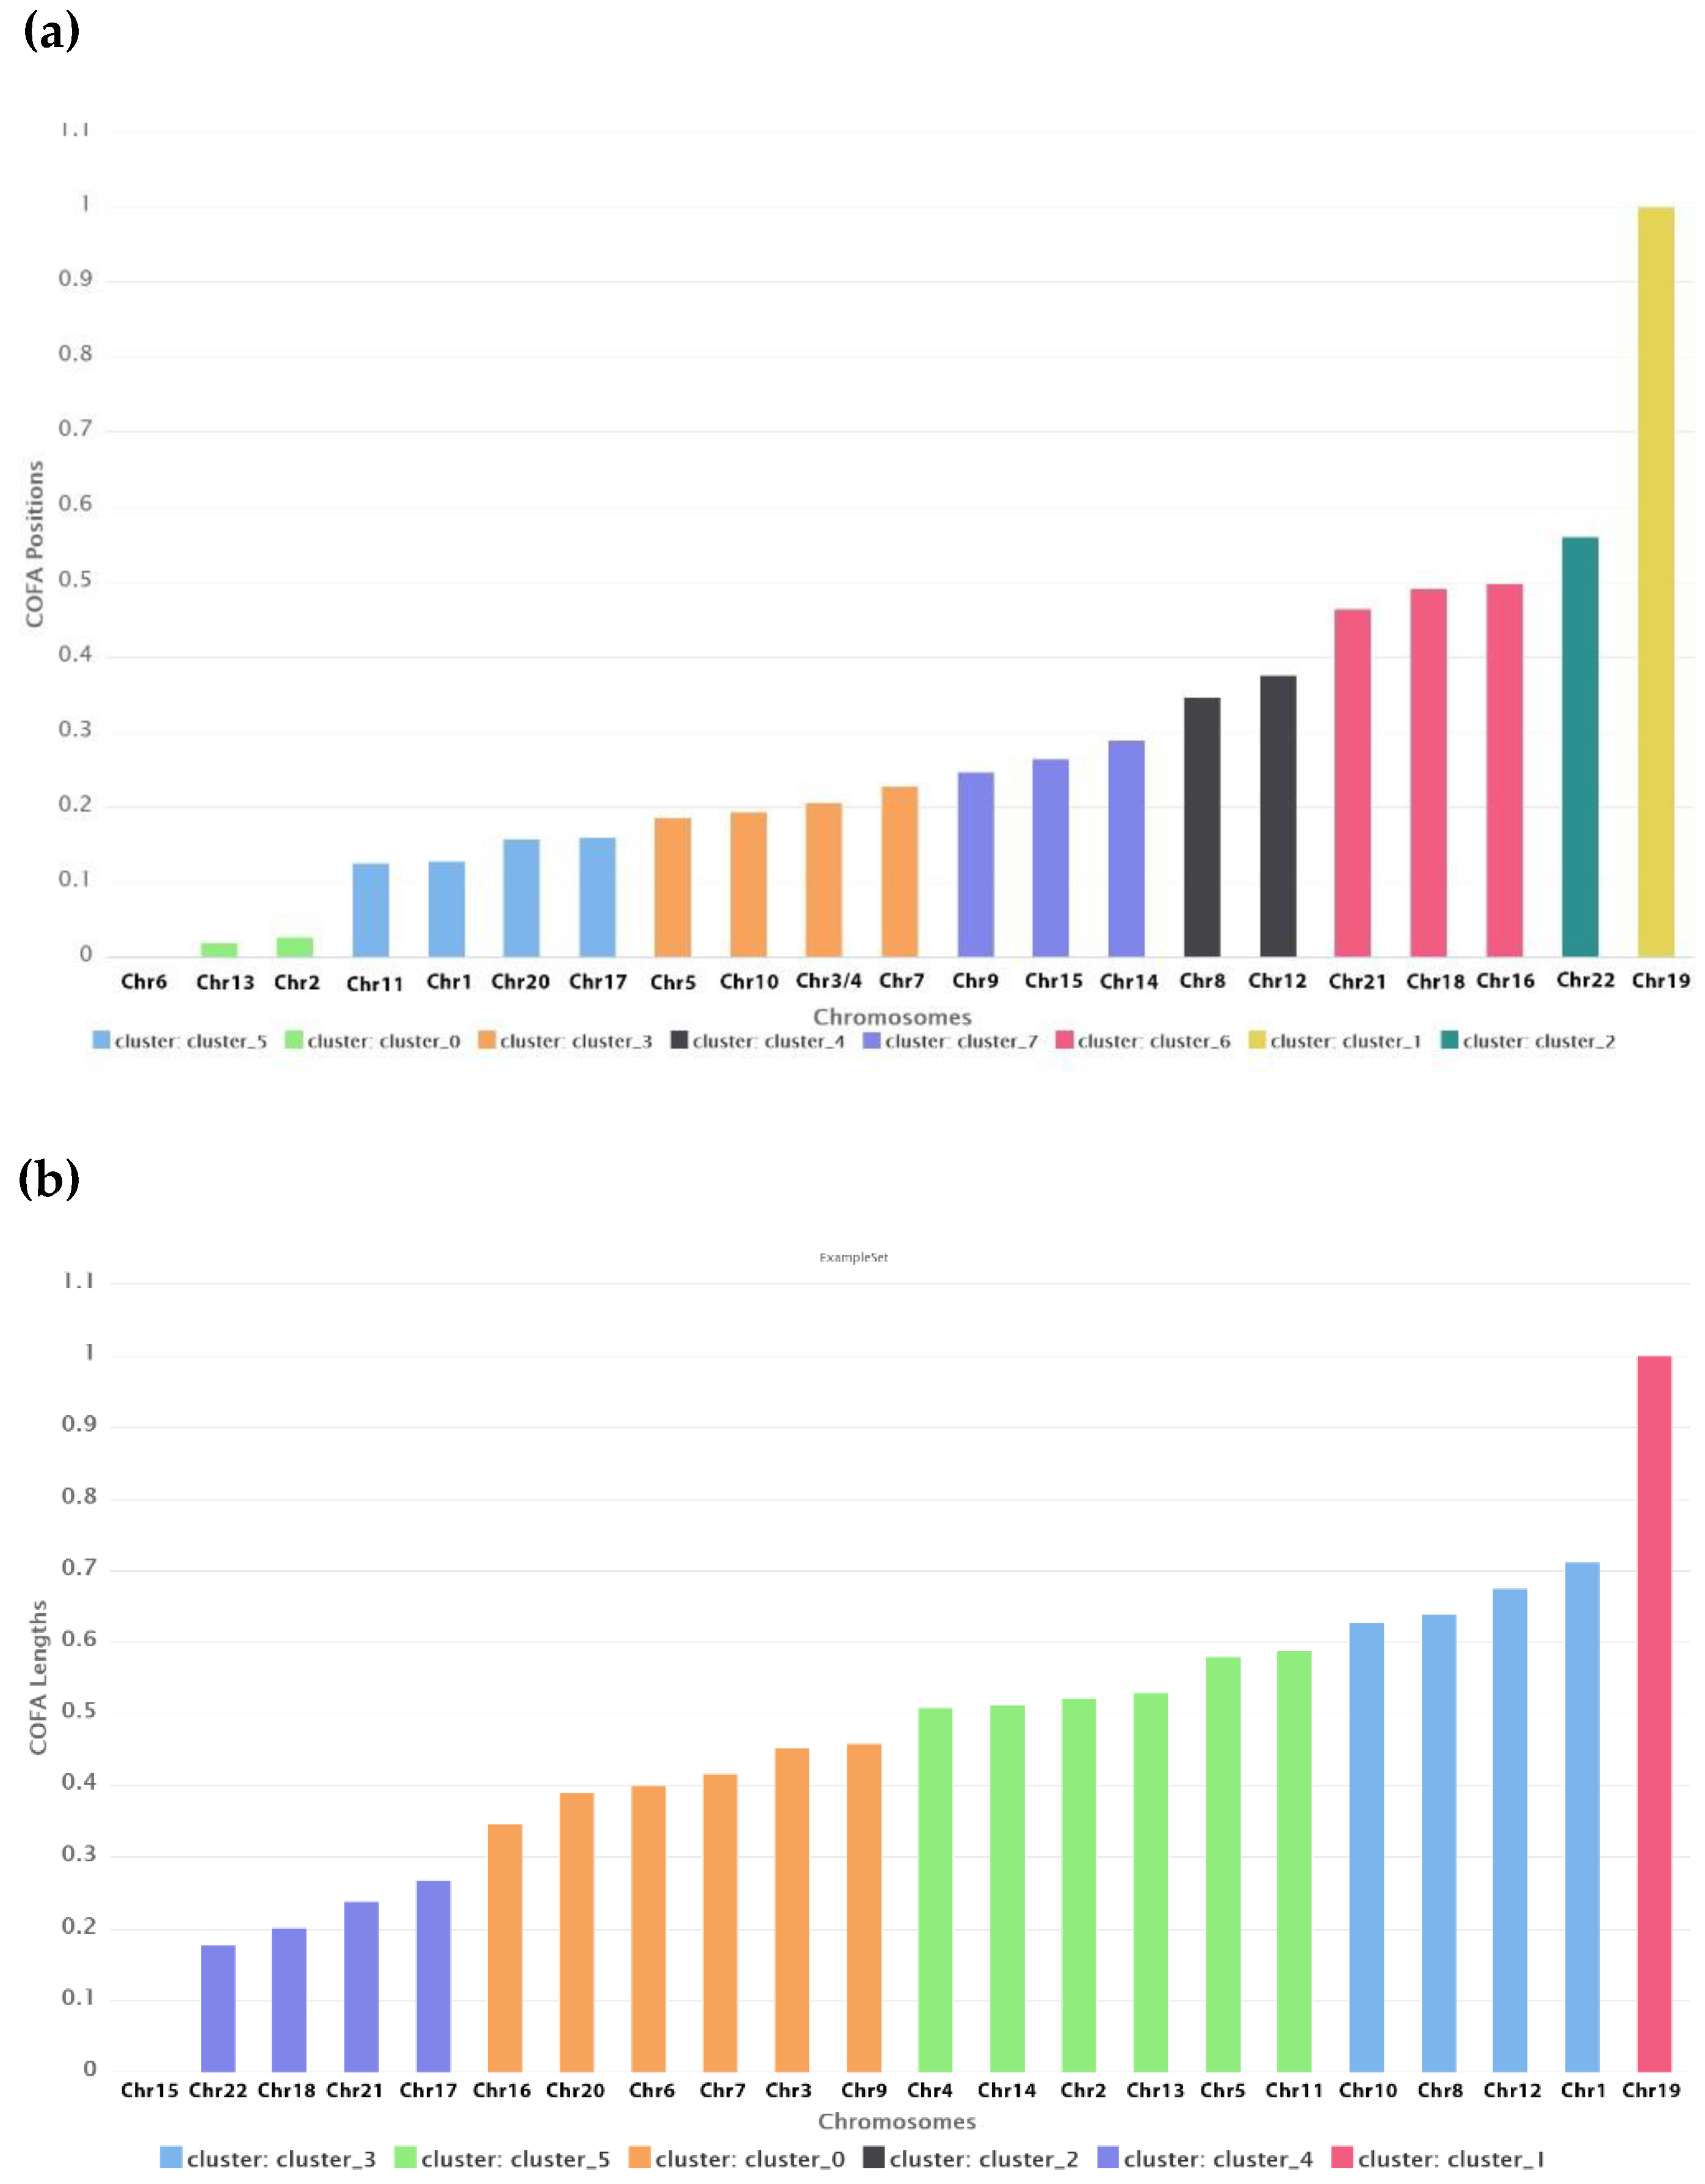

Table 1.
Clusters of Chromosomes based on COFA index (Positions Distances and Lengths).
 |
Disclaimer/Publisher’s Note: The statements, opinions and data contained in all publications are solely those of the individual author(s) and contributor(s) and not of MDPI and/or the editor(s). MDPI and/or the editor(s) disclaim responsibility for any injury to people or property resulting from any ideas, methods, instructions or products referred to in the content. |
© 2025 by the authors. Licensee MDPI, Basel, Switzerland. This article is an open access article distributed under the terms and conditions of the Creative Commons Attribution (CC BY) license (http://creativecommons.org/licenses/by/4.0/).
Copyright: This open access article is published under a Creative Commons CC BY 4.0 license, which permit the free download, distribution, and reuse, provided that the author and preprint are cited in any reuse.


