
Submitted:
29 May 2025
Posted:
30 May 2025
You are already at the latest version
Abstract
This study investigates the impact of Official Development Assistance (ODA) on Liberia’s socio-economic development indicators over the period 1991–2022, employing a Vector Autoregression (VAR) model. By analyzing the dynamic interrelationships among key variables such as ODA inflows, gross domestic product per capita, and unemployment rates, the research explores short-term fluctuations as no cointegration of variables was found. The analysis incorporates unit root tests to determine the stationarity of the series and uses the VAR framework to capture the bidirectional influences among variables. Granger causality tests are applied to examine the directions of influence. The research findings indicate that although Liberia receives considerable aid, there is little clear evidence of a meaningful improvement in important socio-economic measures such as GDP per capita and unemployment rates. The research highlights the importance of improving aid utilization, governance, and domestic capacity to translate aid into sustainable socio-economic progress. Policy recommendations emphasize strengthening aid coordination, institutional capacity, and strategies for effective aid absorption to foster inclusive and resilient development.
Keywords:
VAR
; ODA
; development
; Liberia
1. Introduction
Over the last thirty years, Official Development Assistance (ODA) has played a pivotal role in Liberia’s recovery from conflict and its broader socio-economic development. The country’s history of civil war (1989–2003), the Ebola epidemic (2014–2016), COVID pandemic (2020-2021) and ongoing institutional weaknesses have left it heavily dependent on external support. ODA has been instrumental in rebuilding infrastructure, addressing health emergencies, strengthening public institutions, and delivering essential services. Today, aid still constitutes nearly 45% of Liberia’s Gross National Income (GNI), underscoring its enduring significance.
A key feature of Liberia’s aid profile is the concentration of ODA in social sectors, particularly health and education. Donor support has funded post-Ebola health system reconstruction, infrastructure improvements, and expanded access to care. Education has similarly benefited from aid-backed projects like school construction and teacher training. Most of this aid is delivered as grants rather than loans, in recognition of Liberia’s limited fiscal capacity and to avoid unsustainable debt.
ODA has largely aligned with national development strategies such as the Agenda for Transformation and the Pro-Poor Agenda for Prosperity and Development. Donor efforts have supported governance reforms, decentralization, and improved service delivery, with recent alignment with the National Development Plan (NDP) – the ARREST Agenda for Inclusive Development (AAID). The U.S. remains the largest bilateral donor, funding programs that promote transparency and strengthen local governance, while multilateral partners provide broader sectoral support.
Despite progress, aid to Liberia has been marked by volatility. Changes in donor priorities, budget reductions, and abrupt freezes—such as the proposed U.S. aid cut in 2019 and the 2025 90-day freeze—have disrupted ongoing programs, highlighting the vulnerability of aid dependence. Coordination among donors has improved, but gaps remain when major funders withdraw unexpectedly.
ODA has also contributed to infrastructure, particularly in transport and energy, boosting economic activity and market access. Employment programs, particularly those targeting youth, have provided short-term jobs and skill-building opportunities. Nonetheless, governance challenges, and limited institutional capacity continue to constrain aid effectiveness. While donors have introduced accountability benchmarks, enforcement remains uneven.
Generally, in Africa, reducing aid dependence requires fiscal reforms and domestic resource mobilization (DRM) through robust legal frameworks, efficient tax systems, and effective institutions (Duarte, 2024). Liberia is more focused on DRM and fiscal reforms; however, progress remains slow. In the meantime, external aid continues to be fiscally important.
Figure 1 illustrates ODA to Liberia alongside identified socio-economic indicators. Data shows that ODA to Liberia surged significantly post-2006, peaking in 2010 at $1.42 billion, before gradually declining. Gross domestic product per capita (GDPpc) growth was highly volatile, with deep contractions in the 1990s and 2003, followed by moderate positive trends. Unemployment remained persistently high and relatively stable, around 3%, indicating structural labor market challenges. Despite increased aid, consistent economic growth and employment gains have remained elusive, reflecting weak translation of aid into sustainable development outcomes.
Furthermore, both scatter plots describe the relationships between ODA and identified economic indicators: GDPpc and unemployment. GDPpc (Figure 2) shows a near-zero negative correlation (R² = 0.0015), indicating ODA has little explanatory power for GDPpc growth. Unemployment (Figure 3) shows a slightly stronger but still weak positive relationship with unemployment (R² = 0.032). These findings suggest that increased aid flows have not translated into meaningful macroeconomic improvements, highlighting potential inefficiencies in aid utilization.
This analysis underscores the nuanced nature of aid effectiveness, revealing that ODA influences the identified indicators in varying ways. To better understand and enhance the impact of aid, further investigation is warranted. Accordingly, this study aims to measure the effects of ODA on both socio-economic outcomes in Liberia and to recommend policy actions that could improve the strategic use of such assistance.
1.1. Research Questions
This research seeks to answer the following research questions:
- (i)
- To what extent has ODA contributed to improvements in key socio-economic indicators in Liberia, such as GDP per capita and employment?
- (ii)
- What policy measures can enhance the effectiveness and sustainability of ODA in promoting inclusive and long-term socio-economic development in Liberia?
1.2. Research Objectives
This study aims to evaluate the impact of ODA on Liberia’s socio-economic development, identify the main channels of influence, assess related challenges such as aid volatility and governance constraints, and propose policy measures to enhance aid effectiveness and sustainability in line with the country’s long-term development goals.
1.3. Hypothesis
The null and alternative hypotheses will be tested in accordance with the study’s objectives to determine whether ODA had a statistically significant effect on selected variables in Liberia during the period from 1991 to 2022.
- H0: ODA has no significant impact on identified socio-economic development indicators in Liberia; and
- Ha: ODA has a significant positive impact on identified socio-economic development indicators in Liberia.
The hypotheses will be tested at a 5 percent significance level for short-run relationship. If the p-value of the t-statistic exceeds the 5 percent threshold, the null hypothesis will not be rejected. Conversely, if the p-value is below 5 percent, the null hypothesis will be rejected and the alternative hypothesis accepted.
1.4. Significance of the Research
This study provides empirical evidence on the role of ODA in shaping Liberia’s socio-economic development. By identifying the effectiveness and limitations of aid, the findings will inform policy decisions, enhance aid coordination, and support strategies aimed at achieving sustainable development and reducing aid dependency in Liberia.
2. Literature Review
This section examines theoretical and empirical studies on ODA’s impact across various indicators, highlighting diverse findings that lead researchers to draw either differing or sometimes converging conclusions on aid effectiveness.
2.1. Generic Studies on ODA Impacts on Development
ODA has been a pivotal element in international development, aimed at enhancing the socio-economic conditions of developing countries. Early studies, such as those by Corden and Neary (1982), introduced the "Dutch Disease" phenomenon, highlighting that an influx of ODA can lead to currency appreciation, potentially harming sectors like agriculture and manufacturing. Burnside and Dollar (2000) further argued that ODA significantly promotes growth when paired with sound economic policies, establishing a foundational understanding of aid effectiveness.
Building on these concepts, Moreira (2005) explored the complexities of ODA, revealing that while foreign aid can benefit economic growth at the micro level, macro-level results often yield mixed outcomes, thus illustrating the "micro-macro paradox" in aid effectiveness studies. This notion is further scrutinized through dependency theory, which posits that excessive reliance on foreign aid can stifle domestic innovation and self-sustained growth (Moyo, 2009).
Conversely, the "Aid Effectiveness" literature emphasizes ODA's potential to facilitate infrastructure development, health improvements, and educational advancements, all critical for socio-economic progress (Riddell, 2007). Recent studies have illustrated these dynamics in specific contexts. For instance, Joseph (2014) analyzed the impact of ODA on economic growth in Kenya, concluding that while ODA contributes to short-term growth, internal factors are more significant for long-term sustainability.
Similarly, Çevik and Amanat (2020) examined ODA's impact on Afghanistan's GDP, finding a positive long-term relationship where a 1% increase in ODA correlates with a 0.32% GDP increase. In Vietnam, Dang et al. (2021) highlighted ODA's role in economic growth through road transport infrastructure construction, revealing a positive impact on the country's GDP.
2.2. Empirical Studies on ODA Impacts on Development in Africa
In the African context, numerous empirical studies have explored the complex relationship between ODA and development outcomes. Sachs & Ayittey (2009) disclose that despite over $450 billion United States dollars in foreign aid given to African countries since the 1960s, poverty is still on the increase. A foundational study by Clemens et al. (2004) examined the role of ODA in fostering economic growth in Sub-Saharan Africa, indicating a positive correlation between aid and GDP growth, especially in countries with stable political environments. However, this research also highlighted that ODA could lead to negative outcomes in contexts characterized by poor governance and corruption.
Building on this, Arndt et al. (2010) revealed that ODA has contributed to poverty alleviation and improved health indicators across several African nations. Their findings suggest that the impact of ODA varies significantly based on governance quality and institutional capacity. This variability is further illustrated in Ianjatina and Andrianony’s (2022) thesis, which evaluates ODA's influence on living conditions in Madagascar. They found positive correlations with income and education but noted negative effects on health outcomes, emphasizing the need for effective aid management.
In Sudan, Mustafa et al. (2018) identified a long-term positive impact of ODA on economic growth, although they cautioned that corruption negatively affects this relationship, and short-term effects might hinder growth. Conversely, Gichanga (2018) focused on Kenya, showing that ODA significantly impacts economic growth while stressing the importance of macroeconomic policies and effective utilization of aid resources.
Litali et al. (2025) analyzed ODA's effects within the East African Community, revealing that while ODA positively influences growth, trade openness significantly enhances its effectiveness. Additionally, a meta-analysis by Dunning and Harrison (2010) assessed ODA effectiveness across various African countries, concluding that success largely depends on the recipient country's policy framework and institutional strength.
David (2017) analyzed the effect of ODA on poverty within the Economic Community of West African States (ECOWAS) and found that while aid contributes to poverty reduction, its impact on economic growth is less pronounced. The study recommends that member countries adopt strategies to utilize aid effectively for both growth and poverty alleviation. Davies (2024) highlighted the importance of aligning ODA with regional development goals as well as with institutional capacities to maximize benefits.
Finally, Rojík et al. (2024) critiqued ODA's impact on Nigeria, finding no positive contribution to economic growth and suggesting that improvements in the labor force yield more significant benefits. Awino and Kioko (2022) explored ODA's impact on Kenya's economic growth and domestic savings, revealing that while ODA positively affects savings, its direct impact on growth is statistically insignificant.
2.3. Empirical Studies on ODA Impacts on Development in Liberia
Focusing specifically on Liberia, empirical research reveals a mixed impact of ODA on the country's socio-economic development post-civil conflict. According to a study by Nwogbaga (2015), ODA has played a crucial role in rebuilding the country’s infrastructure, particularly in the health and education sectors, leading to improved literacy rates and healthcare access. However, challenges remain, particularly in terms of sustainability and effective resource management.
Research by Sahn and Younger (2006) highlights the intricacies of ODA's impact on poverty reduction in Liberia, noting that while aid has contributed to visible improvements, it has also fostered a level of dependency that complicates long-term development strategies. Additionally, the World Bank (2017) emphasizes that the alignment of ODA with national development priorities is essential for maximizing its impact, recommending improved coordination among donor agencies and local governments.
In summary, the literature indicates that while ODA has the potential to significantly influence Liberia's socio-economic development positively, the effectiveness of aid is contingent upon governance, institutional capacity, and strategic alignment with national development goals. Further research is needed to develop a comprehensive understanding of these dynamics in Liberia's unique context.
3. Research Structure and Methodology
3.1. Data Series, Period and Econometric Method
The data used to estimate the time series in this study were obtained from the World Bank Group (WBG) World Development Indicators (WDI). The annual data cover the period from 1991 to 2022, totaling 32 observations. STATA 14.2 was used for the estimation.
3.2. Selection of Variables
The selection of variables was guided by a combination of theoretical insights, empirical evidence, data availability, and statistical methods, all aligned with the research question and literature review. Data for three variables were collected, as shown in Table 1 below.
3.3. Methodology and Model Design
The primary objective of this study is to examine the short-term dynamic relationships between ODA, GDP per capita, and unemployment in Liberia. All variables are converted into natural logarithms to interpret coefficients as elasticities and to reduce multicollinearity. The approach taken to measure the impact of ODA on various dependent variables using the VAR model is as follows:
- (i)
- Conducting the Augmented Dickey-Fuller (ADF) unit root test to evaluate the stationarity of the variables:
where represents the change in the natural logarithm of the dependent variable Yt at time t; is the constant term (intercept); is the coefficient measuring the relationship between Y and itself; is the lagged level of the dependent variable in log form; is the sum of the lagged changes in the log of Y, capturing short-term dynamics; and is the error term (white noise).
- (ii)
- Performing the Johansen cointegration test to determine whether a long-term equilibrium relationship exists among multiple non-stationary variables:
- (iii)
- Choosing the best lag length for the VAR model by employing the Akaike Information Criterion (AIC) and defining VAR model equations:
Where , and are the intercept terms, representing the baseline or average levels of the variables; , , (for i=1,…,p) are the coefficients on the lagged values of variables, capturing its own short-term dynamics; , and (for j=1,...,p) are the coefficients on the lagged values of variables, reflecting the short-term impact of variables; , , (for k=1,...,p) are the coefficients on the lagged values of variables, reflecting the short-term impact of variables; and , , are the error terms capturing unobserved factors influencing each variable at time t.
- (iv) Conducting Granger causality tests to examine whether Official Development Assistance (ODA) predicts changes in GDP per capita and unemployment, or vice versa. The null hypothesis states that no Granger causality exists between the variables.
- (v) Conducting a set of diagnostic tests to verify the model's validity:
Jarque-Bera test (Normality of residuals):
where n is the sample size; S is the sample skewness; and K is the sample kurtosis.
Multicollinearity test:
where is the R-squared value obtained by regressing the j-th predictor on all other predictors.
Breusch-Godfrey LM test (Autocorrelation):
where, ût–i denotes the lagged residuals; αi represents the regression coefficients; p is the number of restrictions imposed by H0, and εt is the white noise error term in the auxiliary regression that satisfies all the classical assumptions.
Breusch-Pagan test (Heteroscedasticity):
where is the dependent variable; , ,…, are independent variables, β0, β1,…, βk are the coefficients to be estimated, and ϵi denotes the residuals (errors).
CUSUM test (Stability):
where represents the recursive residuals. The cumulative sum is plotted over time to monitor the stability of the parameters.
4. Data, Estimation Results and Discussion
The descriptive statistics in Table 2 reveals significant changeability in the variables. ODA is approximately normally distributed with moderate variability, making it suitable for regression analysis. GDPpc exhibits strong negative skewness and high kurtosis, indicating non-normality and potential outliers. Unemployment rate shows minimal variation and is right-skewed, also violating normality. The Jarque-Bera test confirms non-normality for GDPpc and unemployment. These findings highlight the need for robust statistical techniques to account for non-normality and variability in the data.
4.1. Optimal Lag Selection
Based on the information criteria, the Akaike Information Criterion (AIC) was identified as the most appropriate, as it produced the lowest value. The results suggest that the optimal lag length for the system is 1 for all variables.
4.2. Unit Root Tests
Table 3 and Table 4 present the ADF and PP unit root tests, assessing stationarity with and without trend. Results indicate that ODA and unemployment variables are all stationary at first difference, while GDPpc is stationary at level under both tests. The consistency between the ADF and PP test results strengthens the reliability of these findings.
4.3. Johansen Cointegration Test Results
As shown above, the series exhibited a mix of I(0) and I(1) integration orders. Therefore, the Johansen cointegration test was employed to assess the presence of long-term cointegration among the variables.
Results in Table 5 suggest no strong evidence of a long-term relationship among the variables at the 5 percent significance level. The trace statistic for rank 0 is below the critical value, and the eigenvalue test indicates only one cointegrating vector, implying the variables may not move together in the long-run. Hence, the VAR model is retained.
4.4. Model Estimation Results
Variables ODA, GDP per capita, and unemployment do not exhibit cointegration. Consequently, only short-term relationships are modeled using lagged differences of the variables to analyze their dynamics.
4.4.1. Short-Term Relationship
The VAR results in Table 6 show weak explanatory power, with low R-squared values across equations and non-significant joint chi-squared statistics, suggesting limited model fit. Only lagged ODA significantly affects its own dynamics (p = 0.022), indicating some persistence. Other coefficients are statistically insignificant, with wide confidence intervals, especially for unemployment. Information criteria (AIC, BIC, HQIC) are low, suggesting a parsimonious model, but the lack of significant interactions implies weak dynamic interdependence among the variables. Further robust diagnostic tests will be performed.
4.4.2. Causality Analysis Results
The Granger causality test results indicate no significant causal relationships among the variables at the 5 percent significance level.

Table 7.
Granger Causality Test.
| Equation | Excluded | chi2 | df | Prob > chi2 | Result |
| D_lnODA | D_lnGDPpc | 0.33851 | 1 | 0.561 | Accept the null hypothesis |
| D_lnODA | D_lnUnempR | 0.07035 | 1 | 0.791 | Accept the null hypothesis |
| D_lnGDPpc | D_lnODA | 0.25214 | 1 | 0.616 | Accept the null hypothesis |
| D_lnUnempR | D_lnODA | 0.2309 | 1 | 0.631 | Accept the null hypothesis |
All p-values are well above 0.05, leading to acceptance of the null hypotheses. This suggests that, within the sample and lag structure, past changes in one variable do not predict current changes in the others.
4.5. Results of the Diagnostic Tests
Using the approach described in chapter 3, diagnostic tests were conducted to assess (i) normality, (ii) autocorrelation, (iii) heteroscedasticity, and (iv) model stability.
4.5.1. Normality Tests
The residuals in the normality test shown in Figure 4 are right-skewed (1.06) and leptokurtic (4.33), indicating a deviation from normality. The Jarque-Bera statistic (5.21) suggests mild non-normality. Although the distribution is centered around zero, its shape may pose issues for inference accuracy.
4.5.2. Multicollinearity Test
Table 8 displays the Variance Inflation Factor (VIF) results, evaluating multicollinearity among the explanatory variables. The VIF values for GDP per capita (D_lnGDPpc) and the unemployment rate (D_lnUnempR) are both 1.01, which are significantly below the commonly accepted threshold of 10. The average VIF of 1.01 further suggests that the explanatory variables are not highly correlated. Therefore, there is no evidence of problematic multicollinearity, and no corrective measures—such as variable exclusion or transformation—are necessary to produce reliable coefficient estimates in the VAR model.
4.5.3. Autocorrelation Test
Table 9 shows the Breusch-Godfrey test for autocorrelation at lag 1. The p-value is 0.2072, which exceeds the 0.05 threshold. Therefore, we fail to reject the null hypothesis, indicating no significant autocorrelation in the residuals at lag 1, suggesting the model is adequately specified regarding autocorrelation.
4.5.4. Heteroscedasticity Test
The White’s test for heteroscedasticity is showed in Table 10. The chi-square statistic is 1.34 with 5 degrees of freedom, and the p-value is 0.9311. Since the p-value exceeds 0.05, we fail to reject the null hypothesis of homoscedasticity, indicating no evidence of heteroscedasticity in the model residuals. This suggests that the variance of the errors is consistent across observations.
4.5.5. Stability Tests
The CUSUM test curve in Figure 5 exceeds the upper bound, suggesting potential structural instability or a break during the sample period. Conversely, the CUSUM of squares in Figure 6 remains within bounds, indicating stable residual variance and confirming the overall structural stability of the model.
4.6. Discussion
The VAR model reveals no long-run cointegration among ODA, GDP per capita, and unemployment, prompting a short-run analysis. Results show weak explanatory power, with low R-squared values and mostly insignificant coefficients, except for lagged ODA affecting itself. Granger causality tests confirm no predictive relationships among the variables. Diagnostic tests reveal mild non-normality, but no multicollinearity, autocorrelation, or heteroscedasticity, indicating sound model specification. However, the CUSUM test suggests potential structural instability over the sample period, while the CUSUM of squares confirms residual variance stability. Overall, the model exhibits limited dynamic interactions and modest reliability for short-run inference.
The findings reveal that despite Liberia’s substantial aid inflows, there is limited evidence of a significant positive impact on key socio-economic indicators like GDP per capita and unemployment. The weak correlations suggest inefficiencies in aid utilization, possibly due to governance challenges and institutional weaknesses. The instability indicated by the CUSUM of squares test implies structural changes or shocks during the period, which may have affected aid effectiveness. The CUSUM test results overall highlight the importance of strengthening governance, aid coordination, and institutional capacity to translate aid into sustainable development. Addressing these internal factors is crucial for improving aid impact and ensuring long-term socio-economic progress.
Similar results were found in Rojík et al. (2024), where ODA had limited economic impact in Nigeria, emphasizing labor improvements, while Awino and Kioko (2022) found that ODA did not directly contribute to growth in Kenya.
5. Conclusions
5.1. Summary Conclusions
The VAR model shows no long-run cointegration and weak short-run dynamics, with only lagged ODA significant. Diagnostic tests support specification, but structural instability may affect reliability.
The study concludes that Liberia’s large aid dependence has not translated into sustained macroeconomic improvements, mainly due to governance and institutional capacity, as well as aid volatility. Despite aid concentration in social sectors, macroeconomic indicators remain volatile and stagnant, reflecting poor aid effectiveness. The weak correlations suggest aid alone cannot drive growth without strong domestic institutions and policy reforms. Therefore, the country’s development success hinges on improving governance, reducing aid volatility, and enhancing domestic revenue mobilization. These internal reforms are essential for translating aid into inclusive and sustainable socio-economic progress, rather than aid dependence.
5.2. Policy Recommendations
To enhance aid effectiveness, Liberia should prioritize strengthening institutional capacity and governance frameworks to better utilize aid resources. Additionally, Liberia should improve collaboration with donors to mitigate duplication of efforts, address aid volatility, and ensure aid aligns with national priorities outlined in the NDP. These efforts should complement prudent policies that promote domestic resource mobilization and fiscal reforms to reduce reliance on aid and foster sustainability. Implementing rigorous accountability and monitoring mechanisms will further improve aid absorption and efficiency. Moreover, investments in infrastructure, health, and education should be supported by NDP policies that encourage private sector development and employment generation. The adoption of program-based budgeting by the government could also help rationalize domestic resources and maximize development impact. These steps will create a conducive environment for aid to catalyze long-term socio-economic development, ultimately reducing aid dependence and fostering self-sustaining growth.
5.3. Accomplishment of Research Objectives
The study achieved its objectives by analyzing VAR results, which showed weak but existing short-term relationships, and diagnostic tests confirming model stability.
5.4. Limitations of the Research
This research faced key limitations. Data availability and robustness constrained the inclusion of additional relevant socio-economic variables, such as completion rate (education) or mortality rate (health), limiting the model’s explanatory power.
References
- 1Arndt, C., Jones, S., & Tarp, F. (2010). Aid, growth, and development: Have we come full circle? Journal of Globalization and Development, 1(2), Article 5.
- Awino, D., & Kioko, U. (2022). The impact of Official Development Assistance on economic growth and domestic savings in Kenya. Journal of African Development Studies, 18(3), 45–61.
- Burnside, C., & Dollar, D. (2000). Aid, policies, and growth. American Economic Review, 90(4), 847–868.
- Çevik, S., & Amanat, H. (2020). Aid and economic growth in conflict-affected states: Evidence from Afghanistan. IMF Working Paper, WP/20/34.
- Clemens, M.A., Radelet, S., & Bhavnani, R. (2004). Counting chickens when they hatch: The short-term effect of aid on growth. Center for Global Development Working Paper No. 44.
- Corden, W.M., & Neary, J.P. (1982). Booming sector and de-industrialisation in a small open economy. The Economic Journal, 92(368), 825–848.
- Dang, T.H., Nguyen, C.V., & Pham, T.H. (2021). Infrastructure development and growth: Evidence from ODA-financed road construction in Vietnam. World Development, 138, 105248.
- David, N. (2017). Effect of ODA on poverty within ECOWAS: An analysis of its role in poverty reduction and economic growth. Economic Development Review, 12(3), 45–62.
- Davies, J. (2024). Aligning ODA with regional development goals and institutional capacities. Development Policy Journal, 15(2), 102–118.
- Duarte, C. (2024). Challenging the Global Narrative on Africa’s Debt. African Leadership Series – UN Office of the Special Adviser on Africa, 1–20.
- Dunning, C., & Harrison, T. (2010). Cross-country evidence on the effectiveness of aid in Africa: A meta-analysis. African Economic Research Consortium Paper No. 102.
- Gichanga, R. (2018). The impact of official development assistance on economic growth in Kenya. International Journal of Economics and Development, 9(1), 1–15.
- Ianjatina, A., & Andrianony, M. (2022). Official Development Assistance and living conditions in Madagascar: A sectoral analysis. Master's Thesis, University of Antananarivo.
- Joseph, M. (2014). Official development assistance and economic growth in Kenya. African Journal of Economic Policy, 21(2), 78–93.
- Litali, D., Munisi, G., & Mwamba, J. (2025). The effects of official development assistance and trade openness on economic growth in the East African Community. East African Economic Review, Forthcoming.
- Moreira, S. B. (2005). Evaluating the impact of foreign aid on economic growth: A cross-country study. Journal of Economic Development, 30(2), 25–48.
- Moyo, D. (2009). Dead aid: Why aid is not working and how there is a better way for Africa. London: Penguin Books.
- Mustafa, A., Elsheikh, A., & Abdelrahim, Y. (2018). Impact of foreign aid on economic growth in Sudan: Empirical analysis from 1976–2015. Journal of African Economies, 27(4), 537–558.
- Nwogbaga, D.M.E. (2015). Foreign aid and the reconstruction of post-conflict Liberia: Challenges and prospects. International Journal of African Development, 2(1), 36–48.
- Riddell, R.C. (2007). Does foreign aid really work? Oxford: Oxford University Press.
- Rojík, S., Okoro, M., & Adebayo, T. (2024). The impact of ODA on economic growth and labour force efficiency in Nigeria. Journal of Development Effectiveness, 16(1), 77–95.
- Sachs, J., & Ayittey, G. B. N. (2009). Can foreign aid reduce poverty? In M. P. Haas, J. A. Hird, & B. McBratney (Eds.), Controversies in globalisation: Contending approaches to international relation (pp. 68–98). CQ Press.
- Sahn, D.E., & Younger, S.D. (2006). Changes in poverty in Liberia: 1986 to 2004. Cornell University Working Paper.
- World Bank. (2017). Liberia - Systematic Country Diagnostic. Washington, DC: World Bank Group.
Figure 1.
ODA to Liberia and performance of related variables.
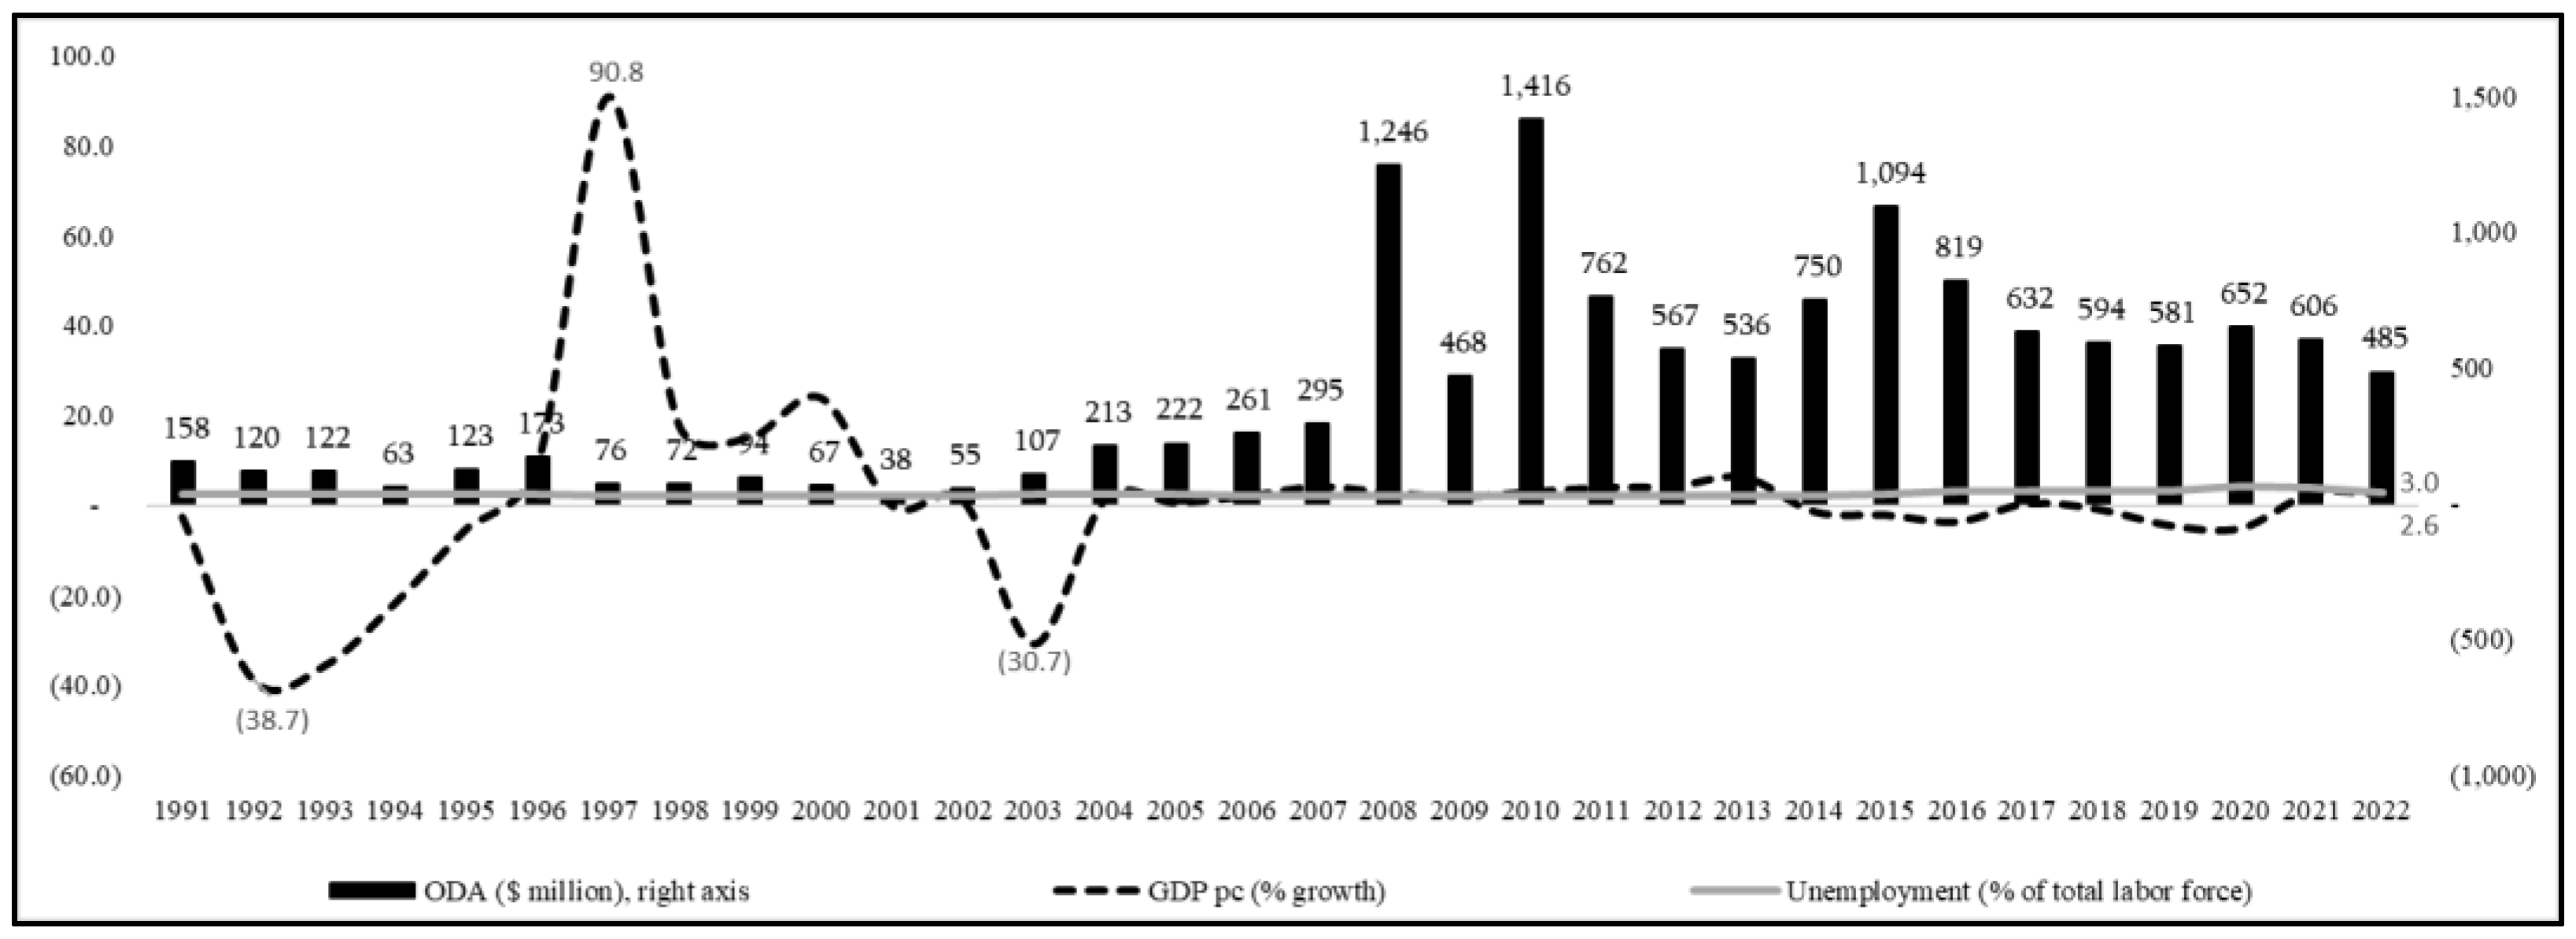
Figure 2.
Linkage among ODA and GDP per capita.
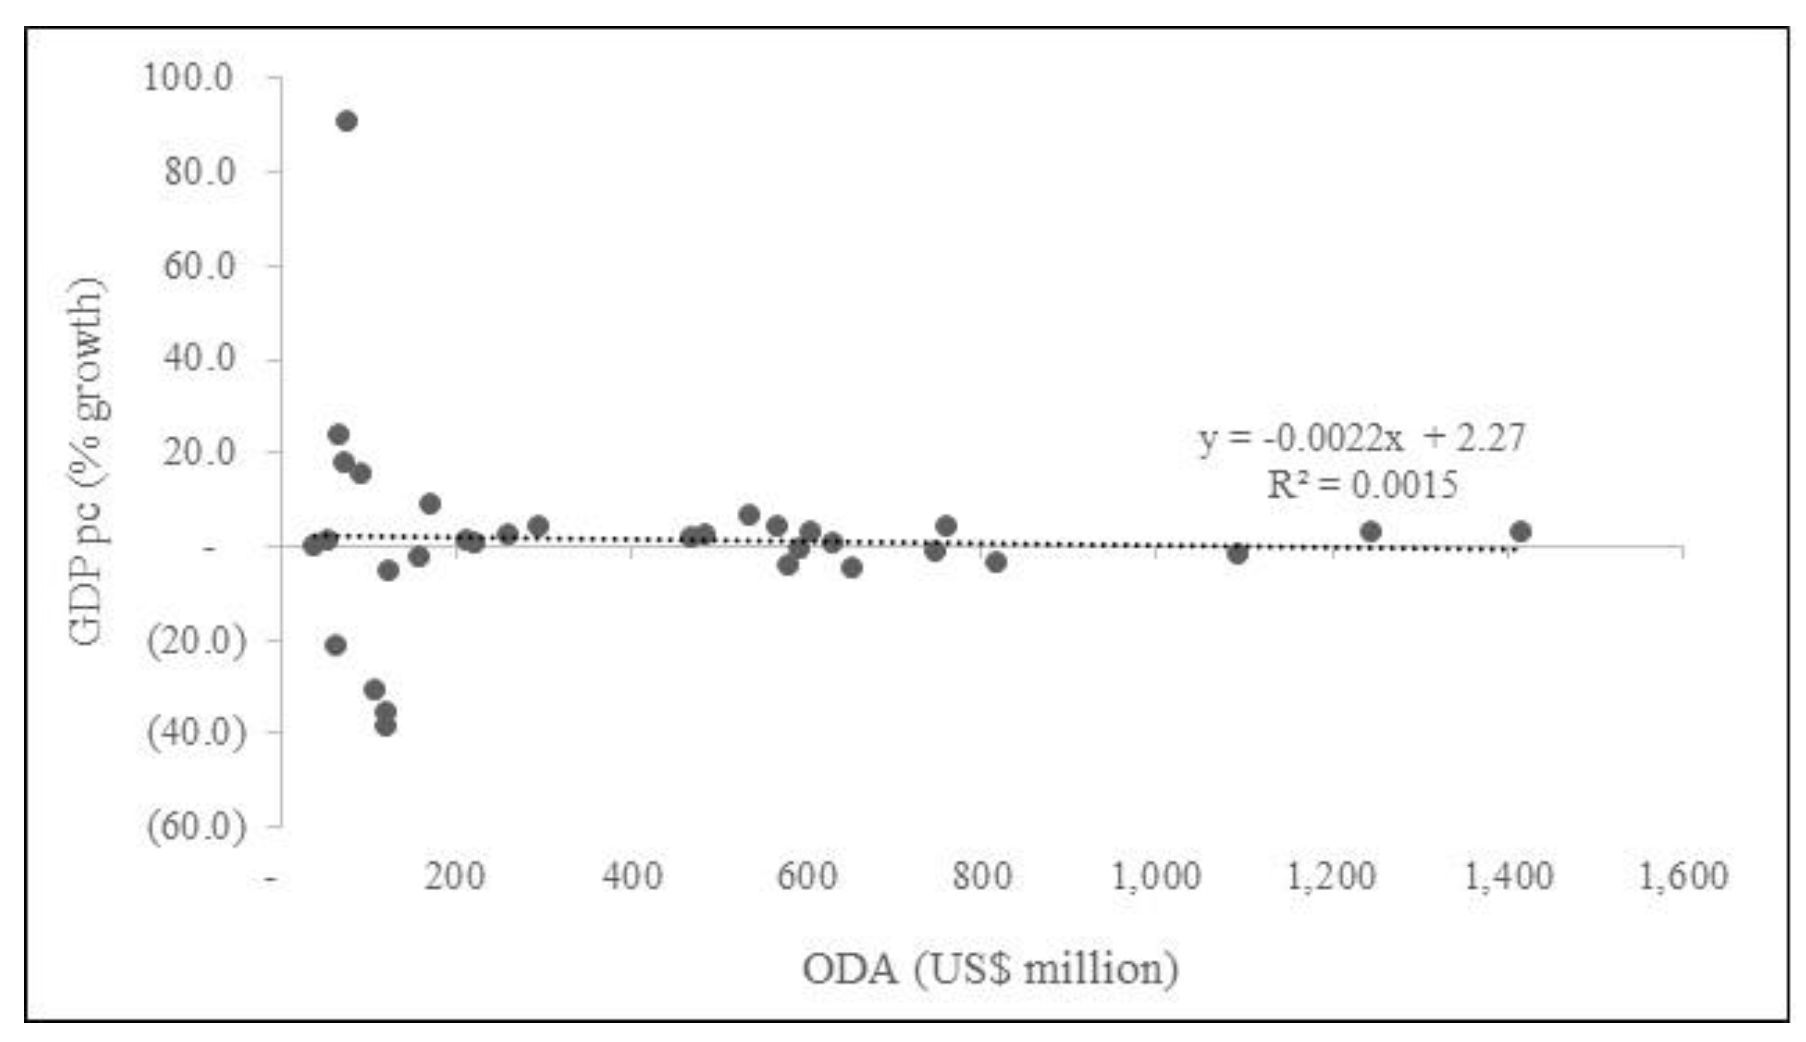
Figure 3.
Linkage between ODA and unemployment.
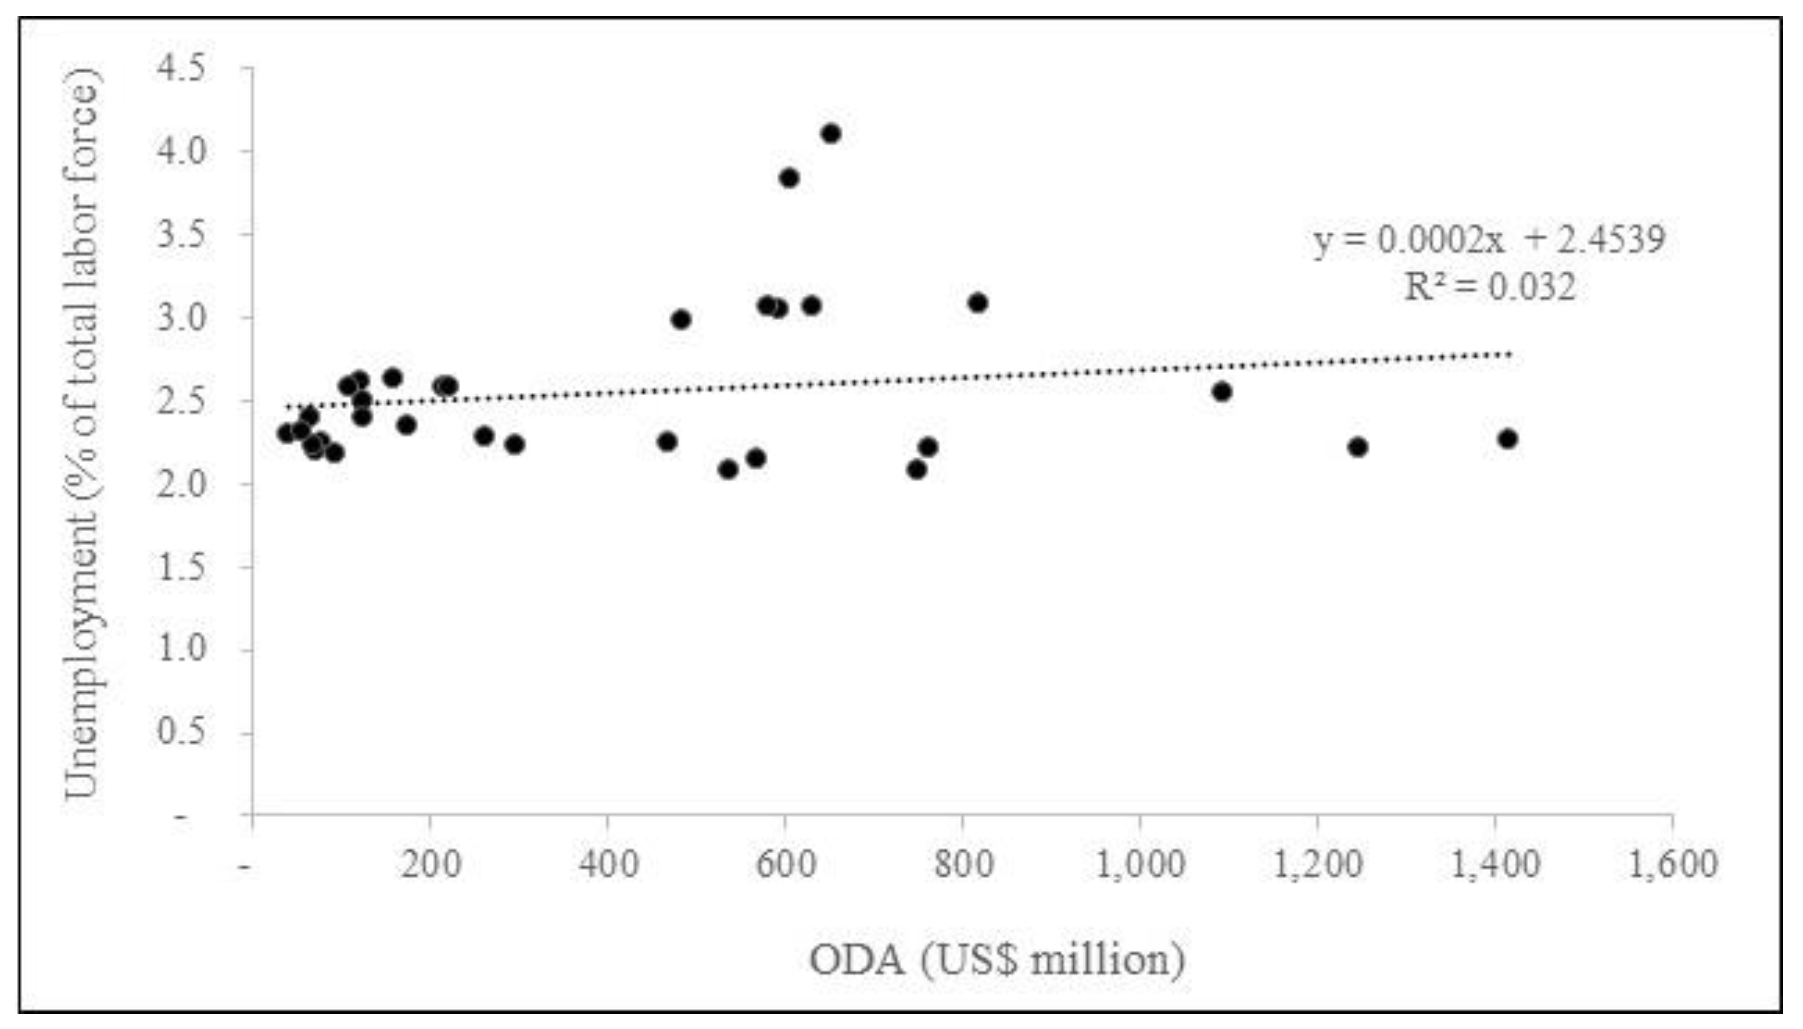
Figure 4.
Normality test.
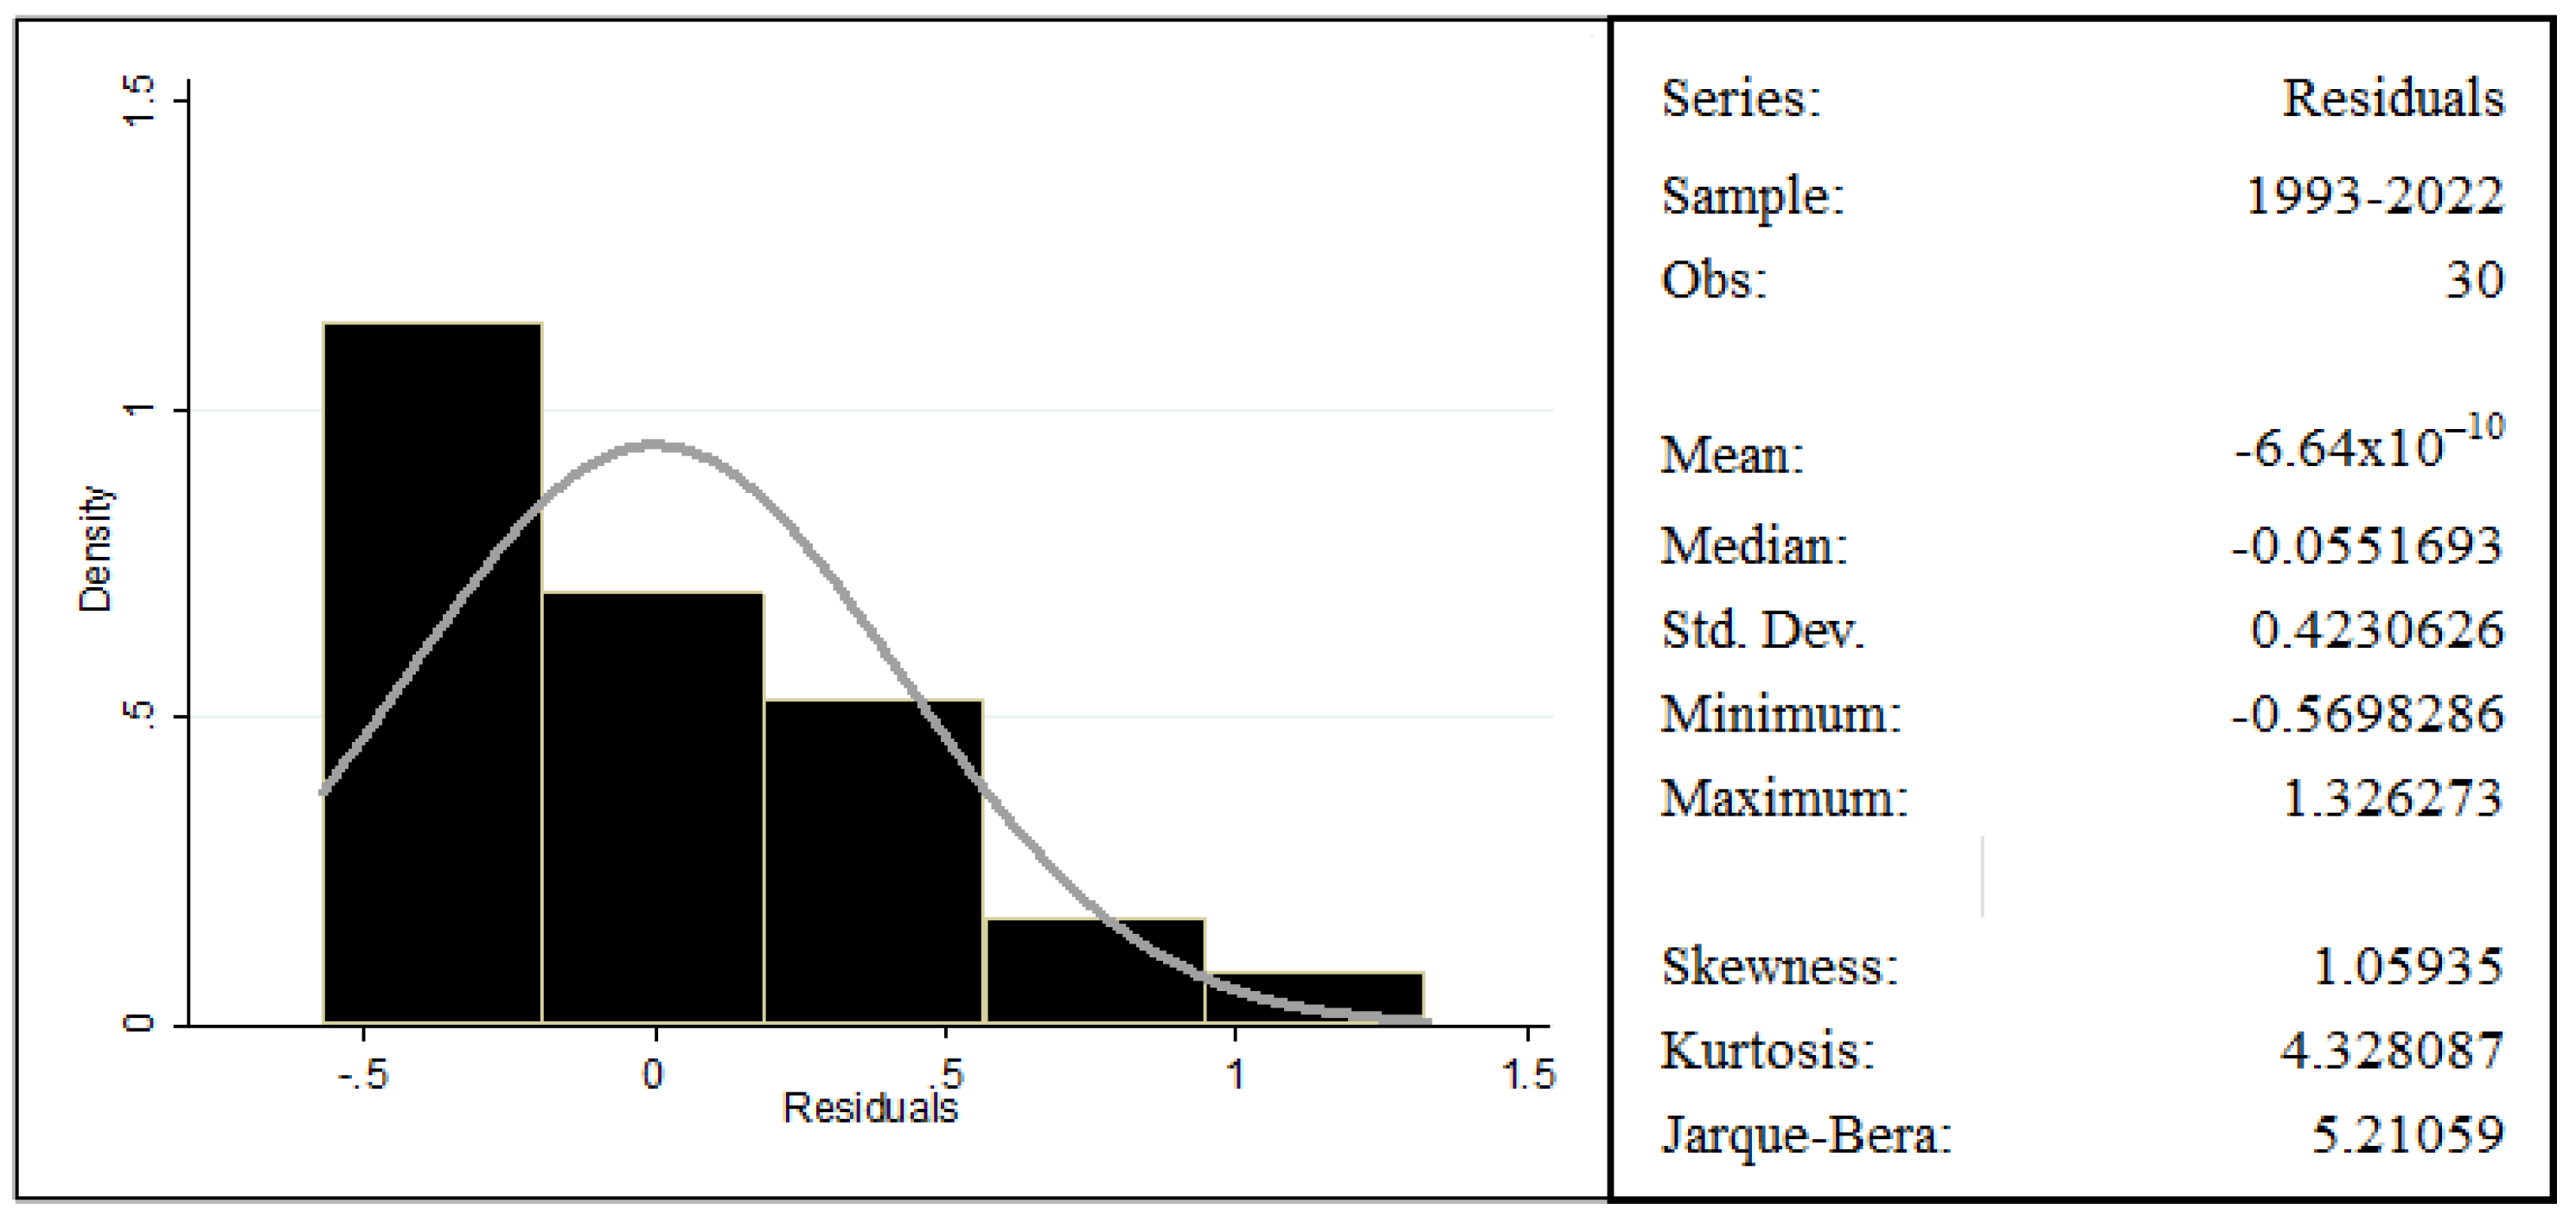
Figure 5.
CUSUM test results.
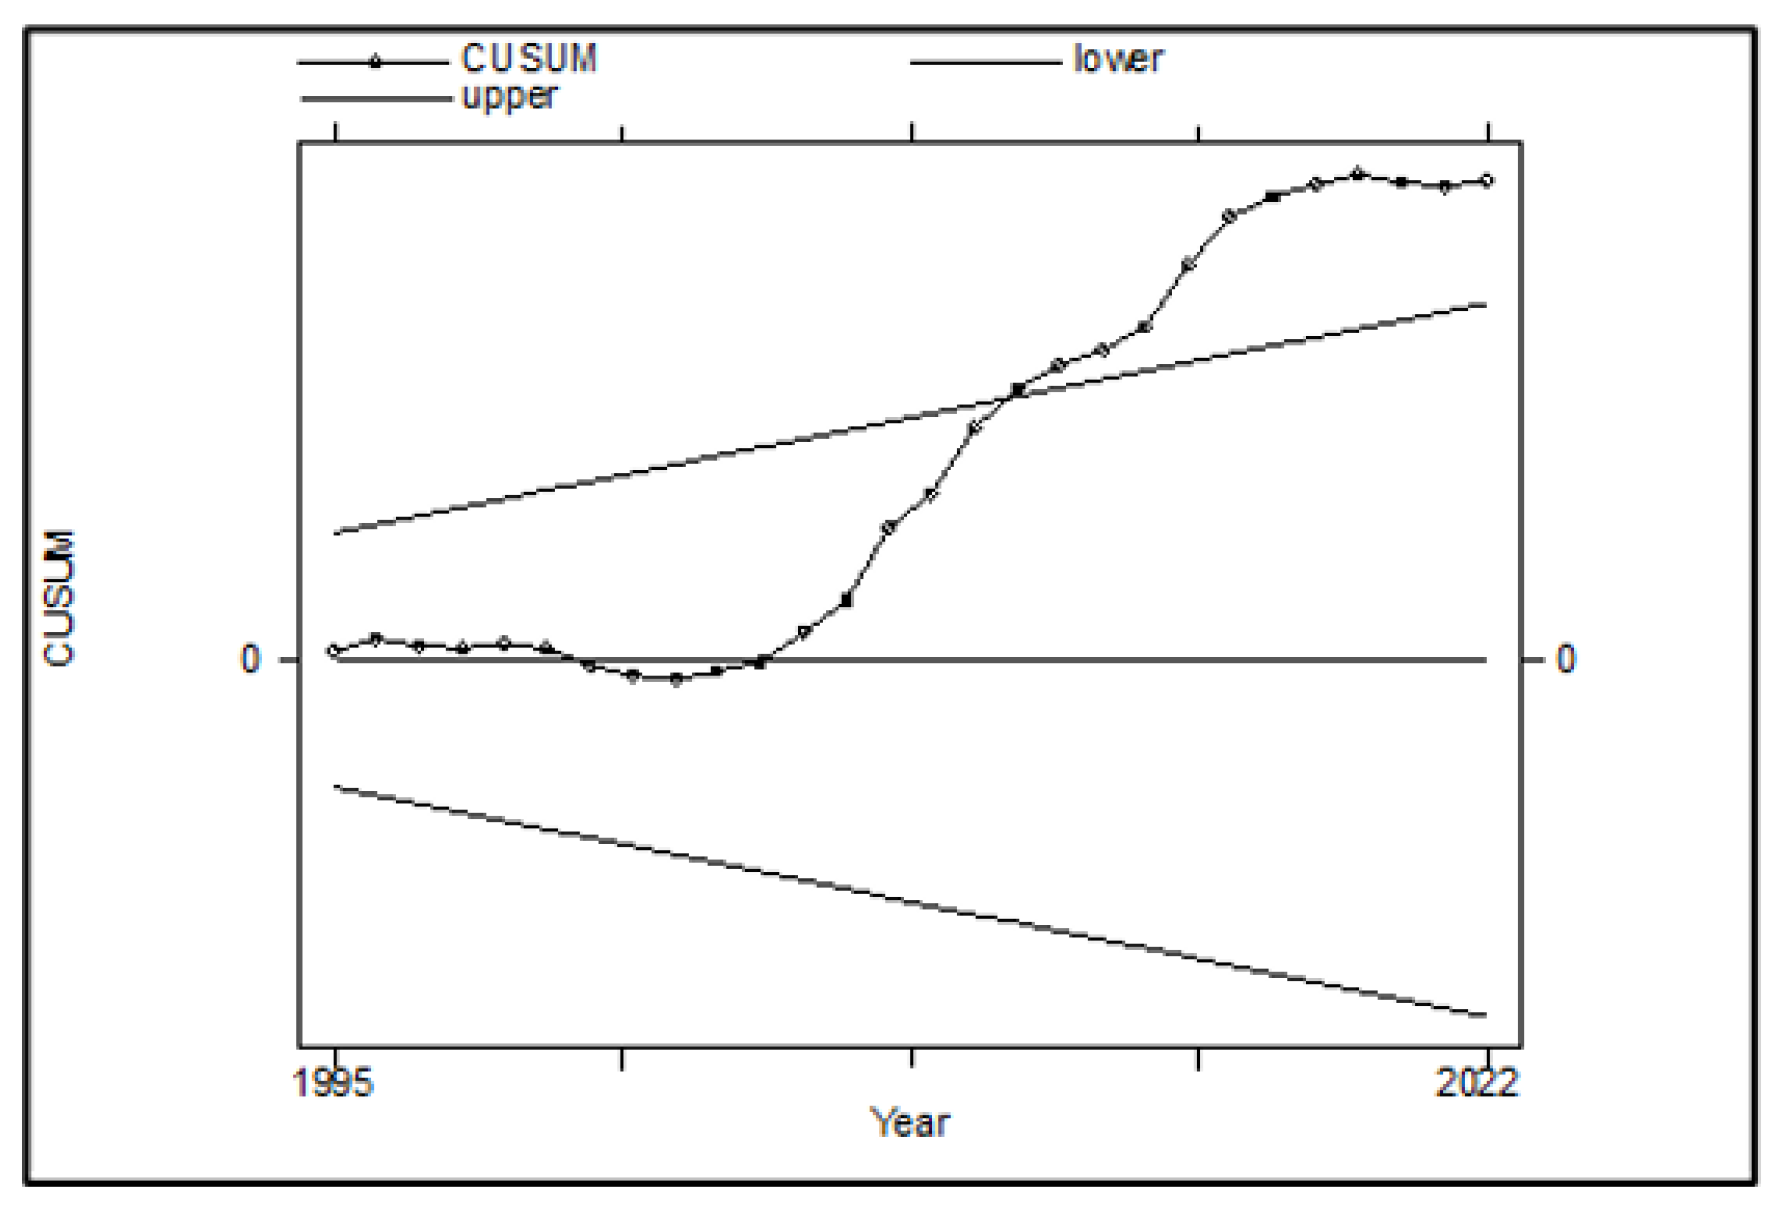
Figure 6.
CUSUM of squares test results.
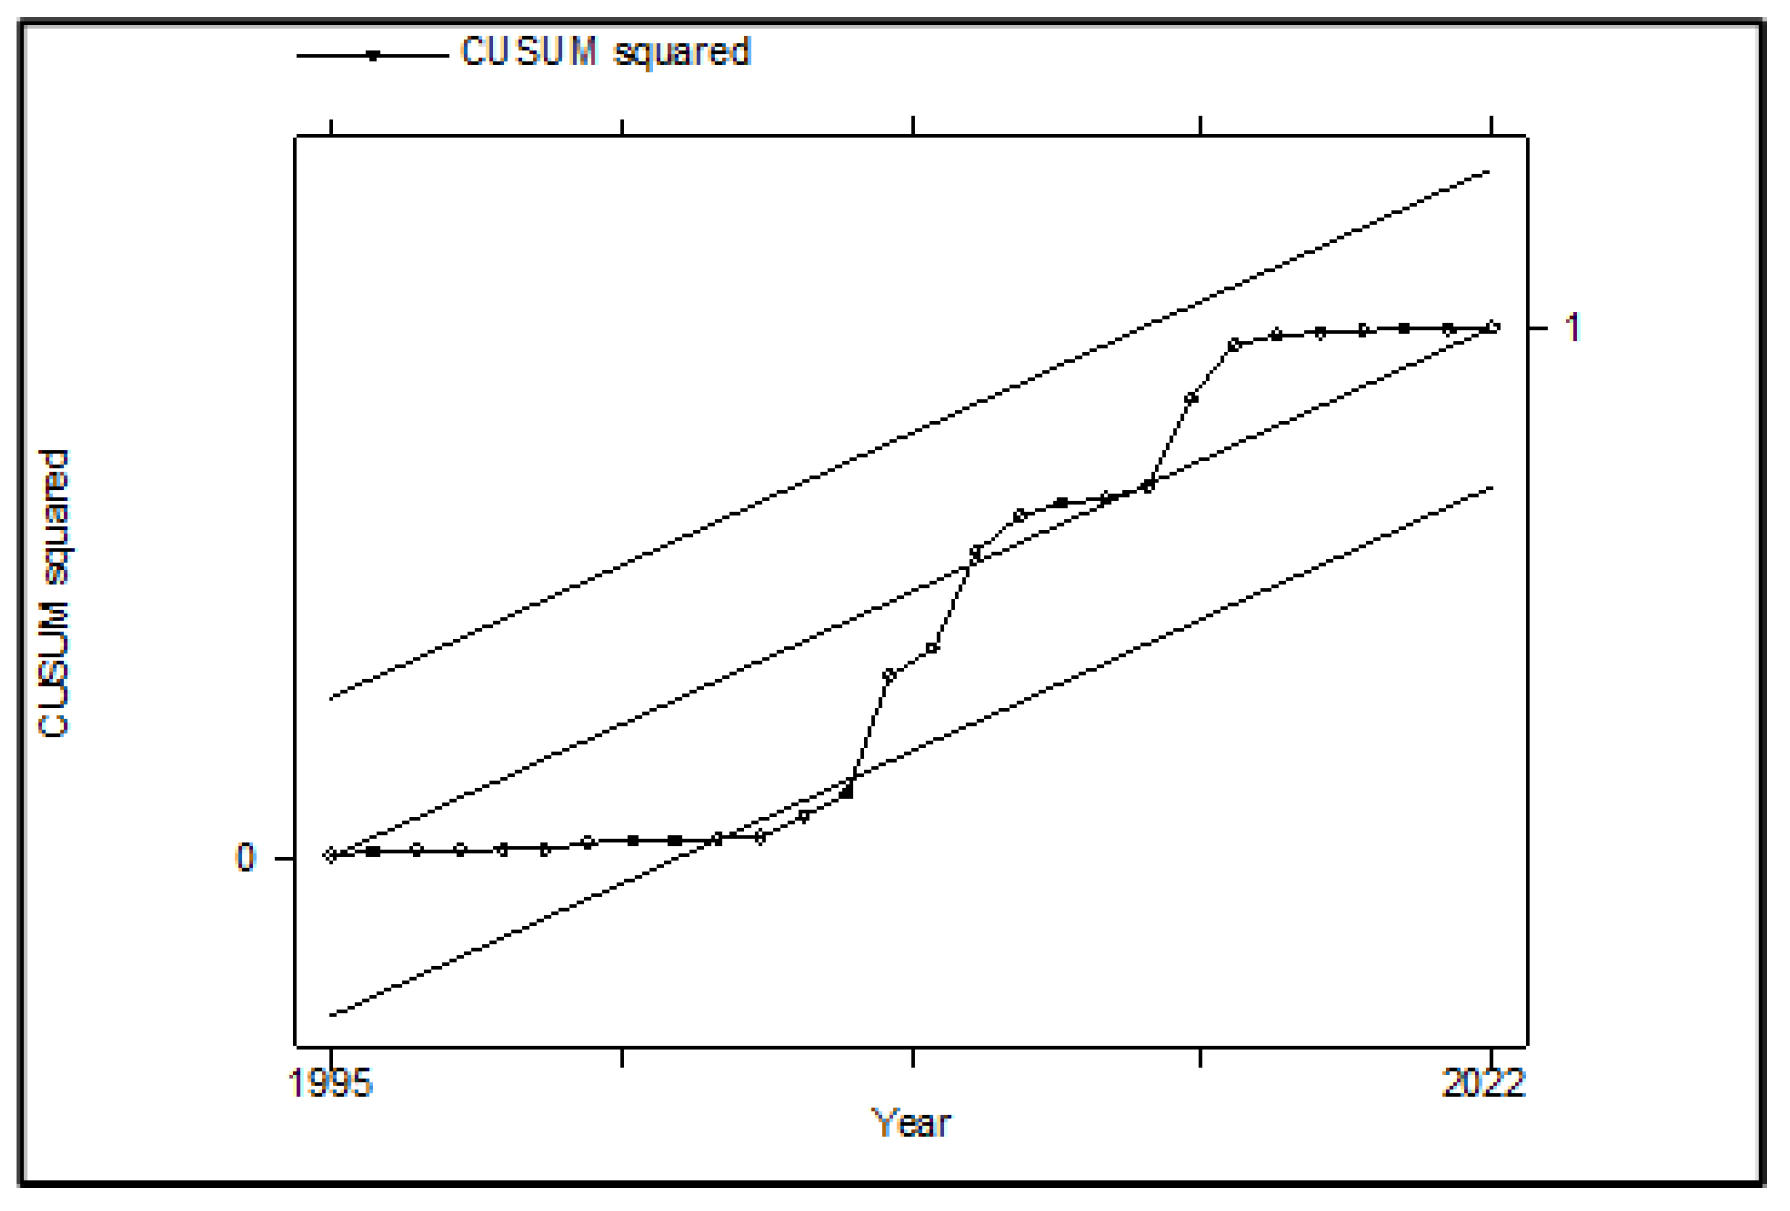
Table 1.
Summary of independent and dependent variables used in the study.
| Variables | Definition | Measurement | Source | Expected relationship |
| ODA | Net official development assistance and aid received | US$ million | World Bank | Independent |
| GDPpc | GDP per capita | growth rate (%) | World Bank | Positive |
| UnempR | Unemployment rate | growth rate (%) | World Bank | Positive |
Table 2.
Descriptive statistics results.
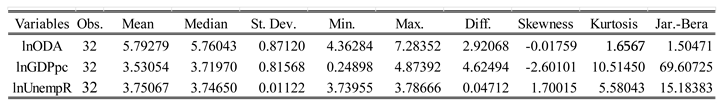 |
Table 3.
ADF and PP unit root tests with intercept.
| Variables | Augmented Dickey Fuller | Phillips–Perron | ||||||
| t-Statistic at level | t-Statistic 1st diff. | Level of Integration | t-Statistic at level | t-Statistic 1st diff. | Level of Integration | |||
| lnODA | –1.008 | –4.190 | I(1)* | –1.241 | –7.975 | I(1)* | ||
| lnGDPpc | –5.351 | –4.741 | I(0); I(1)* | –3.430 | –9.331 | I(0); I(1)* | ||
| lnUnempR | –2.260 | –4.725 | I(1)* | –1.743 | –3.873 | I(1)* | ||
| Critical values | –3.716 | –3.723 | 1% level* | –3.709 | –3.716 | 1% level* | ||
| –2.986 | –2.989 | 5% level** | –2.983 | –2.986 | 5% level** | |||
| –2.624 | –2.625 | 10% level*** | –2.623 | –2.624 | 10% level*** | |||
Table 4.
ADF and PP unit root tests with intercept and trend.
| Variables | Augmented Dickey Fuller | Phillips–Perron | ||||||
| t-Statistic at level | t-Statistic 1st diff. | Level of integration | t-Statistic at level | t-Statistic 1st diff. | Level of integration | |||
| lnODA | –1.645 | –4.103 | I(1)** | –2.394 | –7.829 | I(1)* | ||
| lnGDPpc | –4.728 | –5.029 | I(0); I(1)* | –3.583 | –9.888 | I(0); I(1)* | ||
| lnUnempR | –2.815 | –5.017 | I(1)* | –2.345 | –3.710 | I(1)** | ||
| Critical values | –4.334 | –4.343 | 1% level* | –4.325 | –4.334 | 1% level* | ||
| –3.580 | –3.584 | 5% level** | –3.576 | –3.580 | 5% level** | |||
| –3.228 | –3.230 | 10% level*** | –3.226 | –3.228 | 10% level*** | |||
Table 5.
Johansen cointegration test.
| Trend: | constant | Number of obs = | 31 | ||
| Sample: | 1992 - 2022 | Lags = | 1 | ||
| 5% | |||||
| maximum | trace | critical | |||
| rank | parms | LL | eigenvalue | statistic | value |
| 0 | 3 | 53.733124 | 0.0 | 16.5127 | 29.68 |
| 1 | 8 | 58.922559 | 0.28452 | 6.1339 | 15.41 |
| 2 | 11 | 60.84334 | 0.11655 | 2.2923 | 3.76 |
| 3 | 12 | 61.989492 | 0.07128 | ||
Table 6.
Short-run dynamics.
| Sample: | 1993 – 2022 | Number of obs | = | 30 | |||||
| Log likelihood | = | 67.43377 | AIC | = | –3.69559 | ||||
| FPE | = | 5.01E-06 | HQIC | = | –3.51628 | ||||
| Det(Sigma_ml) | = | 2.24E-06 | SBIC | = | –3.13511 | ||||
| Equation | Parms | RMSE | R-sq | chi2 | P>chi2 | ||||
| D_lnODA | 4 | 0.446804 | 0.1613 | 5.768364 | 0.1234 | ||||
| D_lnGDPpc | 4 | 0.596104 | 0.0858 | 2.81387 | 0.4212 | ||||
| D_lnUnempR | 4 | 0.007264 | 0.0226 | 0.693013 | 0.8748 | ||||
| Coef. | Std. Err. | z | P>|z| | [95% Conf. Interval] | |||||
| D_lnODA | |||||||||
| D_lnODA | |||||||||
| L1. | –0.3835 | 0.167867 | –2.28 | 0.022 | –0.71251 | –0.05449 | |||
| D_lnGDPpc | |||||||||
| L1. | –0.0521921 | 0.089706 | –0.58 | 0.561 | –0.22801 | 0.123628 | |||
| D_lnUnempR | |||||||||
| L1. | –3.570427 | 13.4614 | –0.27 | 0.791 | –29.9543 | 22.81344 | |||
| _cons | 0.0583664 | 0.07716 | 0.76 | 0.449 | –0.09286 | 0.209597 | |||
| D_lnGDPpc | |||||||||
| D_lnODA | |||||||||
| L1. | 0.1124568 | 0.223959 | 0.5 | 0.616 | –0.3265 | 0.551409 | |||
| D_lnGDPpc | |||||||||
| L1. | –0.1892359 | 0.119681 | –1.58 | 0.114 | –0.42381 | 0.045335 | |||
| D_lnUnempR | |||||||||
| L1. | 0.7956169 | 17.95953 | 0.04 | 0.965 | –34.4044 | 35.99565 | |||
| _cons | 0.1124058 | 0.102943 | 1.09 | 0.275 | –0.08936 | 0.31417 | |||
| D_lnUnempR | |||||||||
| D_lnODA | |||||||||
| L1. | 0.0013114 | 0.002729 | 0.48 | 0.631 | –0.00404 | 0.00666 | |||
| D_lnGDPpc | |||||||||
| L1. | –0.0000797 | 0.001458 | –0.05 | 0.956 | –0.00294 | 0.002779 | |||
| D_lnUnempR | |||||||||
| L1. | 0.1356358 | 0.218852 | 0.62 | 0.535 | –0.29331 | 0.564578 | |||
| _cons | 0.0000984 | 0.001254 | 0.08 | 0.937 | –0.00236 | 0.002557 | |||
Table 8.
VIF results.
| Variable | VIF | 1/VIF |
| D_lnGDPpc | 1.01 | 0.987638 |
| D_lnUnempR | 1.01 | 0.987638 |
| Mean VIF | 1.01 |
Table 9.
Breusch-Godfrey test for autocorrelation.
| lags (p) | chi2 | degrees of freedom | Prob > chi2 |
| 1 | 4.876 | 1 | 0.2072 |
Table 10.
White’s test for heteroscedasticity.
| chi2 | df | Prob > chi2 |
| 1.34 | 5 | 0.9311 |
Disclaimer/Publisher’s Note: The statements, opinions and data contained in all publications are solely those of the individual author(s) and contributor(s) and not of MDPI and/or the editor(s). MDPI and/or the editor(s) disclaim responsibility for any injury to people or property resulting from any ideas, methods, instructions or products referred to in the content. |
© 2025 by the authors. Licensee MDPI, Basel, Switzerland. This article is an open access article distributed under the terms and conditions of the Creative Commons Attribution (CC BY) license (http://creativecommons.org/licenses/by/4.0/).
Copyright: This open access article is published under a Creative Commons CC BY 4.0 license, which permit the free download, distribution, and reuse, provided that the author and preprint are cited in any reuse.


