
Submitted:
29 May 2025
Posted:
03 June 2025
You are already at the latest version
Abstract
Porous silica gel powders, doped with gold nanoparticles (AuNPs), were obtained by heating of silica gels containing 1-dodecanethiol and tetrachloroauric acid at temperatures of 450 oC, 700 oC and 900 oC and characterized using X-ray diffraction, TEM/EDS studies, UV/Vis reflectance spectroscopy and DTA/TG investigations. The color and microstructure of the obtained samples with a composition SiO2:AuNPs (about 0.03% Au) depend on the heating temperature. UV/Vis reflection spectra of the samples are explained with Mie’s theory. The thermal stability of the obtained samples, as well as the processes occurring in the sol-gel matrix upon heating, were monitored by DTA/TG. The textural properties of the obtained materials were described, based on adsorption-desorption isotherms. The obtained nanocomposites are promising pigments for ceramic glazes, similar to the Purple of Cassius. The textural properties of certain samples, SBET = 200 - 350 m²/g, mean pore diameter (DAV) of approximately 10 nm, and specific pore volume (Vt) between 0.5 and 0.8 cm³/g, make them promising candidates for catalytic applications, comparable to aerogel-like materials.
Keywords:
gold nanoparticles
; silica
; sol-gel
; ceramic pigments
; nanocomposites
1. Introduction
Gold nanoparticles (AuNPs) exhibit unique optical properties due to their surface plasmon resonance (SPR), where conduction electrons on the particle surface collectively oscillate in response to specific light wavelengths. This phenomenon results in strong absorption and scattering of light, with the SPR peak’s position influenced by factors such as particle size, shape, aggregation state, and the surrounding medium’s refractive index. Incorporation of AuNPs into silica materials leads to nanocomposites which can be applied as catalysts or ceramic pigments. One of the oldest and most prominent red glass pigments is the Purple of Cassius, consisting AuNPs in silicate matrices using Sn2+ as a reduction agent [1,2,3]. The development of nanotechnology gives powerful instruments for the preparation of silica composites, containing gold nanoparticles using a wide variety of reduction agents or physicochemical techniques [4,5,6]. By combining nanotechnological approaches with Mie theory based calculations nanocomposites with tunable optical and textural properties can be obtained. Moreover, silica doped with AuNPs, SiO2:AuNPs, is a promising multifunctional material with potential applications in photothermal therapy, drug delivery and cell bioimaging [7,8].
Sol-gel technology is a method for producing materials, by a chemical process that involves the conversion of a solution (sol) into a solid (gel) phase. The process involves the hydrolysis and condensation reactions of metal alkoxides or metal salts in a liquid medium, usually water or alcohol. Sol-gel technology is used in a wide range of applications, including the production of ceramics, glasses, coatings, fibers and catalysts. One of its key advantages is the ability to form materials at relatively low temperatures, which is particularly beneficial for certain applications. An additional advantage of the sol–gel process lies in its ability to promote molecular-level homogenization of multicomponent systems, thereby enabling the formation of uniformly doped powders as well as bulk xerogels or aerogels, depending on the selected drying method [9].
Recently, we developed a specific and efficient one-pot sol-gel method for preparing silica powders doped with gold nanoparticles (AuNPs), using 1-dodecanethiol, tetraethoxysilane, and tetrachloroauric acid [4,7,8]. The reduction occurs upon heating and the resulting powders become irreversibly red–pink colored. In this way, a red–purple ceramic pigment is produced without the use of Sn²⁺ as a reducing agent, unlike in the traditional synthesis of Purple of Cassius [1,5]. In our previous studies, certain aspects, such as the porosity of the obtained powders and the temperature required for ceramic pigment formation, have remained open questions. From a physicochemical point of view, thermal treatment may induce crystallization of the silicate matrix, as well as, agglomeration and coalescence of the gold nanoparticles, which could drastically alter the physical properties of the resulting nanocomposites. From the perspective of a physical description of the optical properties of ceramic pigments based on gold nanoparticles, the development of an appropriate algorithm—grounded in Mie theory for polydisperse powders, is more than necessary.
This study builds upon our previous work and aims to provide a comprehensive analysis of the influence of temperature on the optical and textural properties of nanocomposites synthesised via a novel heating method. This approach employs 1-dodecanethiol, tetraethoxysilane, and tetrachloroauric acid as precursors, leading to the formation of highly porous SiO₂:AuNPs ceramic pigments at heating.
2. Results
2.1. Preparation Conditions
Gold-doped silica powders were synthesised via a sol–gel route, based on 1-dodecanethiol, tetraethoxysilane and tetrachloroauric acid. Initially, 5.6 ml of 12 mM ethanolic solution of tetrachloroauric acid (HAuCl₄) was prepared and used as the gold precursor. To this solution, 1.5 ml of absolute ethanol was added, and the mixture was stirred for 5 minutes. Subsequently, 5 ml of tetraethyl orthosilicate (TEOS) was introduced and stirred for an additional 5 minutes. Controlled hydrolysis was initiated by adding 0.4 ml of destilled water, followed by stirring for 1 hour at room temperature to promote gel formation. Next, 0.54 ml of 1-dodecanethiol (DDT) was added to the mixture to facilitate in situ reduction and stabilization of gold nanoparticles. Then, a small amount of catalyst (3 mL) was added to accelerate the condensation reactions within the sol–gel network. The chemical composition of the catalyst solution used here is H2O, C2H5OH and NaOH. It is a typical base gelation catalyst, used in sol-gel chemistry to accelerate the condensation process. As has been pointed out in our recent contributions [2,3], the use of an ammonia base catalyst leads to the formation of Au-NH3 complexes, this is why NaOH was used here. On the other hand, the use of NaOH leads to the formation of NaCl traces in the final gel, visible in the X-ray diffraction diagrams of the heated and non-heated gels. The scheme used here led to reproducible transparent sol and gel products. Slow gelation results in participation of gold microcrystals on the walls of the plastic reactor or on the bottom of the gel species.
The resulting sol was left to dry at room temperature and bulk non-uniform gels were obtained. Finally, thermal treatment was performed by heating the pulverized samples at temperatures ranging from 450 °C to 900 °C for 3 hours, leading to the formation of silica-based powders, containing embedded gold nanoparticles. The schematic representation of the sol–gel synthesis route for AuNPs-doped silica materials is shown in Figure 1.
It is evident that the color of the resulting composites depends on the preparative conditions. The composite containing the Au-SC12H25 complex (SiO2:Au-SC12) exhibits a yellowish hue, while the most intense red coloration is observed at a heating temperature of 450 °C. Powders obtained at temperature T=900oC display a weak pink coloration.
2.2. X-Ray Diffraction and Thermogravimetric Analyses
X-ray diffraction study confirms that the SiO₂:AuSC₁₂H₂₅ composites are amorphous at low temperatures (Figure 2). Upon heating to 450 °C, gold nanoparticles begin to form and grow with temperature increasing, as indicated by the narrowing of diffraction peak widths. Traces of NaCl could also be detected. The mean particle sizes, calculated using the Scherrer equation for the (111) reflection of gold, are approximately 15 nm, 38 nm, and 42 nm for samples heated at 450 °C, 700 °C, and 900 °C, respectively. This increase in crystallite size with temperature is consistent with the known thermal behavior of gold nanoparticles. Phase analysis of the sample heated to 900 °C (S1) reveals the presence of 74% tetragonal low cristobalite (c, ICSD 34932) and 26% monoclinic low tridymite (t, ICSD 176).
The DTA/TG curves presented here (Figure 3) are consistent with our previous studies on silicate gels doped with gold nanoparticles [3,4,9]. Two distinct weight loss steps are observed: the first occurring up to approximately 200 °C, attributed to dehydration of the silicate matrix—a typical feature of sol-gel-derived materials; and the second, around 300 °C, corresponding to the thermal decomposition of 1-dodecanethiol. These thermal profiles closely resemble those of silicate gels containing oleic acid and gold nanoparticles, as reported in our earlier work. However, the decomposition events in the present study are shifted to lower temperatures [3].
2.3. TEM Results
TEM results (Figure 4, Figure 5 and Figure 6) confirm the polydisperse nature of the synthesized optical material, both in terms of the optically active component and the gold nanoparticles (AuNPs) formed at elevated temperatures. Qualitatively, three distinct fractions of AuNPs with different sizes and morphologies are observed, dispersed within the amorphous silicate matrix:
- fraction A - spherical particles below 40 nm (nanospheres)
- fraction B - nanostars about 100 nm (nanostars)
- fraction C - large, walled nanocrystals above 200 nm (giant nanocrystals).
At 900 °C, fractions B and C are dominating the nanoparticles distribution. However, even at this temperature, AuNPs smaller than 40 nm—and in some cases as small as 10 nm—are still observed. At 450 °C, fraction A is predominant, with numerous particles measuring less than 10 nm. At 700 °C, a mixture of all three fractions is present.
The formation of the nanocrystalline fraction C (giant nanocrystallites) can be explained by the melting and subsequent coalescence of gold nanoparticles, a process driven by the well-known phenomenon in nanoscience whereby smaller nanoparticles exhibit reduced melting temperatures.
Electron diffraction study (SAED) indicates clearly the presence of monoclinic low trydimite in the cristobalite rich regions (Figure 7). Large d-spaces are observed - 4.8055 (), 4,5511 (111), 4.5896 (), respectivelly. Such a finding is in accordance with the results in [10] suggesting a coexistence of crystobalite and trydimite fractions in crystallized silica. However, the results from HRTEM indicate that particles below 40 nm (fraction A) is still present.
The textural properties of the heated gels, compared to that of the precursor (SiO2:AuSC12H25) are summarized in Table 1. The initial material, (SiO2:AuSC12H25) displays high mesoporosity, combined with a comparable specific surface area. The specific surface increases at heating at 450 oC because of burning of the complex. Sintering at temperatures 750 oC and 900 oC leads to densification of the powdered gels together with a strong decrease of their porosity, specific surface and average pore diameter. The specific surface area is calculated using the BET isotherm.
The pore size distribution is shown in Figure 8. A bimodal distribution is observed for the non-heated sample and the sample heated at 450 oC.
Figure 8.
Pore size distributions for the samples, the heating temperature is shown. The samples heated at 700 and 900 oC are shown in the inlet for clarity.
Figure 8.
Pore size distributions for the samples, the heating temperature is shown. The samples heated at 700 and 900 oC are shown in the inlet for clarity.
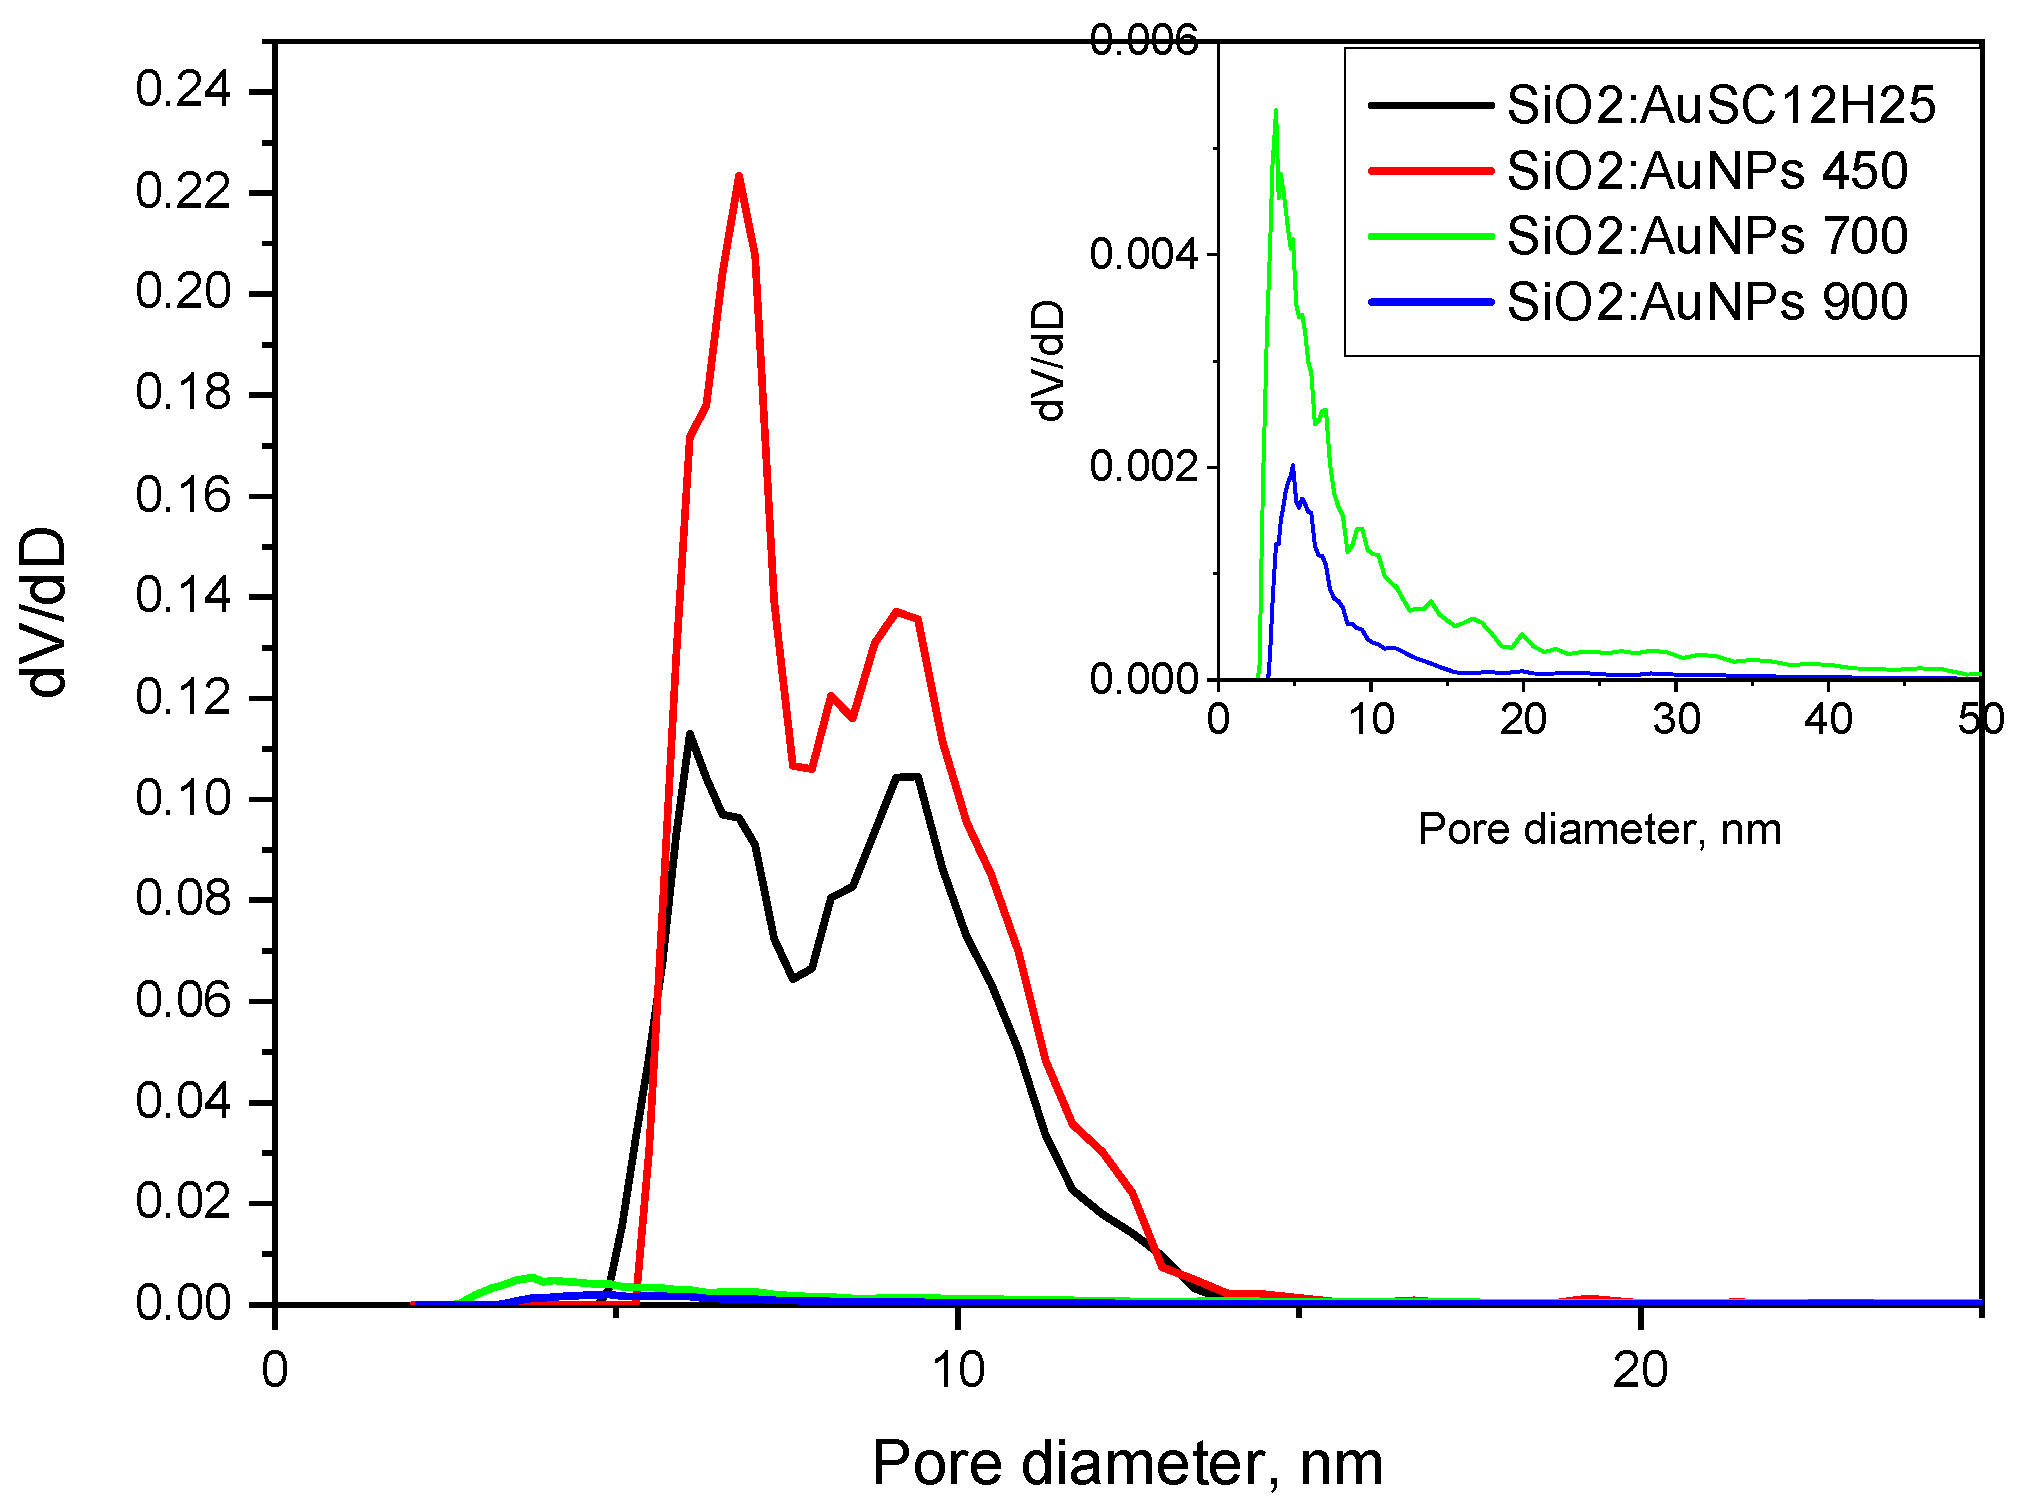
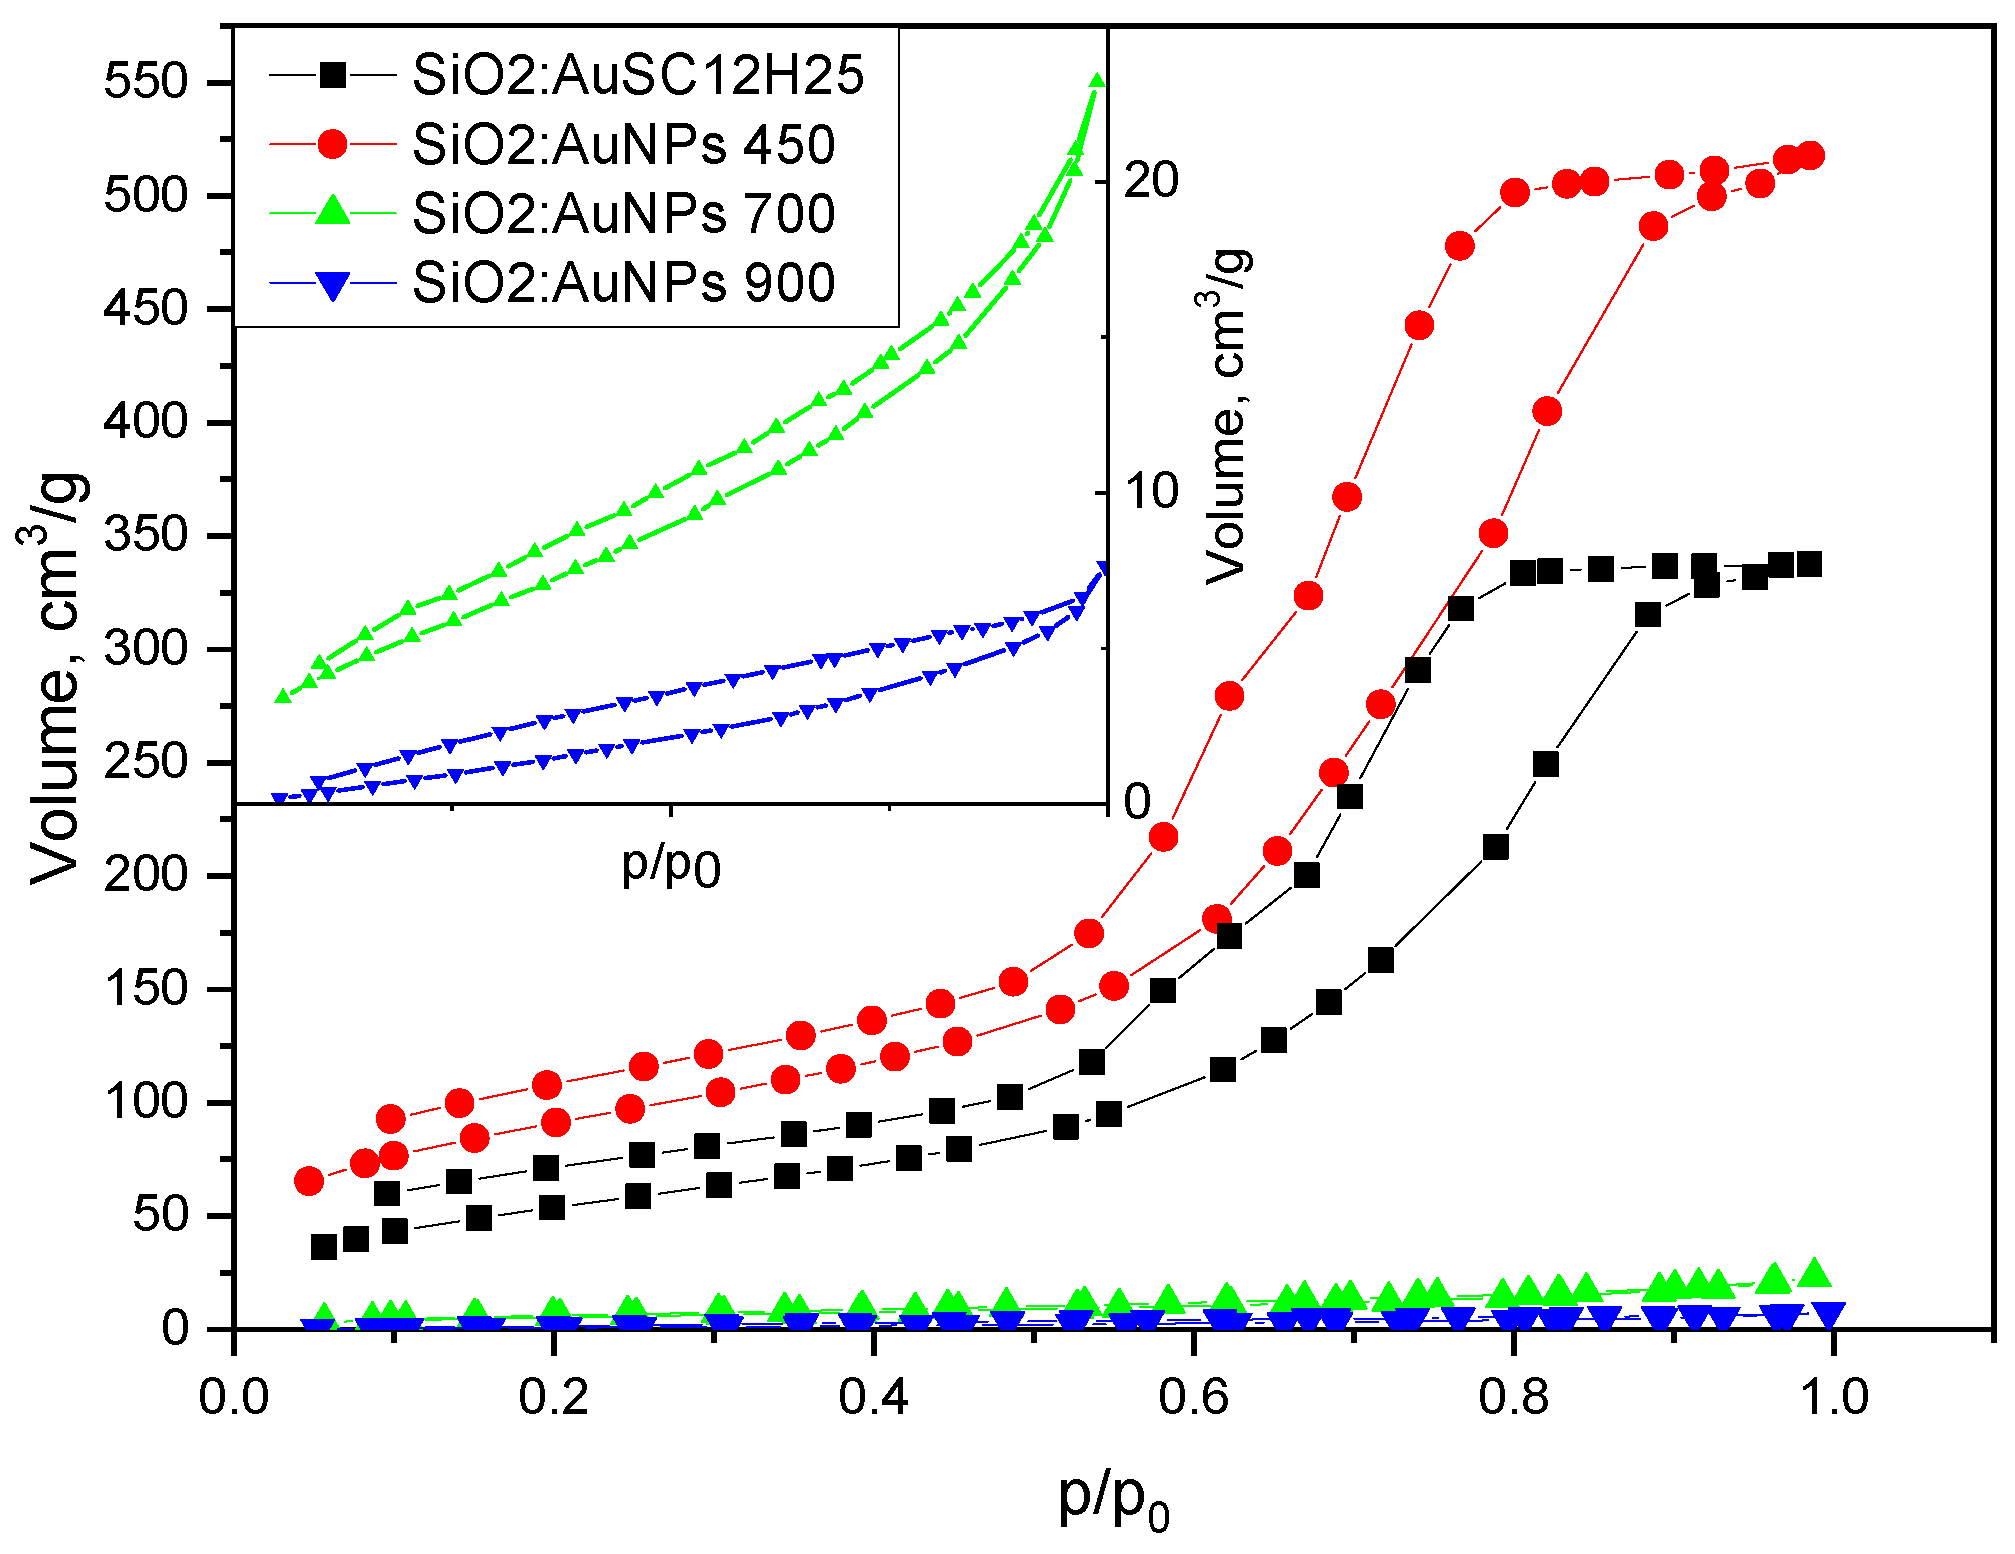
Figure 9.
Textural properties of the investigated species. Samples heated at 700 and 900 oC have very low specific surface area and are shown in the inlet for clarity.
Figure 9.
Textural properties of the investigated species. Samples heated at 700 and 900 oC have very low specific surface area and are shown in the inlet for clarity.
2.4. UV/Vis Results
Figure 10 displays UV/Vis reflectance spectra of powders, heated at different temperatures. In the spectra, a strong absorption peak at about 18 870 cm-1 (530 nm) is visible. This wavelength of 530 nm aligns with the typical range for the localized surface plasmon resonance (SPR) of spherical gold nanoparticles surrounded by silica.
It can be seen that the peak at 530 nm consists of at least two Lorentzian components, which can be attributed to the size distribution of the AuNPs. This type of analysis can indeed offer deeper insights into the role of the silica matrix and the nanoparticle size dispersion in determining the optical properties [11].
Lowering the annealing temperature results in a pronounced increase in the intensity of the 530 nm peak. Assuming that the integral absorption intensity at 530 nm for the powders obtained at 450 °C is 100%, the corresponding intensities for the samples treated at 700 °C and 900 °C are approximately 60% and 25%, respectively.
However, the spectrum of nanocomposites obtained at a temperature of T = 900 °C differs significantly from the first two cases. The intensity of the 530 nm peak is notably reduced and accompanied by strong absorption in the ultraviolet region, comparable in magnitude to the 530 nm feature. This high UV absorption is likely due to defect states in the crystalline cristobalite-like matrix, as discussed in previous publications [3,12,13].
3. Discussion
According to Mie’s theory, the red-violet color of AuNPs is attributed to the fraction with dimensions up to about 50 nm. The intensity of the absorption peaks depends on the number of nanoparticles, while the color depends on their size and surroundings. Mie’s theory explains optical properties via the dielectric permittivity of AuNPs, which depends on the wavenumber through the Drude model. In this case the corresponding spectral intensity is well approximated via the Lorentzian function [11,14].
where is the height of the k-th peak with maximum at and full width at half maximum (FWHM) . From the latter one can calculate the mean free path of electrons in a gold nanoparticle, where is the speed of light and is the Fermi velocity of gold. The maximum of the peak depends strongly on the medium around the particle via its dielectric constant
where is the Langmuir plasmon frequency of gold. Because is very high, only electrons can follow the resonant frequency in the surroundings. Thus, the corresponding high frequency dielectric constant equals to the square of the refractive index. Hence, one can calculate via Mie’s theory as well from the experimental spectra [11].
The spectra from Figure 11 are fitted using a superposition of two Lorentzian functions, each representing a population of gold nanoparticles with distinct sizes and surrounding environments.
The results of the conducted procedure are summarized in Table 2:
As is seen, the two Lorentzian peaks are slightly affected by temperature. The first one corresponds to gold nanoparticles with mean free path nm surrounded by a medium with refractive index , while the second lower peak corresponds to nm and . Obviously, the larger AuNPs are in close contact with the SiO2 matrix, which possesses a refractive index about , while the smaller ones are distributed in some pores. The areas of the two Lorentzian peaks are commensurable, which means equal volume fraction of the two kinds of gold nanoparticles.
At heating of SiO2:Au-SC12H25, an irreversible decomposition reaction of Au-SC12H25 takes place, which produces AuNPs (Au0) and volatile organosulfur products. It follows, that the sintering temperature plays a crucial role for the physical properties of the obtained nanocomposite. It is well established, that the formation of gold particles during reduction follows the Finke–Watzky mechanistic model, which is characterized by a slow nucleation, followed by a rapid chemical reaction and crystal growth [15,16]. In our case, the effect of temperature is two-fold: its’ increase induces the size-dependent melting of gold nanoparticles followed by coalescence. As a result the fraction of “giant nanocrystals” observable by TEM, which do not contribute significantly to the absorption intensity of the SPR peak at 530 nm. Our results (Figure 4, Figure 5 and Figure 6) indicate that low heating temperatures prevent nanoparticle agglomeration, thereby increasing their concentration and consequently enhancing the absorption intensity in such samples. The increase in sintering temperature also leads to a change in the silicate matrix. While at 450 °C the matrix is amorphous, at 900 °C it becomes crystalline (Figure 1, Table 1). In our view, this sample heated at 900 oC represents the first successful attempt to obtain cristobalite doped with gold nanoparticles. The occurrence of monoclinic low tridimite nanocrystals, accompanying the crystallization of cristobalite is in accordance with the results published in [17,18,19]. From a general physico-chemical point of view, the formation of metastable silica phases at cooling is explained by the Ostwald’s rule of stages [18]. The densification of the powders (Table 1, calculated densities) at heating is combined with a drastical decrease of their specific surface area and porosity, combined with a low temperature crystalization of the silica matrix. The pore diameter decreases twice at increased heating temperature, showing the matrix densification after heating. The amorphous samples here posses a high specific surface area (200-330 m2/g), typical of aerogel-like silicate materials, and show promise as potential catalysts or glaze pigment [20]. The catalytic properties of SiO2:AuNPS for different chemical reactions are well known [20,21,22,23,24,25,26]. An intriguing trend is observed in Table 1 regarding the thermal behavior of the samples. Upon heating to 450 °C, the specific surface area increases, likely due to the combustion of the organic component. A similar approach—thermal decomposition or evaporation of organic components—is commonly employed in the synthesis of mesoporous, thermally insulating aerogel materials, often utilizing natural raw materials [21]. At higher temperatures, however, a significant decrease in surface area occurs as a result of powder densification. This densification also affects the pore structure, with the average pore diameter decreasing from approximately 10 nm to around 5 nm. Furthermore, the pore size distribution curve shifts, indicating changes in the uniformity and range of pore sizes as a function of temperature.
An analysis of the nitrogen adsorption–desorption isotherms (Figure 8 and Figure 9) reveals that all samples exhibit hysteresis loopsm characteristic of Type IV isotherms, which are typical for mesoporous materials with pore diameters in the range of 2–50 nm (IUPAC classification) [27,28,29,30]. A t-plot was constructed using the de Boer standard isotherm (Harkins–Jura or de Boer model), as shown in Figure 12 [31,32]. The sample isotherm is plotted versus the standard isotherm and the deviations are interpreted in the following paragraphs. Both the non-heated sample and the sample annealed at 450 °C display H2(b)-type hysteresis loops [28], typically associated with complex pore structures and pore size polydispersity. This type of loop indicates a closed-pore morphology, often with “ink-bottle” shaped pores, where narrow necks restrict desorption. Such structures result in complete pore filling at high relative pressures and steep desorption branches due to delayed evaporation from the pore interiors. These features are consistent with the pore size distribution data (Figure 8), which show that the non-heated sample has an average pore diameter of 10 nm and a bimodal distribution with peaks at 6 and 9.4 nm. The sample annealed at 450 °C exhibits a slightly smaller average pore diameter (9.7 nm), with peaks centered at 6.8 and 9 nm. The reduced pore size contributes to the increased specific surface area observed in the thermally treated sample. In contrast, the samples annealed at 700 °C and 900 °C still exhibit Type IV isotherms but with markedly different hysteresis loop types. These samples show significantly reduced specific surface areas (21 and 9 m²/g, respectively) and smaller average pore diameters (6.9 and 5 nm, respectively) compared to those treated at lower temperatures. The sample heated at 700 °C displays an H3-type hysteresis loop, commonly attributed to slit-like pores formed between plate-like particles or aggregates. The sample annealed at 900 °C exhibits a H4-type hysteresis, which shares similar structural origins with H3 but is generally associated with narrow slit-shaped pores and mesoporous materials. Notably, both samples lack saturation at high relative pressures, suggesting the presence of non-rigid porous frameworks capable of structural swelling [28]. The low closure points of the hysteresis loops further imply a broad pore size distribution. These interpretations are supported by the calculated t-curves (Figure 12).
The t-plots for SiO₂:AuNPs and SiO₂:AuNPs_450 show significant deviations from the linear trend at high relative pressures, consistent with mesoporous oxide materials exhibiting capillary condensation. In contrast, the t-curves for SiO₂:AuNPs_700 and SiO₂:AuNPs_900 conform relatively well to a straight line, with only minor deviations at intermediate and high pressures. The lower adsorbed volume at high relative presure might be connected to the presence of some mesopores in the gels. This near-linear behavior resembles that of a Type II isotherm, typically observed for non-porous or macroporous materials [28], and suggests metastability in the adsorbed multilayer and delayed condensation due to high pore curvature radii and a non-rigid gel structure. The findings are consistent with the phase analysis of the sample SiO₂:AuNPs_900. Cristobalite and tridymite have layered structures and low specific surface areas due to microporosity – 2 m2/g and 2,8 to 7.4 m2/g respectively, together with a density about 2.30 g/cm3 [33,34].
4. Materials and Methods
The following chemicals were used for the syntheses of the nanocomposite materials: absolute ethanol (EtOH), tetraethyl orthosilicate (TEOS), tetrachloroauric acid tri-hydrate (HAuCl4⋅3H2O), 1-dodecanethiol (DDT), sodium hydroxide (NaOH) and distilled water. All chemicals were supplied by Sigma-Aldrich. The chemicals were of analytical grade. The catalyst used in this study consists of water (H2O), ethanol (EtOH) and sodium hydroxide (NaOH). Reflectance measurements were performed on a spectrometer PE Lambda 35 (PerkinElmer LLC, USA) with a Spectralon®-coated integrating sphere and the Kubelka–Munk function F(R) was calculated from the diffuse reflectance R for all samples [35]. The spectral features were analyzed by a Lorentzian fit to extract peak position (xc), full width at half maximum (FWHM) and integrated absorption intensities (A). Labsphere Spectralon ™ Diffuse Reflectance white and black standards SRS-99–010, SRS-02–010 and a Ho2O3 powder were used as a reference.
The structure and microstructure of all samples were characterized by X-ray diffraction with Cu-Kα (1.5418 Å) radiation (Empyrean, Malvern Panalytical X-ray diffractometer), at a step of 2θ = 0.05o and counting time 4 s/step. The mean crystallite sizes are calculated using Scherrer’s equation from the 111 peak of Au. The x-ray diffraction data are analyzed using the PowderCell software [36].
TEM analyses were performed using an electron microscope JEOL, model JEM 2100 at 200 kV with LaB6 filament, manufactured in Japan and CCD camera - Gatan Orius 1000. The model of the STEM – EDAX is Oxford Instruments, model X-Max 80T. The results of the TEM image analysis, are conducted using the ImageJ software [37]. Over 20 images containing a total of more than 300 crystals were analyzed.
The texture characteristics of the aerogel powders were determined by low temperature (77.4 K) nitrogen adsorption in a Quantachrome Instruments NOVA 1200e (Boynton Beach, FL, USA) instrument. The nitrogen adsorption–desorption isotherms were analyzed to evaluate the following parameters: the specific surface areas (SBET) were determined on the basis of the BET equation, and the total pore volumes (Vt) and associated average pore diameters Dav were estimated at a relative pressure close to 0.99. All the samples were outgassed for 16 h in vacuum at 150 oC before the measurements. The pore size distributions (PSD) were calculated by Nonlocal Density Functional Theory (NLDFT) [38].
5. Conclusions
The results of this study underscore the critical impact of thermal treatment conditions on the nanoparticle size distribution, as well as the resulting optical and thermal properties of SiO₂:AuNPs nanocomposites. The sol-gel synthesis method revealed herein, based on the co-doping of silica gels with 1-dodecanethiol and tetrachloroauric acid followed by thermal treatment, represents a promising route for the fabrication of glaze pigments or catalytic powders, depending on the specific processing parameters. Thermal treatment at a relatively low temperature (T = 450 °C) yields SiO₂:AuNPs nanopowders characterized by a high specific surface area (330 m²/g) and an average pore diameter of 10 nm, closely resembling the textural features of silicate aerogels. This low-temperature approach offers a novel, cost-effective strategy for producing Au doped silica powders with aerogel-like characteristics. Conversely, samples annealed at elevated temperatures (T = 900 °C) show the formation of crystalline phases, including tetragonal low cristobalite and monoclinic low tridymite, within which gold nanoparticles are embedded. Furthermore, the analysis of the optical spectra of these polydisperse powders, employing Mie theory, proves to be a viable method for characterizing the optical behavior of such complex nanocomposite systems.
Supplementary Materials
The following supporting information can be downloaded at: Preprints.org.
Author Contributions
Conceptualization, S.G. and T.S.; methodology, R.T., D.S. and N.D.; investigation, L.M., D.S., N.D., T.S. and R.T.; resources, T.S.; data curation, D.S., S.G.; writing—original draft preparation, S.G. , R.T., L.M., N.D, D.S.; visualization, R.T., N.D., D.S.; supervision, T.S. and S.G.; project administration, T.S. All authors have read and agreed to the published version of the manuscript.
Funding
This research received no external funding.
Acknowledgments
This study was financed by the European Union-NextGenerationEU, through the National Recovery and Resilience Plan of the Republic of Bulgaria, project No BG-RRP-2.004-0008 and was supported by European Regional Development Fund under “Research Innovation and Digitization for Smart Transformation” program 2021-2027 under the Project BG16RFPR002-1.014-0006 “National Centre of Excellence Mechatronics and Clean Technologies”. The article is dedicated to the 100th anniversary of the Department of Physical Chemistry at Sofia University “St. Kliment Ohridski”.
Conflicts of Interest
The authors declare no conflict of interest.
Sample Availability
Samples of the compounds are available from the authors.
References
- Habashi, F. Purple of Cassius: Nano Gold or Colloidal Gold? Eur. Chem. Bull. 2016, 5, 416–419. [Google Scholar]
- Shandurkov, D.; Danchova, N.; Spassov, T.; Petrov, V.; Tsekov, R.; Gutzov, S. Silica Gels Doped with Gold Nanoparticles: Preparation, Structure and Optical Properties. Gels 2023, 9, 663. [Google Scholar] [CrossRef]
- Danchova, N.; Tsekov, R.; Shandurkov, D.; Gutzov, S.; Lyubenova, L.; Mihaylov, L.; Spassov, T. Silica Gels Doped with Gold Nanoparticles and Gold Thiolate Complexes: The Effect of Heating and Preparation Conditions. J. Non. Cryst. Solids 2025, 648, 123308. [Google Scholar] [CrossRef]
- Ong, C.; Cha, B.G.; Kim, J. Mesoporous Silica Nanoparticles Doped with Gold Nanoparticles for Combined Cancer Immunotherapy and Photothermal Therapy. ACS Appl. Bio Mater. 2019, 2, 3630–3638. [Google Scholar] [CrossRef]
- Brust, M.; Walker, M.; Bethell, D.; Schiffrin, D.J.; Whyman, R. Synthesis of Thiol Derivatised Gold Nanoparticles in a Two Phase Liquid Liquid System. Chem Soc Chem Commun 7, 801 802.
- Matsuoka, J.; Mizutani, R.; Nasu, H.; Kamiya, K. Preparation of Au-Doped Silica Glass by Sol-Gel Method. J. Ceram. Soc. Japan 1992, 100, 599–601. [Google Scholar] [CrossRef]
- Georgiev, P.; Chanachev, A.; Simeonova, S.; Ivanova, T.; Balashev, K. A New Method for Studying the Kinetics of Synthesis of Gold Nanoparticles in Hexadecylanilin Monolayer at the Air/Water Interface by Means of Atomic Force Microscopy. Comptes Rendus L’Academie Bulg. des Sci. 2020, 73, 197–202. [Google Scholar]
- Georgiev, P.; Simeonova, S.; Tsekov, R.; Balashev, K. Dependence of Plasmon Spectra of Small Gold Nanoparticles from Their Size: An Atomic Force Microscopy Experimental Approach. Plasmonics 2020, 15, 371–377. [Google Scholar] [CrossRef]
- Brinker, J.C.; Scherer, G.W. The Physics and Chemistry of Sol-Gel Processing; Academic Press, INC: London, 1990. [Google Scholar]
- Konon, M.; Polyakova, I.G.; Mazur, A.S.; Saratovskii, A.S.; Danilovich, D.P.; Alikin, M. Crystallization of Cristobalite in Sodium Borosilicate Glass in the Presence of Cr₂O₃. Materials (Basel). 2023, 16, 5016. [Google Scholar] [CrossRef]
- Kreibig, U.; Vollmer, M. Optical Properties of Metal Clusters; Springer Berlin Heidelberg: Berlin, 1995. [Google Scholar]
- Gutzov, S.; Bredol, M. Optical Properties of Cerium and Terbium Doped Silica Xerogels. J. Mat. Sci 2006, 46, 1835–1837. [Google Scholar] [CrossRef]
- Nesheva, D.; Levi, Z.; Aneva, Z.; Nikolova, V.; Hofmeister, H. Experimental Studies on the Defect States at the Interface between Nanocrystalline CdSe and Amorphous SiOx. J. Phys. Condens. Matter 2000, 12, 751. [Google Scholar] [CrossRef]
- Fan, X.; Zheng, W.; Singh, D.J. Light Scattering and Surface Plasmons on Small Spherical Particles. Light Sci. Appl. 2014, 3, 1–14. [Google Scholar] [CrossRef]
- Bentea, L.; Watzky, M.A.; Finke, R.G. Sigmoidal Nucleation and Growth Curves Across Nature Fit by the Finke–Watzky Model of Slow Continuous Nucleation and Autocatalytic Growth: Explicit Formulas for the Lag and Growth Times Plus Other Key Insights. J. Phys. Chem. C 2017, 121, 5302–5312. [Google Scholar] [CrossRef]
- Watzky, M.A.; Finke, R.G. Transition Metal Nanocluster Formation Kinetic and Mechanistic Studies. A New Mechanism When Hydrogen Is the Reductant: Slow, Continuous Nucleation and Fast Autocatalytic Surface Growth. J. Am. Chem. Soc. 1997, 119, 10382–10400. [Google Scholar] [CrossRef]
- Gutzow, I.; Pascova, R.; Jordanov, N.; Gutzov, S.; Petkov, I.; Markovska, I.; P, J.W.S.; Ludwig, F.P. Crystalline and Amorphous Modifications of Silica: Structure, Thermodynamic Properties, Solubility and Synthesis in “Glass”; Schmelzer, J.W.P., Ed.; De Gruyter: Berlin, 2014. [Google Scholar]
- Gutzow, I.S.; Schmelzer, J.W.P. The Vitreous State; Springer Verlag, 1994.
- Perrotta, A.J.; Grubbs, D.K.; Martin, E.S.; Dando, N.R.; McKinstry, H.A.; Huarg, C.Y. Chemical Stabilization of β-Cristobalite. J. Am. Ceram. Soc. 1989, 72. [Google Scholar] [CrossRef]
- Coppage, R.; Leopold, M.; Allen, G.; Lacy, C. Gold Nanoparticle in Ceramic Glaze 2018.
- Deng, Y.; Sha, Z.; Wang, X.; Duan, K.; Xue, W.; Beadham, I.; Xiao, X.; Zhang, C. Exploration of Key Factors in the Preparation of Highly Hydrophobic Silica Aerogel from Rice Husk AshAssisted by Machine Learning. Gels 2025, 11. [Google Scholar] [CrossRef] [PubMed]
- Csupász-Szabó, H.J.; Döncz˝o, B.; Szarka, M.; Daróczi, L.; Lázár, I. Thermal Reverse-Engineered Synthesis and Catalytic Activity of Nanogold-Containing Silica Aerogels. Gels 2025, 11. [Google Scholar] [CrossRef] [PubMed]
- Choi, S.M.; Kang, S.H. Gold Nanoparticle Superlattice Embedded in Porous Silica and Method for Manufacturing Same 2023.
- Yin, Y.; Gao, C. Templated Synthesis of Metal Nanorods in Silica Nanotubes 2018.
- Ostafin, A.E.; Nooney, R.; Maginn, E. Process for Making Mesoporous Silicate Nanoparticle Coatings and Hollow Mesoporous Silica Nano-Shells 2005.
- QuantumCat Co., L. Metallic Nanoparticle Catalysts Embedded in Porous Oxide Support, Which Show High Catalytic Activity Even at Low Temperatures 2022.
- Gregg, S.J.; Sing:, K.S.W. Adsorption, Surface Area and Porosity. Berichte der Bunsengesellschaft für Phys. Chemie 1982, 86, 957. [Google Scholar] [CrossRef]
- Thommes, M.; Kaneko, K.; Neimark, A.; Olivier, J.P.; Rodriguez-Reinoso, F.; Rouquerol, J.; Sing, K.S.W. Physisorption of Gases, with Special Reference to the Evaluation of Surface Area and Pore Size Distribution (IUPAC Technical Report); 2015.
- Shandurkov, D.; Ignatov, P.; Spassova, I.; Gutzov, S. Spectral and Texture Properties of Hydrophobic Aerogel Powders Obtained from Room Temperature Drying. Molecules 2021, 26, 1796. [Google Scholar] [CrossRef]
- Sing, K.S.W.; Williams, R.T. Physisorption Hysteresis Loops and the Characterization of Nanoporous Materials. Adsorpt. Sci. Technol. 2004, 22, 773–782. [Google Scholar] [CrossRef]
- Villarroel-Rocha, J.; Barrera, D.; Blanco, A.A.G.; Roca, M.E.; Jalil; Sapag, K. Importance of the As-Plot Method in the Characterization of Nanoporous Materials. Adsorpt. Sci. Technol. 2013, 31. [Google Scholar] [CrossRef]
- Boer, J.H. de; Lippens, B.C.; Linsen, B.G.; Broekhoff, J.C.P.; Heuvel, A. van den; Osinga, T.J. THE T-CURVE OF MULTIMOLECULAR N2-ADSORPTION. JOURN&IJ COLLOID INTERFAC~ Sci. 1966, 21, 405–414. [Google Scholar]
- BUSTILLO, Mar.A.; FORT, R.; BUSTILL0, Man. Specific Surface Area and Ultramicroporosity in Polymorphs of Silica. Eur. J. Miner. 1993, 5, 1195–1204. [CrossRef]
- WHEATLEY, K. MEASUREMENT OF THE SURFACE AREA OF TRIDYMITE. J. appl. Chem. 1959, 9. [Google Scholar] [CrossRef]
- Bohren, C.F.; Huffman, D.R.; Clothiaux, E.E. Absorption and Scattering of Light by Small Particles; Willey-VCH: Weinheim, 2010. [Google Scholar]
- Powdercell Available online: http://mill2.chem.ucl.ac.uk/ccp/web-mirrors/powdcell/a_v/v_1/powder/e_cell.html.
- Health, N.I. of ImageJ.
- Neimark, A.V.; Ravikovitch, P.I. Capillary Condensation in MMS and Pore Structure Characterization. Micropor. Mesopor. Mater 2001, 44/45, 697–707. [Google Scholar] [CrossRef]
Figure 1.
Preparation scheme for SiO2:AuNPs at heating, starting from SiO2:AuSC12H25 and photographs of the obtained ceramic pigments.
Figure 1.
Preparation scheme for SiO2:AuNPs at heating, starting from SiO2:AuSC12H25 and photographs of the obtained ceramic pigments.
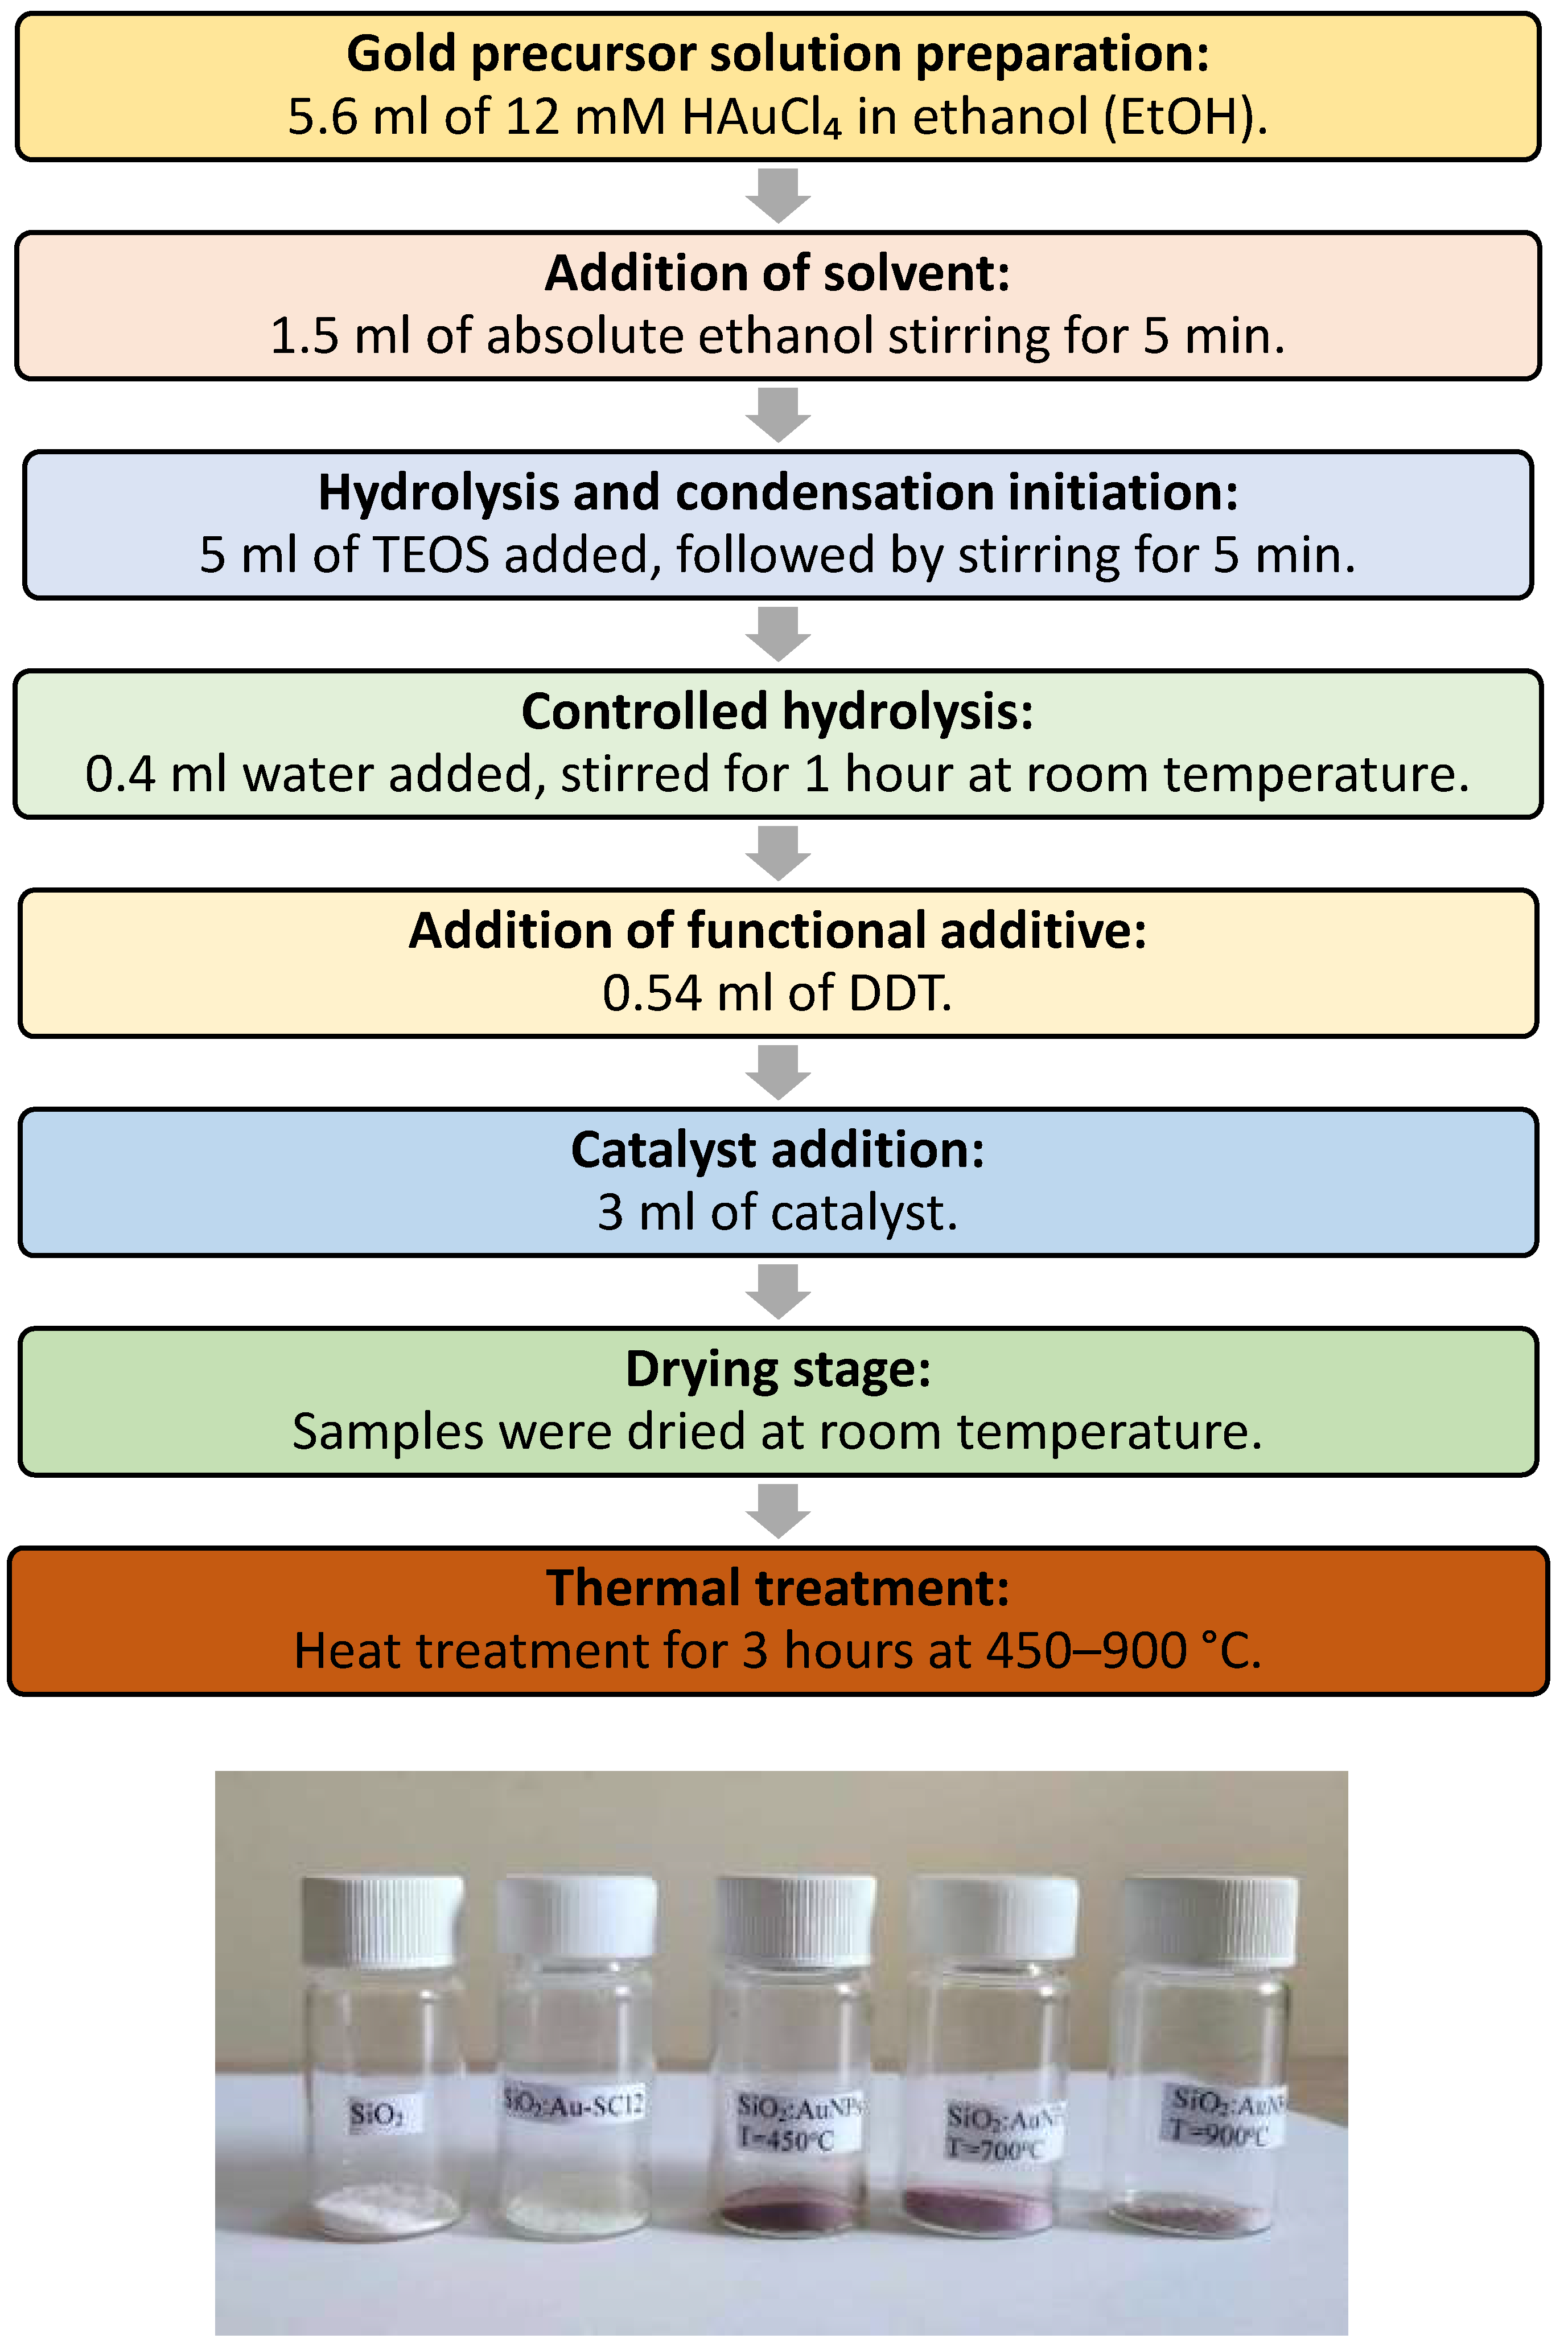
Figure 2.
X-ray diffraction results of the investigated samples. Sample notations: NaCl 01–080–3939 traces are designated with #. Peaks from Au 01–073–9564 are indexed (hkl). The peaks from tetragonal low cristobalite, (ICSD 34932) and monoclinic low tridymite, (ICSD 176) are designated with c and t, respectivelly (blue curve, T=900 oC).
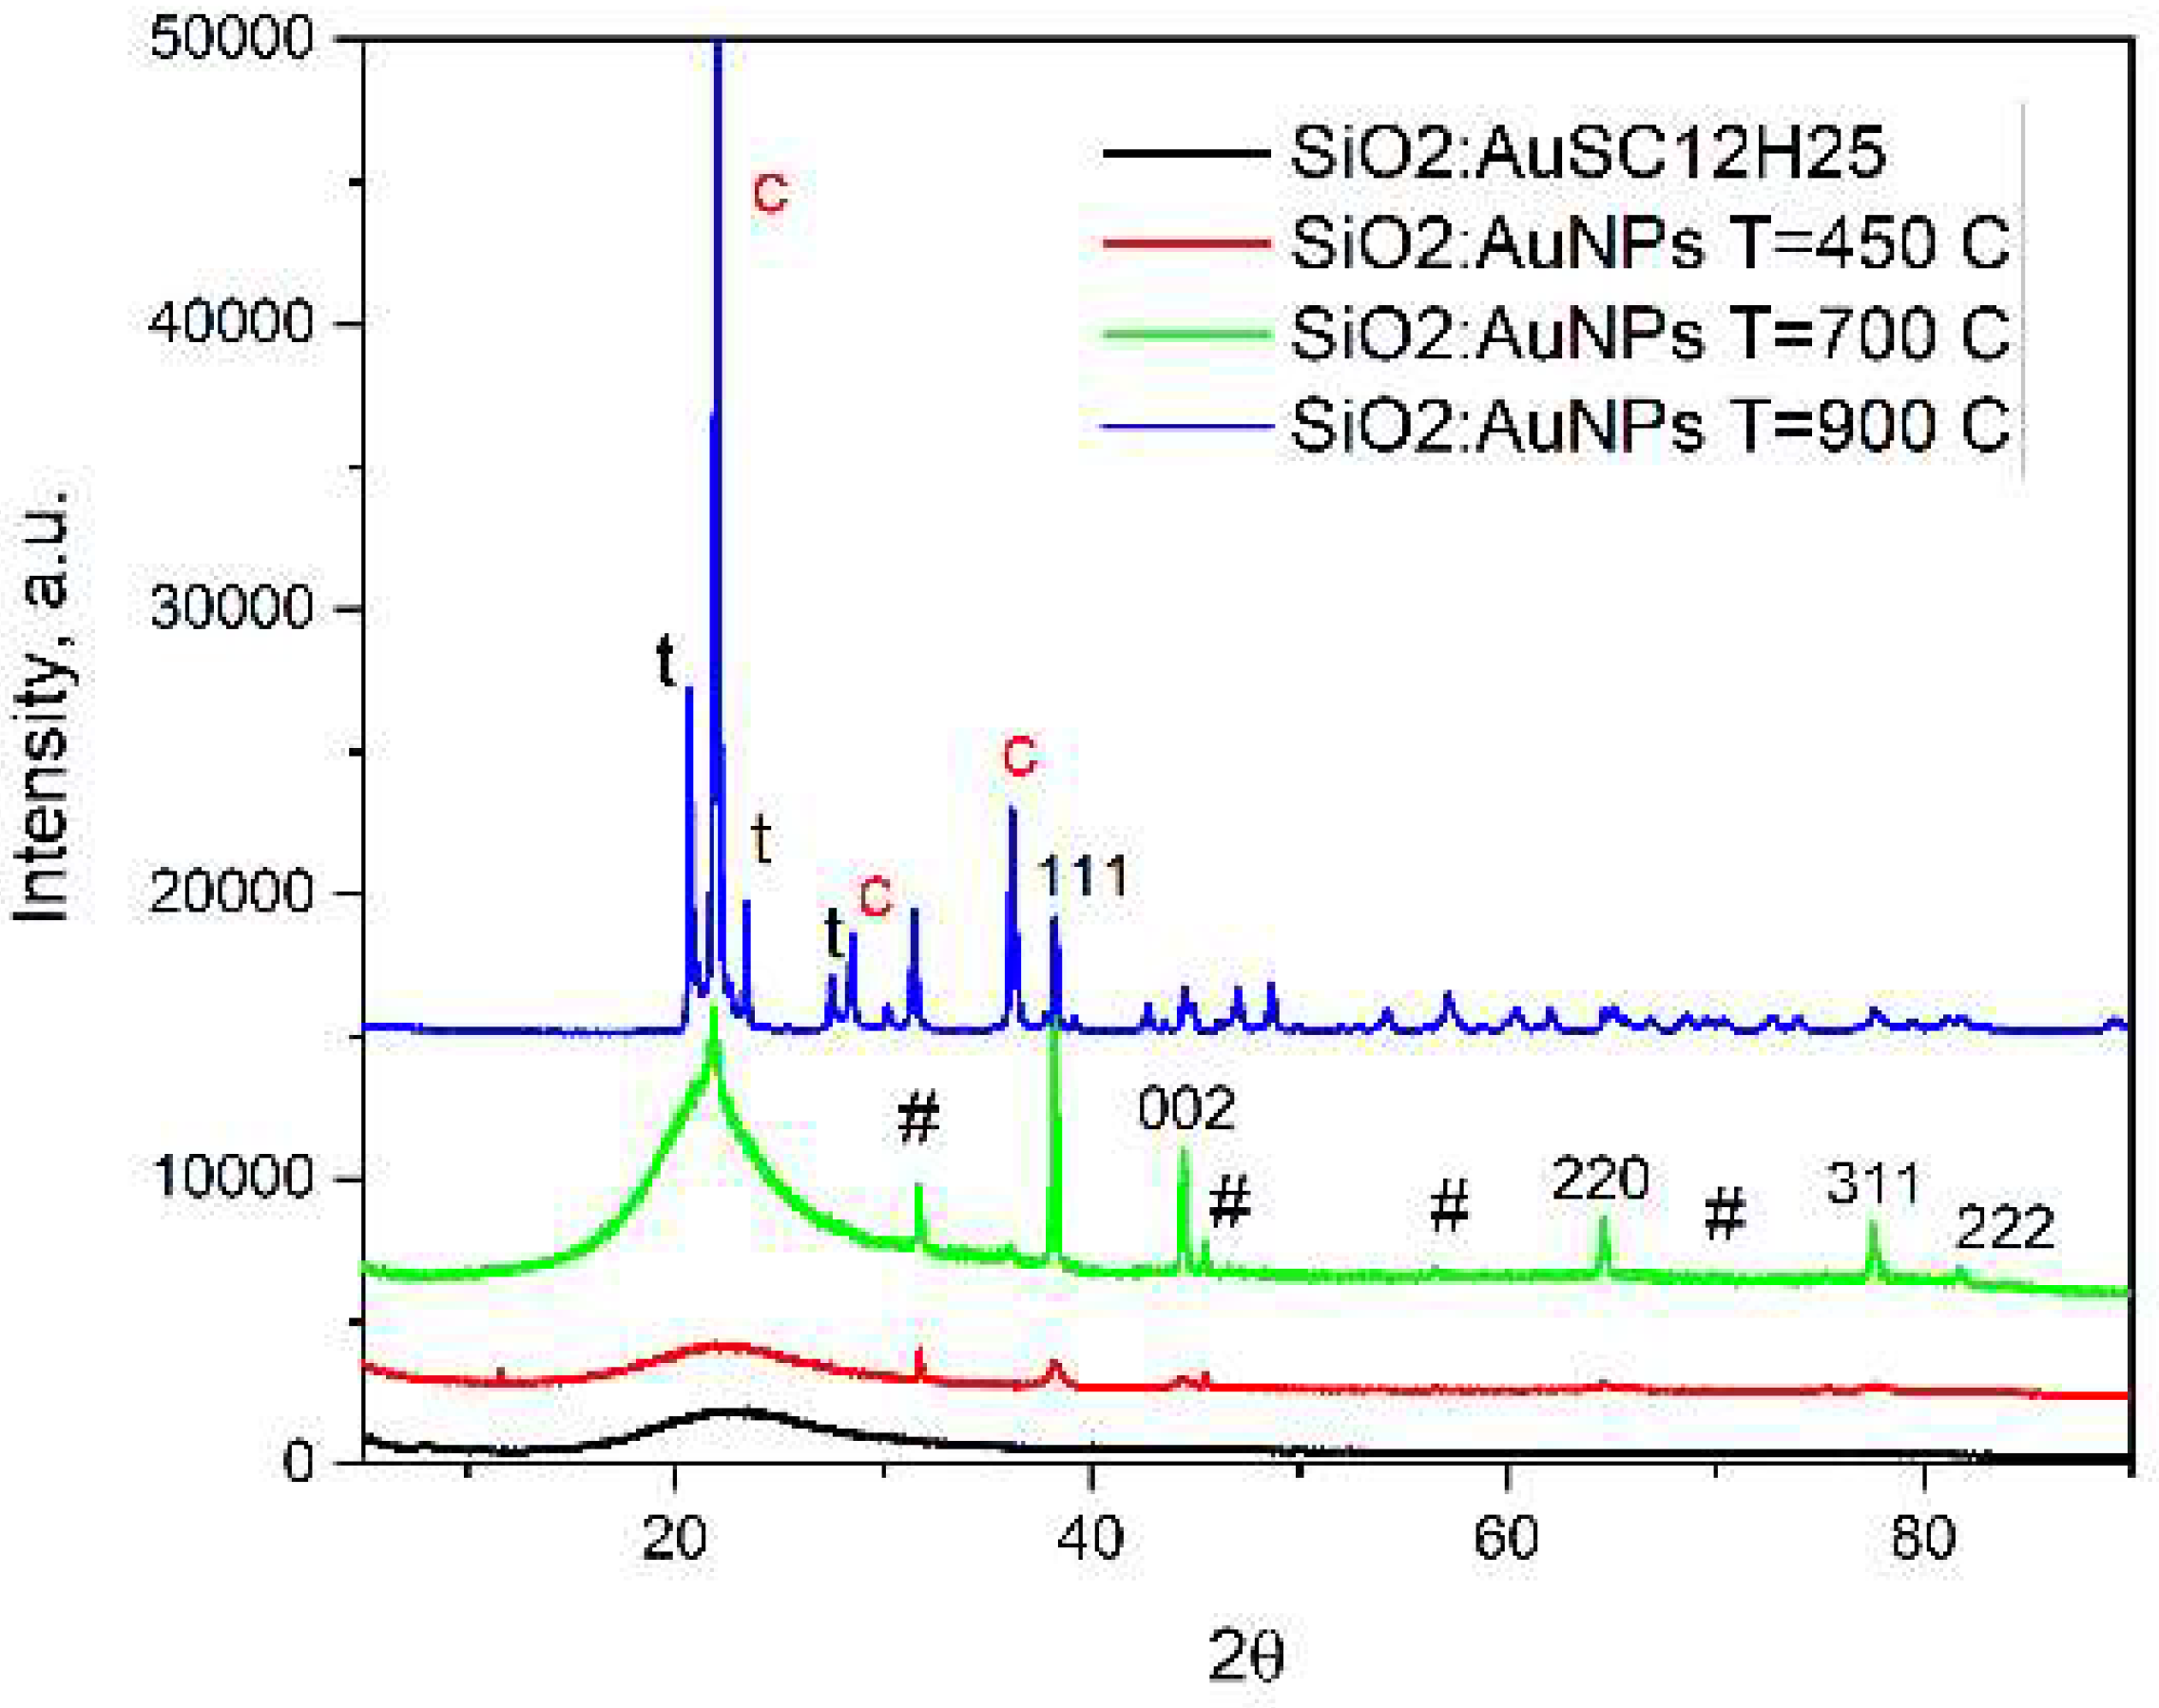
Figure 3.
TG curves of a sample obtained by thermal treatment of 1-dodecanethiol embedded in a silicate gel (bottom curve). The upper curve represents the reference sample, consisting of pure silica, heated at 700 oC (GR0T).
Figure 3.
TG curves of a sample obtained by thermal treatment of 1-dodecanethiol embedded in a silicate gel (bottom curve). The upper curve represents the reference sample, consisting of pure silica, heated at 700 oC (GR0T).
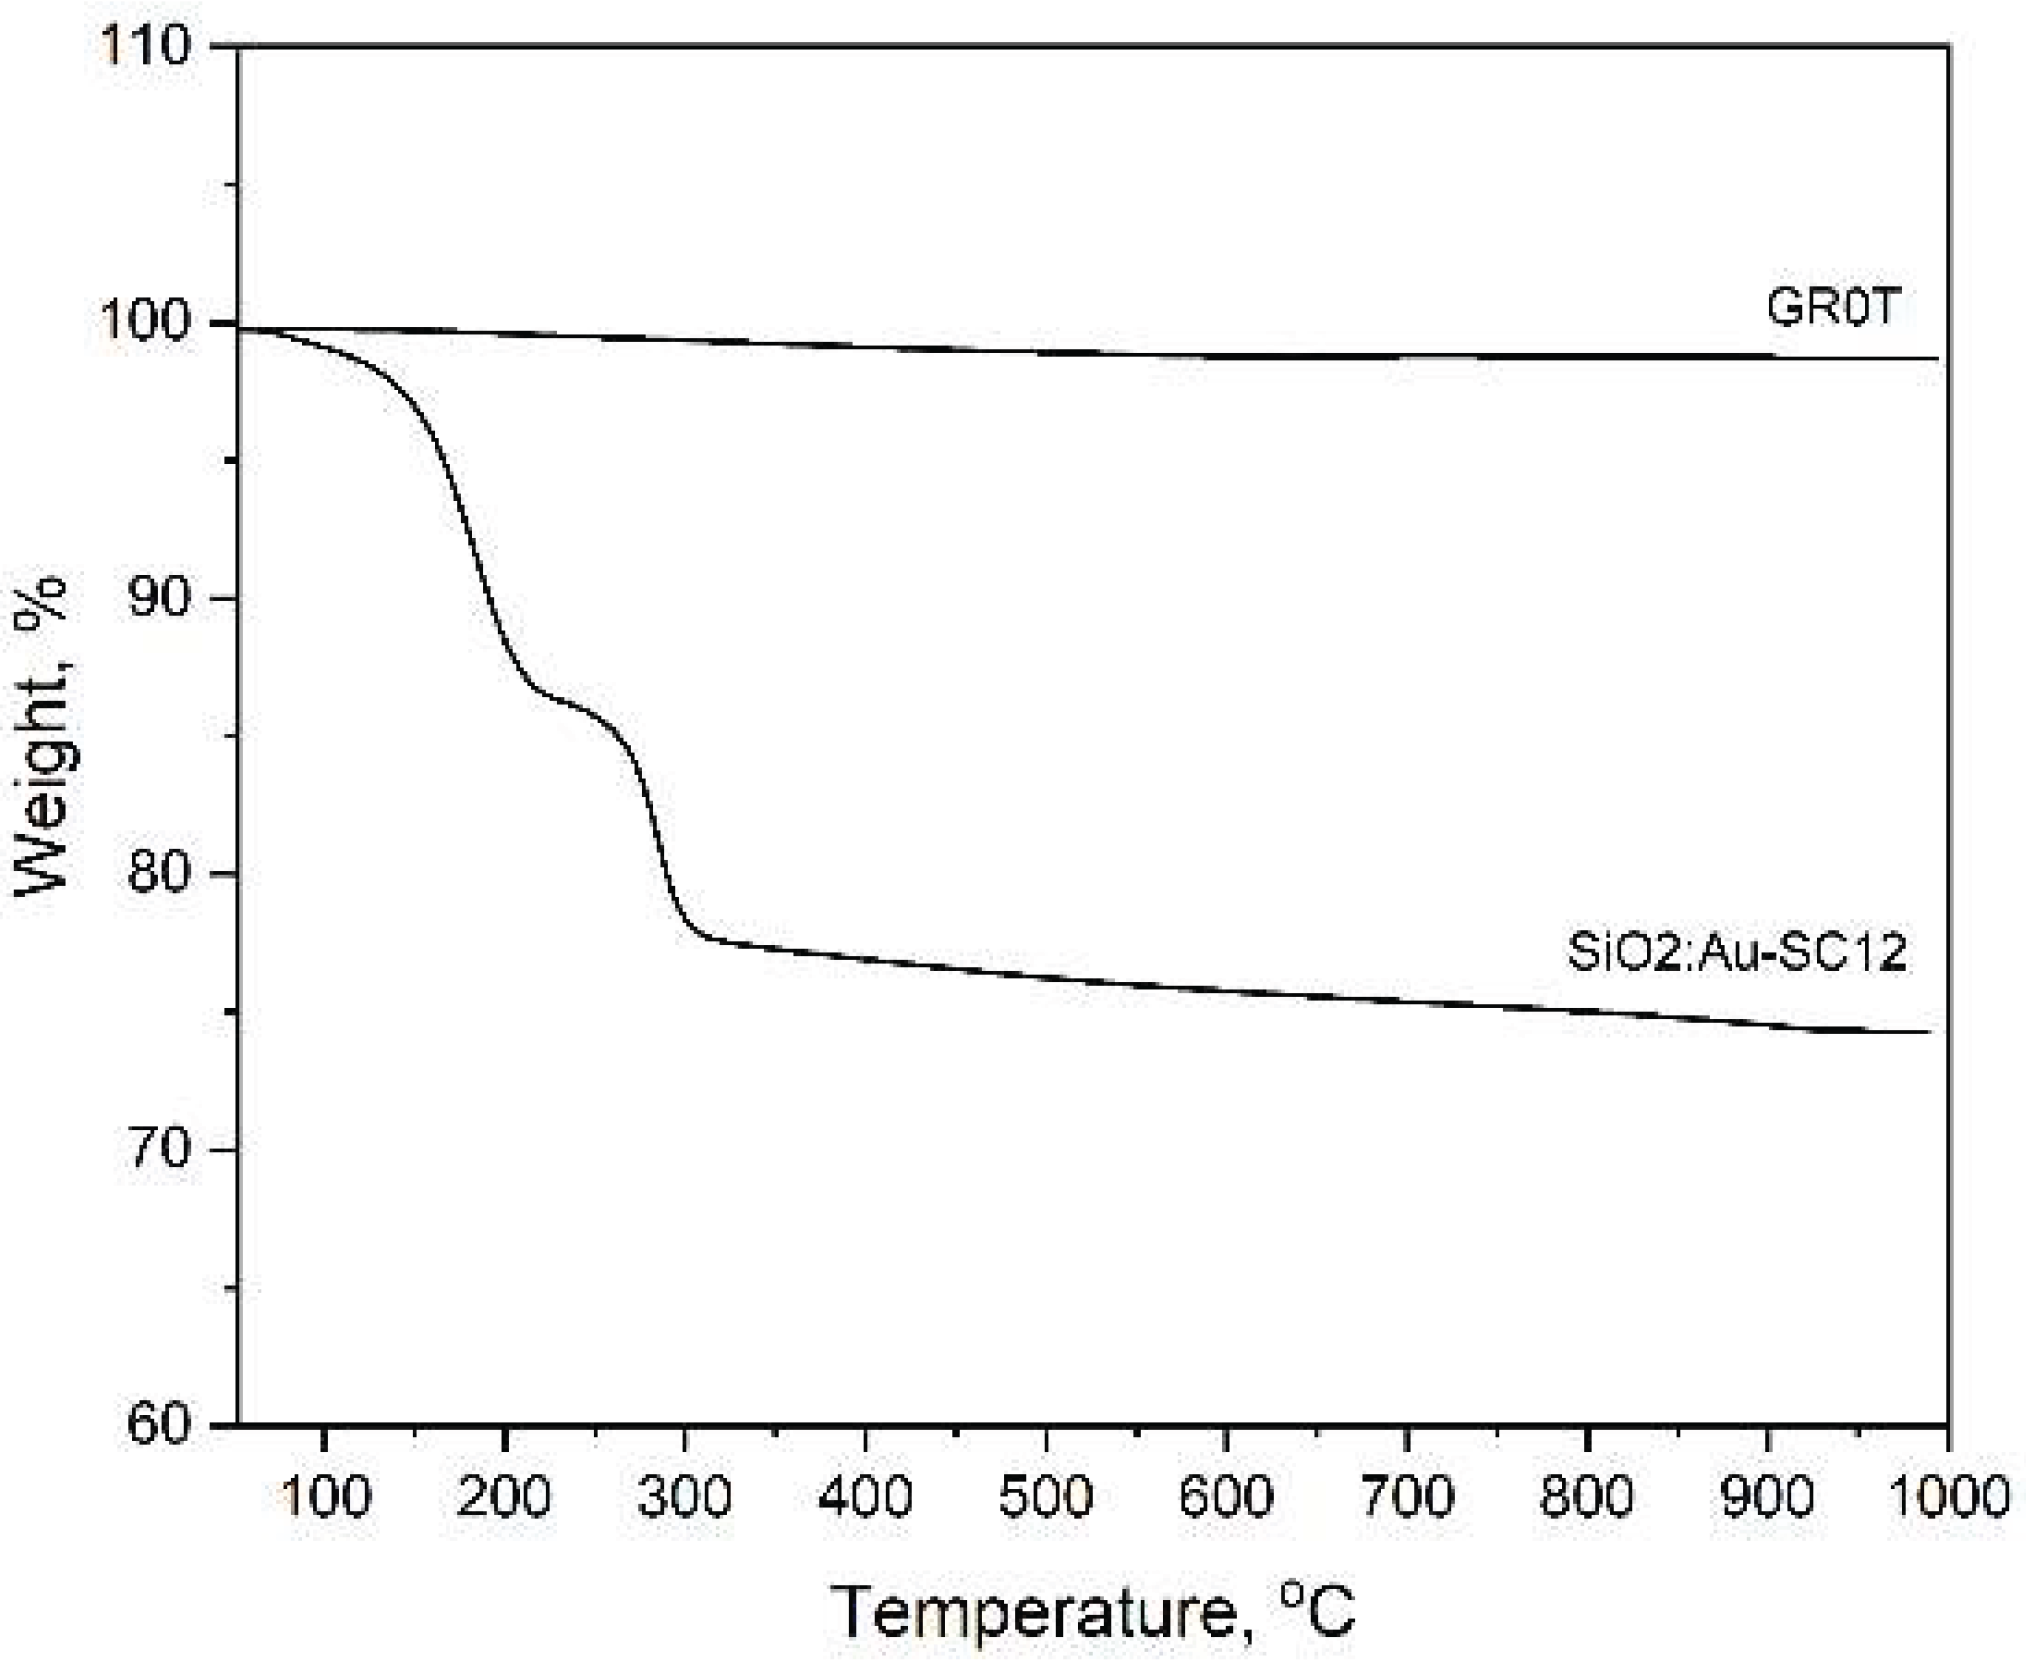
Figure 4.
TEM image at 20k magnification and STEM - EDS of nanocomposites obtained at a temperature of T = 450 °C. The nanocrystallites exhibit sizes well below 40 nm.
Figure 4.
TEM image at 20k magnification and STEM - EDS of nanocomposites obtained at a temperature of T = 450 °C. The nanocrystallites exhibit sizes well below 40 nm.
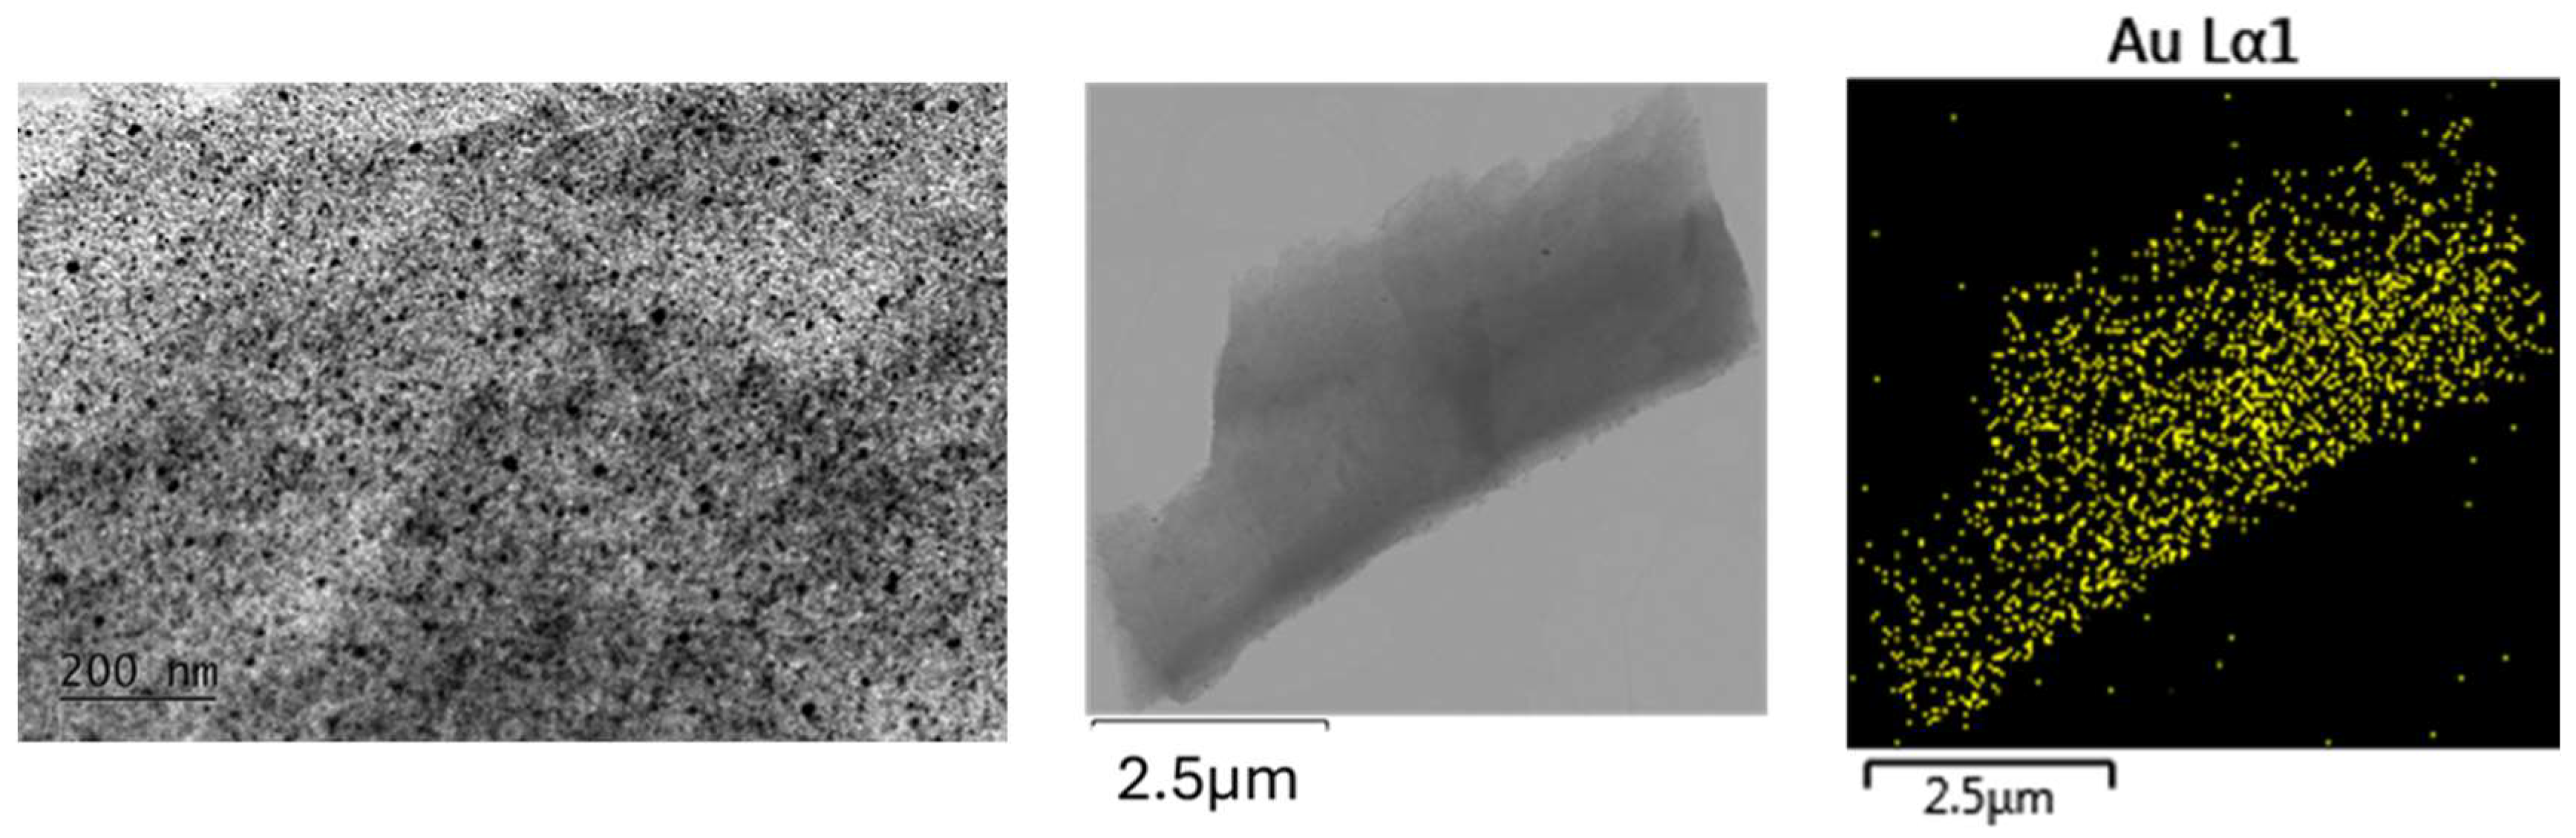
Figure 5.
TEM at 20k magnification and STEM - EDS mapping microanalysis of gold nanoparticles dispersed in a silicate matrix. Heating temperature T=700 oC.
Figure 5.
TEM at 20k magnification and STEM - EDS mapping microanalysis of gold nanoparticles dispersed in a silicate matrix. Heating temperature T=700 oC.
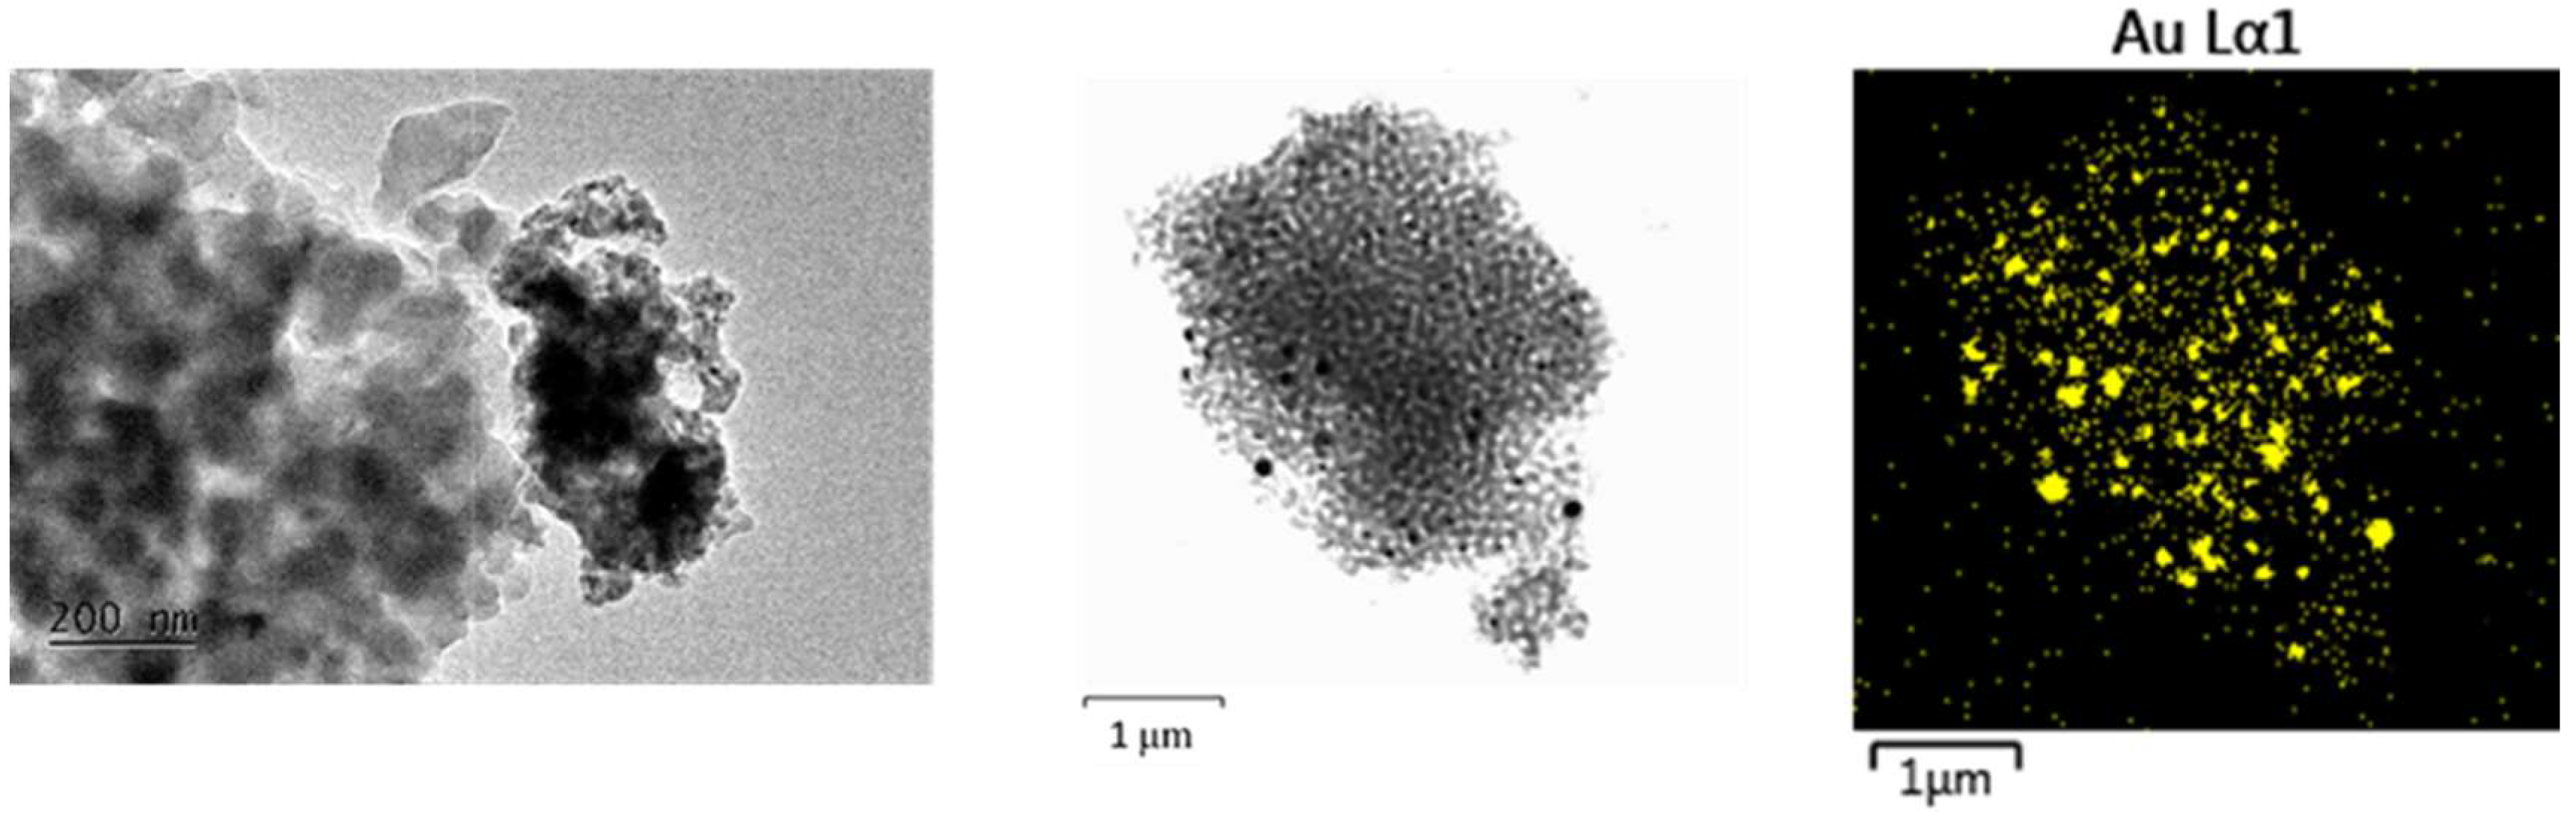
Figure 6.
TEM at 20k magnification and STEM - EDS mapping microanalysis of different sized nanoparticles in crystalline SiO2:AuNPs, heating temperature T = 900 oC AuNPs.
Figure 6.
TEM at 20k magnification and STEM - EDS mapping microanalysis of different sized nanoparticles in crystalline SiO2:AuNPs, heating temperature T = 900 oC AuNPs.

Figure 7.
TEM micrograph (A) at 20k magnification and selected area electron diffraction (inset) and HRTEM (B) micrograph of crystalline SiO2:AuNPs, heating temperature T = 900 oC.
Figure 7.
TEM micrograph (A) at 20k magnification and selected area electron diffraction (inset) and HRTEM (B) micrograph of crystalline SiO2:AuNPs, heating temperature T = 900 oC.
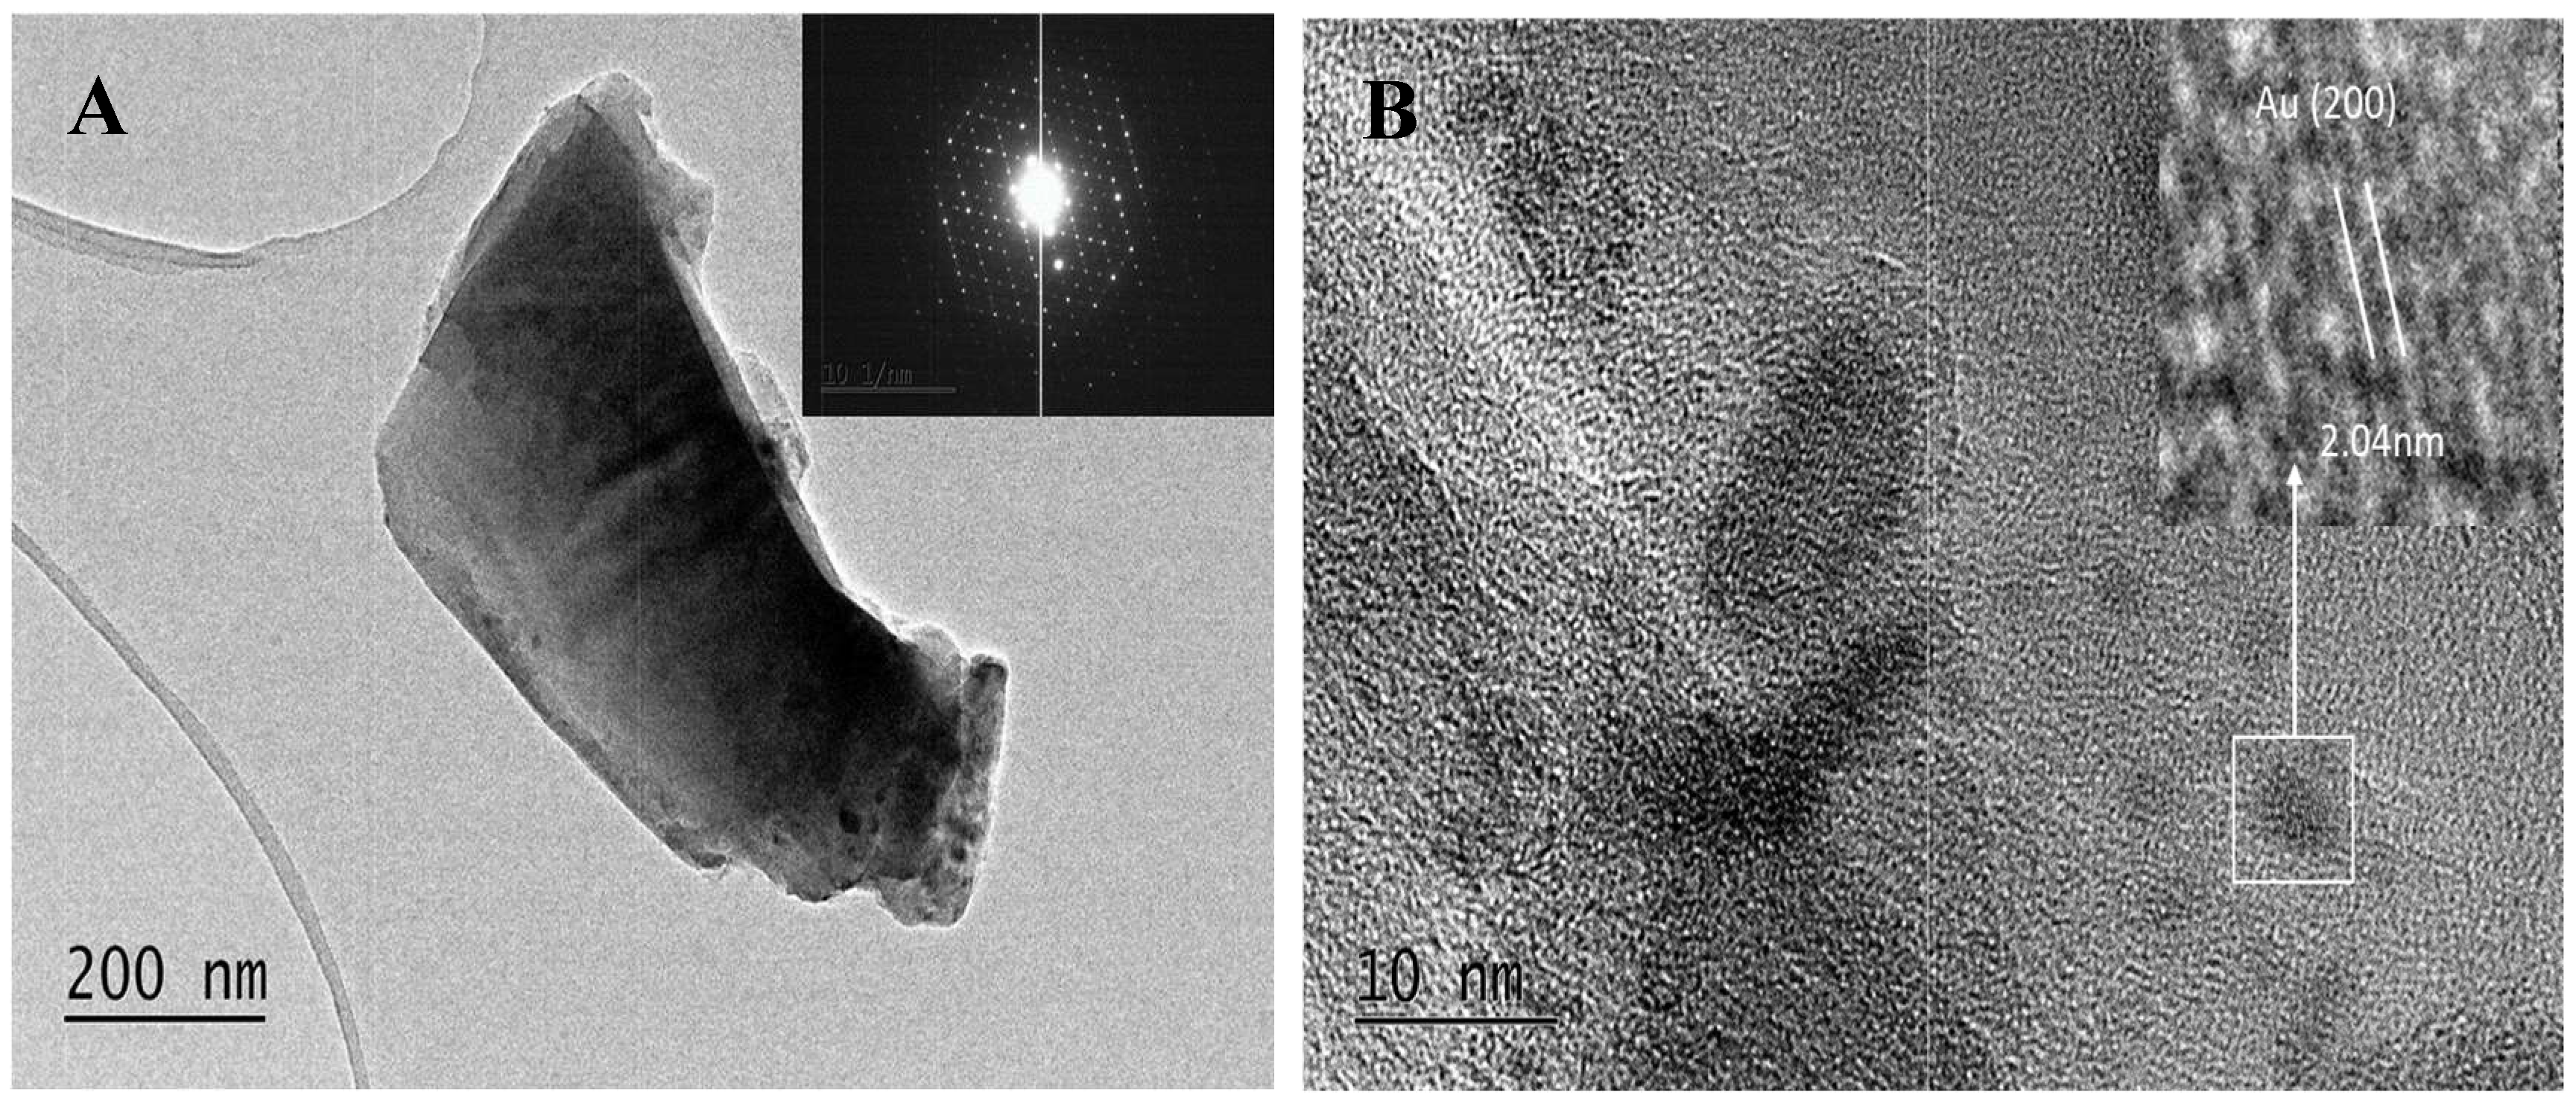
Figure 10.
Differential reflectance spectra (reference SiO2 powder) of micropowders, heated at different temperatures. Samples: 1 – SiO2:AuNPs, T=450 oC; 2 - SiO2:AuNPs, T=450 oC; 3 – T=900oC; 4 – SiO2:AuSC12H25.
Figure 10.
Differential reflectance spectra (reference SiO2 powder) of micropowders, heated at different temperatures. Samples: 1 – SiO2:AuNPs, T=450 oC; 2 - SiO2:AuNPs, T=450 oC; 3 – T=900oC; 4 – SiO2:AuSC12H25.
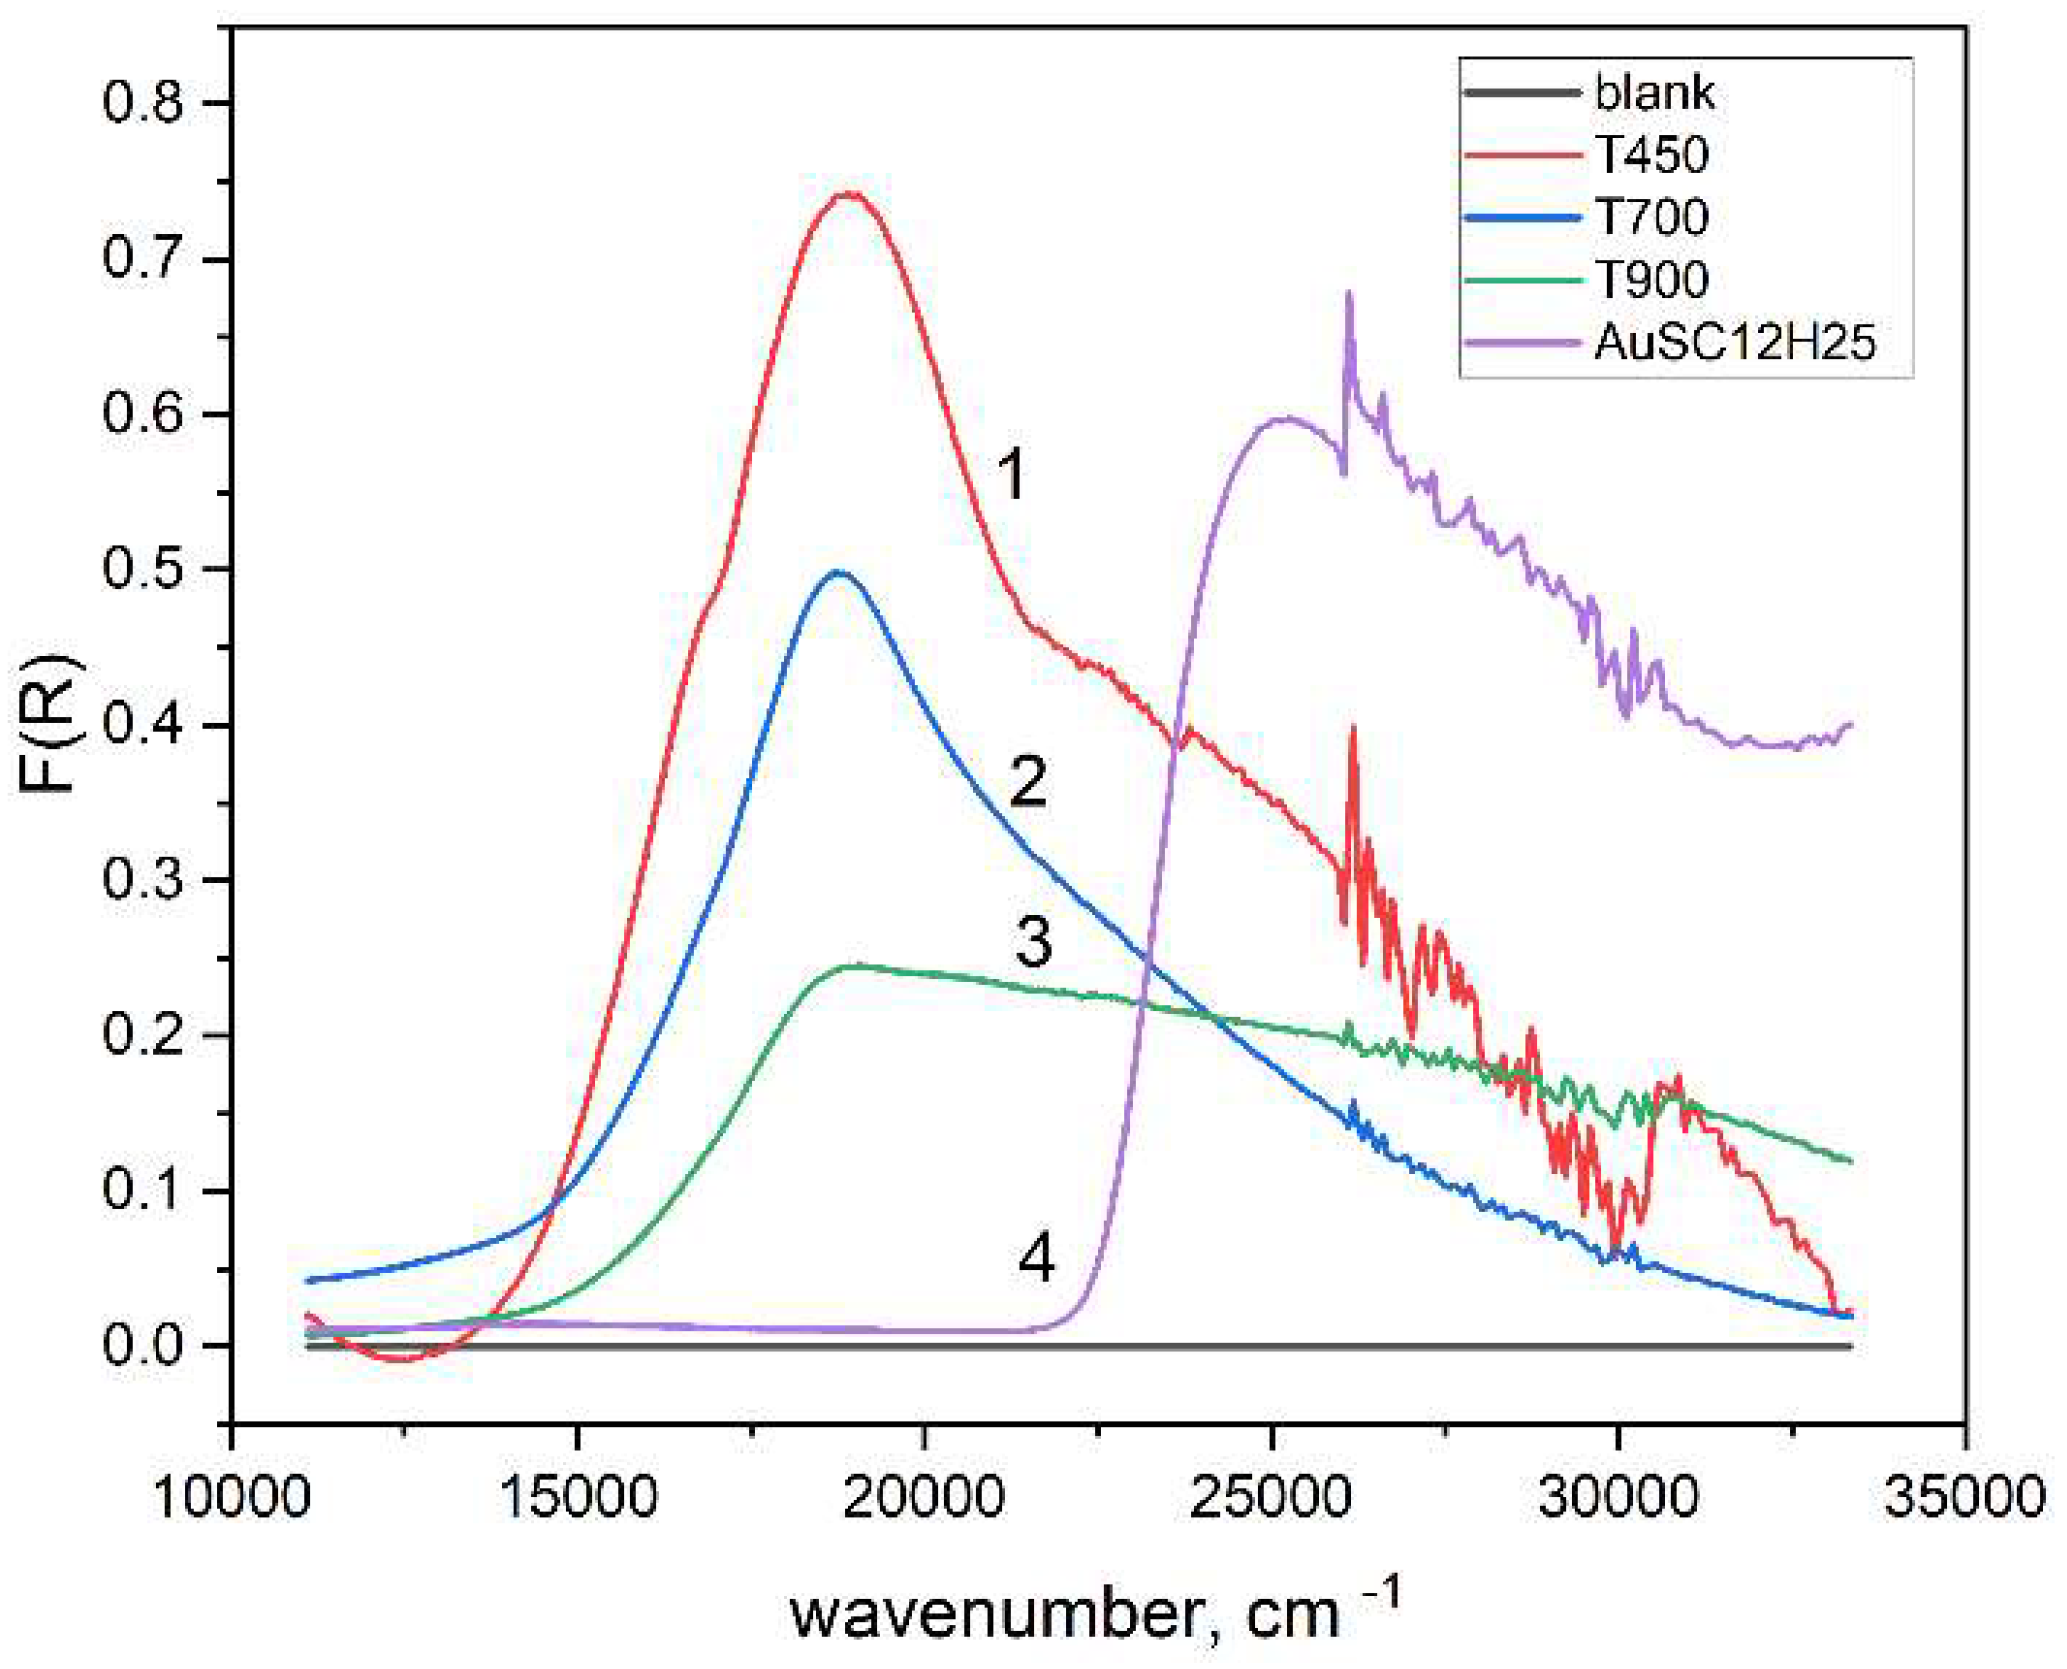
Figure 11.
Deconvolution spectral results of normalized diffuse reflectance spectra for samples annealed at different temperature. Black lines represent experimental data.
Figure 11.
Deconvolution spectral results of normalized diffuse reflectance spectra for samples annealed at different temperature. Black lines represent experimental data.
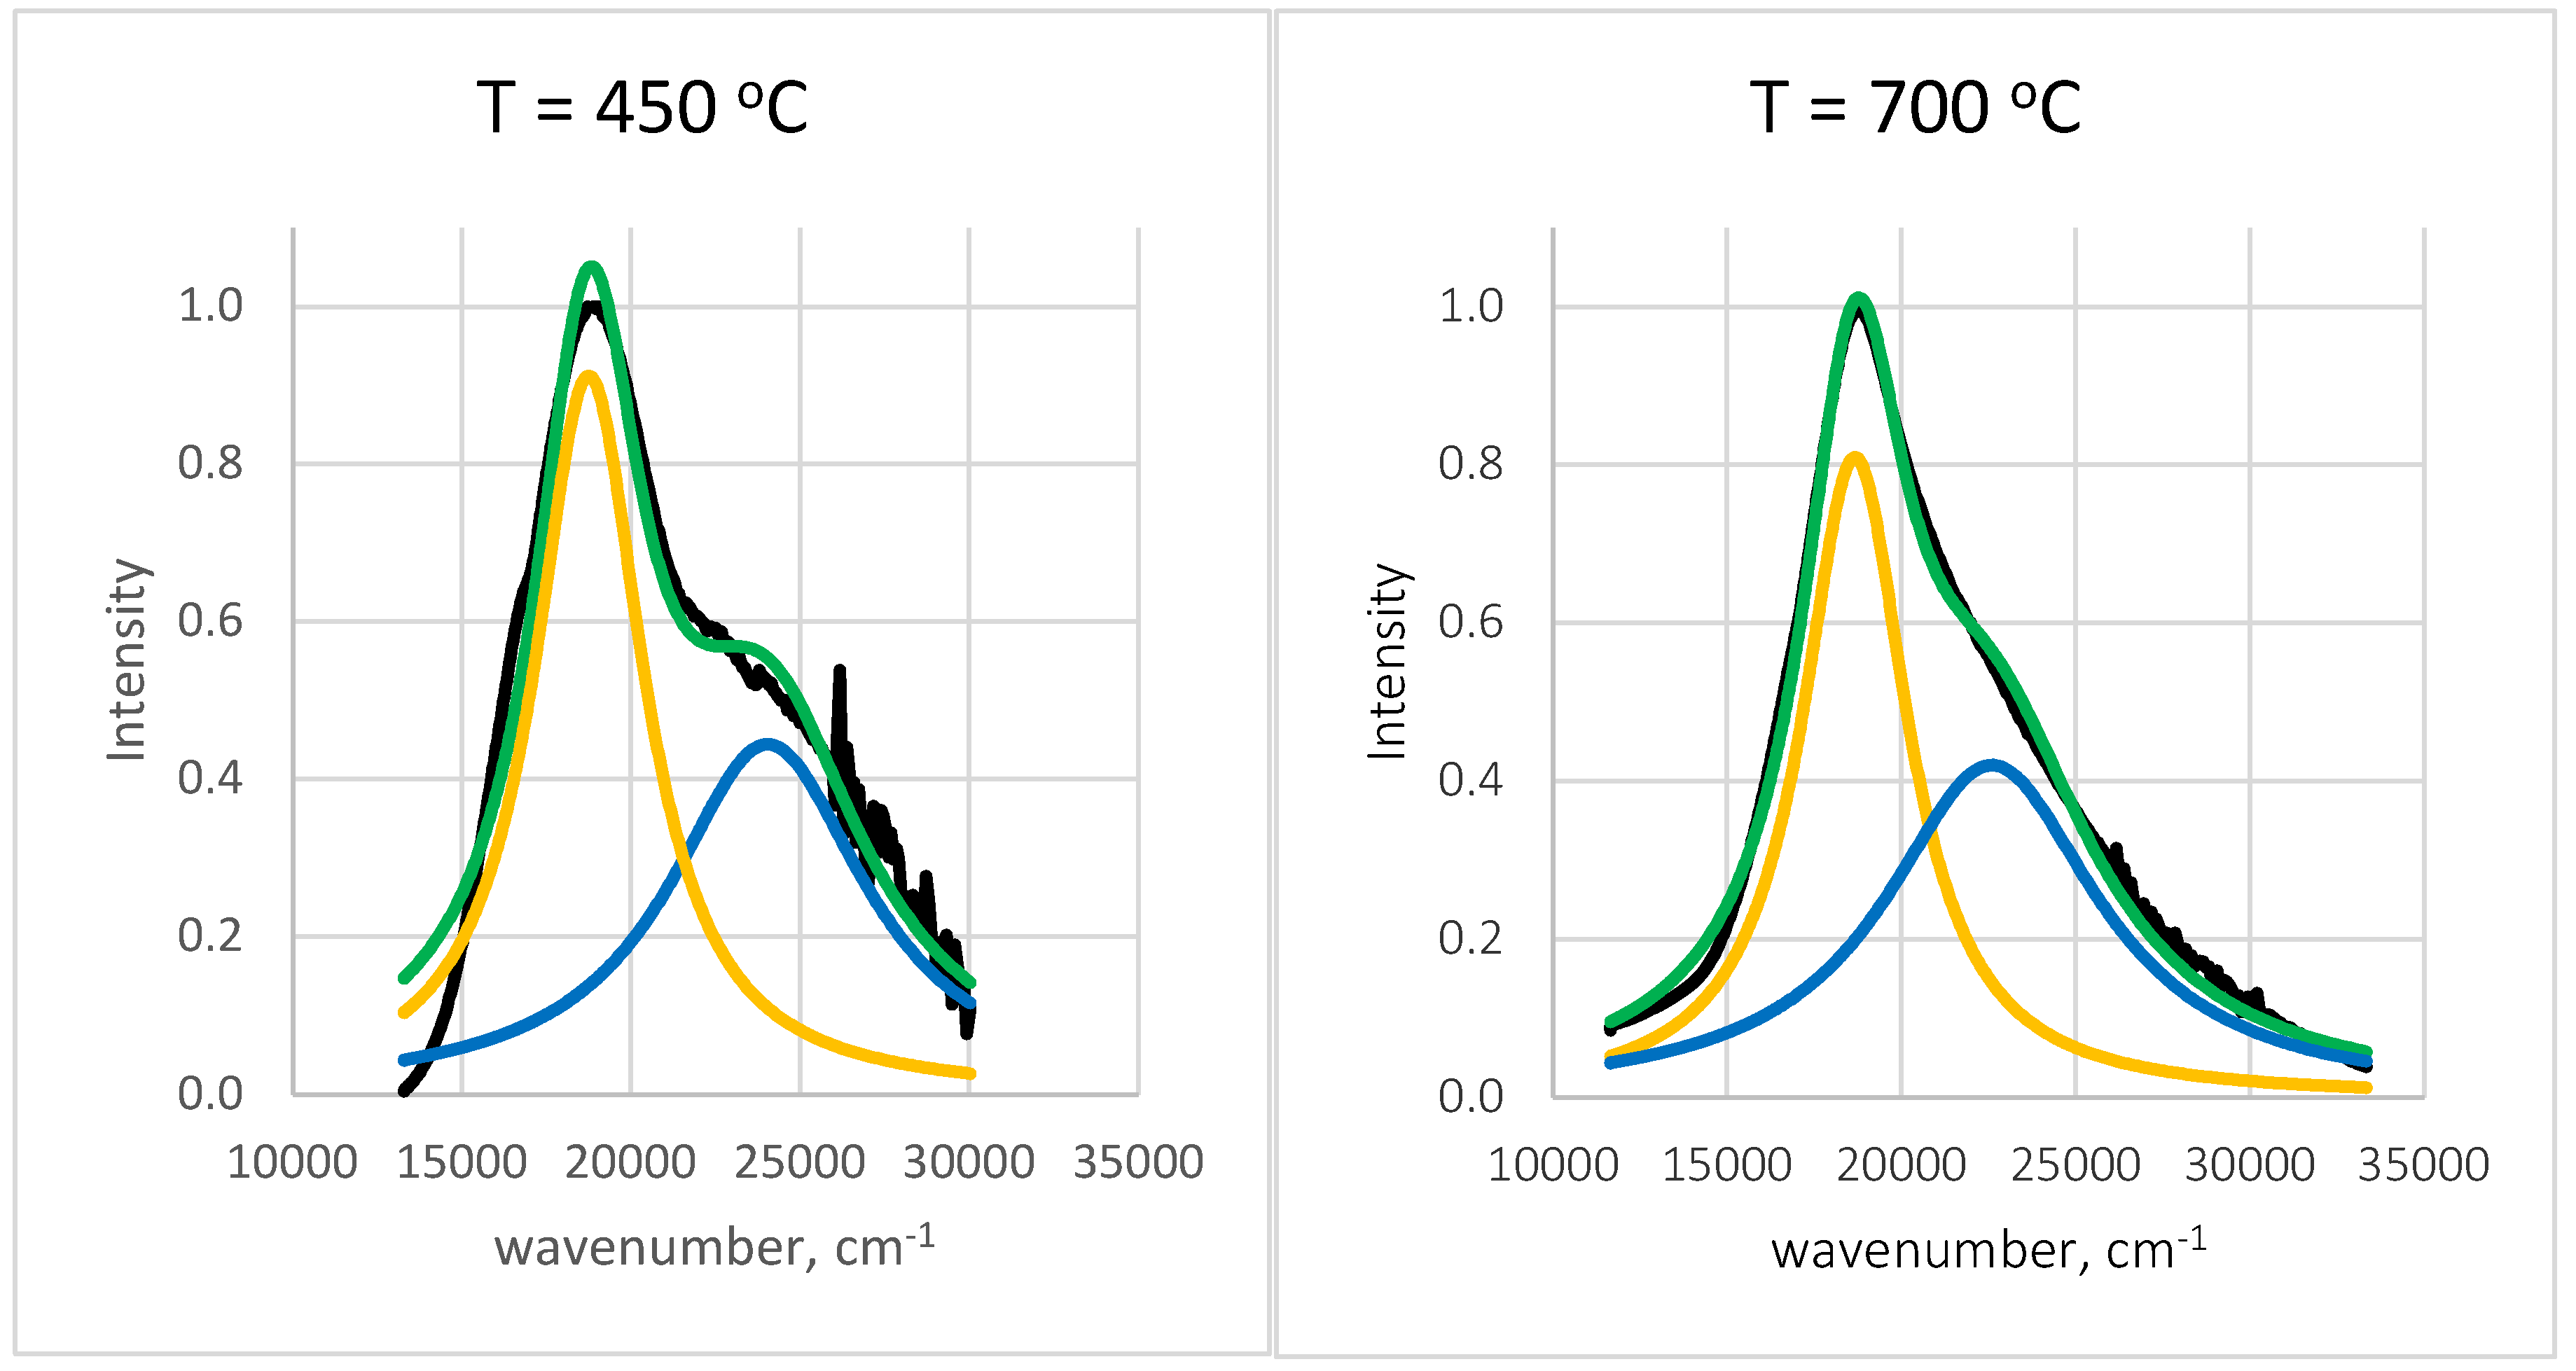
Figure 12.
T-plot for the samples. Heating temperatures are shown.
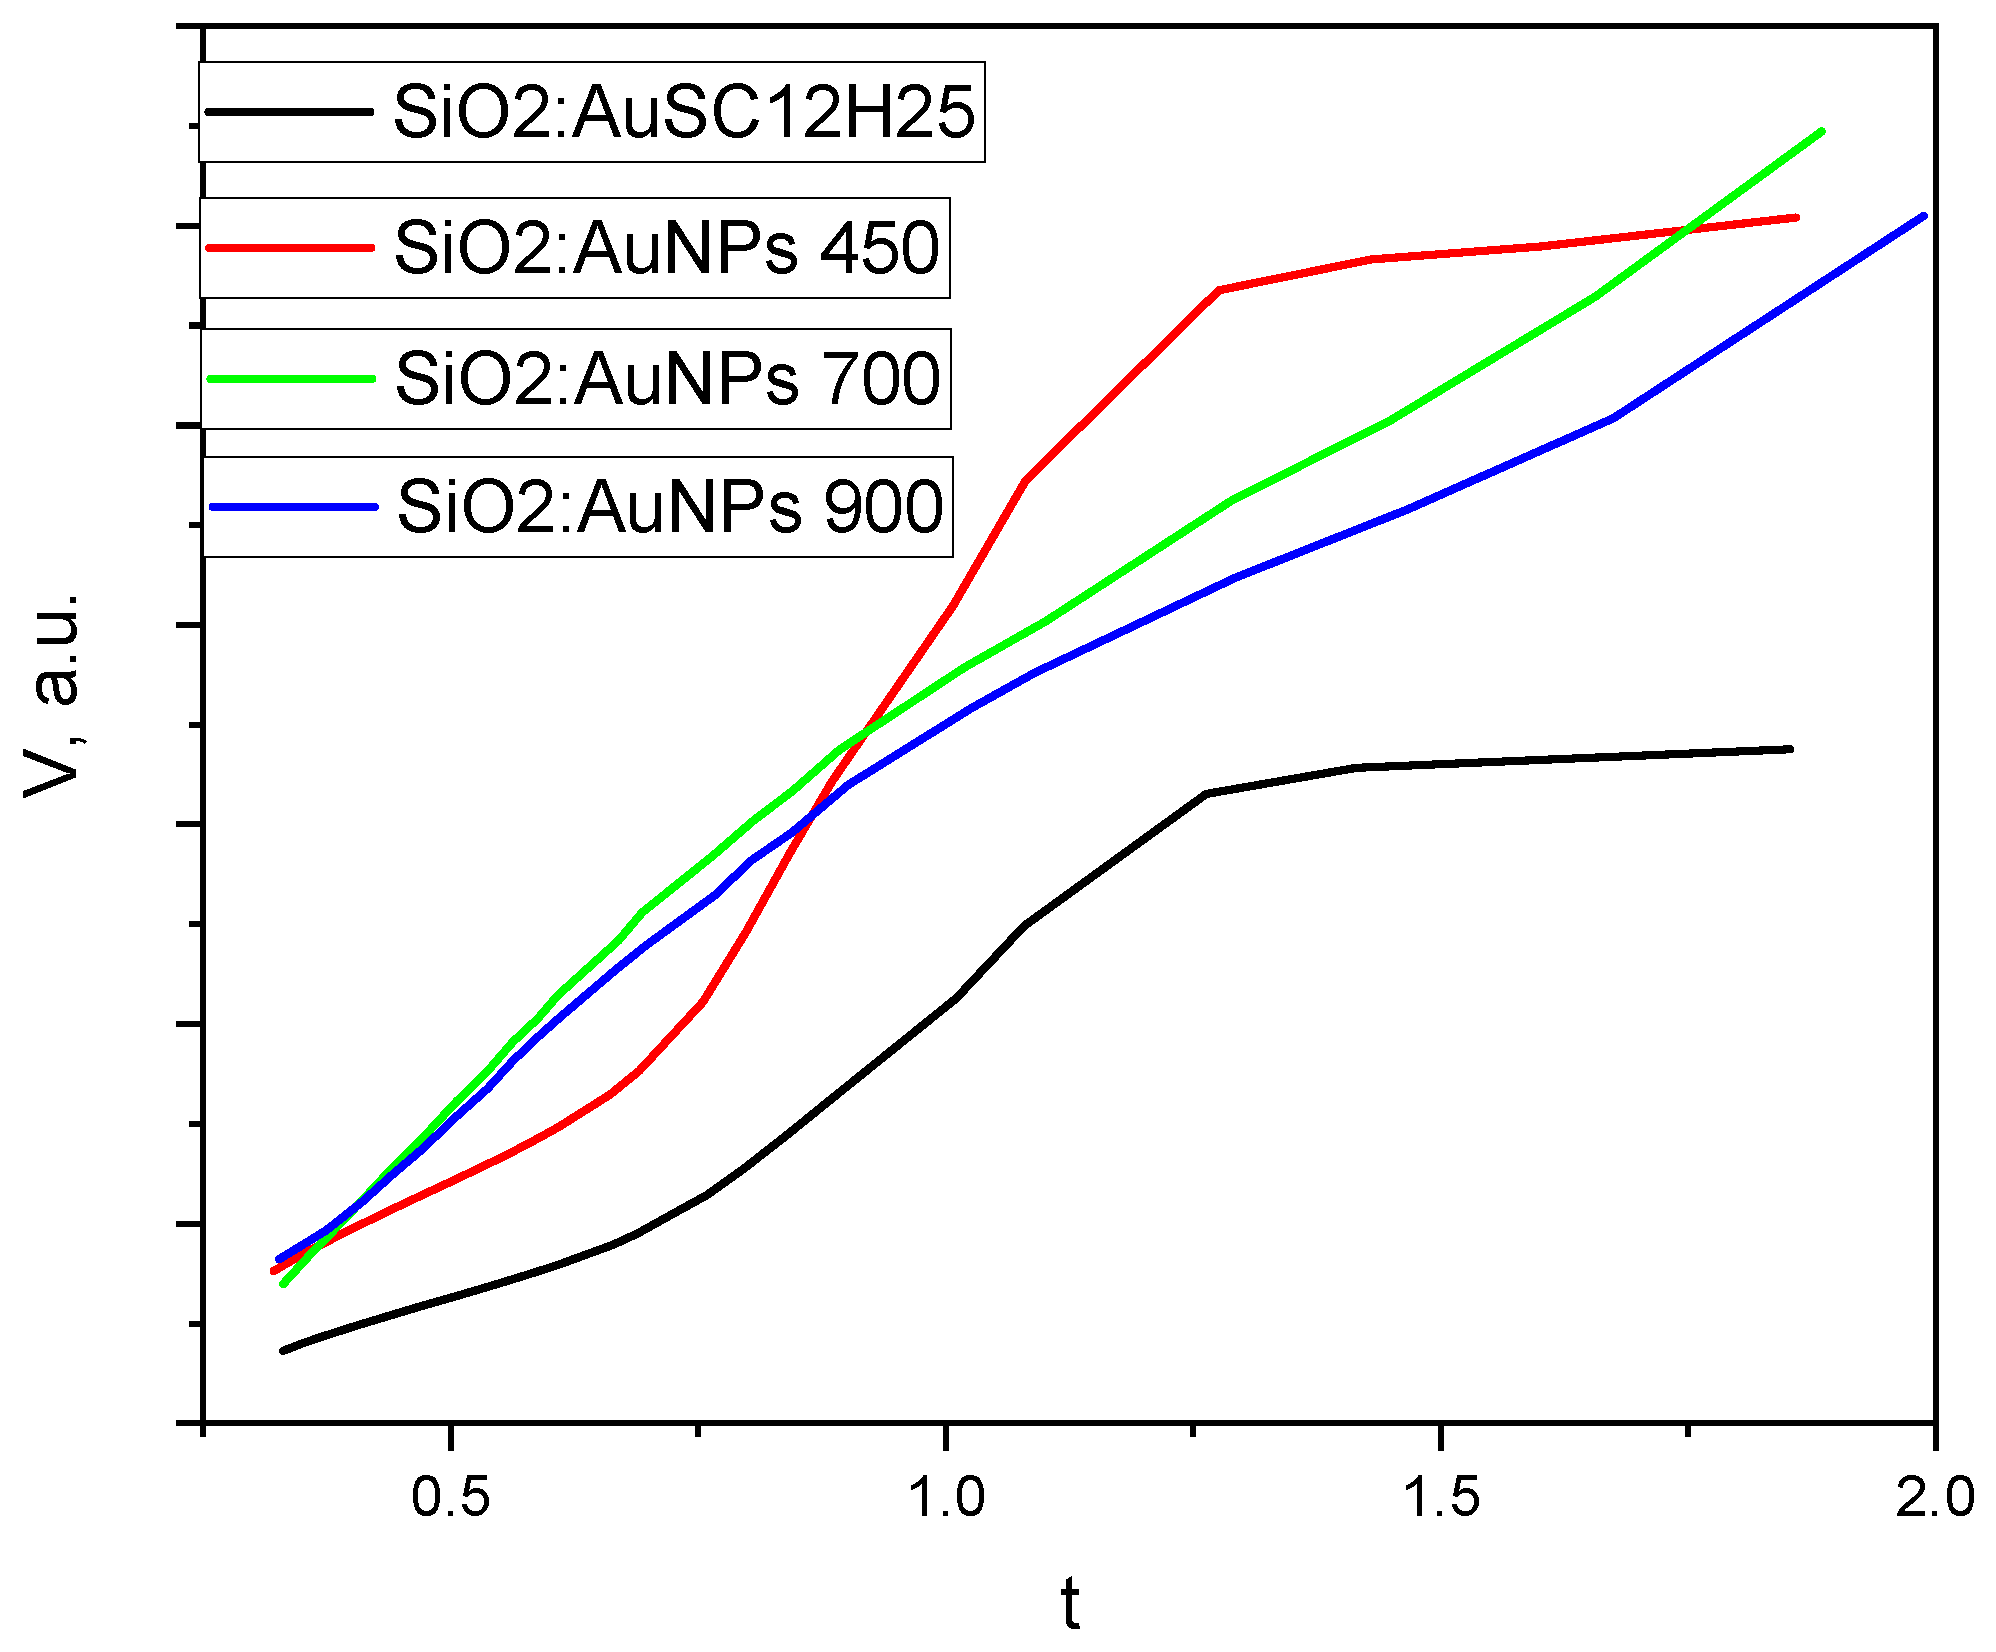

Table 1.
Textural properties of the investigated gels. The doping level of Au is 0.03% in all samples. The densities ρcalc are obtained using the values for amorphous silica and cristobalite, 2.19 g/cm3 and 2.30 g/cm3, respectively.
Table 1.
Textural properties of the investigated gels. The doping level of Au is 0.03% in all samples. The densities ρcalc are obtained using the values for amorphous silica and cristobalite, 2.19 g/cm3 and 2.30 g/cm3, respectively.
| Sample | SBET, m2/g |
Vt, cm3/g |
Dav nm |
T oC |
ρcalc g/cm3 |
|---|---|---|---|---|---|
| SiO2:AuSC12H25 | 204 | 0.52 | 10.0 | - | 1.02 |
| SiO2:AuNPs | 330 | 0.80 | 9.7 | 450 | 0.8 |
| SiO2:AuNPs | 21 | 0.04 | 6.9 | 700 | 2.01 |
| SiO2:AuNPs | 9 | 0.01 | 5.0 | 900 | 2.24 |
Table 2.
Photophysical parameters of the investigated nanocomposites extracted from their diffuse reflectance spectra.
Table 2.
Photophysical parameters of the investigated nanocomposites extracted from their diffuse reflectance spectra.
| Т [°C] | [cm-1] | [cm-1] | [cm-1] | [cm-1] | ||
|---|---|---|---|---|---|---|
| 450 | 0.91 | 18761 | 3911 | 0.44 | 24048 | 7095 |
| 700 | 0.81 | 18668 | 3666 | 0.42 | 22599 | 7457 |
Disclaimer/Publisher’s Note: The statements, opinions and data contained in all publications are solely those of the individual author(s) and contributor(s) and not of MDPI and/or the editor(s). MDPI and/or the editor(s) disclaim responsibility for any injury to people or property resulting from any ideas, methods, instructions or products referred to in the content. |
© 2025 by the authors. Licensee MDPI, Basel, Switzerland. This article is an open access article distributed under the terms and conditions of the Creative Commons Attribution (CC BY) license (http://creativecommons.org/licenses/by/4.0/).
Copyright: This open access article is published under a Creative Commons CC BY 4.0 license, which permit the free download, distribution, and reuse, provided that the author and preprint are cited in any reuse.


