
Submitted:
29 May 2025
Posted:
29 May 2025
You are already at the latest version
Abstract
CYP2C9 and CYP2C19 are major CYP450 enzymes that heavily influence the hepatic metabolism and bioactivation of many medications, including over-the-counter and narrow therapeutic index drugs. Compared to the wild-type alleles, genetic variants in either gene can potentially alter the pharmacokinetics of widely used medications, affect the desired therapeutic outcomes of a drug therapy, or increase the risk of undesired adverse events. The frequency of genetic polymorphisms associated with CYP450 enzymes can widely differ across and between racial and ethnic groups. This review explores the differences in CYP2C9 and CYP2C19 allele frequencies among European and Asian population subgroups. Identifying the significant differences across European and Asian populations, as well as within Asian subgroups, indicates the need to further scrutinize general population data. Healthcare providers should advocate for more inclusive pharmacogenomic data and be aware that clinical trials that recruit from mostly a single population may not necessarily have strong external generalizability for all populations. Furthermore, clinical trials that designate an all-inclusive Asian population consisting of multiple ethnicities may not be adequate due to the perceived genetic differences among Asian subgroups. Gravitating towards a more comprehensive approach to utilizing pharmacogenomic data can improve how drug therapies are prescribed and advance the future of precision medicine.
Keywords:
Asian
; European
; population subgroups
; racial categorizations
; CYP2C9
; CYP2C19
; pharmacogenomics
; precision medicine
1. Background
The Cytochrome P450 enzymes are responsible for the hepatic biotransformation or activation of medications and endogenous compounds in the human body. As members of the CYP2C subfamily, the CYP2C9 and CYP2C19 enzymes have significant roles in several drug therapies. Together, the two enzymes metabolize approximately 20-30% of all drugs. It is estimated that CYP2C9 metabolizes 15% and CYP2C19 metabolizes 8-10% of all medications in current use.[1]
CYP2C9 is a phase I drug-metabolizing enzyme responsible for the biotransformation of widely prescribed drugs.[2] Genetic variability in the CYP2C9 gene can alter the amino acid of the encoded protein, which can change substrate recognition sites and therefore the overall enzymatic activity.[3] CYP2C19 is another important drug-metabolizing enzyme with well-characterized phenotypes- normal, intermediate, poor, and ultrarapid metabolizers.[4] Generally, patients carrying genetic variations leading to reduced or no enzymatic activity are considered poor metabolizers and may exhibit unwanted adverse drug reactions compared with normal metabolizers. On the other hand, individuals who carry genetic variations that are associated with increased metabolic activity may compromise the desired therapeutic response due to increased enzymatic activity. [5]
Most CYP2C9 and CYP2C19 drug substrates are weak acids and include both over-the-counter and prescription medications.[3] Both Table 1 and Table 2 provide a summary list of common prescription drug labels that are metabolized by CYP2C9 and CYP2C19. The PGx levels indicate a requirement or recommendation for genetic testing, an actionable dose adjustment, contraindication, or therapeutic interchange, or lack of clinical recommendation as described in the PharmGKB database as identified by the U.S. Food and Drug Administration (FDA), European Medicines Agency (EMA), or Health Canada (HCSC).[6,7]
The pharmacogenomic information provided by these international drug agencies (FDA, EMA, and HCSC) can assist the clinical decision-making process and represents a step in the right direction toward realizing the benefits of precision medicine. However, the available prescribing information may not always be adequate, partly due to the lack of diversity in the patient populations to inform a genetically based guideline or the generalizability of drug efficacy. A well-designed clinical trial will include multiple sites with diverse populations worldwide, but even then, it can only represent a few subgroups of the global population to which the drug will be distributed. Outcome data can also be compromised by health disparities when ethnically diverse subgroups are aggregated into one single population. A common example of this practice is when Asian and Pacific Islander populations are underrepresented or consolidated into one large population group. In 2024, the United Nations estimated that 4.3 billion people live in Asia and the Pacific Islands- accounting for 60% of the global population. The region is home to the world’s two most populous countries-China and India.[8] Despite their large population size, the representations of these populations in global drug development remain limited.
Historically, individuals of European ancestry have been more prominently represented in clinical trials than those of Asian descent, despite a recent 67% increase in Asian representation over the past two decades.[9,10] Although race-specific dosing recommendations have been established for some Asian individuals, such as lower dosing regimens for rosuvastatin and warfarin, the significant underrepresentation of certain population subgroups in clinical trial data can lead to major public health concerns and exacerbate health disparities. Inadequate representation may result in investigational new drugs producing subtherapeutic plasma concentrations or posing a higher risk of adverse drug reactions in the very populations excluded from or underrepresented in the clinical development process. Previous studies have even identified variability among subgroups within the broader Asian population, further underscoring the importance of increasing racial and ethnic diversity in clinical pharmacogenomic research.[11,12]
Genetic variability in the CYP2C9 and CYP2C19 genes among Asian populations is a critical area of discussion due to its significant implications for drug metabolism and personalized medicine. Select variants in CYP2C9 and CYP2C19 are more prevalent in East Asian populations compared to European populations, leading to reduced enzyme activity and altered drug pharmacokinetics.[13] For CYP2C9, the CYP2C9*2 and CYP2C9*3 alleles have been identified as the most common decreased function alleles in individuals of European ancestry. In contrast, the CYP2C9*5, *6, *8, and *11 alleles are most frequent in those of African ancestry.[14] The most common non-functional CYP2C19 allele, CYP2C19*2, has been identified to have a greater frequency among Asian populations than European populations.[15] This difference in allele frequencies exemplifies the concept of genetic polymorphism and its interpatient variability among different populations. Derived from the germline cells, polymorphisms are essential in creating genetic diversity but can also affect an individual’s innate ability to metabolize or activate certain drugs via the CYP450 enzymes. Altered enzyme activity will subsequently affect the hepatic clearance, bioavailability, and elimination half-life, and most importantly, how an individual will respond to a particular medication. As such, incorporating pharmacogenetic testing into clinical decision-making can optimize dosing, minimize adverse drug reactions, and improve therapeutic outcomes in these populations.[16,17,18] This also underscores the importance of ethnicity-specific guidelines and further research into the clinical translation of CYP450 genetic variability in diverse ancestral populations.
2. Objective
The objective of this review article is to evaluate the frequencies of major CYP2C9 and CYP2C19 alleles among some of the largest Asian population subgroups compared to those of European subgroups. Acknowledging the differences between the European and Asian populations and further within the Asian subgroups can improve how future clinical trials recruit participants, increase the awareness of healthcare providers who prescribe medications affected by the enzymes, enhance the collection of diversity biomarkers in clinical trials, and improve therapeutic outcomes for underrepresented populations.
3. Methods
A PubMed search was conducted from December 2023 to March 2024 to find articles with pharmacogenomic data on European and Asian populations. Search terms included “Cytochrome P450,” “allele frequency,” “CYP2C9,” “CYP2C19,” “variability,” “polymorphism,” and “pharmacogenomics.” Ethnicities included “Asian,” “Chinese,” “Filipino,” “Hmong,” “Indian,” “Japanese,” “Korean,” and “Vietnamese.” Articles were incorporated in this review if the allele frequency was stated outright or able to be calculated from the study population. Articles that did not explicitly list an allele frequency in a results table instead stated the percentage in the Results or Discussion sections. Included articles also addressed at least one of the CYP2C9*2, *3, *5, *8, and *11 alleles, or CYP2C19*2, *3, and *17 alleles, and all relevant data were incorporated when available. CPIC Guidelines, PharmGKB, and DPWG resources were utilized to cross-reference pharmacogenomic information and drug dosing recommendations.
4. Results
This review included 34 articles regarding data from European, Chinese, Filipino, Hmong, Indian, Japanese, Korean, and Vietnamese populations to compile the major allele frequencies for CYP2C9 and CYP2C19 genes. The literature search yielded more published data from European, Chinese, Korean, and Japanese populations, while there were fewer articles addressing Filipino, Hmong, and Vietnamese populations. CYP2C9-related data were more robust for the CYP2C9*2 and CYP2C9*3 alleles than the CYP2C9*5, *8, and *11 alleles for all subgroups. Additionally, more publications addressed the non-functional CYPC19*2 and CYP2C19*3 alleles than the increased functional CYP2C19*17 allele. At least two studies with data on at least two alleles were included for each population subgroup. The frequency ranges of the CYP2C9 and CYP2C19 alleles that were reviewed are summarized in Figure 1 and Figure 2.
4.1. CYP2C9
After analyzing the aggregated data, the European allele frequency ranges were 9.9% to 15.7% for CYP2C9*2 and 5.3% to 9.8% for CYP2C9*3. There was no data regarding European allele frequency for CYP2C9*5, CYP2C9*8, and CYP2C9*11 in the reviewed articles. In comparison, the Asian allele frequency ranges were 0% to 4% for CYP2C9*2, 0.5% to 18.9% for CYP2C9*3, 0% for CYP2C9*5, 1.8% for CYP2C9*8, and 0% to 0.05% for CYP2C9*11. The ranges of the European population and each Asian population subgroup are shown in Figure 1. The complete data of the populations and subgroups are compiled in Table 3.
European subgroup data identified the CYP2C9*2 frequency to be 14.7% for Croatian, 12.1% for Danish, 9.9% for Norwegian, 11.3% for Romanian, 11.7% for Serbian, 15.6% for Spanish, and 15.7% for the combination of Spanish and Northern Italian populations. The CYP2C9*3 frequencies were 7.6% for Croatian, 5.3% for Danish, 6.5% for Norwegian, 9.3% for Romanian, 8.1% for Serbian, 9.8% for Spanish, and 7.8% for the combination of Spanish and Northern Italian populations (Table 3).
Data derived from the Asian populations showed a lower frequency range for CYP2C9*2 than the European populations. No Asian subgroup had a CYP2C9*2 frequency greater than 0.5%, except the Indian subgroup at 4%. The range for the CYP2C9*3 allele frequency was wider in comparison, with the Hmong population representing greater frequencies of 16.6% to 18.9%, which heavily influenced the overall Asian range. Additionally, none of the Asian subgroups had a CYP2C9*3 frequency greater than 9.0%, other than the Hmong subgroup at 16.6 to 18.9%. Within the same population subgroup, the CYP2C9*3 frequency showed the greatest variability in Chinese, ranging from 2.0 to 9.0%.
A comparison of the European and Asian data shows a significant difference in the allele frequency for CYP2C9*2. A European individual is more likely to express the CYP2C9*2 allele than an individual of Asian descent based on the studies evaluated in this review. The lower limit of the range in the European data (9.9%) remains significantly greater than the upper limit of the range in the Asian data (4.0%). The data also shows that a European individual is more likely to express the CYP2C9*3 allele unless the Asian individual is of Hmong or Indian descent. The CYP2C9*3 frequency of the Hmong subgroup is significantly greater than the other European and Asian populations.
4.2. CYP2C19
The CYP2C19 allele frequency range of the European populations is compared with that of the Asian population subgroups in Figure 3 and the data of the populations and subgroups are listed in Table 4.
The European data showed a frequency range of 11.1-16.3% for CYP2C19*2, 0% for CYP2C19*3, and 19.6-25.5% for CYP2C19*17. Subgroup data for the CYP2C19*2 frequencies were 15.0% for Danish, 15.2% for German, 13.1% for Greek, 11.1% for Italian, 15.2% for Norwegian, and 16.3% for Serbian populations. There was no occurrence of the CYP2C19*3 allele in European subgroups. The CYP2C19*17 subgroup frequencies were 23.9% for Croatian, 20.1% for Danish, 25.5% for German, 19.6% for Greek, 22.0% for Norwegian, and 22.2% for Serbian populations.
The overall Asian population data showed a wider range for each of the CYP2C19 variant allele frequencies than Europeans. The Asian data showed a frequency range of 20.5-53.8% for CYP2C19*2, 0-15.6% for CYP2C19*3, and 0.5-17.9% for CYP2C19*17. There was a greater frequency for the non-functional alleles CYP2C19*2 and CYP2C19*3 in all Asian subgroups than in the European population. Among the Asian subgroups, the Chinese (24.9-45.5%) and Indian (22.0-41.7%) subgroups demonstrated the widest range of CYP2C19*2 expression. The Hmong (0-0.3%) and Indian (0-1.2%) subgroups demonstrated the lowest expression of CYP2C19*3. The CYP2C19*17 increased function allele was significantly more common in the European population at 19.6-25.5%.
The data shows marked differences in the allele frequency for the CYP2C19*2, *3, and *17 alleles. An Asian individual is much more likely to have either a non-functional CYP2C19*2 or CYP2C19*3 allele than someone of European descent. The maximum of the allele frequency range in the European data is lower than the lowest value in any of the Asian subsets for CYP2C19*2. There was no data to suggest that any individual expressed the CYP2C19*3 allele in the 7 studies that were reviewed for populations in Europe. Aside from the Indian subgroup (10.2-17.9%), no other Asian subgroup expressed the CYP2C19*17 allele greater than 2.1%, which is over ten times less than that of the European average of 22.3%.
5. Discussion
In this review, the Asian subgroups included Chinese, Filipino, Hmong, Indian, Japanese, Korean, and Vietnamese populations. Figure 2 shows that the CYP2C9*2 and CYP2C9*3 subgroup frequencies are relatively similar based on their geographic proximity. For example, the Vietnamese and Filipino subgroups have similar ranges but differ from that of the Indian subgroup. The Chinese, Japanese, and Korean subgroups also appear to have similar frequencies for the CYP2C9 variants.
Similar trends in CYP2C19 allele frequencies were also observed (Figure 3) in both Asian and European groups. Geographical differences among European countries remained marginal, with relatively comparable CYP2C19 allele frequencies. Unlike Asian subgroups, the European population subgroups demonstrated less variability in the CYP2C19 allele frequencies. Based on the studies reviewed, the CYP2C19*3 allele was not identified in any of the European subgroups but was moderately prevalent in each of the Asian subgroups – the Japanese subgroup had the highest frequency, ranging from 9.1% to 15.6%. The Hmong and Filipino subgroups exhibited greater frequency for the CYP2C19*2 allele than all other Asian subgroups. Additionally, CYP2C19*3 allele frequencies were relatively rare in the Hmong and Indian populations. These trends may also highlight the genetic differences that may result from ancestral migration.
The Chinese subgroup demonstrated the greatest variability in the CYP2C9*3 and CYP2C19*2 alleles compared to any other population subgroups included in this review. This can be attributed to the ethnic diversity within the Chinese population, which includes the Han Chinese majority, 55 officially recognized minority groups, and additional unrecognized ethnic groups.[51] When reviewing the CYP2C19 data, two articles reviewed specific data for individual Chinese subgroups and identified some variabilities that exist within the country.[37,39]
The Hmong subgroup demonstrated a CYP2C9*3 allele frequency that was vastly different from all other Asian subgroups in this analysis. This could be shaped by the unique history of the tight-knit Hmong communities that originally settled in present-day Vietnam, Cambodia, and Laos and then relocated to refugee communities across the United States.[52] The isolated and displaced history of the Hmong population may have led to genetic compositions that significantly differed from their geographical neighbors. Due to the scarcity of data, one of the studies for Hmong data derived CYP2C9 data from Hmong populations in the United States.[53] Another study used for CYP2C19 data utilized data from the Hmong population in Vietnam.[33]
The Indian subgroup exhibited distinct frequency ranges for CYP2C9*2, CYP2C9*3, and CYP2C19*17 compared to other Asian subgroups. In addition to its isolated geographic location from other Asian subgroups, India has a complex history of migration, with ancestral contributions from Eurasia, Southeast Asia, Africa, and Europe, thereby enriching its genetic diversity.[54] India’s rapid population growth to become the most populous country in the world in recent years could also contribute to its distinct genetic profile. Notably, the Indian subgroup’s CYP2C9*3 frequency range (8.0-9.0%) is more similar to European subgroups (7.6-9.8%) than other Asian subgroups. Similarly, the CYP2C19*17 range (10.2-17.9%) aligns more closely with the European population (19.6-25.5%).
Based on the CYP2C19 data, we observed more non-functional CYP2C19*2 and CYP2C19*3 alleles in the Asian subgroups compared to the Europeans. Additionally, there was a greater frequency of the increased function CYP2C19*17 allele in each of the European subgroups than in any of the Asian subgroups. The frequency percentages of the general European and Asian populations in our review were very similar to those stated in the CPIC Guidelines for CYP2C19 and PPI Dosing, which estimated a CYP2C19*2 allele frequency of 15% in Europeans and 25-30% in Asians and a CYP2C19*17 allele frequency of 20% in Europeans.[15] These trends may suggest that medications that are metabolized by CYP2C19, such as proton pump inhibitors, serotonin reuptake inhibitors, and tricyclic antidepressants, are more likely to have increased bioavailability in Asian individuals and lower bioavailability in European individuals. Conversely, medications that are bioactivated by the CYP2C19 enzyme, such as clopidogrel, may be less likely to reach therapeutic levels in individuals of Asian descent.
Inter-ethnic variations for CYP2C9 allele frequencies may impact how different populations metabolize common and widely used drugs such as nonsteroidal anti-inflammatory drugs (NSAIDs), including ibuprofen and celecoxib. Similarly, CYP2C9 genetic variability can have a profound impact on narrow therapeutic index drugs, like warfarin.[14,55] For NSAIDs, both the CYP2C9*2 and CYP2C9*3 alleles exhibit a decreased metabolic rate compared to the CYP2C9*1. The Clinical Pharmacogenetics Implementation Consortium (CPIC) defines the CYP2C9*1/*2, CYP2C9*2/*2, and CYP2C9*1/*3 diplotypes as intermediate metabolizers and the CYP2C9*2/*3 and CYP2C9*3/*3 diplotypes as poor metabolizers, warranting dose modifications for NSAIDs metabolized by CYP2C9.[55] CYP2C9 is a major contributor to warfarin metabolism and could partly explain the interindividual variability of the initial dosing requirement strategy. CYP2C9 is the primary metabolizer of the more potent S-warfarin enantiomer. Previous studies have estimated that CYP2C9*2 decreases warfarin metabolism by 30-40% while CYP2C9*3 decreases warfarin metabolism by 80-90%. Consequently, inheriting one or two copies of either allele can increase warfarin bioavailability and bleeding risk during warfarin therapy and result in lower dosing strategies to achieve the desired therapeutic benefit.[14] Indeed, information about CYP2C9, VKORC1, and CYP4F2 phenotypes could optimize the initial dosing of warfarin and achieve the target International Normalized Ratio (INR).
Variations in CYP2C19 allele frequencies can also influence the metabolism of both over-the-counter and prescription drugs. Proton pump inhibitors (PPIs) are common drugs that irreversibly inhibit gastric acid production via parietal cells. The CYP2C19 enzyme is estimated to be responsible for nearly 80% of the metabolism of first-generation PPIs, such as omeprazole and pantoprazole. Second-generation PPIs are less dependent on CYP2C19 metabolism. CPIC Guidelines for CYP2C19 and PPI Dosing identify the CYP2C19*1/*1 diplotype as a normal metabolizer. Possessing the CYP2C19*17 increased function allele can identify the individual as a rapid metabolizer (CYP2C19*1/*17) or ultrarapid metabolizer (CYP2C19*17/*17). A non-functional allele, such as CYP2C19*2 or CYP2C19*3, can lead to an intermediate metabolizer (CYP2C19*1/*2 or CYP2C19*1/*3) or poor metabolizer (CYP2C19*2/*2, CYP2C19*3/*3, or CYP2C19*2/*3). For omeprazole, lansoprazole, pantoprazole, and dexlansoprazole, CPIC guidelines recommend a 100% increase in the initial dosing for ultrarapid metabolizers. Additionally, intermediate and poor CYP2C19 metabolizers can consider a 50% daily dose reduction for chronic therapy.[15] Conversely, clopidogrel is a prodrug that requires hepatic biotransformation to its active form. The CYP2C19 enzyme is responsible for 44.9% of the first activation step and 20.6% of the second activation step.[5] Consequently, intermediate and poor CYP2C19 metabolizers are at a greater risk for therapeutic failure due to reduced active metabolite formation. For acute coronary syndrome and/or PCI indications, the CPIC guidelines strongly recommend intermediate metabolizers to avoid the standard dose of clopidogrel if possible and to use prasugrel or ticagrelor as alternative therapies. CYP2C19 poor metabolizers should avoid clopidogrel entirely if possible.[16,50]
Although numerous case studies support the relevance of individual genetic variation in informing treatment strategies, this review focuses specifically on interethnic differences in allele frequencies of CYP2C9 and CYP2C19—two key drug-metabolizing enzymes with significant implications for managing prevalent and chronic conditions. Current research underscores substantial variability in the distribution of these alleles across Asian subpopulations, highlighting the critical need for diversity in both clinical and genomic studies.[56] Importantly, aggregated racial categories such as "Asian" often obscure meaningful genetic differences among subgroups, including East Asian, South Asian, and Southeast Asian populations.[57] This oversimplification may perpetuate inaccurate assumptions and hinder the advancement of truly personalized medicine. Relying on broad racial classifications risks reinforcing the problematic use of race as a biological proxy rather than focusing on specific, actionable genetic markers.[58] Clinical pharmacogenetic guidelines frequently provide general recommendations based on pan-ethnic categories, potentially neglecting subgroup-specific risks and responses to therapy. We advocate for disaggregated data analysis and recommend that healthcare providers incorporate preemptive pharmacogenetic testing, especially when prescribing medications metabolized by polymorphic enzymes like CYP2C9 and CYP2C19, to optimize drug efficacy and safety on an individual level.
6. Limitations
The literature search revealed a limited number of studies published within the past five years focusing specifically on the Hmong and Vietnamese subgroups, indicating a persistent gap in pharmacogenomic research for these populations. Similarly, recent data on European subgroups were scarcer than anticipated, particularly outside of Southern Europe. To enhance the comprehensiveness of the review, broader search queries were employed, which enabled the inclusion of additional studies relevant to the cytochrome P450 enzyme family and Asian populations more generally. Despite this, only one study was identified that specifically addressed the CYP2C9 *5, *8, and *11 alleles, and it included data exclusively from Chinese, Japanese, and Korean subgroups.[25] Notably, much of the available data on European populations originated from Southern European countries bordering the Mediterranean, many of which have historically been underrepresented in large-scale clinical trials. This trend reflects a broader issue of uneven representation in pharmacogenomic research, further emphasizing the need for expanded, subgroup-specific investigations to support equitable and evidence-based clinical decision-making.
7. Conclusions
This narrative review highlights the significant and quantifiable differences in CYP2C9 and CYP2C19 allele frequencies between European and Asian populations, while underscoring the importance of further disaggregating data to reveal meaningful genetic distinctions among Asian subgroups. The observed variability in allele frequencies likely reflects differences in optimal drug dosing strategies, which can have critical implications for efficacy and safety across diverse populations. Beyond these enzymes, other cytochrome P450 variants and pharmacologically relevant genes may also exhibit population-specific patterns that warrant further investigation. To enhance the applicability of pharmacogenomic research, healthcare providers and researchers must advocate for more inclusive and representative data that better reflect global genetic diversity. Clinical trials conducted exclusively in European or broadly defined Asian populations may lack the external validity necessary to inform treatment across all patient groups. Moreover, categorizing Asian populations as a monolithic group fails to capture the genetic heterogeneity within this diverse demographic. Moving toward a more nuanced and comprehensive integration of pharmacogenomic data into clinical practice will be essential to optimizing drug therapy and realizing the full potential of precision medicine. Our findings reinforce the importance of more granular population stratification in the design and interpretation of pharmacogenetic research.
8. Future Directions
The observed variability in CYP2C9 and CYP2C19 allele frequencies across ethnic groups underscores the potential for differential drug responses among diverse populations. Such genetic differences can significantly influence therapeutic outcomes, especially for medications with narrow therapeutic indices, where even minor variations in drug metabolism may lead to toxicity or therapeutic failure. Current prescribing guidelines may be limited by evidence derived from clinical trials with insufficient representation of ethnic minority populations, potentially compromising their generalizability. Future clinical trials should prioritize inclusive recruitment strategies that span multiple geographic regions and demographic groups to enhance external validity and ensure equitable evidence generation. Moreover, the development of pharmacogenetic guidelines should explicitly integrate data from underrepresented populations, enabling clinicians to make more informed, population-specific prescribing decisions. By incorporating genetic diversity into both research and clinical practice, we can move closer to the goal of equitable, precision-based healthcare for all patients.
Author Contributions
Conceptualization, Y.M.R.; writing—original draft preparation, H.V.N.; Y.M.R.; literature review and writing—reviewing and editing, H.V.N.; Y.M.R.; supervision and final approval, Y.M.R. All authors have read and agreed to the published version of the manuscript.
Funding
This research received no external funding.
Institutional Review Board Statement
Not applicable.
Informed Consent Statement
Not applicable.
Data Availability Statement
Not applicable.
Conflicts of Interest
The authors declare no conflict of interest.
References
- Vidovic S, Skrbic R, Stojiljkovic MP, et al. Prevalence of five pharmacologically most important CYP2C9 and CYP2C19 allelic variants in the population from the Republic of Srpska in Bosnia and Herzegovina. Arh Hig Rada Toksikol 2021;72(3):129-134. [CrossRef]
- Sangkuhl K, Claudio-Campos K, Cavallari LH, et al. PharmVar GeneFocus: CYP2C9. Clin Pharmacol Ther 2021;110(3):662-676. [CrossRef]
- Miners JO, Birkett DJ. Cytochrome P4502C9: an enzyme of major importance in human drug metabolism. Br J Clin Pharmacol 1998;45(6):525-38. [CrossRef]
- Botton MR, Whirl-Carrillo M, Del Tredici AL, et al. PharmVar GeneFocus: CYP2C19. Clin Pharmacol Ther 2021;109(2):352-366. [CrossRef]
- Sienkiewicz-Oleszkiewicz B, Wiela-Hojenska A. CYP2C19 polymorphism in relation to the pharmacotherapy optimization of commonly used drugs. Pharmazie 2018;73(11):619-624. [CrossRef]
- PHARMGKB. CYP2C9 Drug Label Annotations. (https://www.pharmgkb.org/gene/PA126/labelAnnotation).
- PHARMGKB. CYP2C19 Drug Label Annotations. (https://www.pharmgkb.org/gene/PA124/labelAnnotation).
- UNFPA. Asian and the Pacific. Population trends. (https://asiapacific.unfpa.org/en/topics/population-trends-9).
- Bottern J, Stage TB, Dunvald AD. Sex, racial, and ethnic diversity in clinical trials. Clin Transl Sci 2023;16(6):937-945. [CrossRef]
- Clark LT, Watkins L, Pina IL, et al. Corrigendum to ;;Increasing Diversity in Clinical Trials: Overcoming Critical Barriers''. [Current Problems in Cardiology, Volume 44, Issue 5 (2019) 148-172]. Curr Probl Cardiol 2021;46(3):100647. [CrossRef]
- Alrajeh K, AlAzzeh O, Roman Y. The frequency of major ABCG2, SLCO1B1 and CYP2C9 variants in Asian, Native Hawaiian and Pacific Islander women subgroups: implications for personalized statins dosing. Pharmacogenomics 2023;24(7):381-398. [CrossRef]
- Alrajeh KY, Roman YM. The frequency of major CYP2C19 genetic polymorphisms in women of Asian, Native Hawaiian and Pacific Islander subgroups. Per Med 2022;19(4):327-339. [CrossRef]
- Zhou Y, Ingelman-Sundberg M, Lauschke VM. Worldwide Distribution of Cytochrome P450 Alleles: A Meta-analysis of Population-scale Sequencing Projects. Clin Pharmacol Ther 2017;102(4):688-700. [CrossRef]
- Johnson JA, Caudle KE, Gong L, et al. Clinical Pharmacogenetics Implementation Consortium (CPIC) Guideline for Pharmacogenetics-Guided Warfarin Dosing: 2017 Update. Clin Pharmacol Ther 2017;102(3):397-404. [CrossRef]
- Lima JJ, Thomas CD, Barbarino J, et al. Clinical Pharmacogenetics Implementation Consortium (CPIC) Guideline for CYP2C19 and Proton Pump Inhibitor Dosing. Clin Pharmacol Ther 2021;109(6):1417-1423. [CrossRef]
- Lee CR, Luzum JA, Sangkuhl K, et al. Clinical Pharmacogenetics Implementation Consortium Guideline for CYP2C19 Genotype and Clopidogrel Therapy: 2022 Update. Clin Pharmacol Ther 2022;112(5):959-967. [CrossRef]
- Chenchula S, Atal S, Uppugunduri CRS. A review of real-world evidence on preemptive pharmacogenomic testing for preventing adverse drug reactions: a reality for future health care. Pharmacogenomics J 2024;24(2):9. [CrossRef]
- Swen JJ, van der Wouden CH, Manson LE, et al. A 12-gene pharmacogenetic panel to prevent adverse drug reactions: an open-label, multicentre, controlled, cluster-randomised crossover implementation study. Lancet 2023;401(10374):347-356. [CrossRef]
- Celinscak Z, Zajc Petranovic M, Setinc M, et al. Pharmacogenetic distinction of the Croatian population from the European average. Croat Med J 2022;63(2):117-125. [CrossRef]
- Pedersen RS, Brasch-Andersen C, Sim SC, et al. Linkage disequilibrium between the CYP2C19*17 allele and wildtype CYP2C8 and CYP2C9 alleles: identification of CYP2C haplotypes in healthy Nordic populations. Eur J Clin Pharmacol 2010;66(12):1199-205. [CrossRef]
- Buzoianu AD, Trifa AP, Muresanu DF, Crisan S. Analysis of CYP2C9*2, CYP2C9*3 and VKORC1 -1639 G>A polymorphisms in a population from South-Eastern Europe. J Cell Mol Med 2012;16(12):2919-24. [CrossRef]
- Skadric I, Stojkovic O. Defining screening panel of functional variants of CYP1A1, CYP2C9, CYP2C19, CYP2D6, and CYP3A4 genes in Serbian population. Int J Legal Med 2020;134(2):433-439. [CrossRef]
- Dorado P, Berecz R, Norberto MJ, Yasar U, Dahl ML, A LL. CYP2C9 genotypes and diclofenac metabolism in Spanish healthy volunteers. Eur J Clin Pharmacol 2003;59(3):221-5. [CrossRef]
- Sanchez-Diz P, Estany-Gestal A, Aguirre C, et al. Prevalence of CYP2C9 polymorphisms in the south of Europe. Pharmacogenomics J 2009;9(5):306-10. [CrossRef]
- Dorji PW, Tshering G, Na-Bangchang K. CYP2C9, CYP2C19, CYP2D6 and CYP3A5 polymorphisms in South-East and East Asian populations: A systematic review. J Clin Pharm Ther 2019;44(4):508-524. [CrossRef]
- Ustare LAT, Reyes KG, Lasac MAG, Brodit SE, Jr., Baclig MO. Single nucleotide polymorphisms on CYP2C9 gene among Filipinos and its association with post-operative pain relief via COX-2 inhibitors. Int J Mol Epidemiol Genet 2020;11(2):31-38. (https://www.ncbi.nlm.nih.gov/pubmed/33240461).
- Sun B, Wen YF, Culhane-Pera KA, et al. Differences in Predicted Warfarin Dosing Requirements Between Hmong and East Asians Using Genotype-Based Dosing Algorithms. Pharmacotherapy 2021;41(3):265-276. [CrossRef]
- Wen YF, Culhane-Pera KA, Thyagarajan B, et al. Potential Clinical Relevance of Differences in Allele Frequencies Found within Very Important Pharmacogenes between Hmong and East Asian Populations. Pharmacotherapy 2020;40(2):142-152. [CrossRef]
- Gaikwad T, Ghosh K, Shetty S. VKORC1 and CYP2C9 genotype distribution in Asian countries. Thromb Res 2014;134(3):537-44. [CrossRef]
- Jose R, Chandrasekaran A, Sam SS, et al. CYP2C9 and CYP2C19 genetic polymorphisms: frequencies in the south Indian population. Fundam Clin Pharmacol 2005;19(1):101-5. [CrossRef]
- Xie HG, Prasad HC, Kim RB, Stein CM. CYP2C9 allelic variants: ethnic distribution and functional significance. Adv Drug Deliv Rev 2002;54(10):1257-70. [CrossRef]
- Soga Y, Nishimura F, Ohtsuka Y, et al. CYP2C polymorphisms, phenytoin metabolism and gingival overgrowth in epileptic subjects. Life Sci 2004;74(7):827-34. [CrossRef]
- Vu NP, Nguyen HTT, Tran NTB, et al. CYP2C19 genetic polymorphism in the Vietnamese population. Ann Hum Biol 2019;46(6):491-497. [CrossRef]
- Geisler T, Schaeffeler E, Dippon J, et al. CYP2C19 and nongenetic factors predict poor responsiveness to clopidogrel loading dose after coronary stent implantation. Pharmacogenomics 2008;9(9):1251-9. [CrossRef]
- Ragia G, Arvanitidis KI, Tavridou A, Manolopoulos VG. Need for reassessment of reported CYP2C19 allele frequencies in various populations in view of CYP2C19*17 discovery: the case of Greece. Pharmacogenomics 2009;10(1):43-9. [CrossRef]
- Scordo MG, Caputi AP, D'Arrigo C, Fava G, Spina E. Allele and genotype frequencies of CYP2C9, CYP2C19 and CYP2D6 in an Italian population. Pharmacol Res 2004;50(2):195-200. [CrossRef]
- Yang Z, Xie Y, Zhang D, et al. CYP2C19 gene polymorphism in Ningxia. Pharmacol Rep 2023;75(3):705-714. [CrossRef]
- Chen L, Qin S, Xie J, et al. Genetic polymorphism analysis of CYP2C19 in Chinese Han populations from different geographic areas of mainland China. Pharmacogenomics 2008;9(6):691-702. [CrossRef]
- Zuo LJ, Guo T, Xia DY, Jia LH. Allele and genotype frequencies of CYP3A4, CYP2C19, and CYP2D6 in Han, Uighur, Hui, and Mongolian Chinese populations. Genet Test Mol Biomarkers 2012;16(2):102-8. [CrossRef]
- Yamada S, Onda M, Kato S, et al. Genetic differences in CYP2C19 single nucleotide polymorphisms among four Asian populations. J Gastroenterol 2001;36(10):669-72. [CrossRef]
- Goldstein JA, Ishizaki T, Chiba K, et al. Frequencies of the defective CYP2C19 alleles responsible for the mephenytoin poor metabolizer phenotype in various Oriental, Caucasian, Saudi Arabian and American black populations. Pharmacogenetics 1997;7(1):59-64. [CrossRef]
- Gulati S, Yadav A, Kumar N, et al. Frequency distribution of high risk alleles of CYP2C19, CYP2E1, CYP3A4 genes in Haryana population. Environ Toxicol Pharmacol 2014;37(3):1186-93. [CrossRef]
- Anichavezhi D, Chakradhara Rao US, Shewade DG, Krishnamoorthy R, Adithan C. Distribution of CYP2C19*17 allele and genotypes in an Indian population. J Clin Pharm Ther 2012;37(3):313-8. [CrossRef]
- Ghodke Y, Joshi K, Arya Y, et al. Genetic polymorphism of CYP2C19 in Maharashtrian population. Eur J Epidemiol 2007;22(12):907-15. [CrossRef]
- Shalia KK, Shah VK, Pawar P, Divekar SS, Payannavar S. Polymorphisms of MDR1, CYP2C19 and P2Y12 genes in Indian population: effects on clopidogrel response. Indian Heart J 2013;65(2):158-67. [CrossRef]
- Kubota T, Chiba K, Ishizaki T. Genotyping of S-mephenytoin 4'-hydroxylation in an extended Japanese population. Clin Pharmacol Ther 1996;60(6):661-6. [CrossRef]
- Fukushima-Uesaka H, Saito Y, Maekawa K, et al. Genetic variations and haplotypes of CYP2C19 in a Japanese population. Drug Metab Pharmacokinet 2005;20(4):300-7. [CrossRef]
- Lee SS, Lee SJ, Gwak J, et al. Comparisons of CYP2C19 genetic polymorphisms between Korean and Vietnamese populations. Ther Drug Monit 2007;29(4):455-9. [CrossRef]
- Kim KA, Song WK, Kim KR, Park JY. Assessment of CYP2C19 genetic polymorphisms in a Korean population using a simultaneous multiplex pyrosequencing method to simultaneously detect the CYP2C19*2, CYP2C19*3, and CYP2C19*17 alleles. J Clin Pharm Ther 2010;35(6):697-703. [CrossRef]
- Roh HK, Dahl ML, Tybring G, Yamada H, Cha YN, Bertilsson L. CYP2C19 genotype and phenotype determined by omeprazole in a Korean population. Pharmacogenetics 1996;6(6):547-51. [CrossRef]
- Gao Y, Yang X, Chen H, et al. A pangenome reference of 36 Chinese populations. Nature 2023;619(7968):112-121. [CrossRef]
- Kiffmeyer WR, Langer E, Davies SM, Envall J, Robison LL, Ross JA. Genetic polymorphisms in the Hmong population: implications for cancer etiology and survival. Cancer 2004;100(2):411-7. [CrossRef]
- Zhou SF, Liu JP, Chowbay B. Polymorphism of human cytochrome P450 enzymes and its clinical impact. Drug Metab Rev 2009;41(2):89-295. [CrossRef]
- Sengupta D, Choudhury A, Basu A, Ramsay M. Population Stratification and Underrepresentation of Indian Subcontinent Genetic Diversity in the 1000 Genomes Project Dataset. Genome Biol Evol 2016;8(11):3460-3470. [CrossRef]
- Theken KN, Lee CR, Gong L, et al. Clinical Pharmacogenetics Implementation Consortium Guideline (CPIC) for CYP2C9 and Nonsteroidal Anti-Inflammatory Drugs. Clin Pharmacol Ther 2020;108(2):191-200. [CrossRef]
- Roman Y. Bridging the United States population diversity gaps in clinical research: roadmap to precision health and reducing health disparities. Per Med 2025:1-11. [CrossRef]
- Vo V, Lopez G, Malay S, Roman YM. Cardiovascular Risk Factors Among Asian Americans: Perspectives on the Role of Acculturation in Cardiovascular Diseases Health Disparities. J Immigr Minor Health 2024;26(2):409-420. [CrossRef]
- Roman, YM. Race and precision medicine: is it time for an upgrade? Pharmacogenomics J 2019;19(1):1-4. [CrossRef]
Figure 2.
CYP2C9*2 and *3 allele frequency in European and Asian population subgroups.
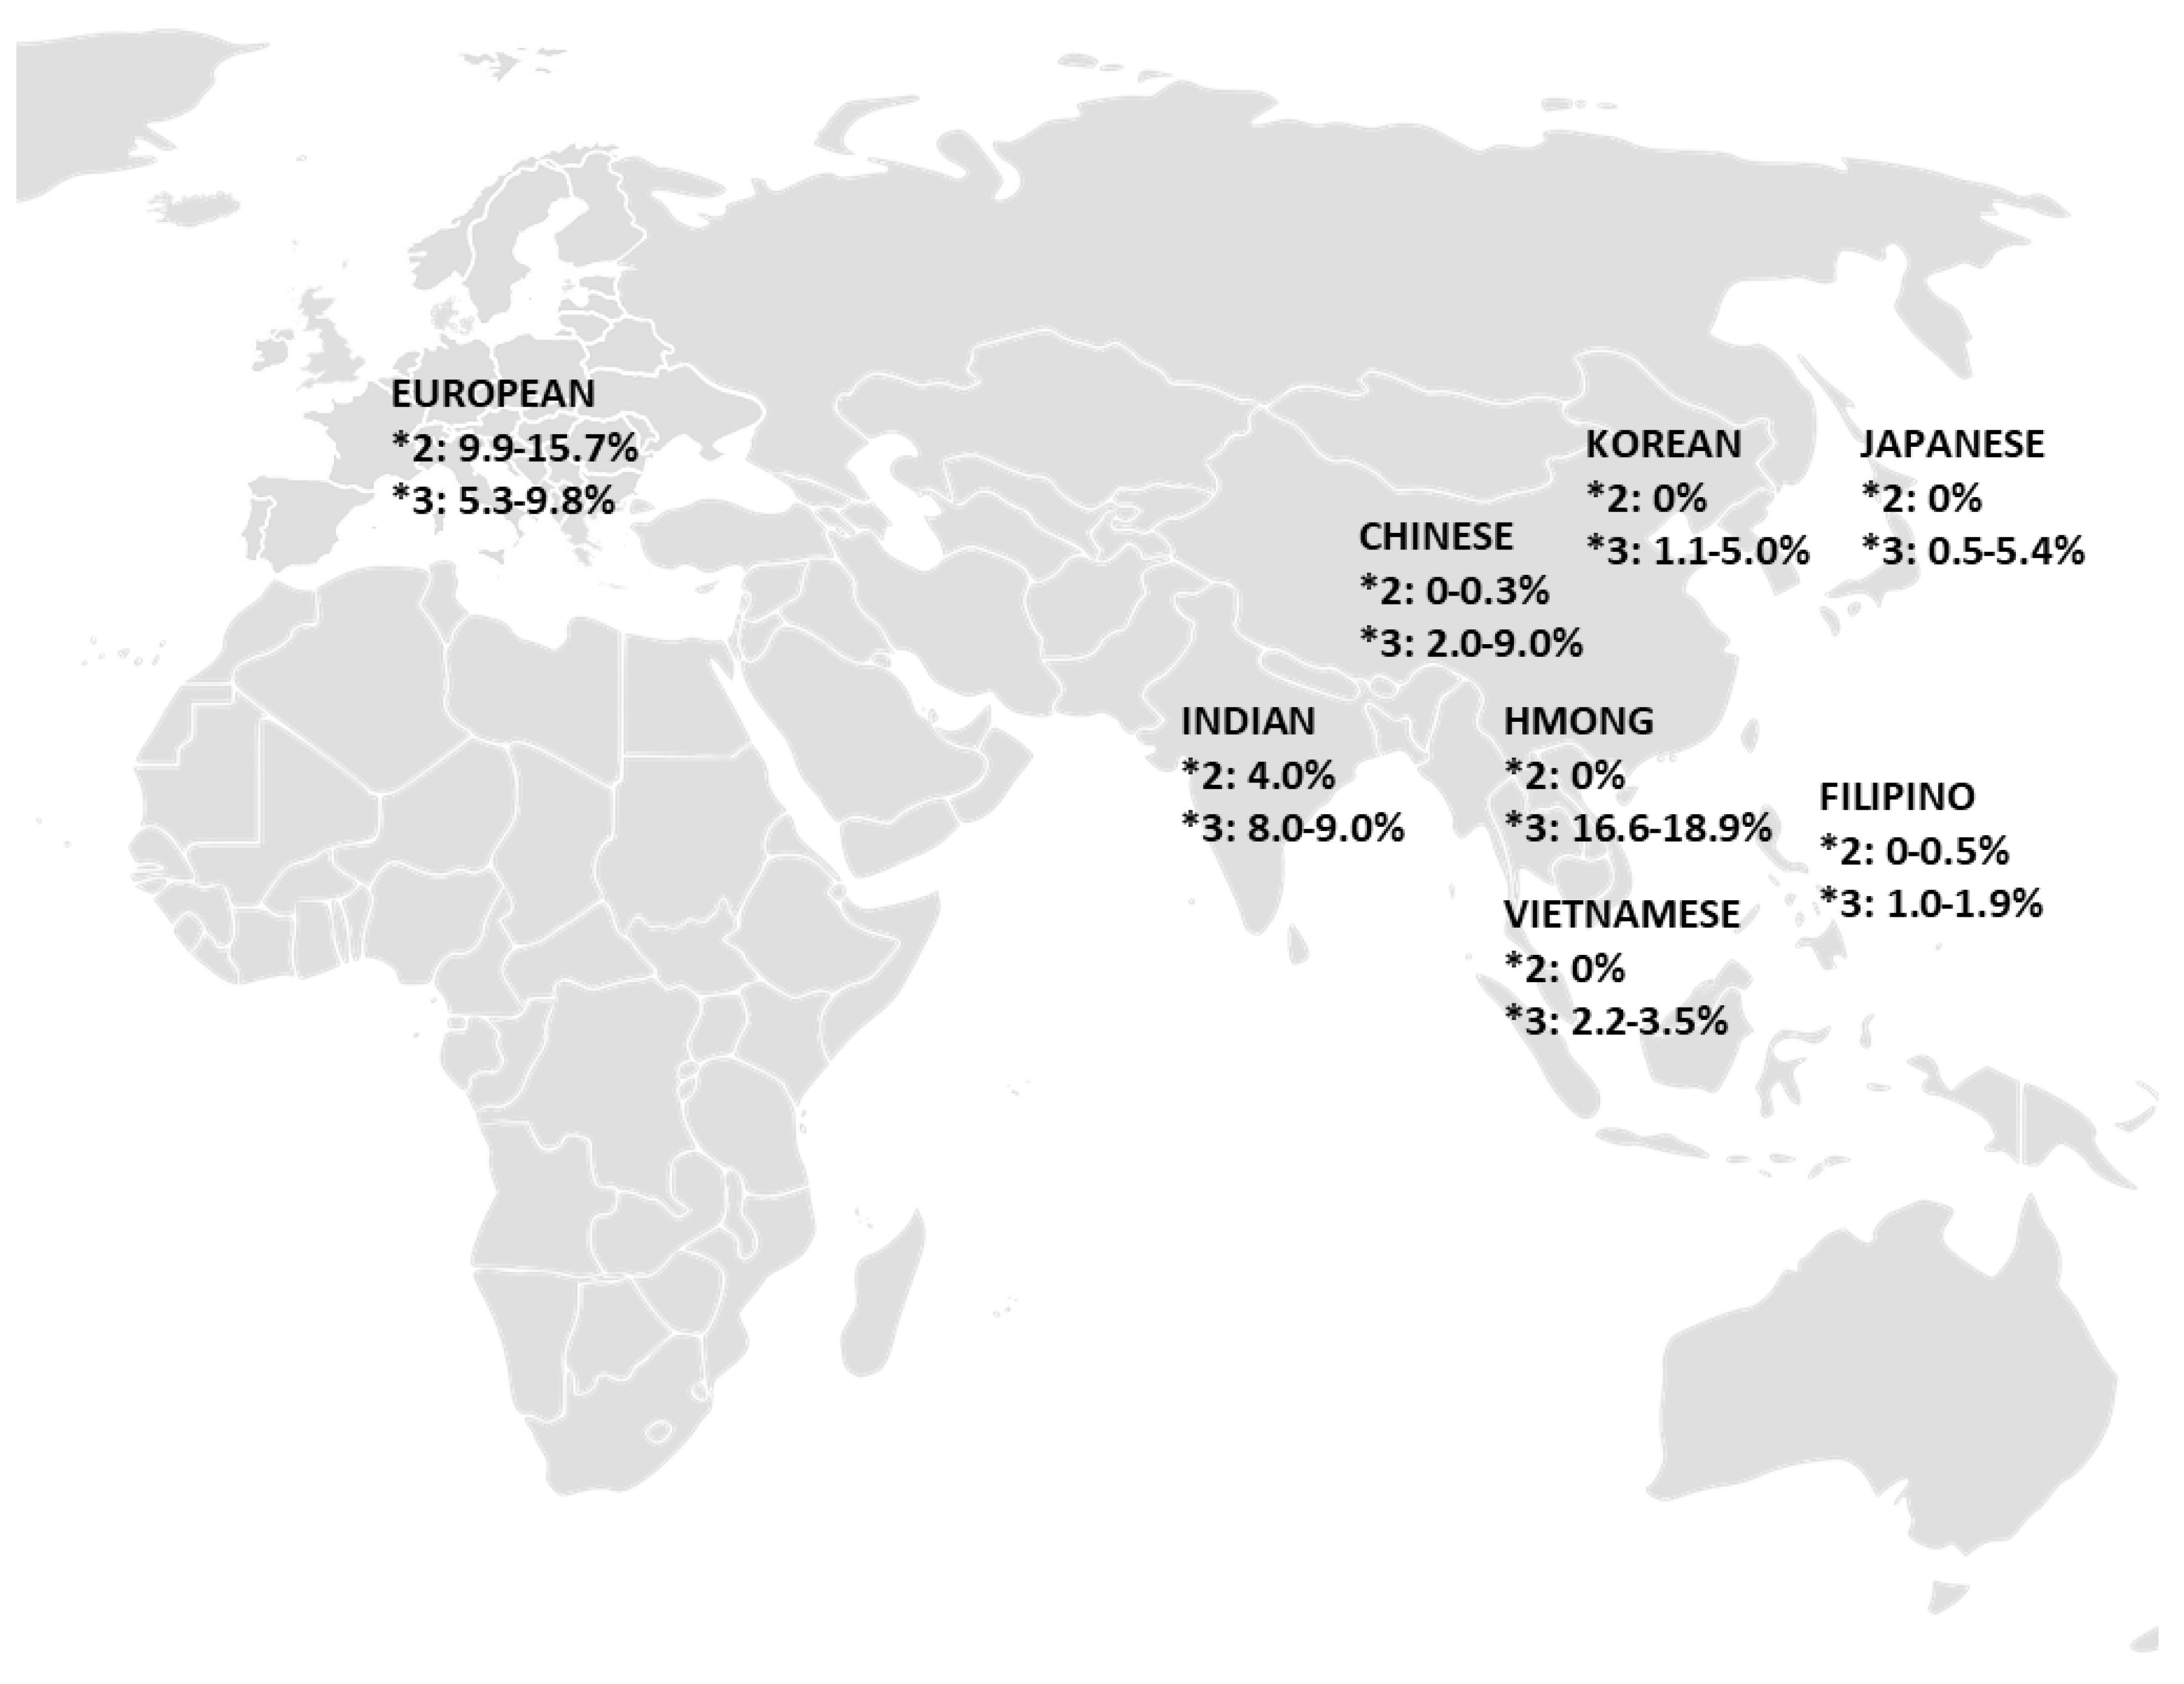
Figure 3.
CYP2C19*2, *3, and *17 allele frequency in European and Asian population subgroups.
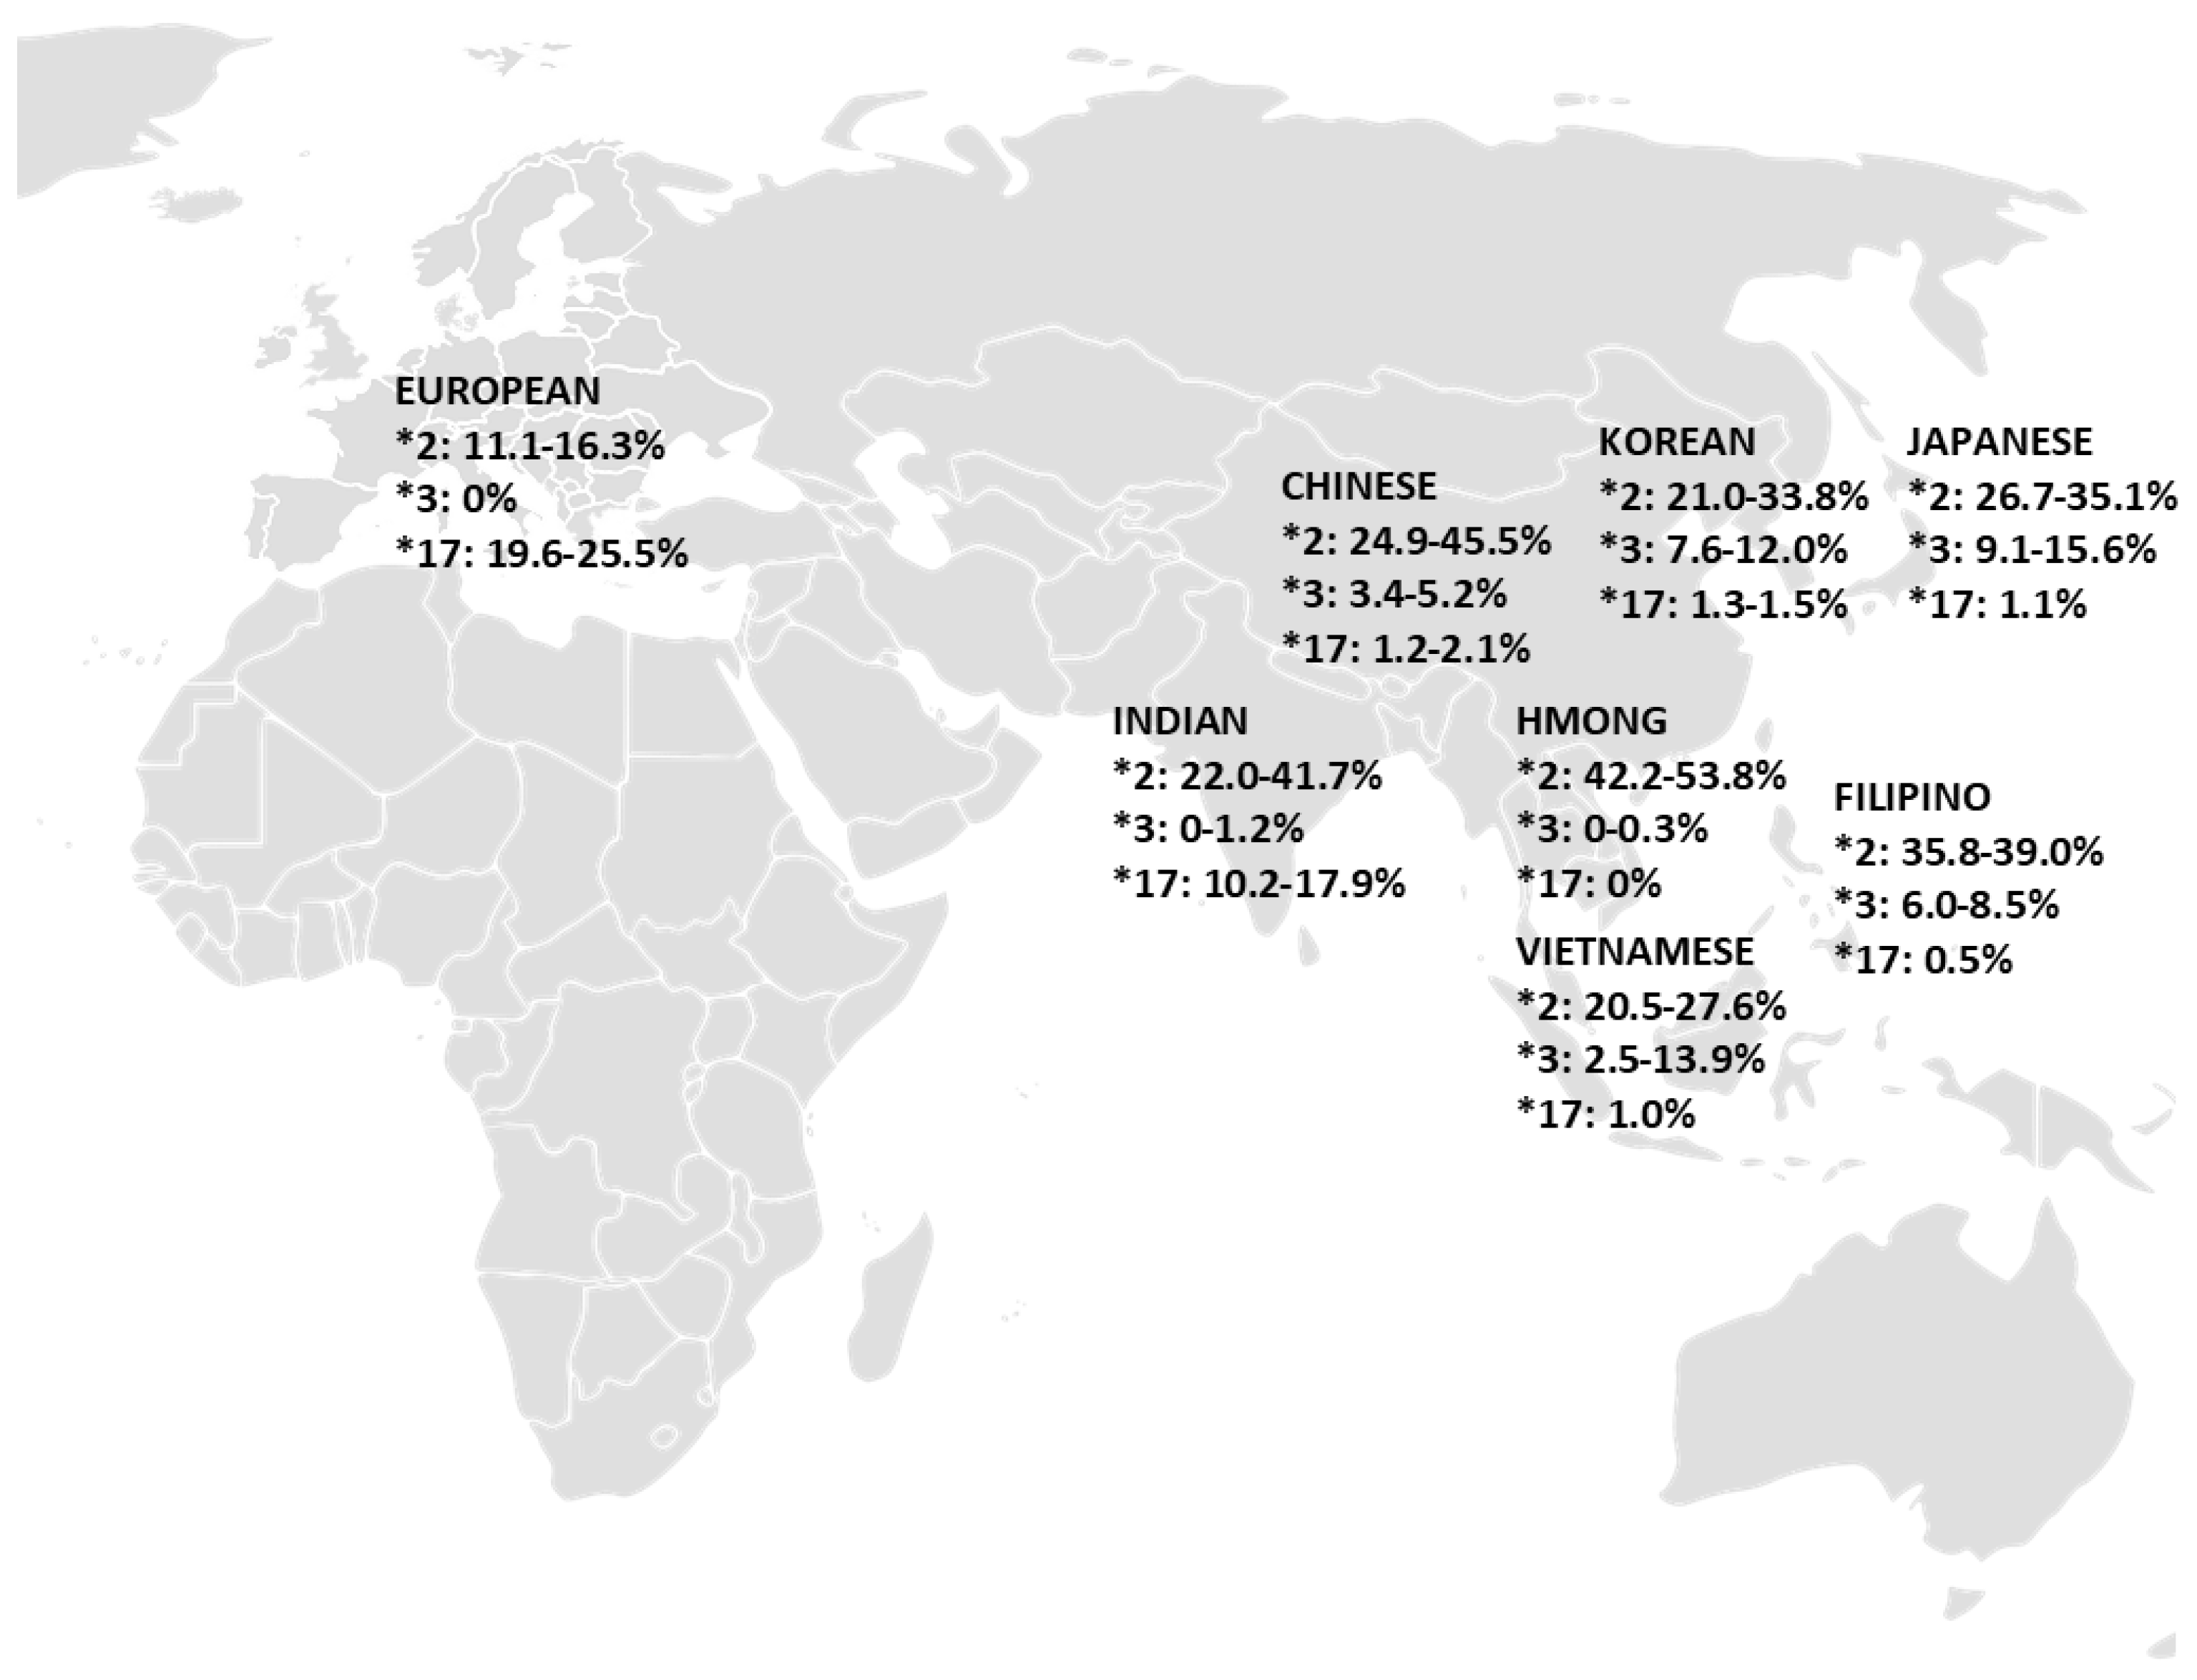

Table 1.
Drug label annotations for select CYP2C9 substrates.
| Medication Name | Genes | PGX Level |
|---|---|---|
| Siponimod | CYP2C9 | Testing Required |
| Celecoxib | CYP2C9 | Actionable PGx |
| Dronabinol | CYP2C9 | Actionable PGx |
| Fosphenytoin | CYP2C9, HLA-B | Actionable PGx, Informative PGx |
| Glimepiride | CYP2C9 | Actionable PGx |
| Glyburide | CYP2C9 | Actionable PGx |
| Losartan | CYP2C9, CYP3A4 | Actionable PGx |
| Phenytoin | CYP2C9, HLA-B | Actionable PGx |
| Warfarin | CYP2C9, VKORC1 | Actionable PGx |
| Meloxicam | CYP2C9 | Informative PGx, Criteria Not Met |
| Prasugrel | CYP2B6, CYP2C9, CYP2C19, CYP3A5 | Informative PGx, No Clinical PGx |
Table 2.
Drug label annotations for CYP2C19 substrates.
| Medication Name | Genes | PGX Level |
|---|---|---|
| Mavacamten | CYP2C19 | Testing Required, Informative PGx |
| Amitriptyline | CYP2C19, CYP2D6 | Actionable PGx |
| Carisoprodol | CYP2C19 | Actionable PGx |
| Citalopram | CYP2C19 | Actionable PGx |
| Clobazam | CYP2C19 | Actionable PGx |
| Clopidogrel | CYP2C19 | Actionable PGx, Informative PGx |
| Escitalopram | CYP2C19 | Actionable PGx, Informative PGx |
| Lansoprazole | CYP2C19 | Actionable PGx |
| Pantoprazole | CYP2C19 | Actionable PGx, Informative PGx |
| Voriconazole | CYP2C19 | Actionable PGx, Informative PGx |
| Diazepam | CYP2C19, CYP3A4 | Informative PGx |
| Omeprazole | CYP2C19 | Informative PGx, No Clinical PGx |
| Phenytoin | CYP2C19 | Informative PGx |
| Prasugrel | CYP2B6, CYP2C9, CYP2C19, CYP3A5 | Informative PGx, No Clinical PGx |
| Ticagrelor | CYP2C19 | Informative PGx, No Clinical PGx |
| Esomeprazole | CYP2C19 | No Clinical PGx |
| Drospirenone, ethinyl estradiol | CYP2C19 | No Clinical PGx |
| Lacosamide | CYP2C19 | No Clinical PGx |
Table 3.
CYP2C9 allele frequencies in major populations and distinct subgroups.
| Population | CYP2C9 Allele Frequency (%) | References | ||||
|---|---|---|---|---|---|---|
| 2C9*2 | 2C9*3 | 2C9*5 | 2C9*8 | 2C9*11 | ||
| Overall European (Range) | 9.9 – 15.7 | 5.3 – 9.8 | ||||
|
14.7 | 7.6 | [19] | |||
|
12.1 | 5.3 | [20] | |||
|
9.9 | 6.5 | [20] | |||
|
11.3 | 9.3 | [21] | |||
|
11.7 | 8.1 | [22] | |||
|
15.6 | 9.8 | [23] | |||
|
15.7 | 7.8 | [24] | |||
| Overall Asian (Range) | 0 – 4.0 | 0.5 – 18.9 | 0 | 1.8 | 0 – 0.05 | |
|
0 – 0.3 | 2.0 – 9.0 | 0 | 1.8 | 0.05 | [25] |
|
0 – 0.5 | 1.0 – 1.9 | [11,26] | |||
|
0 | 16.6 – 18.9 | [27,28] | |||
|
4.0 | 8.0 – 9.0 | [29,30] | |||
|
0 | 0.5 – 5.4 | 0 | [11,25,29,31,32] | ||
|
0 | 1.1 – 5.0 | 0 | 0 | [11,25,29,31] | |
|
0 | 2.2 – 3.5 | [25,33] | |||
Table 4.
CYP2C19 allele frequencies in major populations and distinct subgroups.
| Population | CYP2C19 Allele Frequency (%) | References | ||
|---|---|---|---|---|
| 2C19*2 | 2C19*3 | 2C19*17 | ||
| Overall European (Range) | 11.1 – 16.3 | 0 | 19.6 – 25.5 | |
|
0 | 23.9 | [19] | |
|
15.0 | 20.1 | [20] | |
|
15.2 | 0 | 25.5 | [34] |
|
13.1 | 0 | 19.6 | [35] |
|
11.1 | 0 | [36] | |
|
15.2 | 22.0 | [20] | |
|
16.3 | 22.2 | [22] | |
| Overall Asian (Range) | 20.5 – 53.8 | 0 – 15.6 | 0 – 17.9 | |
|
24.9 – 45.5 | 3.4 – 5.2 | 1.2 – 2.1 | [25,37,38,39,40] |
|
35.8 – 39.0 | 6.0 – 8.5 | 0.5 | [12,41] |
|
42.2 – 53.8 | 0 – 0.3 | 0 | [28] |
|
22.0 – 41.7 | 0 – 1.2 | 10.2 – 17.9 | [30,42,43,44,45] |
|
26.7 – 35.1 | 9.1 – 15.6 | 1.1 | [12,25,40,46,47] |
|
21.0 – 33.8 | 7.6 – 12.0 | 1.3 – 1.5 | [12,25,48,49,50] |
|
20.5 – 27.6 | 2.5 – 13.9 | 1.0 | [25,33,40,48] |
Disclaimer/Publisher’s Note: The statements, opinions and data contained in all publications are solely those of the individual author(s) and contributor(s) and not of MDPI and/or the editor(s). MDPI and/or the editor(s) disclaim responsibility for any injury to people or property resulting from any ideas, methods, instructions or products referred to in the content. |
© 2025 by the authors. Licensee MDPI, Basel, Switzerland. This article is an open access article distributed under the terms and conditions of the Creative Commons Attribution (CC BY) license (http://creativecommons.org/licenses/by/4.0/).
Copyright: This open access article is published under a Creative Commons CC BY 4.0 license, which permit the free download, distribution, and reuse, provided that the author and preprint are cited in any reuse.


