
Submitted:
27 May 2025
Posted:
29 May 2025
You are already at the latest version
Abstract
Ribosome is the macromolecular machine that regenerates cells, and support life through continuous protein synthesis. It is an adaptable machine able to synthesize proteins at different speed and production volume depending on the strength of the ribosome binding site. This work set out to use statistical and correlative analysis to decipher statisticalrelationships amongstribosomal proteins of different size, molecular weight, and expression level. Results from histogram analysis reveal that smaller ribosomal proteins of lower molecular weight are in larger abundance. In addition, correlative analysis reveals a positive correlation between expression level and molecular weight of ribosomal protein, indicating that smaller ribosomal proteins are at higher expression level. At the subunit level, calculation of energy cost from the multiplication of ribosomal protein molecular weight and expression level reveals further surprises that the large subunit is less energetically costly to build than the small subunit. In addition, the ribosomal proteins in the large subunit are smaller and of lower energetic cost. Taking in view that the sedimentation coefficient of the large subunit is 50S, and that of the small subunit is 30S, data in this work reveals that there may be additional, as‐ yet not characterized structural or biocatalytic proteins located in E. coli large ribosome subunit.
Keywords:
Escherichia coli
; ribosome
; ribosomal proteins
; sedimentation coefficient
; molecular weight
; protein length
; expression level
Introduction
Ribosomes are the key macromolecular complex that play a significant role in controlling cellular growth rate through its modulating effects on protein translation. Given the limited half-life of different proteins in the bacterial cells, and the need for protein regeneration, ribosome translational speed is critical for synthesizing necessary proteins to enable various cellular functions such as cell motility and maintenance of cellular homeostasis. The enabling factor at work here is the structural and functional correlate of ribosomes.
At the molecular level, the ribosome comprises the large and small subunit, each with its assortment of ribosomal proteins that play both structural and postulated catalytic roles in protein synthesis. Although we have a 3D structural model of ribosomes from different species, both prokaryotic and eukaryotic, much remains unknown about such cryo-electron microscopy and X-ray diffraction models [1,2,3,4].
However, modern whole-genome DNA sequencing has uncovered much of the protein repertoire of ribosomes, especially those of prokaryotic species. Through such sequencing studies, the biochemical and genomic repertoire of ribosomes are catalogued, and offers a data rich environment for detailed system biological understanding of how different ribosomal proteins enacted differentiated functions at the whole macromolecular complex level.
This works aims to use the statistical and correlative approach to extract useful information of ribosome structure and underlying functional underpinnings through detailed analysis of the protein length, molecular weight distribution, and expression level of each ribosomal protein in the large and small ribosome subunit.
Data reveals that small ribosomal protein and low molecular weight proteins still dominate the ribosomal protein ensemble, indicative that small ribosomal proteins may be useful for providing structural support in the inner cavity of the ribosomal macromolecular complex. In addition, correlative analysis of the expression level and molecular weight of all ribosomal proteins in Escherichia coli reveals a good linear positive correlation between expression level and molecular weight. Such a correlation suggests that smaller ribosomal proteins have smaller molecular weight. One explanation for this correlation could be larger ribosomal proteins pack more functions which are needed by the cells. Hence, there may be an evolutionary built in positive feedback loop in the synthesis of larger ribosomal proteins through a stronger promoter for the respective ribosomal protein genes. And, this positive feedback mechanism may be a reason for the fast growth rate and quick response of E. coli to changes in environmental and nutritional conditions. Finally, such a positive feedback mechanism in ribosomal protein allocation may be transferred to other bacterial species through horizontal gene transfer.
Materials and Methods
The dataset for Escherichia coli ribosomal proteins was downloaded from URL: https://ngwenfa.wordpress.com/ribosomal-protein-database/ and the RNA-seq gene expression analysis of Escherichia coli was downloaded from URL: https://ngwenfa.wordpress.com/gene-expression-database/)
Data analysis was conducted by an in-house MATLAB programme that helps to compile the expression level of ribosomal protein genes in E. coli as measured by RNA-seq. Different statistical analysis and correlative analysis tools such as histogram analysis and X-Y scatter plot correlative analysis were applied to analyse the data to extract biologically meaningful information.
Results and Discussion
Figure 1 shows the utility of applying histogram analysis to characterise the molecular weight distribution and protein length of ribosomal proteins in E. coli. Specifically, panel A reveals that lower molecular weight ribosomal proteins dominate the ensemble of ribosomal proteins in E. coli. And, this observation is further supported by the histogram in panel B showing that short protein length ribosomal proteins are dominant. Overall, the histogram analysis shows that a significant fraction of ribosomal proteins are small proteins of size around 100 amino acid residues.
Figure 2 shows that histogram analysis reveals that a significant fraction of ribosomal proteins in E. coli have low expression level of about 1000 units. When subjected to X-Y scatter correlative analysis, the expression level of ribosomal proteins shows a positive linear correlation with molecular weight. Integrating the results from the two plots reveal that small ribosomal proteins are expressed at a lower extent compared to large ribosomal proteins. Given that large ribosomal proteins could play more structural and biocatalytic functions, the data suggests that there may be a built-in positive feedback mechanism that amplifies the synthesis of large ribosomal proteins. This attribute could help E. coli grow faster, and respond faster to changes in nutritional and environmental challenges. Possibly, such a positive feedback mechanism could be encoded by a strong promoter for larger ribosomal protein genes. Finally, such a positive feedback mechanism in ribosomal protein synthesis could have been transferred to other fast-growing microbes through horizontal gene transfer in the environment.
Finally, the energy cost and average protein length of ribosomal proteins in the large and small ribosome subunits of E. coli were compared in Table 1. Energy cost here reveals to, in arbitrary units, the energy needed to build the ensemble of ribosomal proteins in the large ribosomal subunit and small ribosomal subunit is determined by multiplying the molecular weight of the ribosomal protein with its expression level as determined by RNA-seq experiment. From the data, it is surprising to find the energy cost of building the ribosomal protein fraction of the large subunit is smaller than that of the small ribosomal subunit. This implies that there are likely additional proteins located in the large ribosomal subunit to account for its larger sedimentation coefficient of 50S compared to the 30S sedimentation coefficient of the small ribosomal subunit.
At the per ribosomal protein level, it is also noted that the average energy cost of ribosomal proteins in the large subunit is smaller than that of the small subunit, indicating that a larger fraction of small ribosomal proteins is located in the large ribosomal subunit. In addition, the average protein length in the large subunit is 130 against the 149 in the small ribosome subunit, which again corroborates that a large fraction of smaller ribosomal protein is in the large ribosomal subunit.
Conclusions
Although we have a good structural model of ribosome from cryo-electron microscopy imaging and X-ray diffraction, many facets of its internal structure, protein composition, and overall structure-function correlate of ribosome remains enigmatic. This work started out with a simple quest to use statistical and correlative analysis to determine the distribution of molecular weight and expression count across the different ribosomal proteins in the large and small ribosome subunits. But, such statistical and correlative tools surprising reveal hitherto unknown facets of ribosome biology.
Specifically, small ribosomal proteins with lower molecular weight dominate the ribosomal protein ensemble. More importantly, such smaller ribosomal proteins are distributed more in the large ribosome subunit compared to the small ribosome subunit. In terms of expression level and its relationship with ribosomal protein molecular weight, this work found a positive linear correlation between expression level and ribosomal protein molecular weight for E. coli. Such a finding suggests that large molecular weight ribosomal proteins are expressed more. Evolutionarily, this is a positive feedback mechanism that engenders more protein production in times of replete nutrients or when there is a need to quickly adapt to changing environmental and nutritional conditions. In addition, this positive feedback mechanism also explains the fast growth rate of E. coli (maximal cell doubling time of 20 mins), and is a trait that can be transferred by horizontal gene transfer.
Comparing the protein composition and energy cost of building the large and small ribosomal subunits reveal a surprising finding that it is more energetically costly to build the small ribosome subunit. This could be due to the presence of more and larger ribosomal protein in the small subunit, which incurs larger building cost. Such conclusion is supported by the longer protein length of ribosomal protein in the small subunit, and their larger average energetic cost per ribosomal protein.
Funding
No funding was used in this work.
Conflicts of Interest
The author declares no conflicts of interest.
References
- Fromm, S. A. et al. The translating bacterial ribosome at 1.55 Å resolution generated by cryo-EM imaging services. Nat. Commun. 14, 1095 (2023). [CrossRef]
- Erdmann, P. S. et al. In situ cryo-electron tomography reveals gradient organization of ribosome biogenesis in intact nucleoli. Nat. Commun. 12, 5364 (2021). [CrossRef]
- Yusupova, G. & Yusupov, M. Ribosome biochemistry in crystal structure determination. RNA 21, 771–773 (2015).
- Rozov, A. et al. Importance of potassium ions for ribosome structure and function revealed by long-wavelength X-ray diffraction. Nat. Commun. 10, 2519 (2019).
Figure 1.
Using histogram analysis to understand the molecular weight distribution of ribosomal proteins in E. coli (A), and the protein length distribution of ribosomal proteins in the bacterium (B).
Figure 1.
Using histogram analysis to understand the molecular weight distribution of ribosomal proteins in E. coli (A), and the protein length distribution of ribosomal proteins in the bacterium (B).
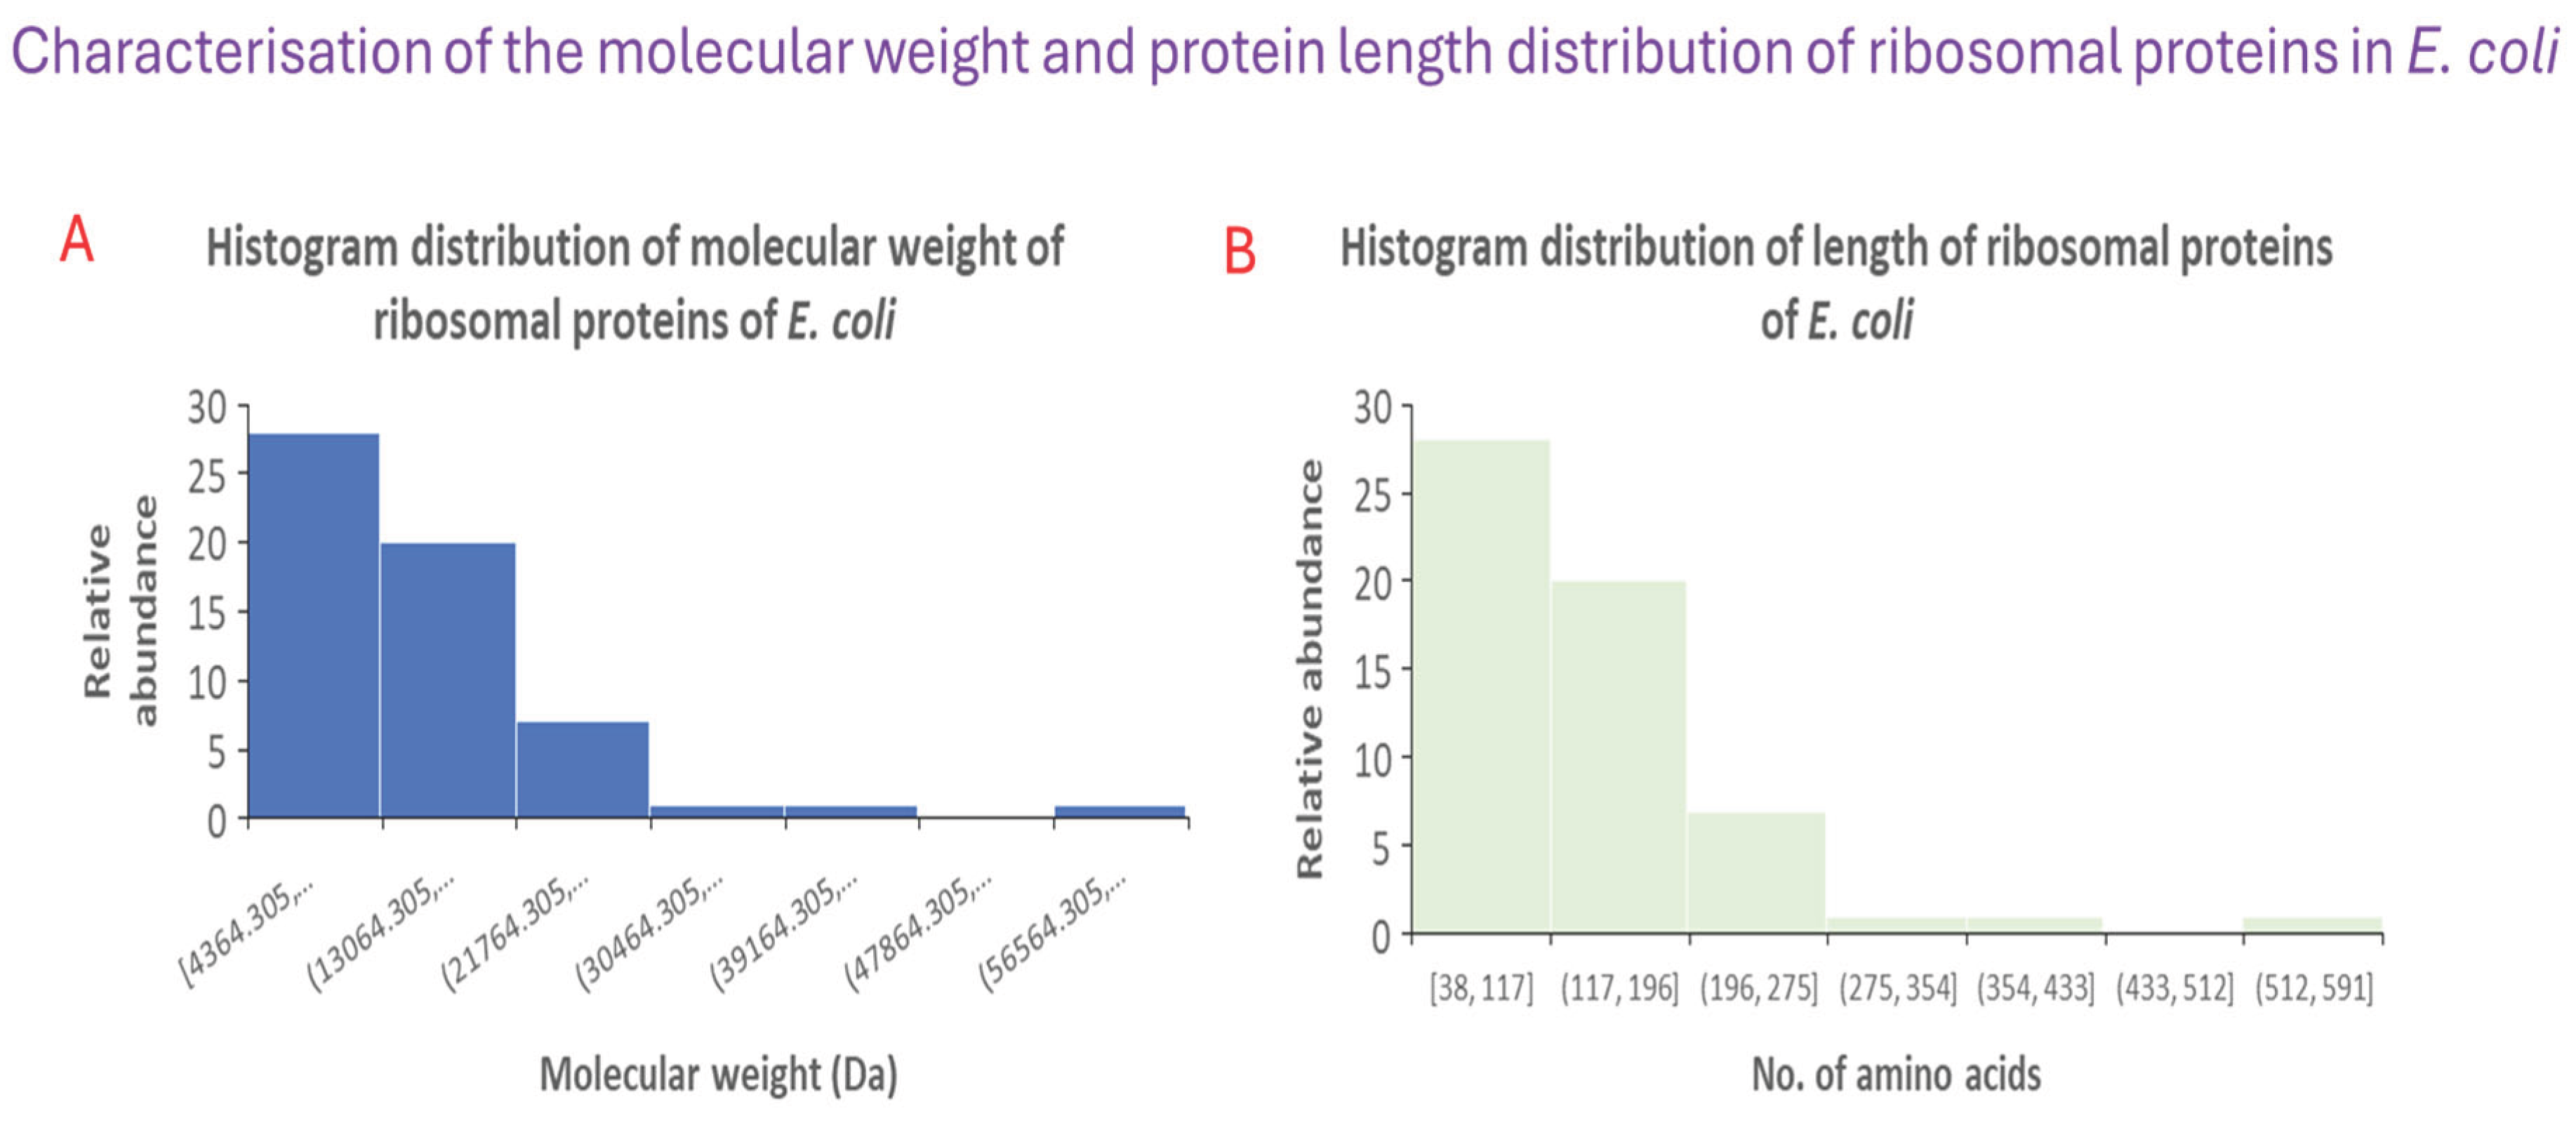
Figure 2.
Application of histogram and X-Y scatter correlative analysis reveals that most ribosomal proteins in E. coli have low expression level (A), and there is a positive linear correlation between expression level and molecular weight of ribosomal proteins in E. coli.
Figure 2.
Application of histogram and X-Y scatter correlative analysis reveals that most ribosomal proteins in E. coli have low expression level (A), and there is a positive linear correlation between expression level and molecular weight of ribosomal proteins in E. coli.
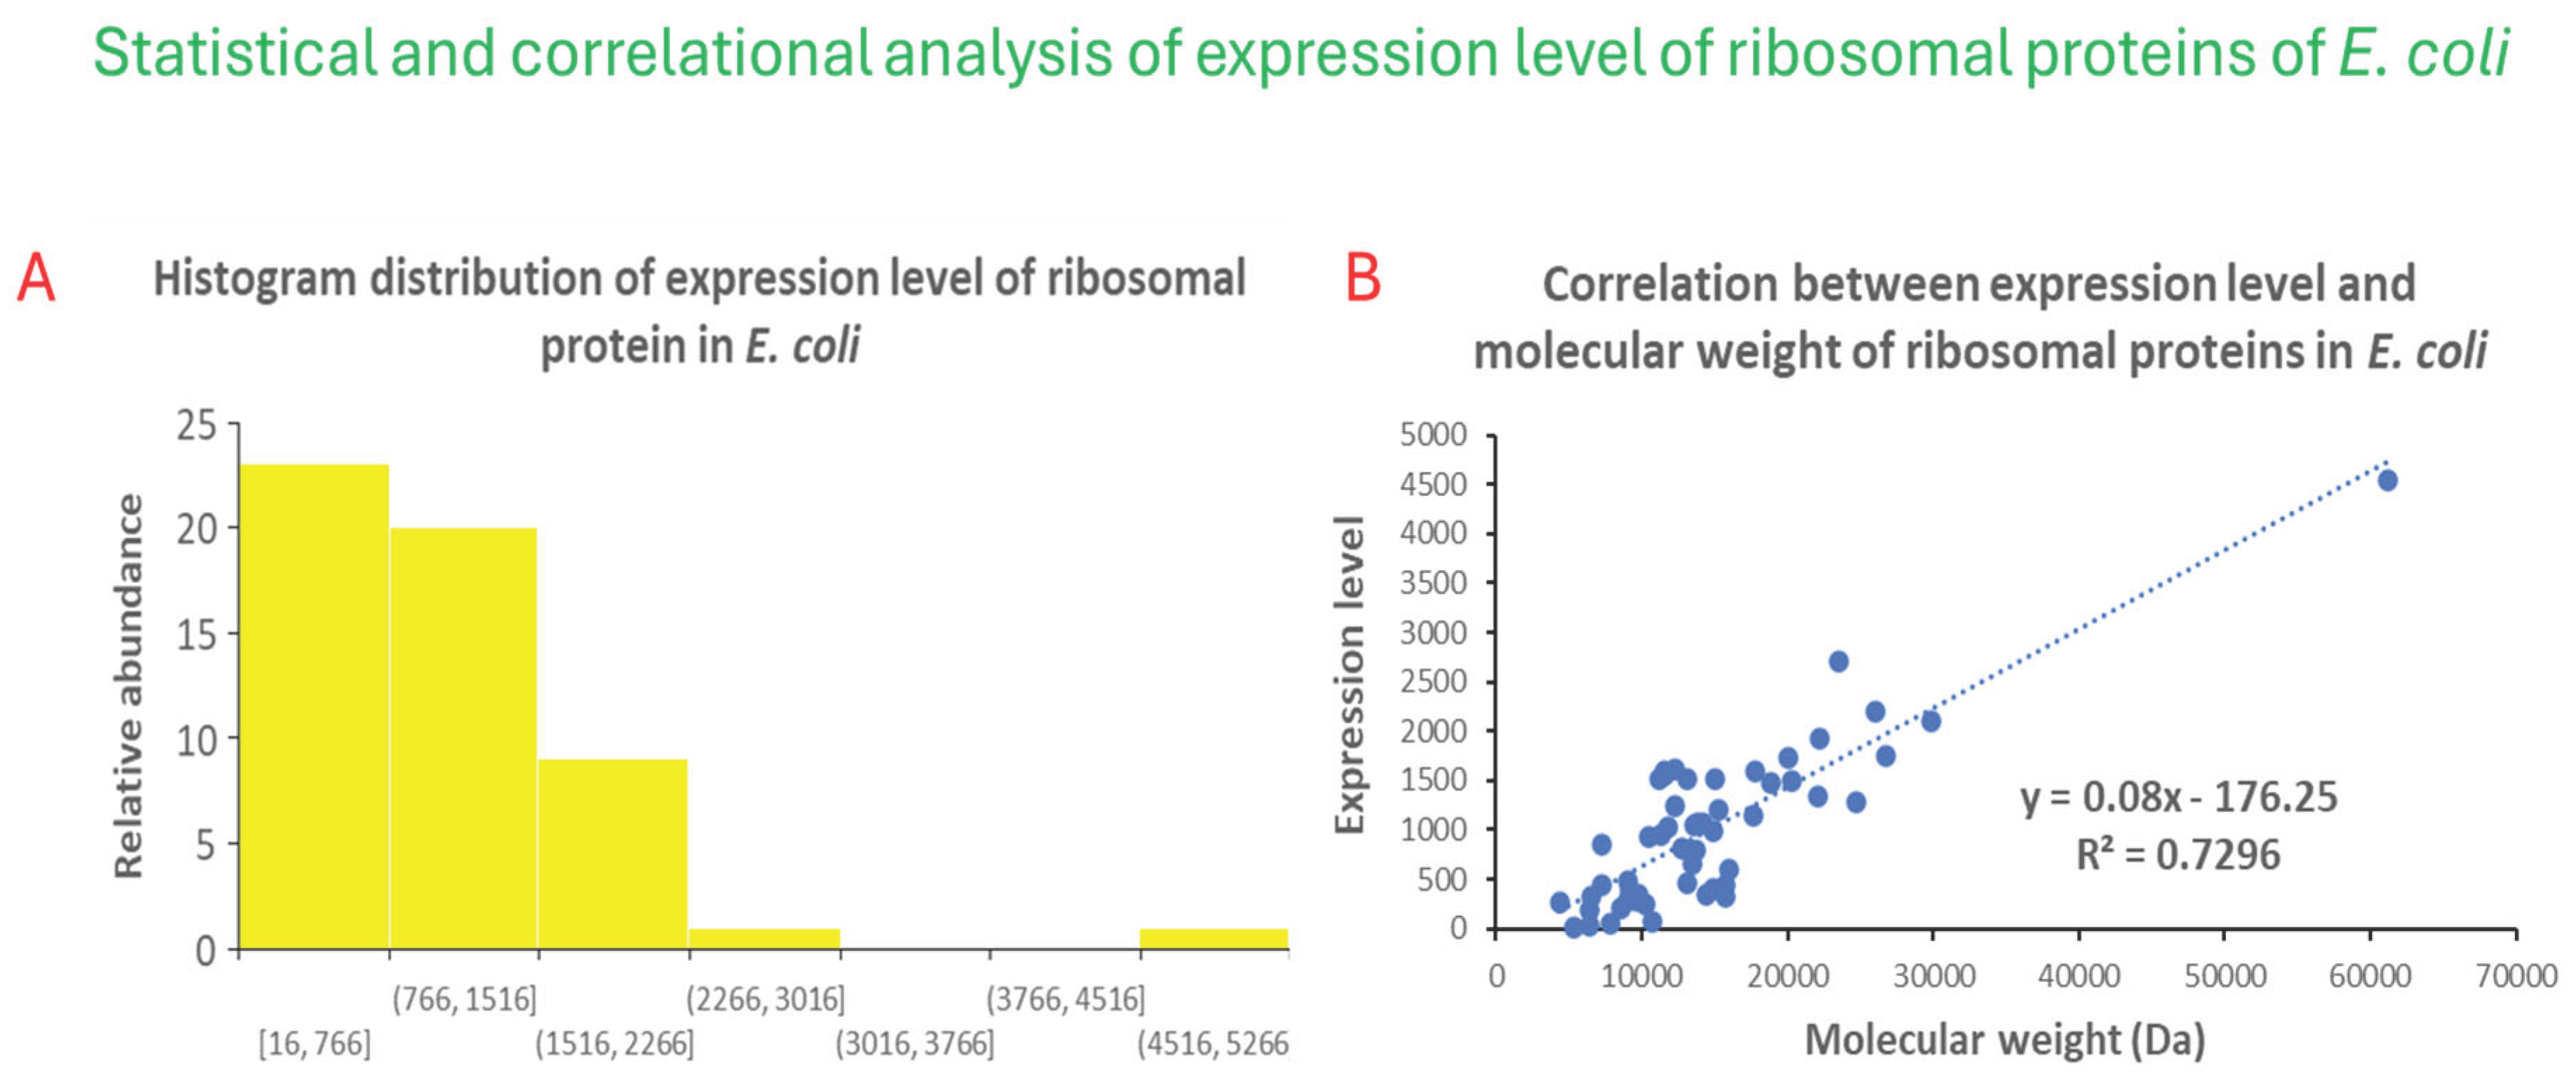

Table 1.
Comparing the energy cost and average protein length of ribosomal proteins in the large and small ribosome subunit.
Table 1.
Comparing the energy cost and average protein length of ribosomal proteins in the large and small ribosome subunit.
| Parameters | Large ribosome subunit | Small ribosome subunit |
|---|---|---|
| Energy cost (arbitrary units) | 4.72E+08 | 6.28E+08 |
| Average energy cost | 1.43E+07 | 2.99E+07 |
| Averge protein length | 130 | 149 |
Disclaimer/Publisher’s Note: The statements, opinions and data contained in all publications are solely those of the individual author(s) and contributor(s) and not of MDPI and/or the editor(s). MDPI and/or the editor(s) disclaim responsibility for any injury to people or property resulting from any ideas, methods, instructions or products referred to in the content. |
© 2025 by the authors. Licensee MDPI, Basel, Switzerland. This article is an open access article distributed under the terms and conditions of the Creative Commons Attribution (CC BY) license (http://creativecommons.org/licenses/by/4.0/).
Copyright: This open access article is published under a Creative Commons CC BY 4.0 license, which permit the free download, distribution, and reuse, provided that the author and preprint are cited in any reuse.


