
Submitted:
27 May 2025
Posted:
28 May 2025
You are already at the latest version
Preprints on COVID-19 and SARS-CoV-2
Abstract
This study identifies the risk determinants that affect the sustainability of rural bank in Indonesia after the Covid-19 pandemic. Explicitly forming a rural bank sustainability prediction model. Utilizing logistic regression analysis, the research identifies seven statistically significant variables influencing rural bank sustainability. The study introduces three models, with Model 3 demonstrating the highest accuracy in predicting rural bank sustainability, both in-sample and out-of-sample. Robustness tests further validate Model 3's reliability. The findings underscore the need for rural banks to enhance their business management strategies, particularly in areas of liquidity, loan growth, and business efficiency, to ensure long-term sustainability.
Keywords:
Sustainability
; Rural Banks
; Post-COVID-19
; Risk Management
1. Introduction
The sustainability of rural banks in Indonesia has faced significant challenges due to economic disruptions from the COVID-19 pandemic [1]. This research aims to pinpoint the essential risk factors affecting these banks' sustainability and to create a predictive model to assist in strategic decision-making [2]. The impact in Indonesia has been especially harsh in areas reliant on tourism and small-scale industries, leading to reduced incomes and economic activity. Rural banks, known as Bank Perekonomian Rakyat (BPRs), have traditionally been crucial in supporting micro, small, and medium enterprises (MSMEs), aiding in local economic development and job creation. However, the operations of these banks have been disrupted by the pandemic, endangering their sustainability due to increasing non-performing loans (NPLs), falling profitability, and structural issues such as insufficient capital and the necessity for digital transformation [4]. The increase in NPLs has adversely affected the performance of the entire financial sector and posed a threat to the stability of the financial system [5]. Research indicates that many borrowers, particularly MSMEs, have struggled to meet their financial obligations [6].
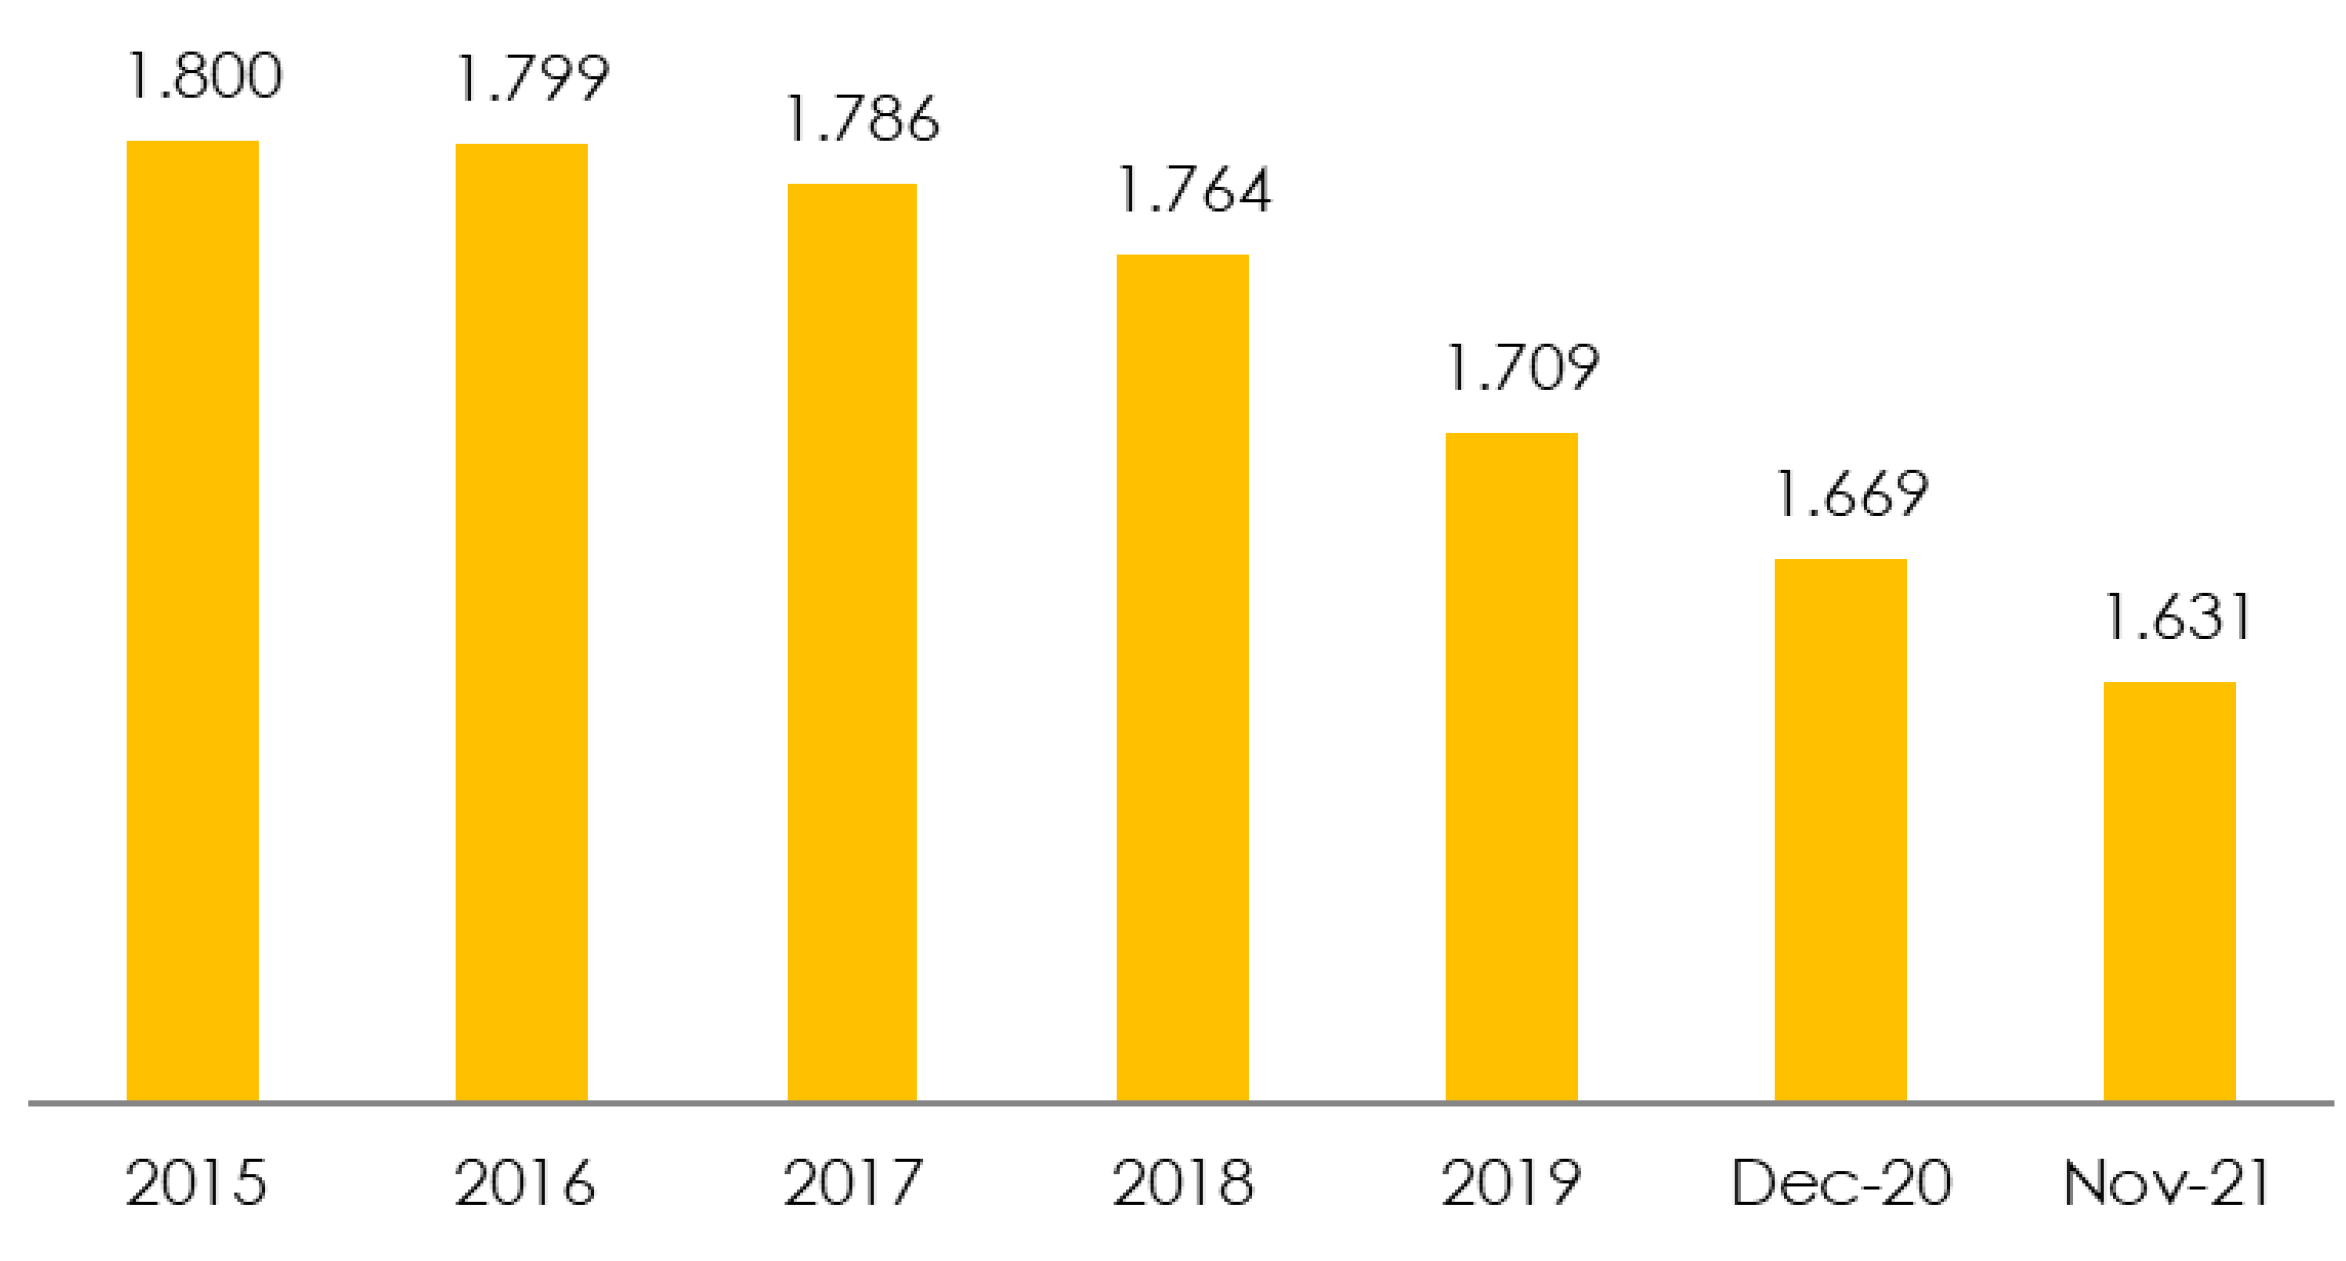
Given their critical role in supporting MSMEs and fostering local economic development, BPRs are seen as an essential part of Indonesia's microfinance ecosystem [7]. They offer financing, enhance business capabilities, and contribute to local employment [8]. Despite this, they continue to face structural challenges. From 2008 to 2018, over 90 BPRs were liquidated, and the number of operational institutions decreased from 1,800 in 2015 to 1,631 in 2021, as depicted in Graph 1.
Graph 1.
Number of BPR/BPRS from 2008 to 2021.
The pressing need to evaluate the sustainability of rural banks after the pandemic stems from their essential role in Indonesia's financial framework. Previous research underscores the need to pinpoint early warning signs of potential bank failures and to establish solid risk management strategies. This research seeks to address this need by creating a predictive model based on financial performance metrics to evaluate the viability and sustainability of rural banks in the post-pandemic period.
Rural banks operate as niche financial entities offering savings and loan services to microeconomic participants typically overlooked by conventional banks. Their endurance, especially during crises, is affected by various financial metrics such as capital adequacy, asset quality, profitability, and liquidity. The Capital Adequacy Ratio (CAR) acts as a safeguard against potential losses. A robust capital foundation lowers the risk of insolvency and enhances a bank's capacity to withstand economic shocks. Studies indicate that a higher CAR positively impacts bank sustainability. Operational Efficiency, frequently assessed by the ratio of Operating Expenses to Operating Income (BOPO), indicates how well a bank controls its costs. Operational inefficiencies often result in reduced profitability and increased susceptibility during economic downturns. Return on Assets (ROA) is a critical measure of performance, illustrating how effectively a bank utilizes its assets to produce profits. A diminished ROA can signal early issues related to operational and credit risks. The Loan to Deposit Ratio (LDR) reflects the liquidity risk to which a bank is exposed. A higher LDR might indicate more assertive lending practices, but it could also precipitate liquidity crises during financial turmoil.In line with these theoretical considerations, this study develops the following hypotheses:
H1: Capital Adequacy Ratio (CAR) has a significant positive effect on rural bank sustainability.
H2: Operational Efficiency (BOPO) has a significant negative effect on rural bank sustainability.
H3: Return on Assets (ROA) has a significant positive effect on rural bank sustainability.
H4: Loan to Deposit Ratio (LDR) has a significant positive effect on rural bank sustainability.
This research extends prior work by integrating multiple performance ratios into a unified predictive framework, applying robustness checks through in-sample and out-of-sample validation techniques.
2. Materials and Methods
This research employs a quantitative approach, specifically using logistic regression analysis, to assess the factors influencing the sustainability of rural banks in Indonesia post-COVID-19. Logistic regression was chosen due to the binary outcome of the dependent variable, distinguishing between sustainable and non-sustainable banks.
2.1. Data Collection and Sample Selection
The study used secondary data sourced from the audited financial statements of 203 rural banks (Bank Perkreditan Rakyat—BPR) throughout Indonesia. The data covers the years 2020 to 2022, reflecting the period of recovery after the COVID-19 crisis. The selection of these banks was based on the completeness and availability of their financial reports, as well as their presence in the health rating assessments by the Otoritas Jasa Keuangan (OJK).
2.2. Variables and Measurement
- Dependent Variable:
The sustainability status, which is binary. Banks labeled as ‘sustainable’ according to OJK health ratings received a code of 1, whereas those labeled as non-sustainable received a code of 0.
- Independent Variables:
Drawing on theoretical frameworks and regulatory standards, the study considered seven significant financial metrics:
- Capital Adequacy Ratio (CAR) – an indicator of capital robustness.
- Return on Assets (ROA) – a measure of profitability.
- Operational Efficiency Ratio (BOPO) – an indicator of cost efficiency.
- Loan to Deposit Ratio (LDR) – an indicator of liquidity risk.
- Loan Growth – reflects efforts in expanding credit.
- Liquidity (Current Ratio) – an indicator of short-term financial stability.
- Non-Performing Loans (NPL) – a measure of credit risk.
These metrics were chosen due to their established importance in previous studies (e.g., Athanasoglou et al., 2008; Endri et al., 2020) and their alignment with the OJK's criteria for financial health evaluation.
2.3. Model Specification and Estimation
Three logistic regression models were developed:
- Model 1: Focuses on primary performance indicators (CAR, ROA, LDR, BOPO).
- Model 2: Includes additional risk and liquidity metrics (NPL, CR, OBS).
- Model 3: Combines all variables to create a thorough predictive model.
2.4. Validation Strategy
The robustness and applicability of the models were tested by splitting the dataset into:
- In-sample data (2021–2022) used for model development.
- Out-of-sample data (2023) used for model testing.
The study used K-fold cross-validation and Hosmer–Lemeshow tests to confirm statistical reliability and assess model fit. The effectiveness of the models was measured using accuracy, specificity, sensitivity, McFadden R², AIC, SIC, and average error rates.
2.5. Ethical Considerations
This research did not involve human subjects or experimental manipulations. All data were anonymized and obtained from publicly available financial documents, adhering to the institution's data usage guidelines.
3. Results
This research utilizes a quantitative method with logistic regression to evaluate the factors influencing the sustainability of rural banks in Indonesia post-COVID-19. The dataset includes audited financial statements from rural banks in different regions spanning from 2020 to 2022. Seven independent variables were chosen based on existing literature and their regulatory significance: Capital Adequacy Ratio (CAR), Return on Assets (ROA), Operational Efficiency Ratio (BOPO), Loan to Deposit Ratio (LDR), Loan Growth, Liquidity, and Non-Performing Loan (NPL). The dependent variable is a binary classification of sustainability, where sustainable banks are coded as 1 and non-sustainable banks as 0, according to the health rating criteria set by the OJK (Indonesia Financial Services Authority).
For the development of the predictive model, we created three logistic regression models with various combinations of predictors. The performance of these models was assessed by their in-sample classification accuracy and their out-of-sample performance through cross-validation to determine their generalizability.
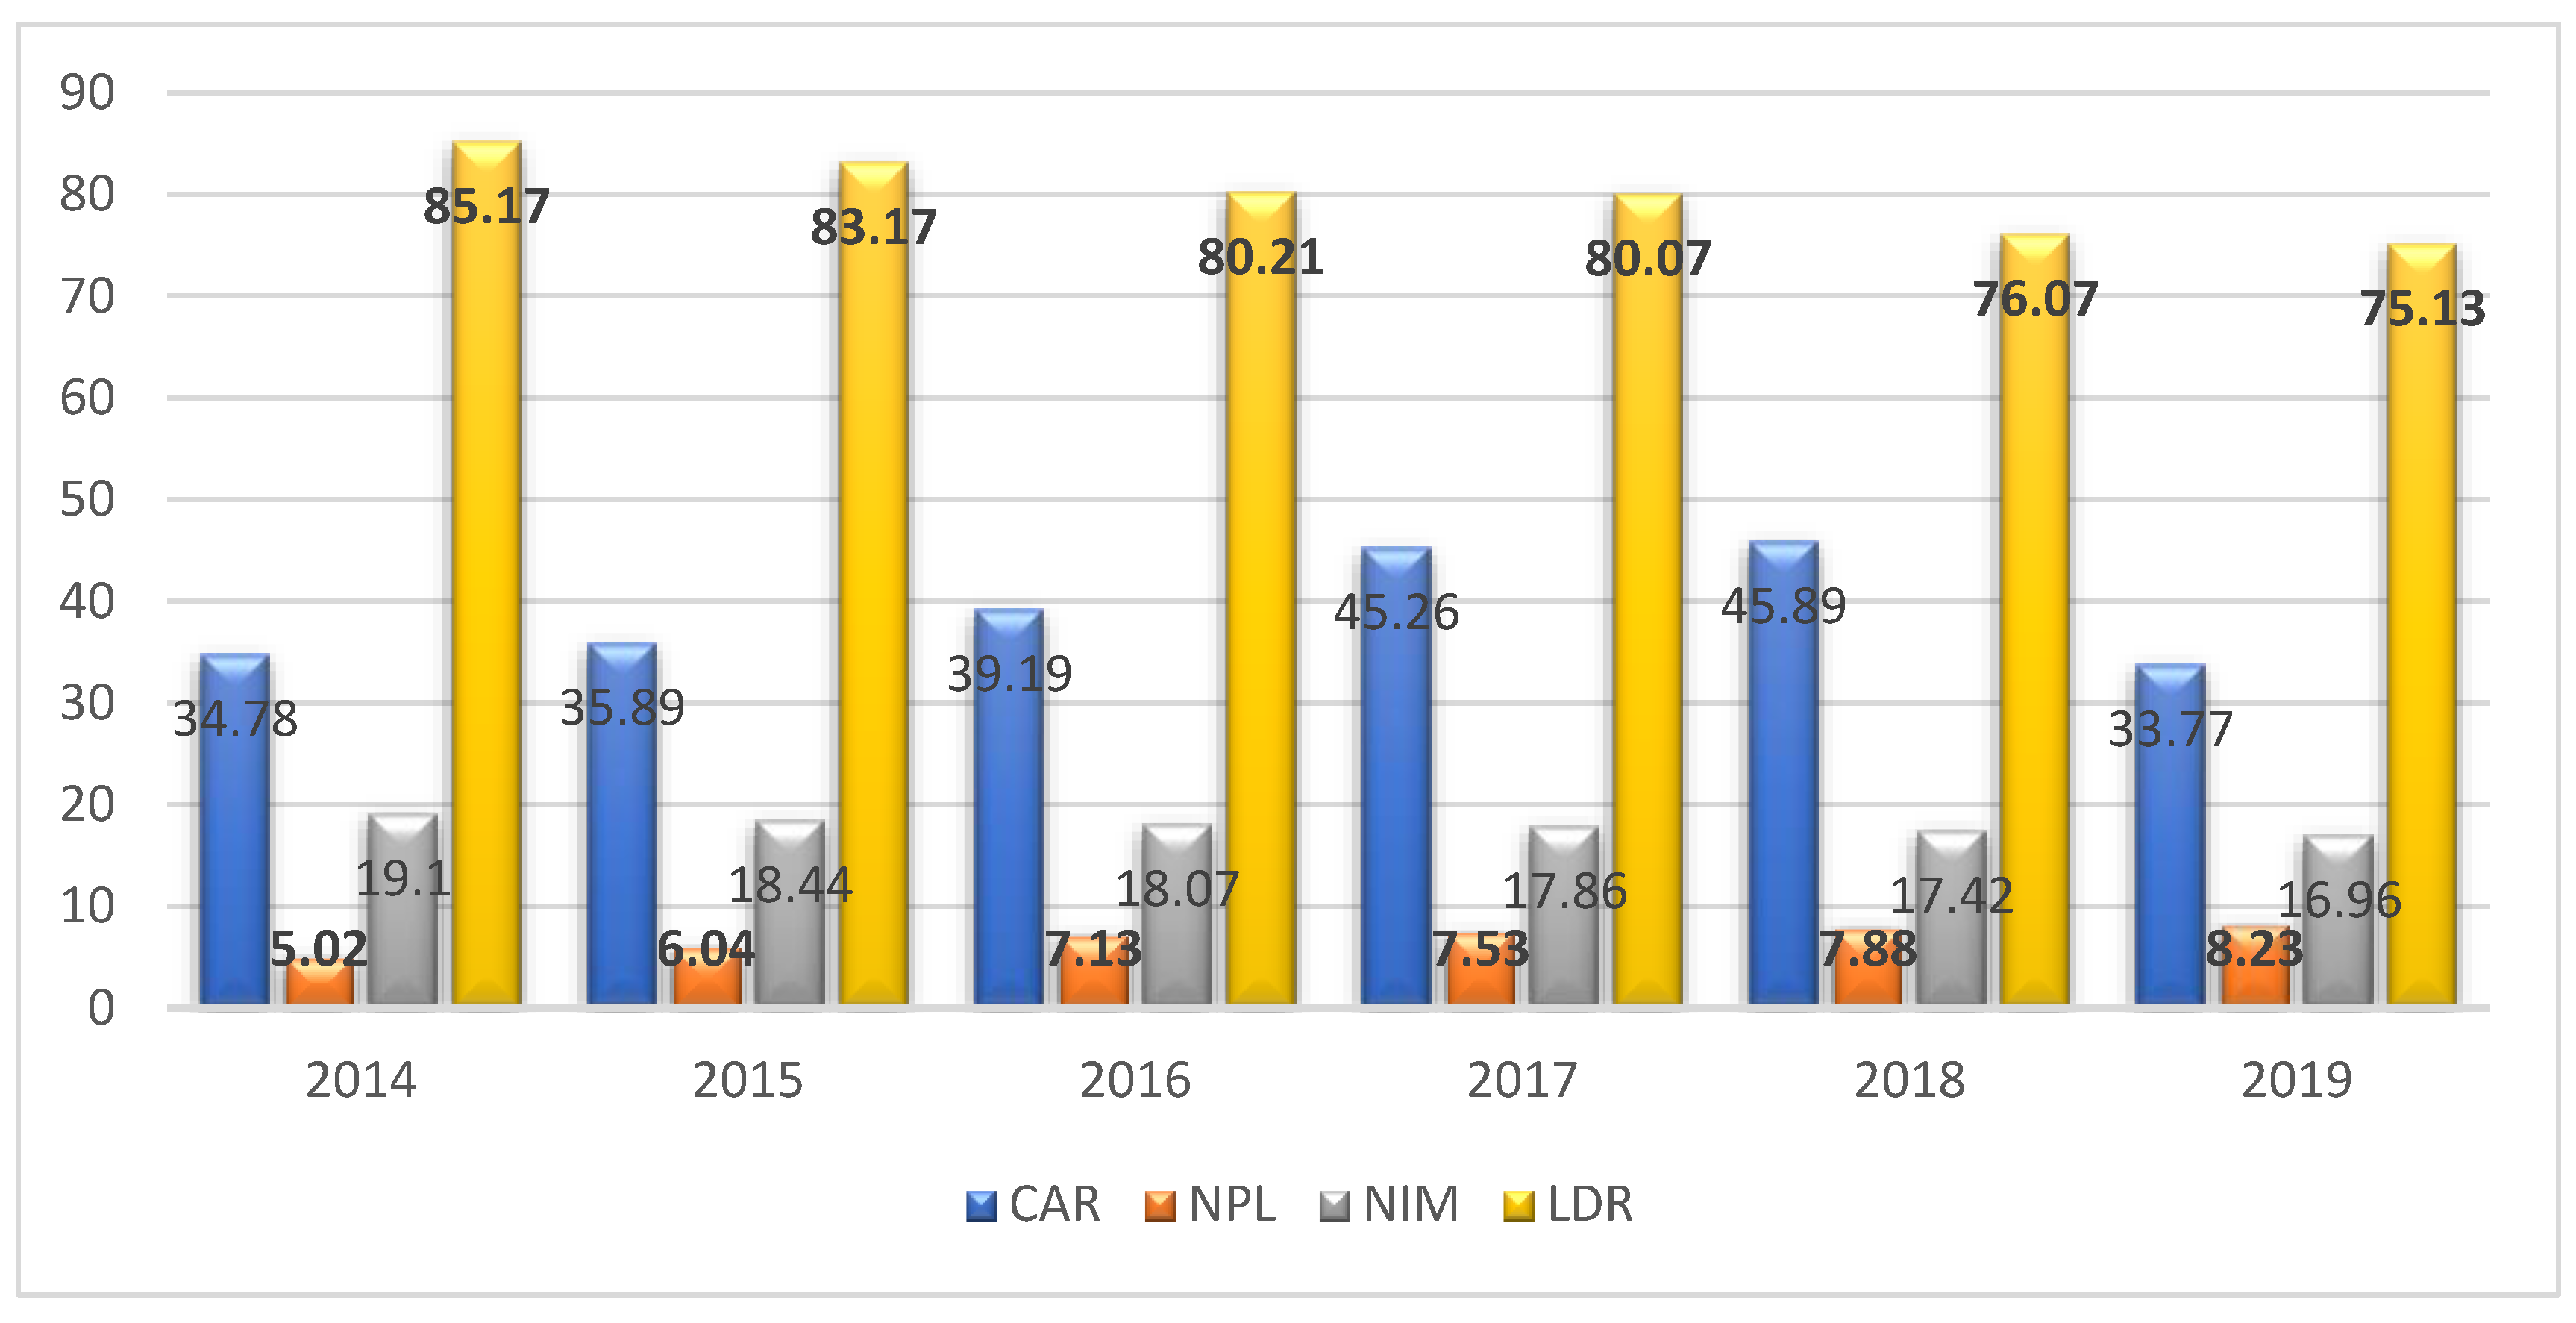
Graph 2.
Average Financial Ratio of Rural Bank under the Jakarta OJK office. 2014 to 2019 (Source: OJK, 2024).
Graph 2.
Average Financial Ratio of Rural Bank under the Jakarta OJK office. 2014 to 2019 (Source: OJK, 2024).
As indicated in Table 2, in the period following the global health crisis, rural banks typically satisfied the minimum capital adequacy standards mandated by financial regulators, with Capital Adequacy Ratios (CAR) surpassing 37.84%. These high CAR figures seem to offset the substandard credit quality, evidenced by Non-Performing Loans (NPLs) over 5%, and point to less than optimal operational efficiency. This situation indicates that asset management strategies are not effectively producing sufficient profits, thus heightening the risk of collapse and jeopardizing the banks' long-term viability.
The average Net Interest Margin (NIM) for both categories of rural banks remains elevated, above 14%, signaling a substantial interest rate differential. This phenomenon is frequently seen in rural banks, where high interest on loans is necessitated by increased funding expenses and operational inefficiencies. Such a setup undermines the banks' market competitiveness and attractiveness to clients, consequently impeding growth and expansion into new markets.
Operational efficiency, gauged by the ratio of operational costs to operational revenue (BOPO), falls between 77% and 88% for both categories. These numbers imply a reasonably efficient operation, particularly under the strenuous post-COVID-19 conditions. To uphold public trust, rural banks also maintain sufficient liquidity by keeping ample cash reserves. This is demonstrated by the average Current Ratio (CR), which is 23.49% for banks deemed non-sustainable and 25.63% for those considered sustainable. Both values greatly exceed the regulatory minimum of 6%, suggesting robust short-term liquidity. The high CR levels indicate that both groups can fulfill their short-term financial obligations with cash and equivalents, primarily due to cautious cash management and a low loan-to-deposit ratio.
Regarding intermediation performance in the post-COVID-19 era, both categories of rural banks show high liquidity risk, as reflected by Loan-to-Deposit Ratios (LDRs) over 100%. This scenario suggests that these banks are lending out more than the deposits they have on hand, which could lead to challenges in meeting withdrawal demands and liquidity strains. Liquidity issues continue to be a major worry for Indonesian banks post-crisis. High NPLs further complicate credit allocation, intensifying liquidity problems.
A comparison between the two bank groups shows a small variance in their average LDRs—81.97% for the group likely to sustain and 83.70% for the group less likely to sustain. Though the difference seems minor, statistical analysis confirms its significance at the 5% level (α < 0.05). Off-balance sheet (OBS) activities also display a statistically significant difference between the groups, with sustainable banks averaging 67.29% and non-sustainable banks at only 22.55% (α < 0.05). This indicates that sustainable rural banks engage more with off-balance sheet instruments, potentially improving financial flexibility and risk management.
In terms of credit expansion, both groups experienced moderate growth rates between 5% and 6%, reflecting continued efforts to perform their intermediation function despite external challenges. While rural banks vie with commercial banks and other financial entities for loan distribution, their strength lies in their localized strategies and deep customer connections, which are vital in underbanked regions.
During the stages of developing and validating the model, the data was split into two sets: one for estimating the model and another for validation. According to Sudarsono et al. (2012), it's crucial to assess the model's predictive accuracy using separate datasets for building and validating the model. This method helps maintain an unbiased error rate, provided the validation data is different from the data used to construct the classification or prediction model. For the post-COVID-19 analysis, model estimation used data from 2021 to 2023, and model validation was carried out with data from 2023.
This research assesses and compares the predictive accuracy of three different models (Model 1, Model 2, and Model 3) to identify the most precise model for evaluating rural bank sustainability post-COVID-19. After estimating the models, the next step involves analyzing the outcomes from the three models. The nature of the relationship between the dependent and independent variables (positive or negative) shows how changes in one variable affect the predicted result. A positive coefficient suggests an increased chance of sustainability, while a negative coefficient indicates a reduced likelihood of the predicted outcome. The estimation results, derived from in-sample data, along with the interpretation of each hypothesis tested across the three models, are shown in Table 3.
The analysis of Model 1 shows that all null hypotheses are dismissed. Each independent variable—Capital Adequacy Ratio (CAR), Loan-to-Deposit Ratio (LDR), Return on Assets (ROA), and Credit Growth—has a significant impact on the probability of bank unsustainability, with all results being statistically significant at the 1% level. Likewise, Model 2 reveals that Non-Performing Loans (NPL), Operational Efficiency (BOPO), Cash Ratio (CR), and Off-Balance Sheet (OBS) activities significantly affect the risk of bank default or unsustainability at a 1% significance level.
In contrast, Model 3 shows that while most variables significantly influence the dependent variable, Cash Ratio and Net Interest Margin (NIM) do not show a significant effect on the likelihood of a bank being unsustainable. The lack of significance of NIM is consistent with regulatory views, which do not consider NIM a primary factor in bank failure. However, this result differs from earlier research that found a strong positive correlation between NIM and bank sustainability (14). While a higher NIM might enhance profitability, it could also increase borrowing costs for customers, potentially raising default risks and NPLs, thereby hindering sustainable growth.
Furthermore, the Cash Ratio was found to be an insignificant predictor of rural bank sustainability. This may be due to rural banks typically maintaining cash ratios at or above the regulatory minimum of 6%. Consequently, both unsustainable and default-prone banks usually meet this requirement, diminishing the predictive power of this variable. The next step involves assessing which model has the highest classification accuracy by examining prediction error values. The error value is determined as the difference between the actual data and the predicted probability. Table 4 compares the accuracy of Models 1, 2, and 3 based on average error values, using both estimation (in-sample) and validation (out-of-sample) datasets.
This study uses a cut-off point based on the proportional distribution of sustainable and non-sustainable banks (15). The selection of the cut-off point is crucial for determining prediction errors, as it affects classification results. Using the overall proportion of sustainable versus non-sustainable banks in the sample offers a balanced and objective method for setting the most suitable cut-off threshold.
In this research, Model 1 includes a sample where 5% of banks are deemed likely to be unsustainable, while 95% are considered sustainable (193 out of 203 banks). A cut-off point of 0.95 is used to represent this proportional split. In Model 2, 25% of banks are labeled as potentially unsustainable, and 75% as sustainable (153 out of 203 banks), which sets the cut-off at 0.75. In Model 3, 24% of banks are classified as potentially unsustainable, and 96% as sustainable (195 out of 203 banks), establishing a cut-off of 0.96.
As illustrated in Table 4, the mean logit scores for the category 'tending to be unsustainable' were computed using in-sample (estimation) data from 2021 to 2023. For Model 1, the mean logit score stands at 0.9646, surpassing the cut-off of 0.9506, which suggests robust classification accuracy for identifying unsustainable banks. In Model 2, the mean logit score is 0.0319, below the 0.75 cut-off, indicating poorer performance in classifying unsustainable banks. Conversely, Model 3 has a mean logit score of 0.9697, exceeding the cut-off of 0.9605, showing high accuracy in pinpointing banks likely to be unsustainable.
From these comparisons, it is evident that Models 1 and 3 have better accuracy in classifying banks that tend to be unsustainable, whereas Model 2 demonstrates reduced classification effectiveness, especially in identifying sustainable banks, as indicated by higher prediction errors. The same methodology was used to evaluate the average logit scores from out-of-sample (validation) data for 2023. Validation results for Model 1 indicate an average logit score of 0.9636, above the cut-off of 0.9506, showing strong classification accuracy for unsustainable banks. For Model 2, the average logit score is 0.0307, significantly below the 0.75 cut-off, suggesting a lower accuracy in predicting unsustainable banks. In contrast, Model 3's average logit score of 0.9690 exceeds the 0.9605 threshold, confirming its effectiveness in predicting unsustainable banks. When assessing the three models' out-of-sample prediction accuracy, Models 1 and 3 perform better at identifying banks at risk of unsustainability, while Model 2 shows the least predictive capability, as evidenced by its higher error rates. These outcomes are in line with the prediction and error values seen in the validation data for 2023.
Based on the average logit scores for the 'tend to sustain' category, the in-sample (estimation) results up to 2023 show that all three models successfully classify sustainable banks. In Model 1, the average logit score is 0.8553, below the cut-off of 0.9506, indicating effective classification of sustainable banks. Similarly, Model 2's average logit score of 0.2333 is well below its cut-off of 0.75, reinforcing its accuracy in identifying sustainable banks. Model 3's average logit score of 0.7326 falls below its cut-off of 0.9605, suggesting accurate estimation for this category. These results indicate that Models 1, 2, and 3 all perform well in estimating bank sustainability using in-sample data, as demonstrated by their average logit scores that appropriately correspond with the cut-off points set for each model.
According to the T[2] test results, comparing the logit scores from in-sample and out-of-sample data for banks categorized as 'tending to sustain' reveals the following insights:
- For Model 1, the T[2] test yields a p-value of 0.2337, surpassing the 5% significance level (α = 0.05). This suggests no statistically significant difference exists between the average in-sample (estimation) and out-of-sample (validation) logit scores for the 'tend to sustain' category. Therefore, it can be inferred that Model 1 is robust and dependable. The lack of significant variance between the estimation and validation outcomes indicates consistent predictive performance. This consistency is reinforced by the close match in average logit scores, demonstrating high accuracy in identifying banks likely to sustain.
- b. The T[2] test results for Model 2 indicate a p-value of 0.2600, above the 5% significance level (α = 0.05). This signifies no statistically significant difference between the average logit scores from in-sample (estimation) and out-of-sample (validation) data in the 'tend to sustain' category. Hence, Model 2 exhibits stable predictive performance. The nearness of logit scores between the estimation and validation periods, despite occasional slightly higher validation scores, indicates that the model is trustworthy in predicting sustainable banks.
- c. Likewise, the T[2] test for Model 3 produces a p-value of 0.1806, which is above the 5% significance level. This indicates no significant difference between the average in-sample and out-of-sample logit scores for the 'tend to sustain' group. Consequently, Model 3 is deemed stable and reliable, as the average logit scores during the validation phase closely reflect those during the estimation phase. The validation period is essential for evaluating the model's future use, especially in accurately pinpointing banks at risk of becoming unsustainable.
Model 3 has been determined to be the most precise of the three models evaluated. This finding is backed by its average error value, which is nearest to zero, reflecting the smallest prediction error. Model 3 shows the least mean error, with Model 1 coming next, and Model 2 displaying the largest average error. Essentially, this indicates that Model 3’s predictions most accurately match the actual results. Nonetheless, it should be recognized that incorporating multiple model comparisons might result in estimation inflation, which could elevate the predicted probability and consequently decrease the overall confidence level. This inflation effect can alter the significance level (α), possibly leading to a Type I error.
The validation outcomes for Type I and Type II error analysis of Model 1 are as follows: the Type I error rate (false positive), which is the percentage of banks forecasted as sustainable but were actually unsustainable, was 12 out of 187, or 6.41%. The Type II error rate (false negative), indicating the percentage of banks predicted as unsustainable but were actually sustainable, was 8 out of 16, or 50%. The sensitivity of the model, or its effectiveness in correctly identifying unsustainable banks, was 75%. Its specificity, or the accuracy in pinpointing sustainable banks, was 96.25%. The model's overall classification accuracy was 92.11%, demonstrating robust predictive capabilities. These findings are detailed in Table 5.
According to Table 5, Model 2 forecasted 27 banks as unsustainable, yet the actual data showed 15 banks as unsustainable and 12 as sustainable. The model's sensitivity, or its accuracy in identifying unsustainable banks, was 15 out of 27, translating to 55.55%. For sustainable banks, the model predicted 176, with 169 confirmed to be sustainable, yielding a specificity of 169 out of 176, or 90.37%. The total accuracy of classification was 86.69%.
The Type I error rate (false positives), where sustainable banks were wrongly labeled as unsustainable, stood at 8 out of 176, or 4.54%. The Type II error rate (false negatives), where unsustainable banks were misidentified as sustainable, was 15 out of 27, or 55.55%. Despite a high specificity, the model's sensitivity below 70% and a high Type II error rate suggest that Model 2 lacks reliability in pinpointing unsustainable banks.
On the other hand, Model 3's validation results indicate superior performance. Its Type I error rate was merely 4 out of 195, or 2.05%, showing few sustainable banks were misidentified as unsustainable. The Type II error rate was 1 out of 8, or 12.5%, indicating high precision in identifying unsustainable banks. Sensitivity was 87.5%, and specificity was 98.18%. The overall classification accuracy reached 96.05%, affirming that Model 3 provides strong and dependable predictive capabilities.
Among the evaluated models, Model 3 showed the greatest predictive strength, achieving over 96% accuracy in both in-sample and out-of-sample tests. This model includes all relevant variables and provides the most solid structure for forecasting rural bank outcomes. The findings imply that a holistic strategy, encompassing capital strength, risk exposure, and operational efficiency, is crucial for enhancing resilience in rural banking.
These findings have profound implications for both regulators and practitioners. Policymakers should bolster supervisory frameworks to incorporate predictive analytics and early warning systems, whereas rural banks should focus on financial discipline, robust risk management, and capacity building to enhance sustainability in the post-COVID-19 era.
4. Discussion
The results of this research highlight the complex nature of rural bank sustainability in Indonesia following the COVID-19 period, validating both the theoretical frameworks and empirical findings from earlier studies. Key factors such as capital adequacy, operational efficiency, profitability, credit risk, and liquidity are identified as crucial for sustainability, corroborating hypotheses H1 to H4 and reinforcing the wider body of literature on financial resilience.
Model 3, deemed the most effective, supports the necessity of a comprehensive strategy that includes strong capital reserves (CAR), careful loan distribution (LDR), profitability (ROA), and effective cost management (BOPO) for ensuring rural bank sustainability. These outcomes resonate with the findings of Athanasoglou et al. (2008) and Endri et al. (2020), who highlighted the importance of internal financial health metrics in predicting bank viability, particularly during times of economic strain.
Surprisingly, the study indicates that the Cash Ratio (CR) and Net Interest Margin (NIM) have little effect on sustainability in the post-COVID environment. While earlier studies (e.g., Boadi et al., 2016; Endri et al., 2020) identified a beneficial impact of NIM on bank profitability, this research suggests that higher margins might increase borrower risk, particularly for rural clients with limited financial resources. The lack of impact from CR could be attributed to regulatory requirements that ensure most rural banks maintain the required 6% liquidity, regardless of their sustainability.
From a regulatory standpoint, these findings call for enhanced risk-based oversight by bodies like OJK, with a focus on early warning systems using financial ratios. Logistic regression models, such as the one used in this study, could play a vital role in anticipating systemic risks in the rural banking sector.
The implications for rural bank management are also profound. Strategies to boost ROA through better asset management, decrease BOPO through cost efficiencies, and enhance LDR through prudent lending practices are practical steps forward. Furthermore, participation in off-balance sheet (OBS) activities, observed in more sustainable banks, could enhance financial flexibility, as indicated by the notable differences found in this research.
The validation process confirms the broad applicability of the findings, with Model 3 showing consistent predictive accuracy in both in-sample and out-of-sample tests. This rigorous approach bolsters the study's contribution to the understanding of rural banking sustainability.
Future Research Directions
While this study offers a solid quantitative model, future research could explore additional avenues:
- Including qualitative factors like management quality, governance, and customer satisfaction to better understand the less tangible but significant aspects of sustainability.
- Conducting comparative analyses between rural banks and other microfinance entities to validate the model's applicability across different organizational forms and markets.
- Implementing longitudinal studies over an extended post-COVID period to evaluate the ongoing relevance of these factors in a changing economic landscape.
- Utilizing geospatial analysis to examine regional differences in economic recovery, pinpointing localized risk factors and policy deficiencies.
- Developing stress test models to simulate future economic disruptions (e.g., climate events or inflation) to evaluate the resilience of rural banks under different scenarios.
By exploring these areas, future research can offer a more holistic view of how rural financial institutions in developing economies can maintain resilience in the face of uncertainty.
5. Conclusions
This research investigates the financial and operational factors influencing the sustainability of rural banks in Indonesia post-COVID-19. Utilizing logistic regression analysis across various models, we pinpoint crucial variables that consistently forecast bank sustainability, such as capital adequacy, profitability, credit expansion, and risk exposure. Model 3, which encompasses all significant financial metrics, emerges as the most precise and reliable predictor, demonstrating excellent performance both in-sample and out-of-sample. The findings underscore those rural banks possessing robust capital reserves, proficient credit management, and streamlined operations are better positioned to sustain themselves amid economic unpredictability.
These insights have significant ramifications for both policymakers and banking professionals. For regulatory bodies like the Financial Services Authority (OJK), implementing predictive analytics and sustainability evaluation tools is crucial for timely intervention and risk management. Concurrently, rural banks should bolster their internal governance, pursue cautious lending practices, and allocate resources to digital infrastructure to boost efficiency and resilience.
Future studies could broaden this model to incorporate qualitative factors, such as management effectiveness or customer satisfaction, and assess its relevance to other types of microfinance institutions in Indonesia or similar emerging economies.
Supplementary Materials
The following supporting information can be downloaded at the website of this paper posted on Preprints.org, Table S1: Summary of Financial Ratios of BPRs by Region; Figure S1: Classification Accuracy of Predictive Models; Dataset S1: Aggregated Bank Health Ratings and Financial Indicators (2020–2023).
Author Contributions
Conceptualization, D.M.P. and J.C.; methodology, D.M.P.; software, J.C.; validation, D.M.P., J.C., and S.D.; formal analysis, J.C.; investigation, D.M.P.; resources, D.M.P.; data curation, J.C.; writing—original draft preparation, D.M.P.; writing—review and editing, S.D.; visualization, J.C.; supervision, S.D.; project administration, D.M.P.; funding acquisition, D.M.P. All authors have read and agreed to the published version of the manuscript.
Funding
This research was funded by the Directorate, Research, Technology and Community Service, Directorate General of Higher Education, Research and Technology in accordance with Research Contract Number: 105/E5/PG.02.00.PL/2024.
Data Availability Statement
The data that support the findings of this study are available from the corresponding author upon reasonable request. Due to institutional policy and confidentiality agreements, the dataset cannot be made publicly available.
Acknowledgments
The authors wish to acknowledge the support of Universitas Mercu Buana and the assistance of the Indonesian Financial Services Authority (OJK) for granting access to anonymized bank health rating data. During the preparation of this manuscript, the authors used ChatGPT-4 (OpenAI, 2024) to assist with English grammar refinement and structure clarification. The authors have reviewed and edited the output and take full responsibility for the content of this publication.
Conflicts of Interest
The authors declare no conflict of interest. The funders had no role in the design of the study; in the collection, analyses, or interpretation of data; in the writing of the manuscript; or in the decision to publish the results.
References
- Umaña-Hermosilla, B.; de la Fuente-Mella, H.; Elórtegui-Gómez, C.; Fonseca-Fuentes, M. Multinomial logistic regression to estimate and predict the perceptions of individuals and companies in the face of the COVID-19 pandemic in the Ñuble Region–Chile. Sustainability. 2020, 12, 9553. [Google Scholar] [CrossRef]
- Ali, M.; Anwar, M. Multinomial logistic regression to estimate and predict the perceptions of individuals and companies in the face of the COVID-19 pandemic in the Ñuble Region–Chile. Sustainability. 2020, 12, 9553. [Google Scholar] [CrossRef]
- Ahmed, N.; Uddin, M.S. COVID-19 implications for banks: Evidence from an emerging economy. Financial Innovation 2020, 6, 26. [Google Scholar] [CrossRef]
- Susilowati, I.H.; Nugroho, Y. COVID-19, digital transformation of banks, and operational capabilities. Sustainability. 2023, 15, 8783. [Google Scholar] [CrossRef]
- Endri, E.; Marlina, A.; Hurriyaturrohman, H. Impact of internal and external factors on the net interest margin of banks in Indonesia. Banks and Bank Systems. 2020, 15, 99–107. [Google Scholar] [CrossRef]
- Puspitasari, D.M.; Matsani, M. Pemberdayaan Pemulung Pancoran Barat melalui Pelatihan Aneka Kreasi Daur Ulang. Madaniya. 2023, 4, 769–774. [Google Scholar]
- Puspitasari, D.M. Role of Rural Bank in MSE Economic Development in Indonesia. Turkish Journal of Computer and Mathematics Education (TURCOMAT). 2021, 12, 749–752. [Google Scholar]
- Puspitasari, D.M.; Napitupulu, S.; Roespinoedji, D.; Amaliawiati, L.; Nugraha, N.M. Developing a Predictive Model About Bankruptcy in the Rural Areas of Indonesia. Review of International Geographical Education Online 2021, 11. [Google Scholar]
- Nguyen, L.; Do, T.; Nguyen, H. Green management, access to credit, and firms' vulnerability to the COVID-19 crisis. Small Business Economics 2023, 61, 233–250. [Google Scholar] [CrossRef]
- Banna, H.; Ahmad, R.; Koh, E.H. Determinants of commercial banks' efficiency in Bangladesh: Does crisis matter? The Journal of Asian Finance, Economics and Business. 2017, 4, 19–26. [Google Scholar] [CrossRef]
- Mishkin, F.S.; Eakins, S.G. Financial Markets and Institutions. 9th ed. Pearson; 2021.
- Athanasoglou, P.P.; Brissimis, S.N.; Delis, M.D. Bank-specific, industry-specific and macroeconomic determinants of bank profitability. Journal of International Financial Markets, Institutions and Money. 2008, 18, 121–136. [Google Scholar] [CrossRef]
- Endri, E.; Marlina, A.; Hurriyaturrohman, H. Impact of internal and external factors on the net interest margin of banks in Indonesia. Banks and Bank Systems. 2020, 15, 99–107. [Google Scholar] [CrossRef]
- Boadi, E.K.; Li, Y.; Lartey, V.C. Role of Bank Specific, Macroeconomic and Risk Determinants of Banks Profitability: Empirical Evidence from Ghana’s Rural Banking Industry. International journal of economics and financial Issues 2016, 6, 813–823. [Google Scholar]
- Santoso, Wimboh. 1996, “The Determinants of Problem Banks in Indonesia”, Banking Research and Regulation, Bank Indonesia.

Table 3.
In Sample Logistic Regression Estimation Model Test Results.
| Variable | Expected Sign | Model 1 | Model 2 | Model 3 | |||
| Coefficient | OR | Coefficient | OR | Coefficient | OR | ||
| CAR | (-) negative | -0.0095 *** | 0.948 | -0.029*** | 0.948 | ||
| LDR | (+) positive | 0.0346*** | 1,060 | 0.003*** | 1,034 | ||
| ROA | (-) negative | -0.2139*** | 0.859 | -0.026* | 0.815 | ||
| CG | (-) negative | -0.6001*** | 1.001 | -0.718*** | 1,432 | ||
| NIM | (-) negative | -0.0043 | 0.948 | -0.003 | 1.002 | ||
| NPL | (+) positive | 0.1806*** | 1.141 | 0.168*** | 1.145 | ||
| BOPO | (+) positive | 0.0364*** | 1.019 | 0.020** | 0.976 | ||
| CR | (-) negatif | -0.0127*** | 0.943 | -0.006 | 0.965 | ||
| OBS | (-) negatif | -0.0126*** | 0.831 | -0.045*** | 0.888 | ||
| C | -1.305** | -74.113*** | -0.751** | ||||
| McFadden R2 (%) | > 70 | 86.95 | 86.09 | 92.03 | |||
| H-L Statistic | 31.75 | 27.53 | 33.00 | ||||
| Prob. Chi-Sq | α | 0.081** | 0.080** | 0.030*** | |||
| AIC | ε→ 0 | 0.2481 | 0.281 | 0.221 | |||
| SIC | ε→ 0 | 0.2501 | 0.282 | 0.212 | |||
| % Correct | ε→ 100 | 96.82 | 96.45 | 98.86 | |||
| %Incorrect | ε→ 0 | 3.18 | 3.55 | 1.14 | |||
Information : ε→ close value, OR = Odds Ratio, ***)significant alpha 0.01, **)significant alpha 0.05, *)significant alpha 0.10.
Table 4.
Comparison of Model Accuracy Based on Average Error Values between In Sample and Out-of Sample.
Table 4.
Comparison of Model Accuracy Based on Average Error Values between In Sample and Out-of Sample.
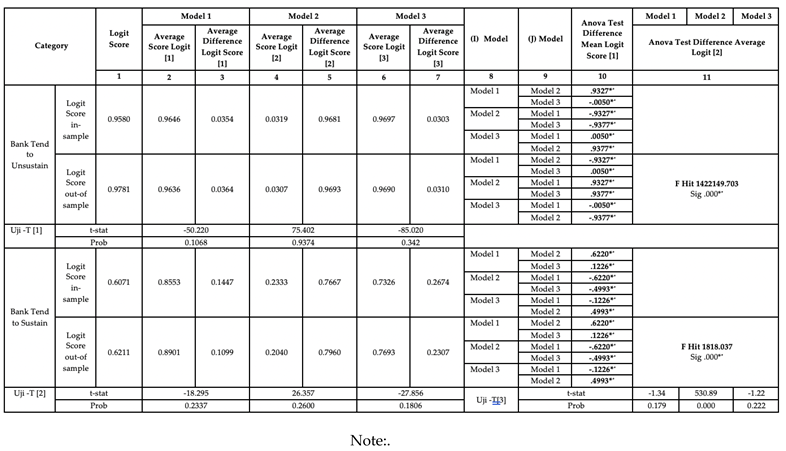 |
Table 5.
Type I and Type II Error Test Results.
| Model 1 Y1_Observed | Y1_Predicted | Total | Percentage (%) | ||
| Sustain | Unsustain | Observation | |||
| Type 1 | Sustain | 169 | 8 | 187 | 96.25 |
| Type 2 | Unsustain | 4 | 12 | 16 | 75 |
| Overall | 203 | 92.11 | |||
| Model 2 Y1_Observed | Y1_ Predicted | Total | Percentage (%) | ||
| Sustain | Unsustain | Observation | |||
| Type 1 | Sustain | 169 | 8 | 176 | 90.37 |
| Type 2 | Unsustain | 12 | 15 | 27 | 55.55 |
| Overall | 203 | 86.69 | |||
| Model 3 Y1_Observed | Y1_ Predicted | Total | Percentage (%) | ||
| Sustain | Unsustain | Observation | |||
| Type 1 | Sustain | 191 | 4 | 195 | 98.18 |
| Type 2 | Unsustain | 1 | 7 | 8 | 87.5 |
| Overall | 203 | 96.05 | |||
Source: Processed research data, 2024.
Disclaimer/Publisher’s Note: The statements, opinions and data contained in all publications are solely those of the individual author(s) and contributor(s) and not of MDPI and/or the editor(s). MDPI and/or the editor(s) disclaim responsibility for any injury to people or property resulting from any ideas, methods, instructions or products referred to in the content. |
© 2025 by the authors. Licensee MDPI, Basel, Switzerland. This article is an open access article distributed under the terms and conditions of the Creative Commons Attribution (CC BY) license (http://creativecommons.org/licenses/by/4.0/).
Copyright: This open access article is published under a Creative Commons CC BY 4.0 license, which permit the free download, distribution, and reuse, provided that the author and preprint are cited in any reuse.


