Submitted:
23 May 2025
Posted:
26 May 2025
You are already at the latest version
Abstract
Background/Objectives: The urine sodium/potassium (Na/K) ratio has the potential to detect dietary habits that contribute to hypertension. In this study, we aimed to verify whether private health insurance sales staff can change their customers’ lifestyles based on urinalysis results by a prospective cohort interventional trial. Methods: Participants were randomly assigned to three groups: a face-to-face (FF) intervention by sales staff (n = 83), non-FF (Non-FF) intervention via a social networking service (n = 87), and no-intervention (Control) (n = 58). Urine analysis and surveys about diet and exercise habits were conducted before and after a 3-month interventional period for all groups. Three-time interventions were performed for the FF and Non-FF group, dietary advice based on the urine analysis, distribution of leaflets encouraging reduced sodium intake and increased locomotor activity, and viewing an educational video. For the Control group, only the urinary analysis results were sent by mail. Results: Significant improvements in estimated potassium intake were observed in the Non-FF group, and significant reductions in urine Na/K ratios were noted in both the FF and Non-FF groups. Multiple logistic regression analysis indicated that watching the video was the most effective factor for decreasing the urine Na/K ratio (odds ratio = 1.869). Total points for dietary behavior based on the questionnaire significantly improved among individuals who watched the video. Conclusions: This study demonstrates the potential for private health insurance companies to contribute to health promotion and introduces a novel strategy for improving lifestyle habits among individuals at high risk of lifestyle-related diseases.
Keywords:
urine sodium/potassium ratio
; health promotion
; collaboration with university medical school and private insurance company
; lifestyle habits
; high-risk and treating customers
1. Introduction
Poorly controlled hypertension is strongly associated with metabolic syndrome [1], resulting in an increased risk of cardiovascular events. Hypertension affects approximately 45%-49 % of the US population [2], 43%-48 % of Japanese individuals [3], and more than 1 billion adults worldwide [2]. Several established nonpharmacological interventions for the prevention and treatment of hypertension have been reported [4], and decreasing sodium (Na) intake [5] and increasing potassium (K) intake [6] are important factors for lowering blood pressure.
Recently, the urine Na/K ratio has been found to be more strongly associated with high blood pressure than daily salt intake estimated from urinary Na [7]. Kogure M et al. [8] reported that urinary Na/K ratio is a potential indicator for countering hypertension during health checkups in community settings. Urine Na/K ratio is one of the most useful tools for self-monitoring hypertension-related dietary habits without requiring a hospital visit. The Japanese Society of Hypertension recommends an average urine Na/K ratio of 4 as a feasible target value to achieve temporary goals in the Japanese general population [9].
Currently, most individuals can disseminate health information through social networking sites (SNSs) [10]. A key health promotion task is determining how and by whom correct health knowledge should be conveyed to the public. Although medical schools are generally considered reliable institutions for accessing current and academic health-related knowledge, many organizations lack sufficient capacity to disseminate health knowledge to the public. Workplaces [11], schools [12], and local communities connected by common interests [13] are effective health promotion communities. In recent years, cooperation between public institutions and companies has been reported [14], however, few reports exist on collaborations between university medical schools and life insurance companies for health promotion.
In this study, a private health insurance company collaborated with a university medical school to conduct a prospective intervention trial among customers at high risk for lifestyle diseases or undergoing treatment to improve their lifestyle habits. The intervention involved either a sales staff visit or a social networking notification encouraging individuals to read distributed leaflets and watch video programs aimed at improving eating and exercise habits. It was hypothesized that face-to-face visits by sales staff would encourage customers to improve their lifestyle habits. The objective was to explore the factors that impact behavioral changes in individuals with lifestyle diseases at the preliminary stage. The findings suggest that such interventions can effectively encourage individuals at risk of lifestyle-related diseases to improve their lifestyles.
2. Materials and Methods
2.1. Study Design and Settings
This was a 3-month, prospective, randomized controlled intervention study conducted from August 2022 to December 2022. This study was approved by the Ethics Committee of Hirosaki University School of Medicine (approval number: 2023-043, 2025-002) and registered in the Japanese Registry of Clinical Trials (clinical research plan No: jRCT1020220037, authorization number: CRB2210001).
Since 2008, Japanese health insurance holders aged 40–74 years have been obligated to participate in the Specific Health Check-ups and the Specific Health Guidance program, focusing on visceral fat obesity based on Japanese law [15]. This program specializes in checkups that screen for symptoms of metabolic syndrome, and the Specific Health Guidance program is provided to individuals at risk for metabolic syndrome to improve lifestyle habits. In accordance with the criteria for this health checkup, Company M ranked health insurance subscribers using its own classification based on Specific Health Check-up results and provided premium cashback accordingly. In this study, customers ranked as ‘Cash-back rank as 2 or 3’, meaning not high enough to require medical treatment but requiring Specific Health Guidance, or those who had already started treatment, were eligible for inclusion.
Each sales staff member of Company M recruited participants from among their own customers who lived in Aomori Prefecture in Japan. Participants included individuals aged 18–65 years who were subscribed to voluntary health insurance targeting lifestyle-related diseases provided by Company M, ranked as ‘Cash-back rank as 2 or 3’, and able to cooperate with surveys involving sales staff visits, social networking via smartphones, urinalysis, and questionnaires. Exclusion criteria were being a family member of the sales staff or having a history of previous diseases such as cancers, heart disease, cerebrovascular disease, diabetes, hypertensive retinopathy, chronic kidney disease, chronic hepatitis, cirrhosis of the liver, or chronic pancreatitis. Participants and sales staff received gift cards for trial participation.
After providing consent, the sales staff randomly assigned participants to three different groups: face-to-face (FF), non-face-to-face (Non-FF), and non-intervention (Control). A total of 260 participants were enrolled. After excluding those who withdrew consent or failed to submit urinalysis results or complete questionnaires, 83, 87, and 58 participants in the FF, Non-FF, and Control groups, respectively, were included in the analysis (Figure 1).
2.2. Intervention Strategies
At baseline, all patients underwent urinalysis and completed a questionnaire. Urinalysis results were mailed to participants by inspection contractors. The pre-interventional questionnaire collected information on sex, age, occupation, height, weight, past and present history of medical treatment for lifestyle diseases, recent suggestions for lifestyle diseases in the Specific Health Check-ups, and lifestyle questionnaires on dietary behaviors and locomotor activities. More information about the lifestyle questionnaires is provided in Table 1.
For the intervention groups (FF and Non-FF), health information was provided three times over 3 months. The first intervention involved dietary advice based on the urinalysis results, such as appropriate salt intake. The second intervention involved providing two types of health information through leaflets. The first leaflet addressed eating habits, including recommendations to limit carbohydrate and salt intake and increase dietary fiber intake. The second leaflet addressed locomotor activities, provided information on locomotive syndrome [16], and recommended increasing walking and daily activities by 10 min. The third intervention encouraged participants to watch an online video. In this video, a doctor in a white coat presented two cases: one where arterial fibrillation detected during a health checkup was left untreated, resulting in a stroke with residual disabilities, and another where hypertension from youth was left untreated, leading to heart failure. This video highlighted the importance of seeking prompt treatment if abnormalities are identified during health checkups. Company M produced all leaflets and videos under specialist supervision. For the FF group, leaflets and video encouragement were provided and explained FF by Company M sales staff. For the Non-FF group, materials were delivered via SNS. At the beginning of the interventional period, the participants were advised to install the application software provided by Company M on their smartphones to measure their daily number of steps. No health information, other than urinalysis results, was provided to the Control group.
All participants underwent urinalysis and completed a questionnaire survey 3 months after the trial initiation. The post-trial questionnaire included height and weight, a lifestyle questionnaire on dietary behaviors and locomotor activities (Table 1), and questions about whether participants had read the leaflets, watched the video, and whether they were influenced by the urinalysis, leaflets, or video. An overview of the intervention trial is shown in Figure 2.
The main outcomes were a decrease in the urine Na/K ratio and changes in estimated Na and K intake calculated by urinalysis. The secondary outcomes were changes in lifestyle questionnaire scores, body mass index (BMI), and steps per day.
2.3. Data Collection and Processing
The spot urine collection sample was analyzed using Shio-Check plus (Healthcare Systems Co., Ltd., Japan). Salt intake was calculated by converting the estimated Na excretion, derived using Tanaka's formula [17], into the corresponding amount of salt. K intake was calculated by dividing the estimated K excretion, based on Tanaka formula [17], by the excretion rate and converting it into intake. The urinary Na/K ratio was calculated by dividing the measured Na value by the measured K value.
Sales staff collated the urinalysis and questionnaire data to Company M, which were anonymized and provided to the analysts. Height and weight obtained from the questionnaire responses were converted to BMI by dividing weight (kg) by the square of height (m) and were included in the analysis.
Participants answered multiple-choice questionnaires regarding lifestyle habits: 1, Be applicable; 2, somewhat applicable; 3, undecided; 4, not very applicable; and 5, not applicable. Each response was assigned a point value, and the total score for five questions on eating habits and five questions on locomotor activities, each on a 25-point scale, was compared before and after the intervention.
The average number of steps taken per day in the first and last weeks of the intervention was collected via application software and used in the analysis as the number of steps taken before and after the intervention.
2.4. Statistical Analyses
Differences among three groups (FF, Non-FF, Control) were assessed using the Kruskal–Walli’s test for the nominal variables, and the chi-square test for the continuous variables. Wilcoxon signed–rank test was used to compare Na and K intake and the urine Na/K ratio before and after the intervention within each group. Data from all participants were compared to evaluate changes in the urine Na/K ratio. Differences between two groups were analyzed using the Mann–Whitney U test for nominal variables and the chi-square test for continuous variables. Multiple logistic regression analysis, using the likelihood ratio forward selection method, was performed to identify factors influencing a decrease in the urine Na/K ratio. The dependent variable was whether the urine Na/K ratio decreased compared with baseline, and the covariates included the availability of FF visits by sales staff, whether participants were affected by urinalysis, and whether they had read the leaflet or watched the video, based on responses to post-intervention questionnaire. These covariates corresponded to types of interventions implemented in this trial. Multicollinearity was assessed before selecting the independent variables. In addition, two-group comparisons between participants with and without the extracted factors were conducted using the chi-square test or the Mann–Whitney U test, and changes before and after the intervention were compared using Wilcoxon signed-rank test.
All statistical analyses were performed using IBM SPSS Statistics software version 26.0 (IBM Corporation, Armonk, NY, USA). P-values < 0.05 were considered statistically significant.
3. Results
3.1. Baseline Characteristics of the Three Groups
Table 2 presents the occupations of participants. Many participants were desk workers, salespeople, service workers, and transport workers, and none were primary industry workers, such as farmers, forestry workers, or fishery workers.
The baseline characteristics of the three groups are summarized in Table 3. There were no significant differences in sex, age, Na and K intake, urine Na/K ratio, number of present and past treatments for lifestyle diseases, or number of previous suggestions for hypertension. The mean (± standard deviation) BMI values were 25.2 ± 4.5, 24.3 ± 4.7, and 26.0 ± 4.0 kg/m2 in the FF, Non-FF, and Control groups, respectively, with significant differences among those three groups. The number of participants with a urine Na/K ratio < 2.0, the optimal target value in Japanese [9], was 16 (7.0%), and the number with a urine Na/K ratio < 4.0, a feasible target value in Japanese [9], was 93 (40.7%). There were no significant differences in total lifestyle questionnaire scores among the three groups. The numbers and percentages of participants who cooperated with step counting were 33 (39.7%), 46 (52.8%), and 26 (44.8%) in the FF, Non-FF, and Control groups, respectively; no significant differences were observed in steps per day before the intervention.
3.2. Changes in Sodium and Potassium Intake and the Urine Na/K Ratio
The changes in Na and K intake, and the urine Na/K ratio are shown in Figure 3. K intake relatively significantly increased from 1743.0 ± 386.8 mg to 1935.8 ± 521.8 mg in the Non-FF group (p < 0.01). Urine Na/K ratios significantly decreased from 5.10 ± 2.93 to 4.35 ± 2.56 in the FF group (p < 0.05) and from 5.39 ± 3.08 to 4.65 ± 3.07 in the Non-FF group (p < 0.05). Na intake did not change significantly in any group. No significant differences were observed in the Control group.
3.3. Factors Associated with a Decrease in the Urine Na/K Ratio
To investigate the factors associated with decrease in the urine Na/K ratio, differences between baseline and questionnaire responses were compared, and participants were divided into Na/K ratio–decreased and non–decreased groups (Table 4). There were no significant differences in the interventional group, age, sex, BMI, past or present treatment of lifestyle diseases, recent suggestion of hypertension, or total scores in the lifestyle questionnaire. A total of 224 (98.2%) participants completed the post-interventional questionnaire. Of these, 160 (71.4%) reported reading the leaflets almost entirely or partially, and 132 (58.9%) reported watching the video almost entirely or partially. A significant difference was observed in the number of individuals who watched the video between the two groups (p < 0.05). No significant differences were noted in the content that participants felt had affected them.
Multiple logistic regression analysis indicated that watching educational videos was significantly associated with a decrease in urine Na/K ratio (Table 5). The odds ratio was 1.869, with a significant chi-squared test result (p < 0.05), and the variables were also significant (p < 0.05). The discriminant accuracy was 58.5%, which was not high.
3.4. Differences Between the Participants Who Watched or Did Not Watch the Educational Video
Table 6 presents changes among participants who watched the educational video. A total of 132 participants reported watching the video. K intake was significantly increased from 1786.4 ± 401.5 to 1920.3 ± 506.4 mg (p < 0.05), and the urine Na/K ratio significantly decreased from 5.28 ± 2.85 to 4.49 ± 2.83 mg (p < 0.01). Total points for dietary behavior significantly increased from 13.3 ± 4.3 to 14.9 ± 2.7 (p < 0.05). Total points for locomotor activity significantly decreased from 14.6 ± 5.0 to 13.9 ± 4.6 (p < 0.05). BMI and number of steps per day showed no significant changes.
Table 7 presents differences between participants who watched and did not watch the educational video. There were significant differences in BMI at baseline (p < 0.05) and after the intervention period (p < 0.05). There were no significant differences in age, sex, past or present treatment of lifestyle disease, recent suggestion of hypertension or other lifestyle diseases, and the type of intervention.
4. Discussion
In this study, three groups were established: FF, Non-FF, and Control. It was hypothesized that FF interventions by health insurance company sales staff would improve the lifestyle habits of customers at high risk for lifestyle-related diseases or those undergoing initial treatment. K intake significantly increased in the Non-FF group, and urine Na/K ratios significantly decreased in both the FF and Non-FF groups (Figure 3). Therefore, the interventions most effective in decreasing urine Na/K ratios were considered next. Univariate analysis was performed to compare the urine Na/K ratio between the decreased and the non-decreased groups, and watching the video was identified as a significant factor. The odds ratio for watching the video, adjusted for the presence or absence of FF involvement by sales staff and leaflet reading, was 1.869. Among the population who watched the video, K intake, urine Na/K ratio, and total dietary behavior scores significantly improved after the intervention (Table 6). These results indicate that watching an awareness-raising video is the most effective intervention for improving dietary habits. This report demonstrates that an intervention conducted by a private health insurance company under the supervision of a university medical school can contribute to the improvement of customers’ lifestyle habits.
At baseline, a significant difference in BMI was observed among the three groups (Table 3). The average BMI was highest in the Control group (26.0), and lowest in the Non-FF group (24.3), suggesting a potential inappropriate allocation at the initiation of the intervention trial. Therefore, BMI was retrospectively compared based on the results of this study. The baseline BMI of those who did not watch the educational video (25.8 ± 4.2) was significantly higher than that of those who watched the video (24.5 ± 4.6) (p < 0.05) (Table 7). These findings suggest that non-obese individuals are more aware of lifestyle improvements and more likely to benefit from interventions than obese individuals. A longitudinal investigation of children from childhood to adulthood reported a significant positive association among the urine Na/K ratio, blood pressure, and abdominal obesity, respectively [18]. Recently, the urine Na/K ratio has been shown to correlate more strongly with blood pressure than with salt intake [7] and has been reported as a useful indicator of diet quality in population-based studies [19]. The urinary Na/K ratio is thus considered a representative indicator of dietary habits, not only Na and K intakes, and individuals attentive to their dietary habits are more likely to be non-obese. Conversely, obese individuals who are not engaged in improving their eating habits are likely to be indifferent to lifestyle improvements; thus, targeting these groups represents a future challenge in health promotion.
Participants who watched the educational video showed an increased K intake and a significant decrease in their urine Na/K ratio. These results suggest that many individuals who watched the educational video increased their consumption of vegetables and/or fruits and improved their dietary habits. In contrast, BMI, total locomotor activity points, and the number of steps per day did not show significant changes. A previous systematic review revealed that dietary behavior was more likely to change than physical activity through telephone interventions [20]. Eating habits may be easier to improve than exercise habits, particularly in the short term. Additionally, combining assessments such as urine Na/K ratio, which is easily quantifiable, may help motivate individuals to improve their dietary habits.
The optimal target for the urine Na/K ratio is < 2.0 [9]; however, only 16 participants (7.0%) met this standard value at baseline. As Japanese individuals traditionally consume more Na, the feasible target value for this population was set at < 4.0 [9]. Across the entire population in this trial, the number of participants with a urine Na/K ratio < 4.0 increased from 93 (40.7%) at baseline to 118 (51.7%) after the intervention, although 72.7% of the participants reported that urinalysis had an impact. Urine Na/K ratio analysis thus has the potential to raise awareness regarding the need for dietary improvement and to sensitively reflect these changes.
Total locomotor activity scores showed a significant decrease after the intervention in the video-watched group. This result may be attributable to the trial being conducted from autumn to winter in northern Japan. Physical activity levels and step counts tend to decrease during winter in Japan [21], particularly in northern regions [22]. In any case, the trial duration and intervention methods were insufficient to improve participants' physical activity.
This study has some limitations. The target population did not include primary industry workers, such as those in agriculture, forestry, or fishing, and was biased toward individuals approximately 40 years of age. The trial was also limited to customers of a single life insurance company in a prefecture in northern Japan. BMI was self-reported by participants and therefore may not have been accurate. The questionnaire used to assess lifestyle habits and the scoring method were developed independently, and thus lacked external validation. Blood pressure was not investigated, as it was anticipated that no change would occur within the 3-month intervention period. Future research should examine methods to ensure the long-term maintenance of improved dietary habits, leading to the normalization of blood pressure. Interventions by non-certified sales staff depend on the quality of individual skills, and interventions through leaflets and videos are likely influenced by the content provided.
5. Conclusions
An intervention by a private health insurance company intervention can improve the urine Na/K ratio and dietary habits of customers at risk for, or undergoing treatment for, lifestyle-related diseases. Watching educational videos emerged as the most significant factor in achieving these improvements. This study proposes a novel approach to enhancing lifestyle habits in individuals at high risk for lifestyle-related diseases.
Author Contributions
Conceptualization, Tatsuya Mikami, Junji Fukui, Akira Otsu, Takuya Nakamura, Hiromu Yamazaki, Daisaku Kato, Yutaka Takase and Daisuke Seryo; Formal analysis, Sunao Tanaka; Funding acquisition, Junji Fukui, Daisuke Seryo and Koichi Murashita; Investigation, Tatsuya Mikami, Junji Fukui, Akira Otsu, Takuya Nakamura, Hiromu Yamazaki and Daisaku Kato; Methodology, Tatsuya Mikami, Junji Fukui, Akira Otsu, Takuya Nakamura, Hiromu Yamazaki and Daisaku Kato; Project administration, Tatsuya Mikami, Tatsuya Ogawa, Akira Otsu, Takuya Nakamura, Hiromu Yamazaki and Daisaku Kato; Resources, Yutaka Takase, Daisuke Seryo and Koichi Murashita; Supervision, Shigeyuki Nakaji, Yoshinori Tamada and Koichi Murashita; Visualization, Sunao Tanaka; Writing – original draft, Sunao Tanaka; Writing – review & editing, Sunao Tanaka, Shintaro Yokoyama, Tsukasa Tanaka, Kaori Sawada and Shigeyuki Nakaji. All authors will be updated at each stage of manuscript processing, including submission, revision, and revision reminder, via emails from our system or the assigned Assistant Editor.
Funding
This research was funded by the Department of Research on Pre-emptive Health Care Science, established as a joint research project between Hirosaki University and Meiji Yasuda Life Insurance Company.
Institutional Review Board Statement
The study was conducted in accordance with the Declaration of Helsinki, and approved by the Ethics Committee of Hirosaki University School of Medicine (approval number: 2023-043, 2025-002) and registered in the Japanese Registry of Clinical Trials (clinical research plan No: jRCT1020220037, authorization number: CRB2210001).
Informed Consent Statement
Informed consent was obtained from all subjects involved in the study.
Data Availability Statement
Hirosaki University School of Medicine and Meiji Yasuda Life Insurance Company retained the raw datasets presented in this study but made them unavailable due to obligations related to protecting participant data. Requests to access the datasets were directed to tanakas@hirosaki-u.ac.jp.
Acknowledgments
We would like to express our gratitude to all the participants and sales staff who cooperated in this study. We would like to thank Editage (www.editage.jp) for English language editing.
Conflicts of Interest
The research collaboration between the Meiji Yasuda Life Insurance Company and Hirosaki University was based on the establishment of a joint research department. Conflicts of interest are managed in accordance with ‘Conflict of Interest Management Regulations’ of Meiji Yasuda Life Insurance Company or ‘Conflict of Interest Management Regulations for Clinical Research at Hirosaki University School of Medicine’. No personal funds or corporate favors were provided to the principal investigator or co-investigators, and the research was conducted fairly.
Abbreviations
The following abbreviations are used in this manuscript:
| FF | Face-to-face |
| Non-FF | Non-face-to-face |
| SNS | Social networking sites |
| BMI | Body mass index |
References
- Katsimardou, A.; Imprialos, K.; Stavropoulos, K.; Sachinidis, A.; Doumas, M.; Athyros, V. Hypertension in Metabolic Syndrome: Novel Insights. Curr Hypertens Rev 2020, 16, 12–18. [Google Scholar] [CrossRef] [PubMed]
- Dzau, V.J.; Hodgkinson, C.P. Precision Hypertension. Hypertension 2024, 81, 702–708. [Google Scholar] [CrossRef] [PubMed]
- Otani, K.; Haruyama, R.; Gilmour, S. Prevalence and Correlates of Hypertension among Japanese Adults, 1975 to 2010. Int J Environ Res Public Health 2018, 15, 1645. [Google Scholar] [CrossRef]
- Carey, R.M.; Moran, A.E.; Whelton, P.K. Treatment of Hypertension: A Review. Jama 2022, 328, 1849–1861. [Google Scholar] [CrossRef]
- Graudal, N.; Hubeck-Graudal, T.; Jürgens, G.; Taylor, R.S. Dose-response relation between dietary sodium and blood pressure: a meta-regression analysis of 133 randomized controlled trials. Am J Clin Nutr 2019, 109, 1273–1278. [Google Scholar] [CrossRef]
- Aburto, N.J.; Hanson, S.; Gutierrez, H.; Hooper, L.; Elliott, P.; Cappuccio, F.P. Effect of increased potassium intake on cardiovascular risk factors and disease: systematic review and meta-analyses. Bmj 2013, 346, f1378. [Google Scholar] [CrossRef]
- Tabara, Y.; Takahashi, Y.; Kumagai, K.; Setoh, K.; Kawaguchi, T.; Takahashi, M.; Muraoka, Y.; Tsujikawa, A.; Gotoh, N.; Terao, C. , et al. Descriptive epidemiology of spot urine sodium-to-potassium ratio clarified close relationship with blood pressure level: the Nagahama study. J Hypertens 2015, 33, 2407–2413. [Google Scholar] [CrossRef]
- Kogure, M.; Nakaya, N.; Hirata, T.; Tsuchiya, N.; Nakamura, T.; Narita, A.; Suto, Y.; Honma, Y.; Sasaki, H.; Miyagawa, K. , et al. Sodium/potassium ratio change was associated with blood pressure change: possibility of population approach for sodium/potassium ratio reduction in health checkup. Hypertens Res 2021, 44, 225–231. [Google Scholar] [CrossRef]
- Hisamatsu, T.; Kogure, M.; Tabara, Y.; Hozawa, A.; Sakima, A.; Tsuchihashi, T.; Yoshita, K.; Hayabuchi, H.; Node, K.; Takemi, Y. , et al. Practical use and target value of urine sodium-to-potassium ratio in assessment of hypertension risk for Japanese: Consensus Statement by the Japanese Society of Hypertension Working Group on Urine Sodium-to-Potassium Ratio. Hypertens Res 2024, 47, 3288–3302. [Google Scholar] [CrossRef]
- Jane, M.; Hagger, M.; Foster, J.; Ho, S.; Pal, S. Social media for health promotion and weight management: a critical debate. BMC Public Health 2018, 18, 932. [Google Scholar] [CrossRef]
- Halling Ullberg, O.; Toivanen, S.; Tillander, A.; Bälter, K. Workplace health promotion to facilitate physical activity among office workers in Sweden. Front Public Health 2023, 11, 1175977. [Google Scholar] [CrossRef] [PubMed]
- Glowacki, E.M.; Centeio, E.E.; Van Dongen, D.J.; Carson, R.L.; Castelli, D.M. Health Promotion Efforts as Predictors of Physical Activity in Schools: An Application of the Diffusion of Innovations Model. J Sch Health 2016, 86, 399–406. [Google Scholar] [CrossRef]
- Symes, L.; Hadgraft, N.; Marsh, P.; Nuttman, S.; Kingsley, J. 'Surrounding yourself with beauty': exploring the health promotion potential of a rural garden appreciation group. Health Promot Int 2023, 38. [Google Scholar] [CrossRef]
- Kai, Y.; Fujii, Y.; Takashi, N.; Yoshiba, K.; Muramatsu-Noguchi, Y.; Noda, T.; Jindo, T.; Kidokoro, T.; Yajima, Y.; Kasuga, J. , et al. Promoting health and productivity management in small companies through outreach-based public-private partnership: the Yokohama Linkworker Project. Front Public Health 2024, 12, 1345771. [Google Scholar] [CrossRef]
- Yamagishi, K.; Iso, H. The criteria for metabolic syndrome and the national health screening and education system in Japan. Epidemiol Health 2017, 39, e2017003. [Google Scholar] [CrossRef]
- Nakamura, K.; Ogata, T. Locomotive Syndrome: Definition and Management. Clin Rev Bone Miner Metab 2016, 14, 56–67. [Google Scholar] [CrossRef]
- Tanaka, T.; Okamura, T.; Miura, K.; Kadowaki, T.; Ueshima, H.; Nakagawa, H.; Hashimoto, T. A simple method to estimate populational 24-h urinary sodium and potassium excretion using a casual urine specimen. J Hum Hypertens 2002, 16, 97–103. [Google Scholar] [CrossRef]
- Raphadu, T.T.; Mphekgwana, P.M.; Matshipi, M.; Monyeki, K.D. A Longitudinal Investigation on the Effects of Sodium and Potassium Intake on the Development of Hypertension and Abdominal Obesity from Childhood to Young Adulthood amongst Ellisras Rural Population, South Africa. Children (Basel) 2023, 10. [Google Scholar] [CrossRef]
- Mirmiran, P.; Gaeini, Z.; Bahadoran, Z.; Ghasemi, A.; Norouzirad, R.; Tohidi, M.; Azizi, F. Urinary sodium-to-potassium ratio: a simple and useful indicator of diet quality in population-based studies. Eur J Med Res 2021, 26, 3. [Google Scholar] [CrossRef]
- Eakin, E.G.; Lawler, S.P.; Vandelanotte, C.; Owen, N. Telephone interventions for physical activity and dietary behavior change: a systematic review. Am J Prev Med 2007, 32, 419–434. [Google Scholar] [CrossRef]
- Kimura, T.; Kobayashi, H.; Nakayama, E.; Kakihana, W. Seasonality in physical activity and walking of healthy older adults. J Physiol Anthropol 2015, 34, 33. [Google Scholar] [CrossRef]
- Mitsui, T.; Barajima, T.; Kanachi, M.; Shimaoka, K. Daily walking activity among male office workers in a rural town in northern Japan. J Physiol Anthropol 2010, 29, 43–46. [Google Scholar] [CrossRef]
Figure 1.
Flowchart of the classifications of participants.
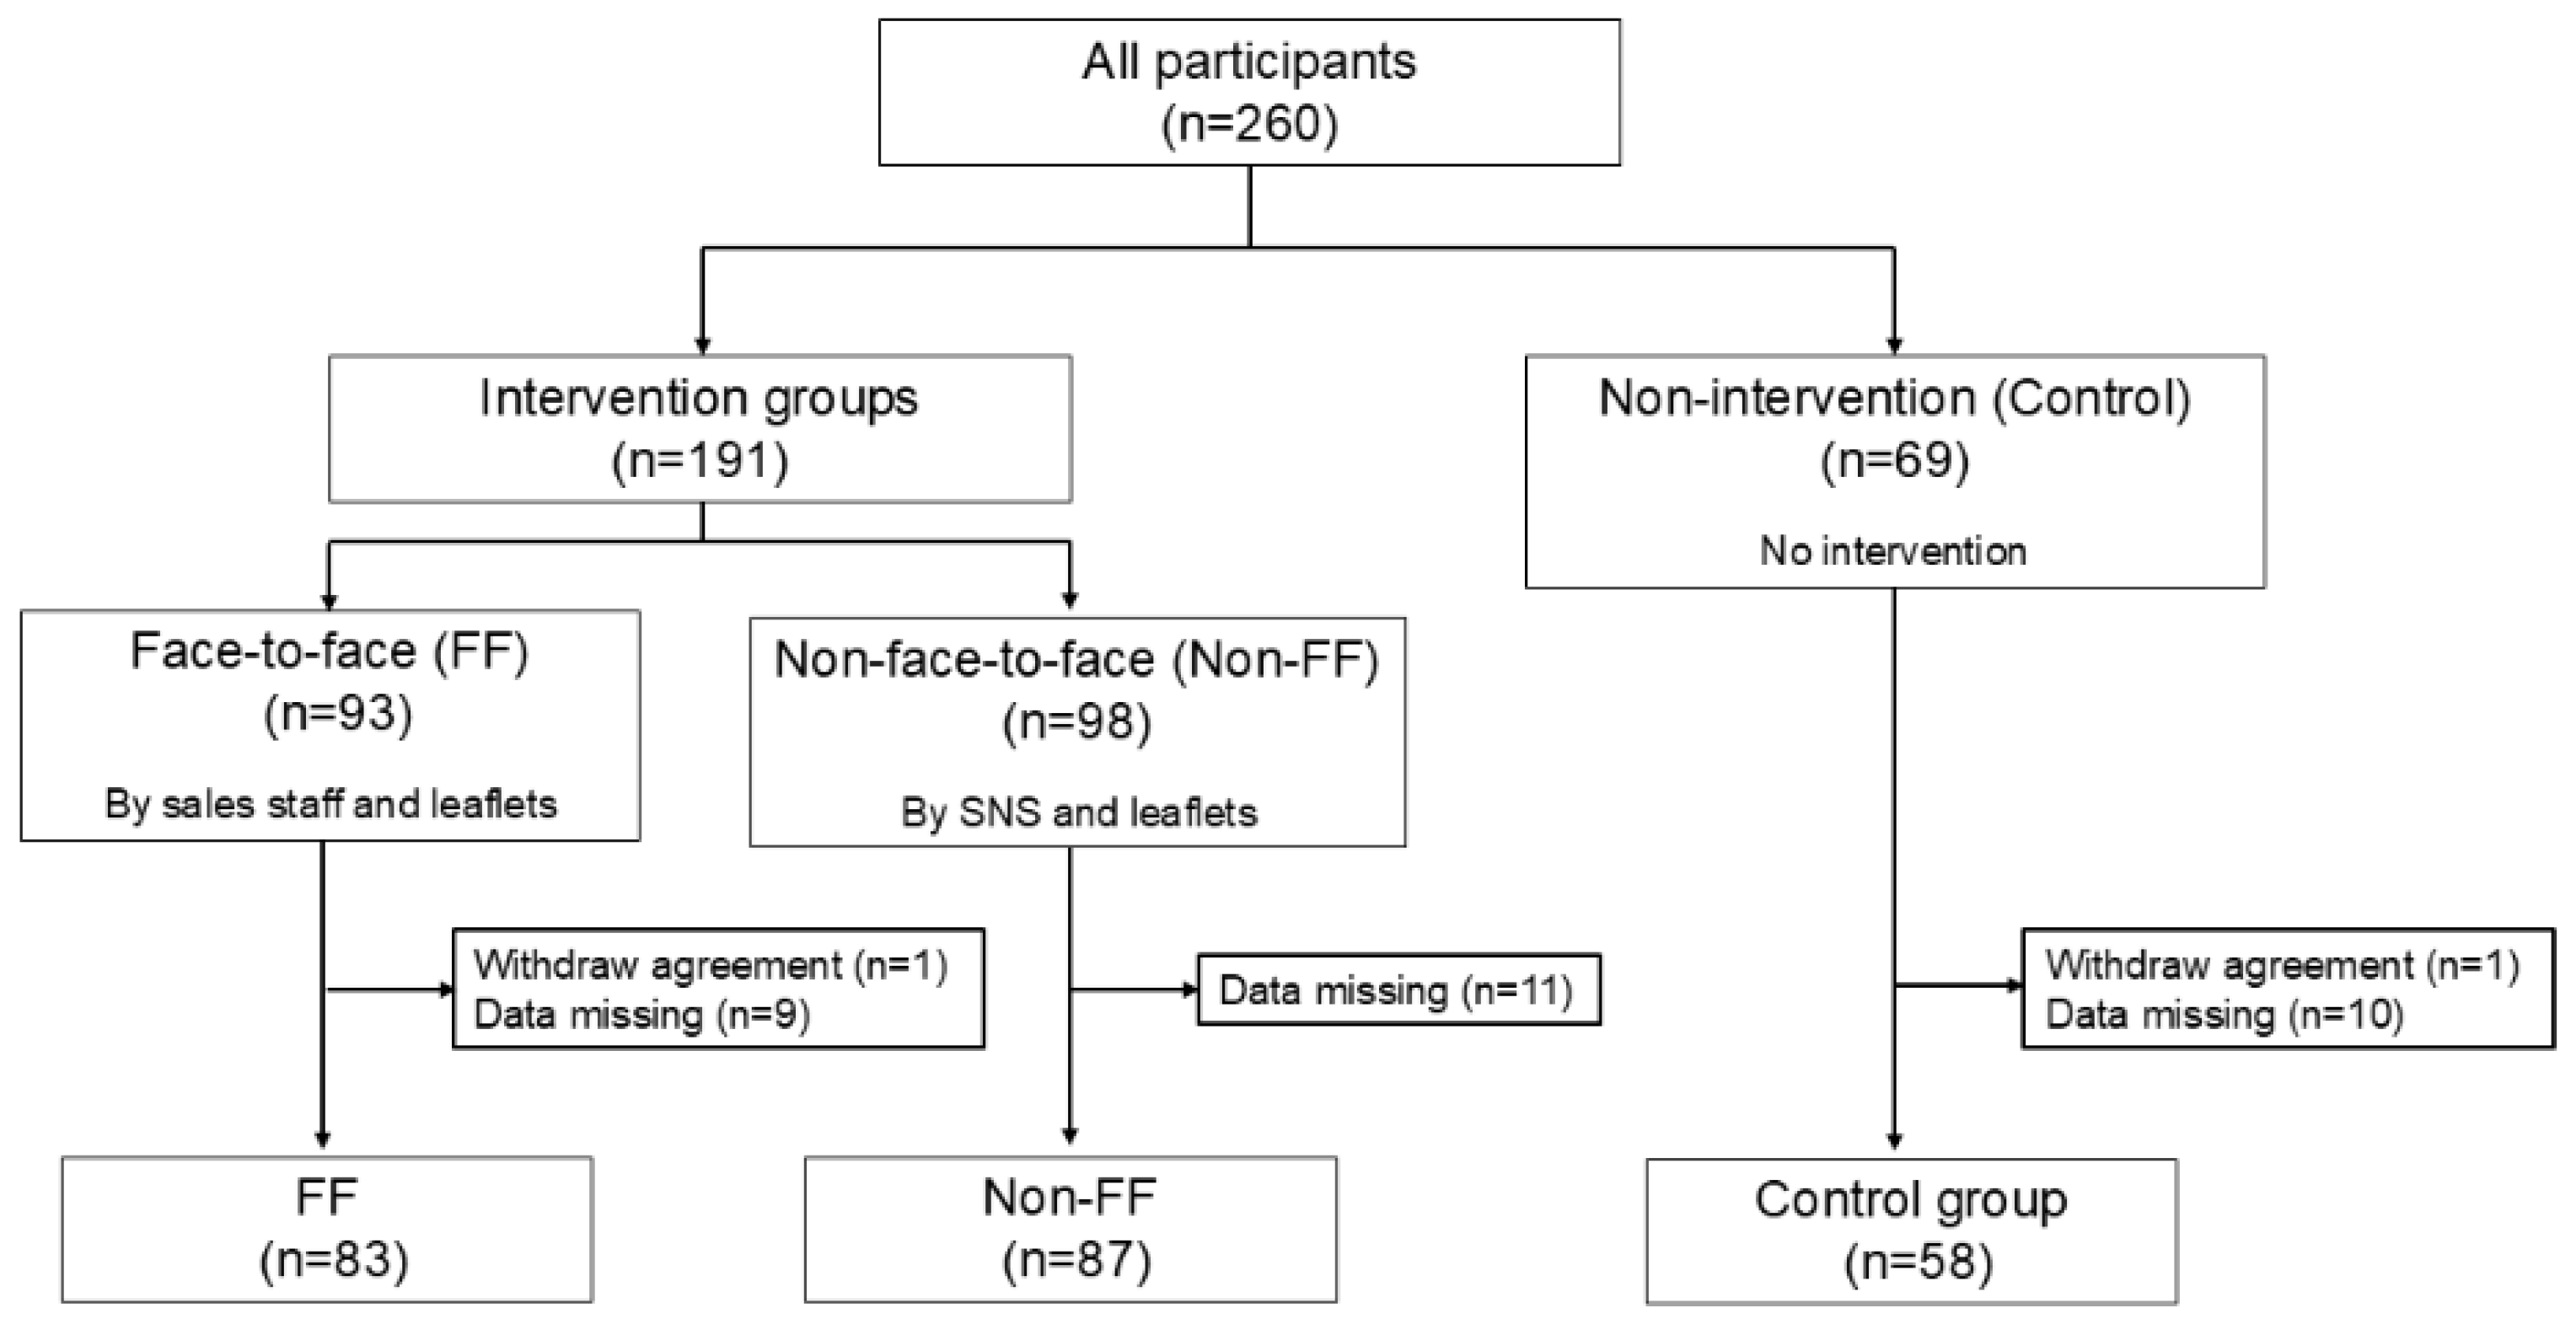
Figure 2.
Schematic diagram of an interventional trial. FF: a face-to-face intervention group, Non-FF: non-face-to-face intervention group, Control: control group (no-intervention group).
Figure 2.
Schematic diagram of an interventional trial. FF: a face-to-face intervention group, Non-FF: non-face-to-face intervention group, Control: control group (no-intervention group).
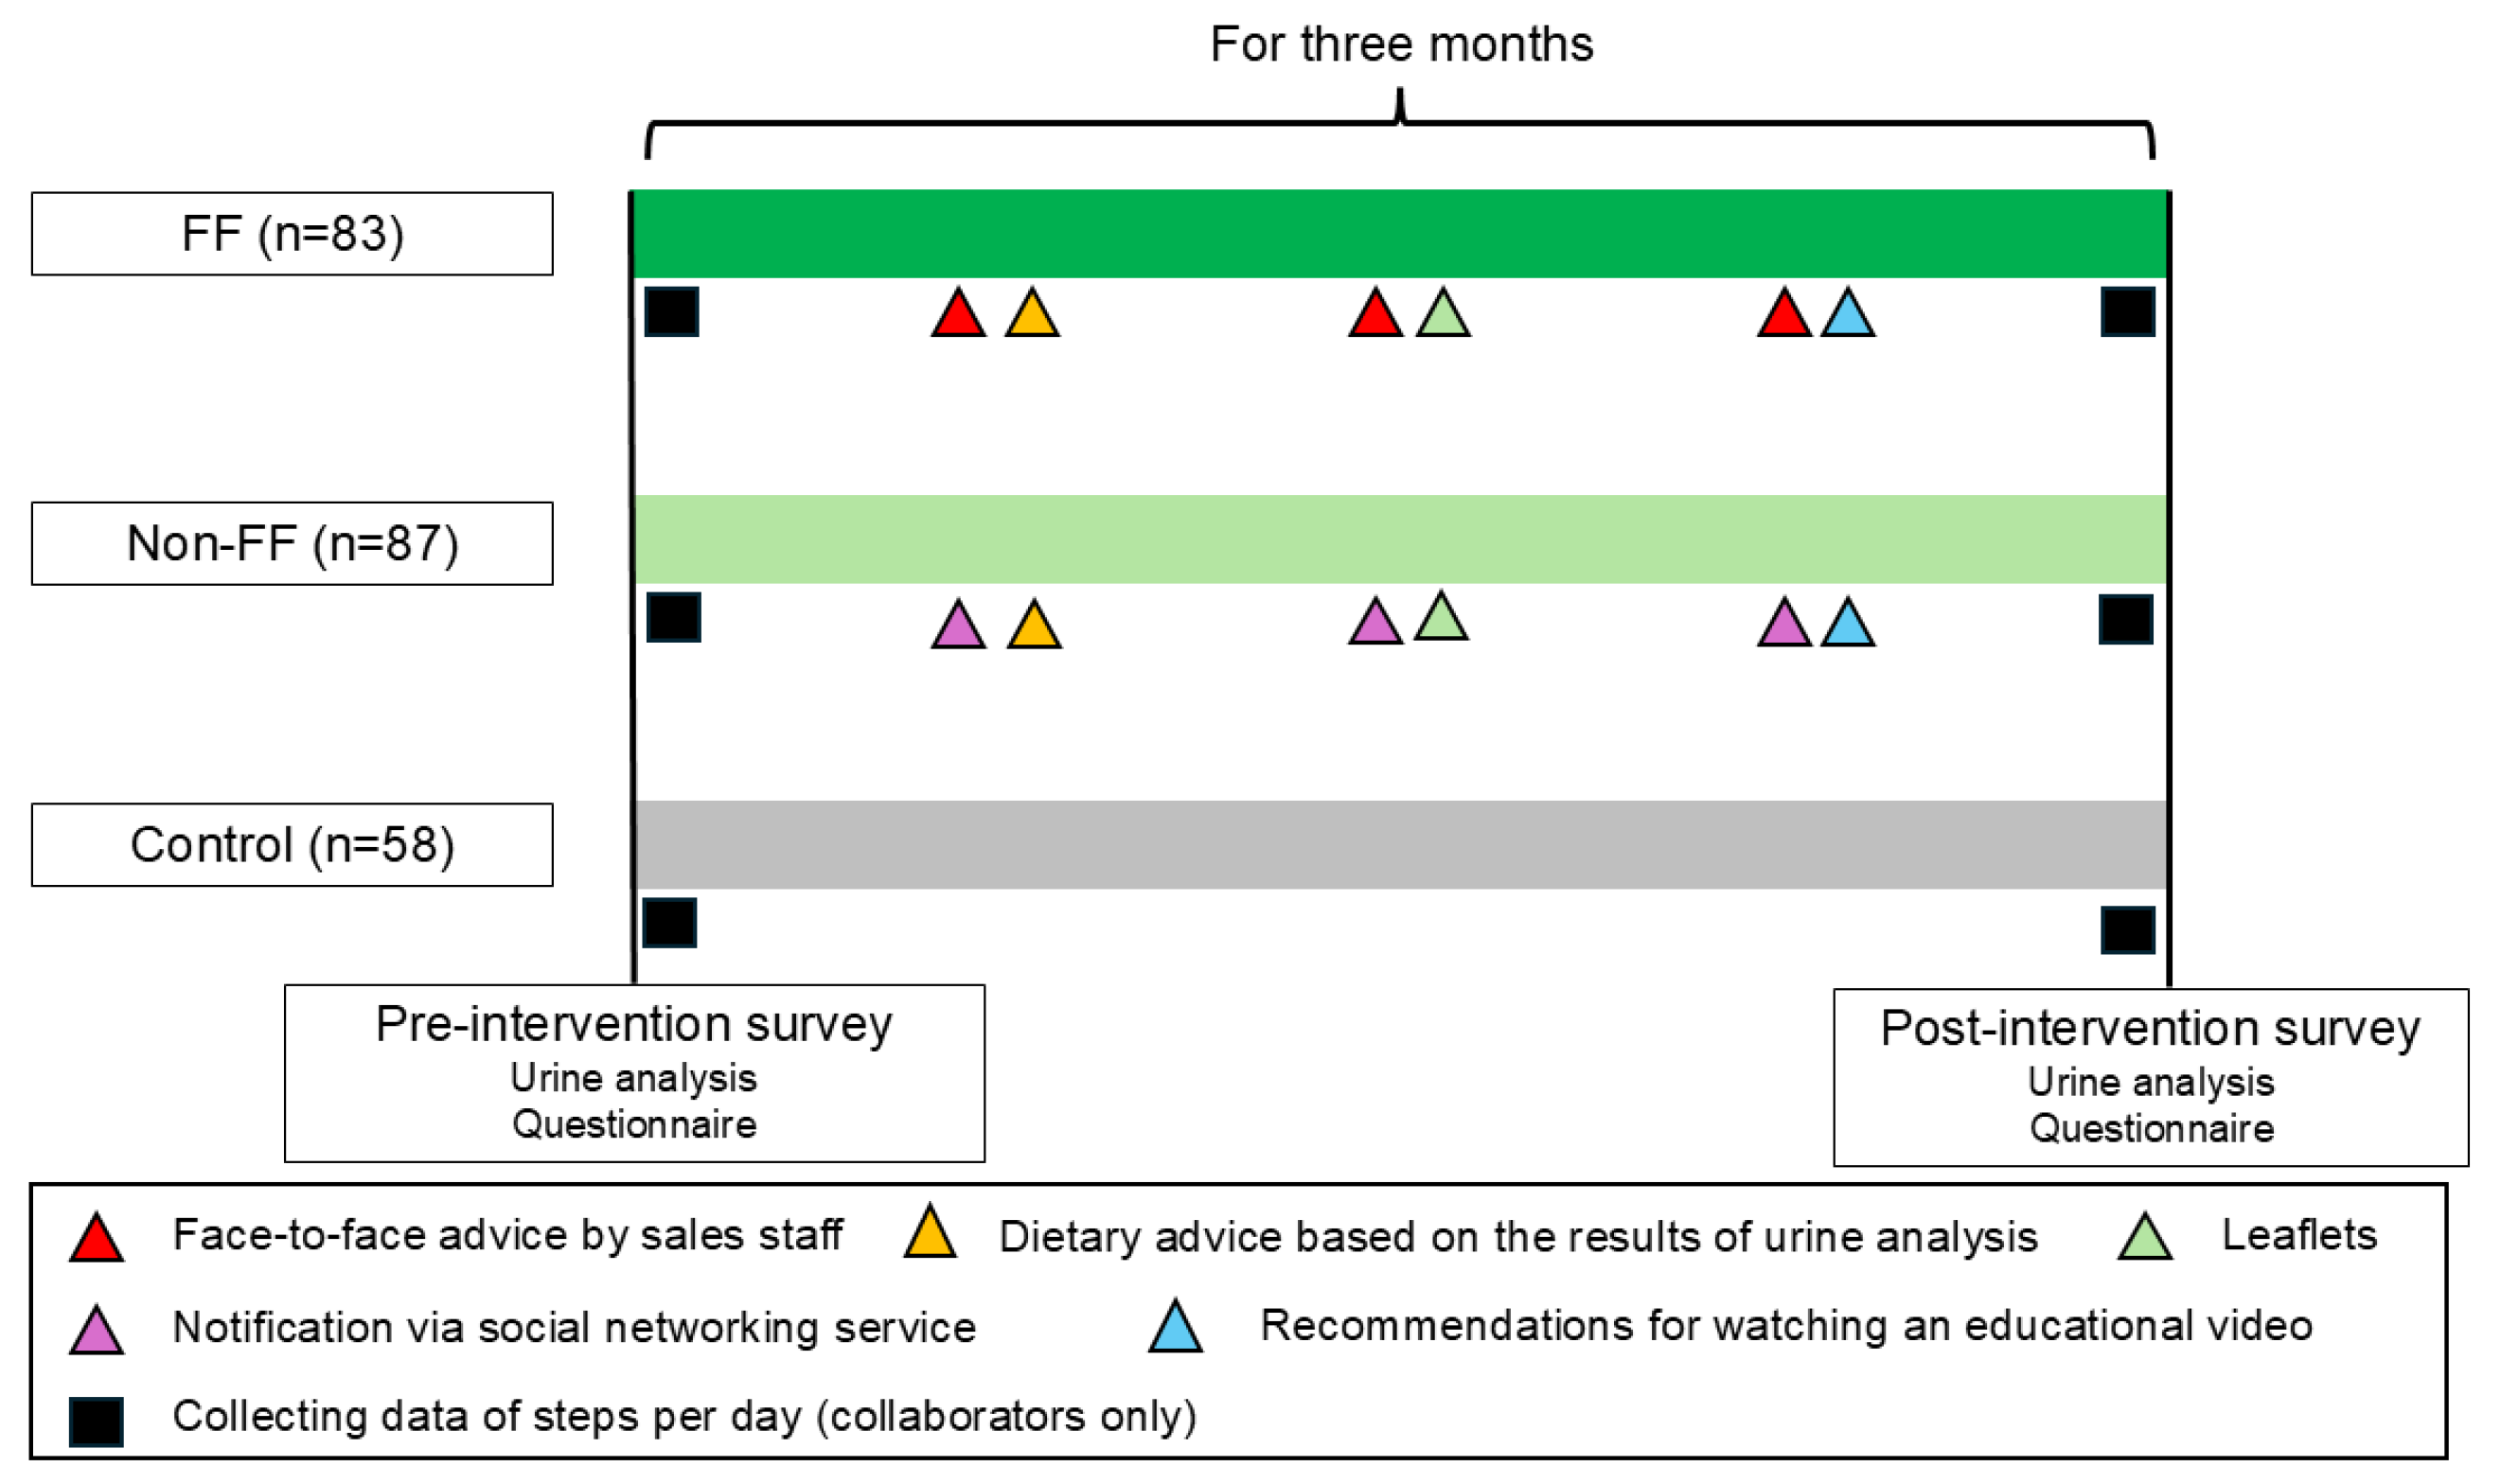
Figure 3.
The results of the urinary analysis. Pre: pre-intervention, Post: post-intervention, FF: a face-to-face intervention group, Non-FF: non-face-to-face intervention group, Control: control group (no-intervention group). *p < 0.05, **p < 0.01.
Figure 3.
The results of the urinary analysis. Pre: pre-intervention, Post: post-intervention, FF: a face-to-face intervention group, Non-FF: non-face-to-face intervention group, Control: control group (no-intervention group). *p < 0.05, **p < 0.01.
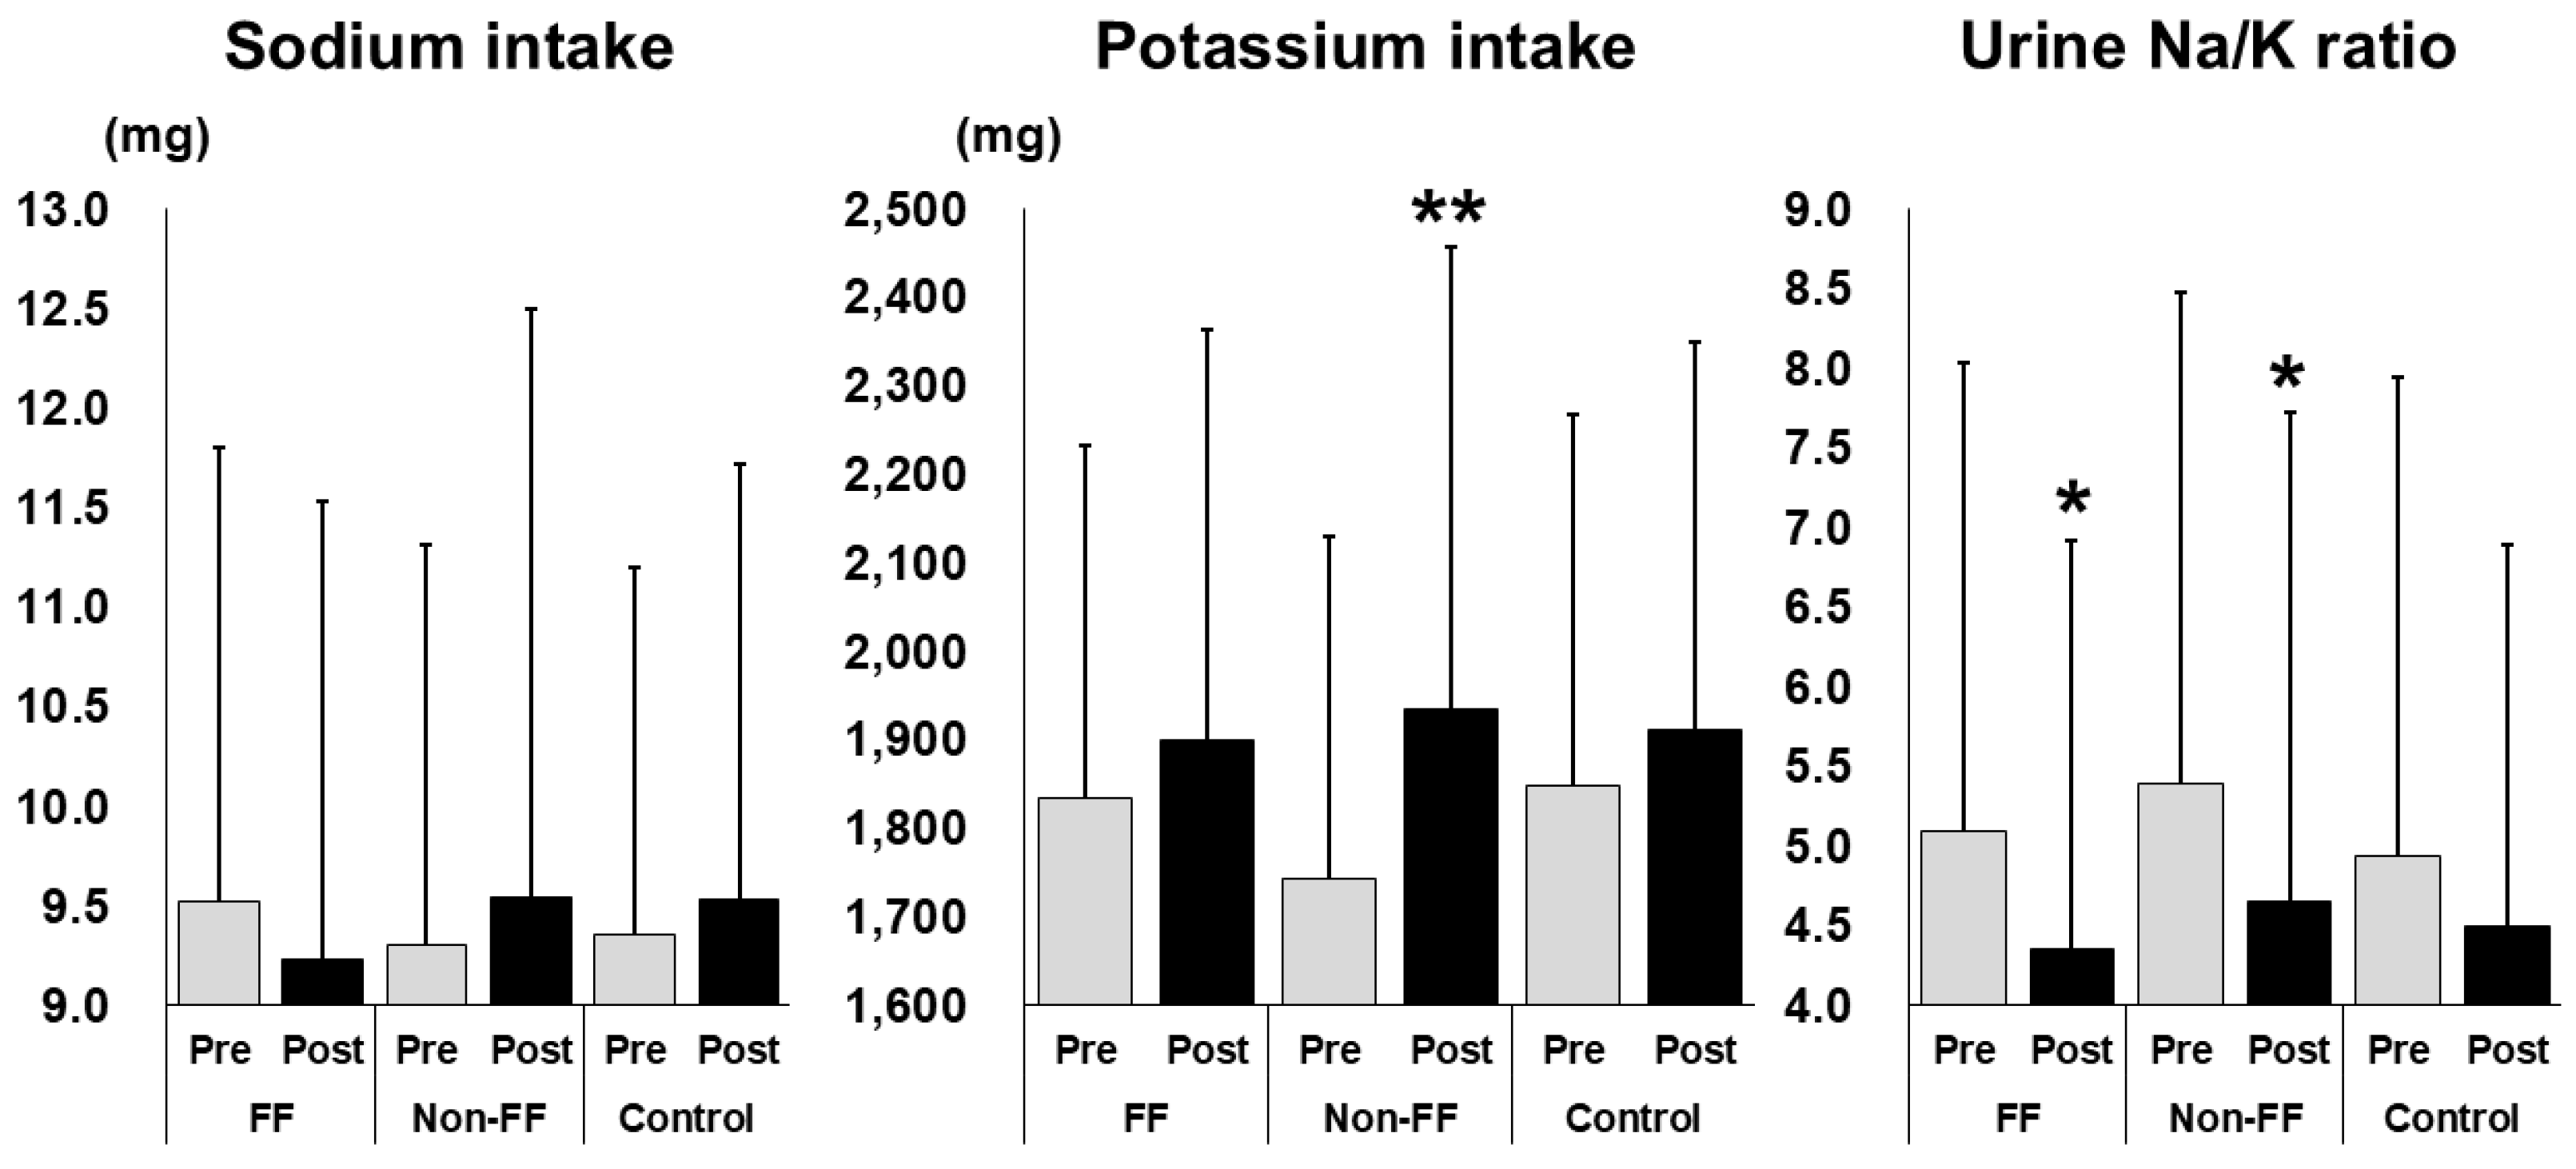

Table 1.
Lifestyle habit questionnaire items.
| Dietary behaviors |
| Awareness of avoiding excessive energy intake |
| Awareness of avoiding excessive salt intake |
| Awareness of avoiding excessive fat intake |
| Awareness of adequate intake of potassium, vitamins, minerals, and fiber |
| Awareness of adequate carbohydrate intake |
| Locomotor activities |
| Awareness of performing physical exercises and stretching |
| Awareness of regularly standing, moving, and stretching |
| Awareness of performing aerobic exercise (walking, running, aerobics) |
| Awareness of performing strength training |
| Awareness of daily activities, such as using stairs, doing squats during short breaks |
Table 2.
Occupations of participants.
| FF (n = 83) |
Non-FF (n = 87) |
Control (n = 58) |
|
|---|---|---|---|
| Professional/technical workers | 18 | 21 | 14 |
| Manager | 5 | 1 | 5 |
| Clerk | 16 | 19 | 15 |
| Sales worker | 3 | 11 | 3 |
| Service worker | 10 | 17 | 8 |
| Security worker | 2 | 1 | 3 |
| Construction and civil engineering | 4 | 2 | 1 |
| Agriculture | 0 | 0 | 0 |
| Forestry | 0 | 0 | 0 |
| Fishing | 0 | 0 | 0 |
| Transport and communications | 7 | 9 | 3 |
| Production process and laborers | 7 | 0 | 4 |
| Housewives | 0 | 1 | 0 |
| None | 2 | 1 | 0 |
| Others | 9 | 4 | 2 |
Data are presented as the number of individuals.
Table 3.
Baseline characteristics of participants. Values are presented as means ± standard deviations.
Table 3.
Baseline characteristics of participants. Values are presented as means ± standard deviations.
| FF (n = 83) |
Non-FF (n = 87) |
Control (n = 58) |
p value | |
|---|---|---|---|---|
| Male (percentage) |
54 (65.0%) |
50 (57.4%) |
41 (70.6%) |
0.253 |
| Age (years) | 43.9 ± 10.0 | 43.4 ± 10.9 | 43.4 ± 10.1 | 0.983 |
| BMI (kg/m2) | 25.2 ± 4.5 | 24.3 ± 4.7 | 26.0 ± 4.0 | 0.041* |
| Sodium intake (mg) | 9.52 ± 2.28 | 9.307± 2.00 | 9.35 ± 1.84 | 0.942 |
| Potassium intake (mg) | 1835.5 ± 396.5 | 1743.0 ± 386.8 | 1849.2 ± 419.0 | 0.167 |
| Urine Na/K ratio | 5.10 ± 2.93 | 5.39 ± 3.08 | 4.94 ± 3.00 | 0.658 |
| < 2.0 | 8 | 3 | 5 | |
| ≧ 2.0, < 4.0 | 27 | 30 | 20 | |
| ≧ 4.0 | 48 | 54 | 33 | |
| Present treatment of lifestyle disease | 20 | 22 | 20 | 0.347 |
| Past treatment of lifestyle disease | 21 | 22 | 17 | 0.835 |
| Previous suggestions of hypertension | 16 | 22 | 58 | 0.560 |
| Total scores in the lifestyle questionnaire | ||||
| Dietary behavior | 13.1 ± 4.6 | 13.6 ± 4.4 | 13.7 ± 4.5 | 0.624 |
| Locomotor activity | 15.0 ± 5.0 | 14.7 ± 4.9 | 15.0 ± 4.8 | 0.328 |
| Number of participants who cooperated with step counting (percentage) | 33 (39.7%) |
46 (52.8%) |
26 (44.8%) |
|
| Steps per day | 3825.8 ± 2446.8 | 4876.9 ± 3080.8 | 4397.0 ± 2970.2 | 0.328 |
Data are presented as the number of individuals or means ± standard deviation. BMI, body mass index. * p < 0.05.
Table 4.
Difference between groups with decreased and the non-decreased urinary sodium/potassium (Na/K) ratios.
Table 4.
Difference between groups with decreased and the non-decreased urinary sodium/potassium (Na/K) ratios.
| Urine Na/K ratio | ||||
|---|---|---|---|---|
| Decreased (n =128) |
Not decreased (n = 100) |
P value | ||
| Interventional groups | ||||
| FF | 51 | 32 | ||
| Non-FF | 49 | 38 | 0.300 | |
| Control | 28 | 30 | ||
| Age | 43.0 ± 10.6 | 44.3 ± 9.9 | 0.324 | |
| Sex | ||||
| Male | 82 | 63 | 0.869 | |
| Female | 46 | 37 | ||
| BMI | 24.8 ± 4.4 | 25.3 ± 4.6 | 0.478 | |
| Past treatment of lifestyle disease | 29 | 31 | 0.156 | |
| Present treatment of lifestyle disease | 33 | 29 | 0.588 | |
| Recent suggestion of hypertension | 30 | 23 | 0.938 | |
| Total scores in lifestyle questionnaire (baseline) | ||||
| Dietary behaviors | 13.2 ± 4.4 | 13.8 ± 4.6 | 0.435 | |
| Locomotor activities | 15.1 ± 5.0 | 14.6 ± 4.9 | 0.382 | |
| The number of participants who answered the post-interventional questionnaire |
224 | 224 | ||
| Whether the leaflets had been read | ||||
| Almost all/partially | 92 | 68 | 0.458 | |
| None | 33 | 31 | ||
| Whether the video had been watched | ||||
| Almost all/partially | 82 | 50 | 0.029* | |
| None | 43 | 49 | ||
| Affected by | ||||
| Urinalysis | 96 | 67 | 0.134 | |
| Leaflets | 63 | 46 | 1.000 | |
| Video | 58 | 37 | 0.842 | |
Data are presented as the number of individuals or means ± standard deviation. BMI, body mass index. * p < 0.05.
Table 5.
Results of the multiple logistic regression analysis.
| Constant | Partial regression coefficient | Significant probability | Odds ratio | 95% confidence interval | |
|---|---|---|---|---|---|
| Watched the educational video | –0.131 | 0.625 | 0.023* | 1.869 | 1.089–3.206 |
*p < 0.05.
Table 6.
Changes among participants who watched the educational video.
| Pre-intervention | Post-intervention | p value | |
|---|---|---|---|
| Sodium intake | 9.44 ± 2.00 | 9.36 ± 2.61 | 0.482 |
| Potassium intake | 1786.4 ± 401.5 | 1920.3 ± 506.4 | 0.007* |
| Urine Na/K ratio | 5.28 ± 2.85 | 4.49 ± 2.83 | 0.001** |
| BMI | 24.5 ± 4.6 | 24.6 ± 4.6 | 0.476 |
| Total points of dietary behavior | 13.3 ± 4.3 | 14.9 ± 3.7 | <0.001** |
| Total points of locomotor activity | 14.6 ± 5.0 | 13.9 ± 4.6 | 0.045* |
| Numbers of individuals who answered the question on the number of steps (percentage) | 63 (47.4%) |
59 (44.6%) |
|
| Steps per day | 4542.9 ± 2940.6 | 4483.7 ± 3124.3 | 0.590 |
Data are presented as means ± standard deviation. BMI, body mass index. *p < 0.05, **p < 0.01.
Table 7.
Differences between participants who watched and did not watch the educational video.
| Watched (n =132) |
Did not watch (n = 92) |
p value | |
|---|---|---|---|
| Age | 44.1 ± 10.7 | 42.8 ± 9.7 | 0.305 |
| Sex | |||
| Male | 82 | 61 | 0.573 |
| Female | 50 | 31 | |
| BMI (baseline) | 24.5 ± 4.6 | 25.8 ± 4.2 | 0.018* |
| BMI (after the intervention period) | 24.6 ± 4.6 | 25.8 ± 4.3 | 0.021* |
| Past treatment of lifestyle disease | 31 | 25 | 0.530 |
| Present treatment of lifestyle disease | 33 | 28 | 0.369 |
| Recent suggestion of hypertension | 28 | 22 | 0.530 |
| Recent suggestion of other lifestyle diseases | 63 | 55 | 0.075 |
| The type of intervention | |||
| Face-to-face | 62 | 20 | 0.251 |
| Non-face-to-face | 70 | 14 |
Data are presented as means ± standard deviation. BMI, body mass index. *p < 0.05.
Disclaimer/Publisher’s Note: The statements, opinions and data contained in all publications are solely those of the individual author(s) and contributor(s) and not of MDPI and/or the editor(s). MDPI and/or the editor(s) disclaim responsibility for any injury to people or property resulting from any ideas, methods, instructions or products referred to in the content. |
© 2025 by the authors. Licensee MDPI, Basel, Switzerland. This article is an open access article distributed under the terms and conditions of the Creative Commons Attribution (CC BY) license (http://creativecommons.org/licenses/by/4.0/).
Copyright: This open access article is published under a Creative Commons CC BY 4.0 license, which permit the free download, distribution, and reuse, provided that the author and preprint are cited in any reuse.


