
Submitted:
12 June 2023
Posted:
12 June 2023
You are already at the latest version
Abstract
Low-sodium salt substitute (LSSS) has the potential in regulating sodium and potassium intake and has been available in China market for years. However, its real-world use and impact to sodium\potassium intake is unclear. Baseline data of 4000 adult participants who participated in three similar-designed randomized controlled trails were pooled together for this study. Self-reported awareness and use of LSSS were collected using the uniform questionnaire, and the 24-h urinary sodium and potassium excretion was used to estimate their dietary intake. Mixed-effects models were developed to assess the relationship between LSSS and 24-h urinary sodium and potassium excretion. 32.0% of the participants reported awareness of LSSS and 11.7% reported its current use. After adjusting location, sex, age, and education, compared with the group of participants unaware of LSSS, participants who were aware but not using LSSS and those who were using LSSS had a lower 24-h urinary sodium excretion by –356.1(95% CI: –503.9, –205.9) mg/d and –490.6(95% CI: –679.2, –293.7), respectively (p<0.001). No significant difference was found for 24-h urinary potassium excretion and sodium-to-potassium ratio among the three groups (p>0.05). In conclusion, although associated with lower sodium intake, the awareness and real-world use of LSSS are still very low in China.
Keywords:
low-sodium salt substitutes (LSSS)
; 24-h urinary sodium excretion
; 24-h urinary potassium excretion
; sodium-to-potassium ratio
1. Introduction
Cardiovascular diseases are the leading cause of death among the Chinese population, and hypertension is the main risk factor for cardiovascular diseases[1]. Evidence has shown that excessive sodium intake and insufficient potassium intake were both crucial dietary factors in raising blood pressure [2,3,4]. WHO recommends that adults consume <2000mg/d sodium and >3510mg/d potassium to reduce the risk of chronic diseases[5,6]. However, due to traditional dietary habits, individuals consume more than twice of the recommended sodium intake and less than half of the recommended potassium intake in China[7].
Several studies have supported that the use of low-sodium salt substitutes (LSSS) was an effective intervention to reduce dietary sodium intake and increase potassium intake[4,8]. In a trial in rural areas of northern China, after 5 years of follow-up, it was found that the mean 24-h urinary sodium excretion was reduced by 350 mg and the 24-h urinary potassium excretion was increased by 803 mg in the LSSS group compared to the normal salt group[9]. A review showed that LSSS compared to regular salt probably increase blood potassium slightly 0.12 mmol/L, and reduce diastolic blood pressure and systolic blood pressure by an average of 2.43 mmHg and 4.76 mmHg, respectively[10]. LSSS reduces the amount of sodium chloride, most commonly by replacing it with potassium chloride or magnesium sulfate[11]. The composition of LSSS may vary from country to country due to taste and acceptability[12,13]. For example, LSSS produced in India contains less than 20% potassium chloride, while in countries in North America, the Middle East, and Latin America, potassium chloride accounts for at least 50%, and in the United States and Canada, it may account for 100% (sodium-free) [14,15]. The proportion of potassium chloride in LSSS is from 25% to 30% in China[15].
The Chinese government has issued a series of policies to reduce salt intake[16]. At the national level, initiatives such as the China Healthy Life for All campaign[17] and National Nutrition Week[18] have been launched, both of which regard salt reduction as an important theme. In the Healthy China Action[16], it is clearly proposed to encourage enterprises to produce and sell LSSS, and to promote the use of LSSS under the guidance of experts. The Action also proposes to carry out pilot work to promote LSSS in areas where conditions permit[16]. Regionally, some measures have been taken to promote LSSS in Beijing in 2009, such as setting up designated areas in supermarkets or shops for foods with less salt, and rewarding consumers with an additional 75g of LSSS for every 400g they purchased[19]. What’s more, the Government of Shandong Province and the National Health and Family Planning Commission (formerly Ministry of Health) collaboratively launched the SMASH project in 2011, introducing interventions (i.e., promotion of LSSS and low-salt foods to consumers, and public awareness campaigns) to reduce sodium intake across the province[20]. It has shown that after 5 years of intervention, sales of LSSS have increased eight-fold in Shandong, which accounted for more than a quarter of sales of small package retail salt[20].
However, the real-world use of LSSS in China and its impact to sodium and potassium intake is unclear. In this study, we used a large sample across 6 provinces in the eastern, central, and western regions, aiming to assess the awareness and use of LSSS in a natural population in China and to explore its association with 24-h sodium and potassium excretion, and sodium-to-potassium ratio.
2. Materials and Methods
This is a cross-sectional study based on a pooled baseline data of three similar-designed and parallel-conducted randomized controlled trails under Action on Salt China.
2.1. Study Design and Participants
Action on Salt China (ASC) [21] included three randomized controlled trials: Community-based comprehensive salt reduction intervention study (CIS) [22], Home cook salt reduction intervention study (HIS) [23], and App-based salt reduction program for primary school children and their families (AIS) [24], which were similar-designed and parallel-conducted. Participants in these three studies were recruited from six provinces (Qinghai, Hebei, Heilongjiang, Sichuan, Jiangxi, and Hunan) in the eastern, central, and western regions in China, where no salt-related intervention studies had ever been conducted. Among these three RCTs, participants who were unable or refused to provide 24-h urine samples were excluded from the study. Eventually, CIS involved 2693 participants in 12 project counties, HIS involved 1576 participants in 6 project counties, and AIS involved 1184 adults in 3 cities. All the adult participants who completed the baseline survey were pooled together for this study.
Self-reported awareness and use of LSSS were collected using uniform questions. In CIS, only one adult was randomly selected from each family. In HIS and AIS, two adults were recruited from each family. In order to avoid reporting bias between the family members, only the family chef was selected in HIS and the adult who answered affirmatively to the LSSS awareness question was selected in AIS (i.e., “yes/no” instead of “unknown”, “yes” instead of “no”, or randomly selected if the answers were the same).
2.2. Survey Instrument
CIS, HIS, and AIS used the same questionnaire, which included basic information (i.e., sex, age, and education level) and 12 questions closely related to salt, covering three dimensions of knowledge (3 questions), attitude (3 questions), and behavior (6 questions). It mainly included the recommended maximum level of salt intake per day, whether they have heard of LSSS, whether they were using LSSS, their willingness to reduce salt, and the frequency of consumption of high-salt foods, (see the questionnaire at Appendix A). All answers were self-reported by participants.
2.3. Definition of Variables
The urine collection was excluded if the urine collection lasted <20 hours or >28 hours[7]. If the creatinine was less than 4.0 mmol for females or 6.0 mmol for males, it was also excluded[25,26]. 24-h urinary sodium/potassium excretion (mg/d) was calculated as the concentration (mmol/L) multiplied by molecular weight (sodium,23 mg/mmol; potassium, 39.1 mg/mmol). Sodium-to-potassium ratio was calculated as sodium concentration (mmol/L) divided by potassium concentration (mmol/L)[7].
Blood pressure (BP) was calculated from the average of the last 2 of the 3 measurements. Hypertension was defined as mean systolic BP (SBP) ≥140 mm Hg or mean diastolic BP (DBP) ≥90 mm Hg or self-reported use of antihypertensive drugs in the last 2 weeks.
Participants were divided into “Aware” and “Unaware” groups according to the answers (yes/no) to the question “If ever heard of low-sodium salt?”, and the “Aware” group was further divided into “Aware and using” and “Aware but not using” group if the answer to question “Are you using low-sodium salt?” is “Yes” or “No/Unknown”, respectively. Age was combined into three groups, i.e., 18-44, 45-59, and ≥60. Education levels were divided into three categories, low was defined as primary school education or less (0-6 years), medium was defined as junior high school education (7-9 years), and high was defined as senior high school or above (≥10 years).
2.4. Statistical Analysis
Mean and SD was used to describe continuous variables and frequency and percentage for categorical variables. A series of χ2 tests were carried out to compare the awareness and use of LSSS among demographic groups. The ANOVA were used to compare the differences in 24-h sodium and potassium excretion and sodium-to-potassium ratio among different LSSS awareness and use groups. Due to the large sample size, we used Cohen’s f to assess the effect size for ANOVA[27]. When Cohen’s f >0.1, we considered the difference to be significant[27]. Considering that the participants might have heterogeneity in the three trials and clusters (communities), we established mixed effect models to analyze the relevant factors affecting the awareness and use of LSSS by defining the random effects of trials and community level. The models were established when examining the relationship between the awareness and use of LSSS and 24-h urinary sodium and potassium excretion, and sodium-to-potassium ratio. All data were collated and analyzed using the R 4.2.0.. A p-value of <0.05 was considered statistically significant.
3. Results
The three RCTs recruited 5453 participants, and 4073 participants were selected from different families. Excluding 73 participants for incomplete 24-h urine collection, we included 4000 participants in our study (Figure 1).
Of the 4000 participants, 81.9% were from rural areas, 57.3% were females, and the mean age was 49.0(SD=12.8) years. The average SBP and DBP were 125.8(SD=19.3) mm Hg and 79.2(SD=11.4) mm Hg and more than one-third (33.9%) had hypertension. The average 24-h urinary sodium excretion was 4333.9 (SD=1783.7) mg/d, which was equivalent to the salt intake of 10.8 (SD=4.5) g/d. The average 24-h urinary potassium excretion was 1573.0 (SD=635.8) mg/d and sodium-to-potassium ratio was 5.1 (SD=2.3) (Table 1).
Among the participants, 32.0% were aware of or reported ever heard of LSSS, 11.7% were aware of and using LSSS, while 20.3% were aware of but not using LSSS. For different demographic characteristics, participants living in cities had higher awareness and use rate of LSSS than participants living in rural areas. In terms of different age groups, the awareness and use of LSSS were the highest among participants in the 18-44 years old group, which was higher than that in 45-60 years and over 60 years. The higher the education level, the higher the awareness and use of LSSS. Participants with normal blood pressure had a higher awareness and use of LSSS than those with hypertension (all p<0.001). However, there was no difference in the awareness and use of LSSS between males and females (p>0.05) (Table 2).
The participants who were aware and using or not using LSSS had better salt-related knowledge, attitude, and behavior (KAB) than those who were unaware of LSSS (Appendix Table A1).
The average 24-h urinary sodium excretion of participants who were aware and using LSSS was 3877.1 (SD=1416.0) mg/d, those who aware but were not using LSSS was 4045.1 (SD=1624.2) mg/d, and those who did not know low sodium salt was 4498.7 (SD=1860.3) mg/d, with a significant difference between the three groups (Cohen's f > 0.1). However, there was no difference in the 24-h urinary potassium and sodium-to-potassium ratio among the three groups, respectively (Cohen's f < 0.1) (Table 3).
Mixed effect models showed that there was still a strong correlation between participants' awareness and use of LSSS and 24-hour urinary sodium after adjusting location, sex, age, and education (p<0.001). Compared with the unaware group, participants who were aware but not using LSSS had a lower 24-h urinary sodium excretion by –356.1(95% CI: –503.9, –205.9) mg/d. And those who were aware and using LSSS had a lower 24-h urinary sodium excretion by –490.6(95% CI: –679.2, –293.7) mg/d (p<0.001) (Table 4).
4. Discussion
Our study, for the first time, investigated the use of LSSS in real-world China and the association with 24-h urinary sodium and potassium excretion and sodium to potassium ratio. Above all, nearly one-third of participants were aware of LSSS, and only 11.7% were using it at home. The use of LSSS was associated with significant reduction of 24-h urinary sodium intake by 490.6 mg/d, but not associated with significant change for the 24-h urinary potassium and sodium-to-potassium ratio.
Based on previous studies, awareness and use of LSSS varied widely in different studies. For example, the results of Chen's survey in six regions, including Beijing, Liaoning, Hebei, Shandong, Guangzhou and Chongqing, showed that the participants' awareness and use of LSSS were 85.0% and 36.5%[28], while the results of YOU's survey in Shunyi District of Beijing showed that the participants' awareness and use of LSSS were 41.4% and 37.4%[29], while Neal's survey in rural areas of five provinces, including Hebei, Liaoning, Ningxia, Shanxi and Shaanxi, showed that the participants' awareness and use were 5.9% and 1.4%, respectively[14]. The LSSS promoted by some cities or provinces but not by the central government might be the key reason.
Evidence has revealed that lack of knowledge, unavailable or not easily available, with little health benefits, and higher costs were identified as barriers to the use of LSSS[29,30]. Consistent with previous studies, participants who lived in rural areas, those with low education levels, and the elderly had lower use of LSSS than others[31,32]. What’s more, the price of LSSS sold in supermarkets was about 1.5-2 times that of regular salt in China [15,33]. A previous study has shown that the use of LSSS was twice as much in villages that purchased LSSS with a subsidy as in villages without price subsidies, even giving the same health education measures[34]. In China, government subsidy could be the important strategy to increase the use of LSSS.
Participants who were aware and using LSSS reduced their 24-h urinary sodium excretion, which was in line with the findings of other studies [34]. We also found that individuals with higher awareness of LSSS tend to have more broad salt reduction knowledge and behavior, and another study conducted in Fan also had similar finding, i.e. people having more knowledge tend to adopt healthier diet practices[35]. Additionally, Chinese cooking methods are relatively complicated, the chefs may use salt and large amounts of soy sauce, monosodium glutamate, and bean paste during cooking and preparation to make the dishes colorful and to enhance overall taste and presentation[36,37]. At the same time, several studies had shown that males, young people, and well-educated were increasingly dependent on food cooked in restaurants[28,38,39,40]. Hence, it was difficult to measure the role of LSSS in reducing 24-h urinary sodium excretion. Nevertheless, the continuous promotion of LSSS and health education may be the most cost-effective way to reduce salt intake in China.
However, contrary to other studies, there was no difference in 24-h urinary potassium excretion among the three groups[34]. Based on previous studies, it is estimated that around 60% of dietary salt comes from home cooking, and around 70% of dietary salt during home cooking comes from cooking salt[41]. Assuming that there was no other change in the diet, even if LSSS was the only salt used by a family, the increased potassium intake would be about 60%*70%*(25%-30%) = 10%-12%, equivalent to 1680-1710 mg/d[15]. However, our study found that the average potassium excretion of those who used LSSS didn’t reach this level. This suggests that further research is needed to explore whether the use of LSSS can increase potassium intake in real world.
This study has a number of strengths. Firstly, our study pooled the data from over 4000 participants across six provinces in the eastern, central, and western regions in China. Most participants were recruited in rural areas in China where much salt in the diet was from cooking or condiment use and where LSSS had the greatest potential to reduce salt intake. Secondly, this study carried out 24-h urine collection and urinary sodium and potassium tests, which were used to accurately assess salt intake at the population level. Thirdly, our study, for the first time, assessed the relationship between the use of LSSS and 24-h urinary sodium excretion in the real world.
This study has three limitations: first, the awareness and use of LSSS were self-reported by participants, which may underestimate or overestimate the actual awareness and use of LSSS. Besides, this was a cross-sectional analysis, and it was impossible to infer the causal relationship between LSSS and 24-h urinary sodium and potassium excretion, and sodium-to-potassium ratio. Nor could we measure the extent to which the reduction in 24-h urinary sodium can be attributed to LSSS.
5. Conclusions
In conclusion, despite major educational efforts by governmental and medical sectors, the individuals who were using LSSS only accounted for one-tenth in China. However, this study also found that there was a strong negative correlation between the use of LSSS and 24-h urinary sodium excretion in the real world. The main sources of dietary sodium for Chinese residents are cooking salt and condiments. Conventional health education and the strategy of target-setting, which is widely used in the West, are not effective. According to the WHO salt reduction report, in countries like China where cooking salt is the main source of sodium, it is necessary to explore innovative salt reduction strategies, especially the use of low sodium salt. Therefore, it is suggested that the use of LSSS should be incorporated into the salt reduction strategy and promoted as an important strategy.
Supplementary Materials
The following supporting information can be downloaded at the website of this paper posted on Preprints.org, Appendix A: The questionnaire used by CIS, HIS and AIS, the three randomized controlled trails underpinning the study; Appendix Table A1: Knowledge, attitude and practice (KAP) towards salt reduction among people with different LSSS awareness and using status.
Author Contributions
Conceptualization, P.Z., Y.L. and F.J.H.; methodology, P.Z., Y.L.(Yuan Li) and F.F.; validation, Y.L. and P.Z.; formal analysis, F.F.; investigation, R.L., L.L., X.N., G.Z., L.W., and X.J.; writing—original draft preparation, F.F.; writing—review and editing, P.Z.; supervision, P.Z. and Y.L.; project administration, Y.L.(Yuan Li) and R.L.; funding acquisition, F.J.H. and P.Z.. All authors have read and agreed to the published version of the manuscript.
Funding
This research was funded by the UK National Institute for Health Research using UK aid from the UK government to support global health research, grant number 16/136/77.
Institutional Review Board Statement
All trials were approved by Queen Mary Ethics Research Committee in the United Kingdom (AIS, QMERC2018/13; HIS, QMERC2018/15; CIS, QMERC2018/16) and the Institutional Review Boards of China including Peking University (AIS, IRB0000105218051), Chinese Center for Disease Control and Prevention (HIS, No. 201801), and National Center for Chronic and Noncommunicable Disease Control and Prevention, Chinese Center for Disease Control and Prevention (CIS, No.201807). All participants provided written informed consent.
Informed Consent Statement
Informed consent was obtained from all subjects involved in the study.
Data Availability Statement
Relevant anonymized individual level data will be made available one year after publication of the primary manuscript on request from the corresponding author. Request for data sharing will be handled in line with the relevant regulations for data access and sharing in China and will need the approval of the trial steering committee and Institutional Review Board of the Chinese Center for Disease Control and Prevention.
Acknowledgments
We are grateful to the local Centers for Disease Control and Prevention in the six provinces, to the participating communities, schools and families for their support of this study. We also thank the participants that contributed to the data collection.
Conflicts of Interest
All authors declare support from the UK National Institute for Health Research for the submitted work. F.J.H. is an unpaid member of Action on Salt and World Action on Salt, Sugar and Health (WASSH). The other authors declare no conflict of interests.
Appendix A. The Questionnaire Used by CIS, HIS and AIS, the Three Randomized Controlled Trails Underpinning the Study
| Questions |
| Knowledge (3 questions) |
| Do you know what is the recommended maximum level of salt per day? |
| Less than 2 grams |
| Less than 5 grams |
| Less than 8 grams |
| Less than 12 grams |
| More than 12 grams |
| Don’t know |
| Have you heard of low sodium salt? |
| Yes |
| No |
| Which item on this food label represents the salt content? |
| Energy |
| Protein |
| Fat |
| Carbohydrates |
| Sodium |
| Don’t know |
| Attitudes (3 questions) |
| Do you agree high salt intake would cause hypertension? |
| Agree |
| Disagree |
| Don’t know |
| Do you agree low salt intake would make people limb weakened? |
| Agree |
| Disagree |
| Don’t know |
| Would you like to choose low-salt diet? |
| Yes |
| No |
| Don’t know |
| Behaviors (6 questions) |
| What is your usual taste for food? |
| More Salty |
| Moderate |
| Less Salty |
| Do you use low-sodium salt at home? |
| Yes |
| No |
| Don’t know |
| How often have you consumed pickled foods in the past month? |
| Almost every day |
| 3-5 days per week |
| 1-2 days per week |
| Once per week or less |
| How often have you consumed salty snacks in the past month? |
| Almost every day |
| 3-5 days per week |
| 1-2 days per week |
| Once per week or less |
| How often did you eat out or order delivery in the past month? |
| Almost every day |
| 3-5 days per week |
| 1-2 days per week |
| Once per week or less |
| Never |
| Have you requested for less-salted meals when eating out in the past month? |
| Always |
| Sometimes |
| Occasionally |
| Never |

Table A1.
Knowledge, Attitude and Practice (KAP) towards Salt Reduction among People with Different LSSS Awareness and Using Status.
Table A1.
Knowledge, Attitude and Practice (KAP) towards Salt Reduction among People with Different LSSS Awareness and Using Status.
| Questions | Aware of and using LSSS | Aware of but not using LSSS | Unaware of LSSS | χ2 | p-value |
|---|---|---|---|---|---|
| Know the recommended maximum level of salt per day | 217 (46.3) a | 234 (36.6) b | 427 (14.8) c | 328.660 | <0.001 |
| Know the nutrition label of salt | 369 (78.7) a | 404 (63.1) b | 896 (31.0) c | 520.873 | <0.001 |
| Know that eat too much salt will lead to hypertension | 413 (88.1) a | 529 (82.7) b | 2101 (72.7) c | 70.616 | <0.001 |
| Agree low salt intake wouldn't make people limb weakened | 185 (39.4) a | 244 (38.1) a | 698 (24.1) b | 83.964 | <0.001 |
| Willing to choose low-salt diet | 423 (90.2) a | 552 (86.3) a | 2311 (79.9) b | 37.670 | <0.001 |
| What is your usual taste for salt? | |||||
| Prefer salty food | 125 (26.7) a | 159 (24.8) a | 872 (30.2) a | 23.692 | <0.001 |
| No obvious preference | 225 (48.0) a | 331 (51.7) a | 1211 (41.9) b | ||
| Prefer less salty food | 119 (25.4) a | 150 (23.4) a | 808 (27.9) a | ||
| How often have you consumed pickled foods in the past month? | |||||
| Almost every day | 18 (3.8) a | 57 (8.9) b | 406 (14.0) c | 59.970 | <0.001 |
| 3-5 days per week | 26 (5.5) a | 44 (6.9) a | 248 (8.6) a | ||
| 1-2 days per week | 96 (20.5) a | 125 (19.5) a | 570 (19.7) a | ||
| Once per week or less | 329 (70.1) a | 414 (64.7) a | 1667 (57.7) b | ||
| How often have you consumed salty snacks in the past month? | |||||
| Almost every day | 2 (0.4) a | 7 (1.1) a | 16 (0.6) a | 24.982 | <0.001 |
| 3-5 days per week | 9 (1.9) a | 13 (2.0) a | 29 (1.0) a | ||
| 1-2 days per week | 42 (9.0) a | 55 (8.6) a | 156 (5.4) b | ||
| Once per week or less | 416 (88.7) a | 565 (88.3) a | 2690 (93.0) b | ||
| How often did you eat out or order delivery in the past month? | |||||
| Almost every day | 16 (3.4) a | 30 (4.7) a | 94 (3.3) a | 73.742 | <0.001 |
| 3-5 days per week | 51 (10.9) a | 49 (7.7) a,b | 153 (5.3) b | ||
| 1-2 days per week | 97 (20.7) a | 106 (16.6) a | 328 (11.3) b | ||
| Once per week or less | 251 (53.5) a | 363 (56.7) a | 1872 (64.8) b | ||
| Never | 54 (11.5) a | 92 (14.4) a | 444 (15.4) a | ||
| Have you requested for less-salted meals when eating out in the past month? | |||||
| Always | 107 (22.8) a | 136 (21.3) a | 579 (20.0) a | 26.725 | <0.001 |
| Sometimes | 33 (7.0) a | 38 (5.9) a | 110 (3.8) b | ||
| Occasionally | 30 (6.4) a | 37 (5.8) a | 117 (4.0) a | ||
| Never | 299 (63.8) a | 429 (67.0) a | 2085 (72.1) b | ||
LSSS: low-sodium salt substitutes. Footnotes of a, b and c indicate the significance of pairwise comparison. If the footnotes are the same for any two groups, the difference between the two groups is not statistically significant; if the footnotes are different, the difference between groups is statistically significant.
References
- Zhou, M.; Wang, H.; Zeng, X.; et al. Mortality, morbidity, and risk factors in China and its provinces, 1990–2017: A systematic analysis for the Global Burden of Disease Study 2017. Lancet 2019, 394, 1145–1158. [Google Scholar] [CrossRef]
- He, F.J.; Li, J.; Macgregor, G.A. Effect of longer term modest salt reduction on blood pressure: Cochrane systematic review and meta-analysis of randomised trials. BMJ 2013, 346, f1325. [Google Scholar] [CrossRef] [PubMed]
- Yu, J.; Thout, S.R.; Li, Q.; et al. Effects of a reduced-sodium added-potassium salt substitute on blood pressure in rural Indian hypertensive patients: A randomized, double-blind, controlled trial. Am. J. Clin. Nutr. 2021, 114, 185–193. [Google Scholar] [CrossRef] [PubMed]
- Li, K.C.; Huang, L.; Tian, M.; et al. Cost-Effectiveness of a Household Salt Substitution Intervention: Findings From 20 995 Participants of the Salt Substitute and Stroke Study. Circulation 2022, 145, 1534–1541. [Google Scholar] [CrossRef] [PubMed]
- World Health Organization. Guideline: Sodium intake for adults and children; World Health Organization (WHO): Geneva, Switzerland, 2012. [Google Scholar]
- World Health Organization. Guideline: Potassium intake for adults and children; World Health Organization (WHO): Geneva, Switzerland, 2012. [Google Scholar]
- Li, Y.; Zhang, P.; Wu, J.; et al. Twenty-Four-Hour Urinary Sodium and Potassium Excretion and Their Associations With Blood Pressure Among Adults in China: Baseline Survey of Action on Salt China. Hypertension 2020, 76, 1580–1588. [Google Scholar] [CrossRef] [PubMed]
- Drewnowski, A.; Rehm, C.D.; Maillot, M.; Monsivais, P. The relation of potassium and sodium intakes to diet cost among US adults. J. Hum. Hypertens. 2014, 29, 14–21. [Google Scholar] [CrossRef]
- Neal, B.; Wu, Y.; Feng, X.; et al. Effect of Salt Substitution on Cardiovascular Events and Death. N. Engl. J. Med. 2021, 385, 1067–1077. [Google Scholar] [CrossRef]
- Brand, A.; Visser, M.E.; Schoonees, A.; Naude, C.E. Replacing salt with low-sodium salt substitutes (LSSS) for cardiovascular health in adults, children and pregnant women. Cochrane Database Syst. Rev. 2022, 8, Cd015207. [Google Scholar]
- Cepanec, K.; Vugrinec, S.; Cvetkovic, T.; Ranilovic, J. Potassium Chloride-Based Salt Substitutes: A Critical Review with a Focus on the Patent Literature. Compr. Rev. Food Sci. Food Saf. 2017, 16, 881–894. [Google Scholar] [CrossRef]
- Bhat, S.; Marklund, M.; Henry, M.E.; et al. A Systematic Review of the Sources of Dietary Salt Around the World. Adv. Nutr. 2020, 11, 677–686. [Google Scholar] [CrossRef]
- Li, N.; Prescott, J.; Wu, Y.; et al. The effects of a reduced-sodium, high-potassium salt substitute on food taste and acceptability in rural northern China. Br. J. Nutr. 2008, 101, 1088–1093. [Google Scholar] [CrossRef]
- Neal, B.; Tian, M.; Li, N.; et al. Rationale, design, and baseline characteristics of the Salt Substitute and Stroke Study (SSaSS)-A large-scale cluster randomized controlled trial. Am. Heart J. 2017, 188, 109–117. [Google Scholar] [CrossRef] [PubMed]
- Yin, X.; Liu, H.; Webster, J.; et al. Availability, Formulation, Labeling, and Price of Low-sodium Salt Worldwide: Environmental Scan. JMIR Public. Health Surveill. 2021, 7, e27423. [Google Scholar] [CrossRef]
- Healthy China Promotion Committee. The Healthy China Action (2019–030). 2019. Available online: http://www.gov.cn/xinwen/2019-07/15/content_5409694.htm (accessed on 1 November 2022).
- China Healthy Lifestyle for All Committee. China Healthy Lifestyle for All. Available online: http://www.jiankang121.cn/ (accessed on 1 November 2022).
- Chinese Nutrition Society. National Nutrition Week. Available online: https://www.cnsoc.org/pastreviewto/6.html (accessed on 1 November 2022).
- Chu, H.; Yan, L.; Li, Y.; Yan, L.; Niu, W.; Wu, Y. Scientific evidence and policy recommendations for population-wide salt reduction. Chin. J. Health Policy 2013, 11, 23–30. [Google Scholar]
- Xu, A.; Ma, J.; Guo, X.; et al. Association of a Province-Wide Intervention With Salt Intake and Hypertension in Shandong Province, China, 2011–2016. JAMA Intern Med 2020, 180, 877–886. [Google Scholar] [CrossRef]
- He, F.J.; Zhang, P.; Li, Y.; MacGregor, G.A. Action on Salt China. Lancet 2018, 392, 7–9. [Google Scholar] [CrossRef]
- Xu, J.; Tang, B.; Liu, M.; et al. A town level comprehensive intervention study to reduce salt intake in China: Protocol for a cluster randomised controlled trial. BMJ Open 2020, 10, e032976. [Google Scholar] [CrossRef] [PubMed]
- Zhang, X.; Hu, X.; Ma, J.; et al. Cluster randomised controlled trial of home cook intervention to reduce salt intake in China: A protocol study. BMJ Open 2020, 10, e033842. [Google Scholar] [CrossRef]
- He, F.J.; Zhang, P.; Luo, R.; et al. An Application-based programme to reinforce and maintain lower salt intake (AppSalt) in schoolchildren and their families in China. BMJ Open 2019, 9, e027793. [Google Scholar] [CrossRef]
- He, F.J.; Wu, Y.; Feng, X.X.; et al. School based education programme to reduce salt intake in children and their families (School-EduSalt): Cluster randomised controlled trial. BMJ 2015, 350, h770. [Google Scholar] [CrossRef]
- Harris, R.M.; Rose, A.M.C.; Hambleton, I.R.; et al. Sodium and potassium excretion in an adult Caribbean population of African descent with a high burden of cardiovascular disease. BMC Public. Health 2018, 18, 998. [Google Scholar] [CrossRef]
- Cohen’s D—Effect Size for T-Test. Available online: https://www.spss-tutorials.com/cohens-d/ (accessed on 1 November 2022).
- Chen, S.; Shan, L.C.; Tao, W.; et al. A survey of Chinese consumers' knowledge, beliefs and behavioural intentions regarding salt intake and salt reduction. Public Health Nutr. 2020, 23, 1450–1459. [Google Scholar] [CrossRef]
- You, K.; Zhang, Y.; Wang, J.; Zhao, H. Investigation on the use of low Sodium Salt and Salt restriction tools among residents in Shunyi District of Beijing. Chin. J. Public. Health 2013, 29, 1448–1449. [Google Scholar]
- Sun, J.; Zhang, Q.; Jiang, H.; Guo, Y.; Zeng, Y. Investigation on consumption of low sodium salt of Shenzhen city residents. Chin. J. of PHM 2016, 32, 70–71. [Google Scholar]
- Du, X.; Fang, L.; Xu, J.; et al. The association of knowledge, attitudes and behaviors related to salt with 24-h urinary sodium, potassium excretion and hypertensive status. Sci. Rep. 2022, 12, 13901. [Google Scholar] [CrossRef]
- Zhang, J.; Xu, A.Q.; Ma, J.X.; et al. Dietary sodium intake: Knowledge, attitudes and practices in Shandong Province, China, 2011. PLoS ONE 2013, 8, e58973. [Google Scholar] [CrossRef]
- Salt substitution: A low-cost strategy for blood pressure control among rural Chinese. A randomized, controlled trial. J. Hypertens. 2007, 25, 2011–2018. [Google Scholar]
- Li, N.; Yan, L.L.; Niu, W.; et al. The Effects of a Community-Based Sodium Reduction Program in Rural China - A Cluster-Randomized Trial. PLoS ONE 2016, 11, e0166620. [Google Scholar] [CrossRef] [PubMed]
- Fan, F.; Li, Y.; Li, L.; et al. Salt-Related Knowledge, Attitudes, and Behaviors and Their Relationship with 24-Hour Urinary Sodium Excretion in Chinese Adults. Nutrients 2022, 14, 4404. [Google Scholar] [CrossRef] [PubMed]
- Shao, S.; Hua, Y.; Yang, Y.; et al. Salt reduction in China: A state-of-the-art review. Risk Manag. Healthc. Policy 2017, 10, 17–28. [Google Scholar] [CrossRef] [PubMed]
- Du, S.; Batis, C.; Wang, H.; Zhang, B.; Zhang, J.; Popkin, B.M. Understanding the patterns and trends of sodium intake, potassium intake, and sodium to potassium ratio and their effect on hypertension in China. Am. J. Clin. Nutr. 2014, 99, 334–343. [Google Scholar] [CrossRef] [PubMed]
- Zhao, X.; Lin, W.; Cen, S.; et al. The online-to-offline (O2O) food delivery industry and its recent development in China. Eur. J. Clin. Nutr. 2021, 75, 232–237. [Google Scholar] [CrossRef] [PubMed]
- Zhang, X.; Du, W.; Zhang, J.; et al. Association between the frequencies of eating out and overweight/obesity among dinners in restaurants aged 18-65 years in 6 Provinces of China. Chin. J. Health Educ. 2020, 36, 779–792. [Google Scholar]
- Maimaiti, M.; Zhao, X.; Jia, M.; Ru, Y.; Zhu, S. How we eat determines what we become: Opportunities and challenges brought by food delivery industry in a changing world in China. Eur. J. Clin. Nutr. 2018, 72, 1282–1286. [Google Scholar] [CrossRef]
- Zhao, F.; Zhang, P.; Zhang, L.; et al. Consumption and sources of dietary salt in family members in Beijing. Nutrients 2015, 7, 2719–2730. [Google Scholar] [CrossRef] [PubMed]
Figure 1.
Flowchart of participants. We analyzed three independent RCTs of Action on Salt China program, including Community-based comprehensive salt reduction intervention study (CIS), Home cook salt reduction intervention study (HIS), and App-based salt reduction program for primary school children and their families (AIS).
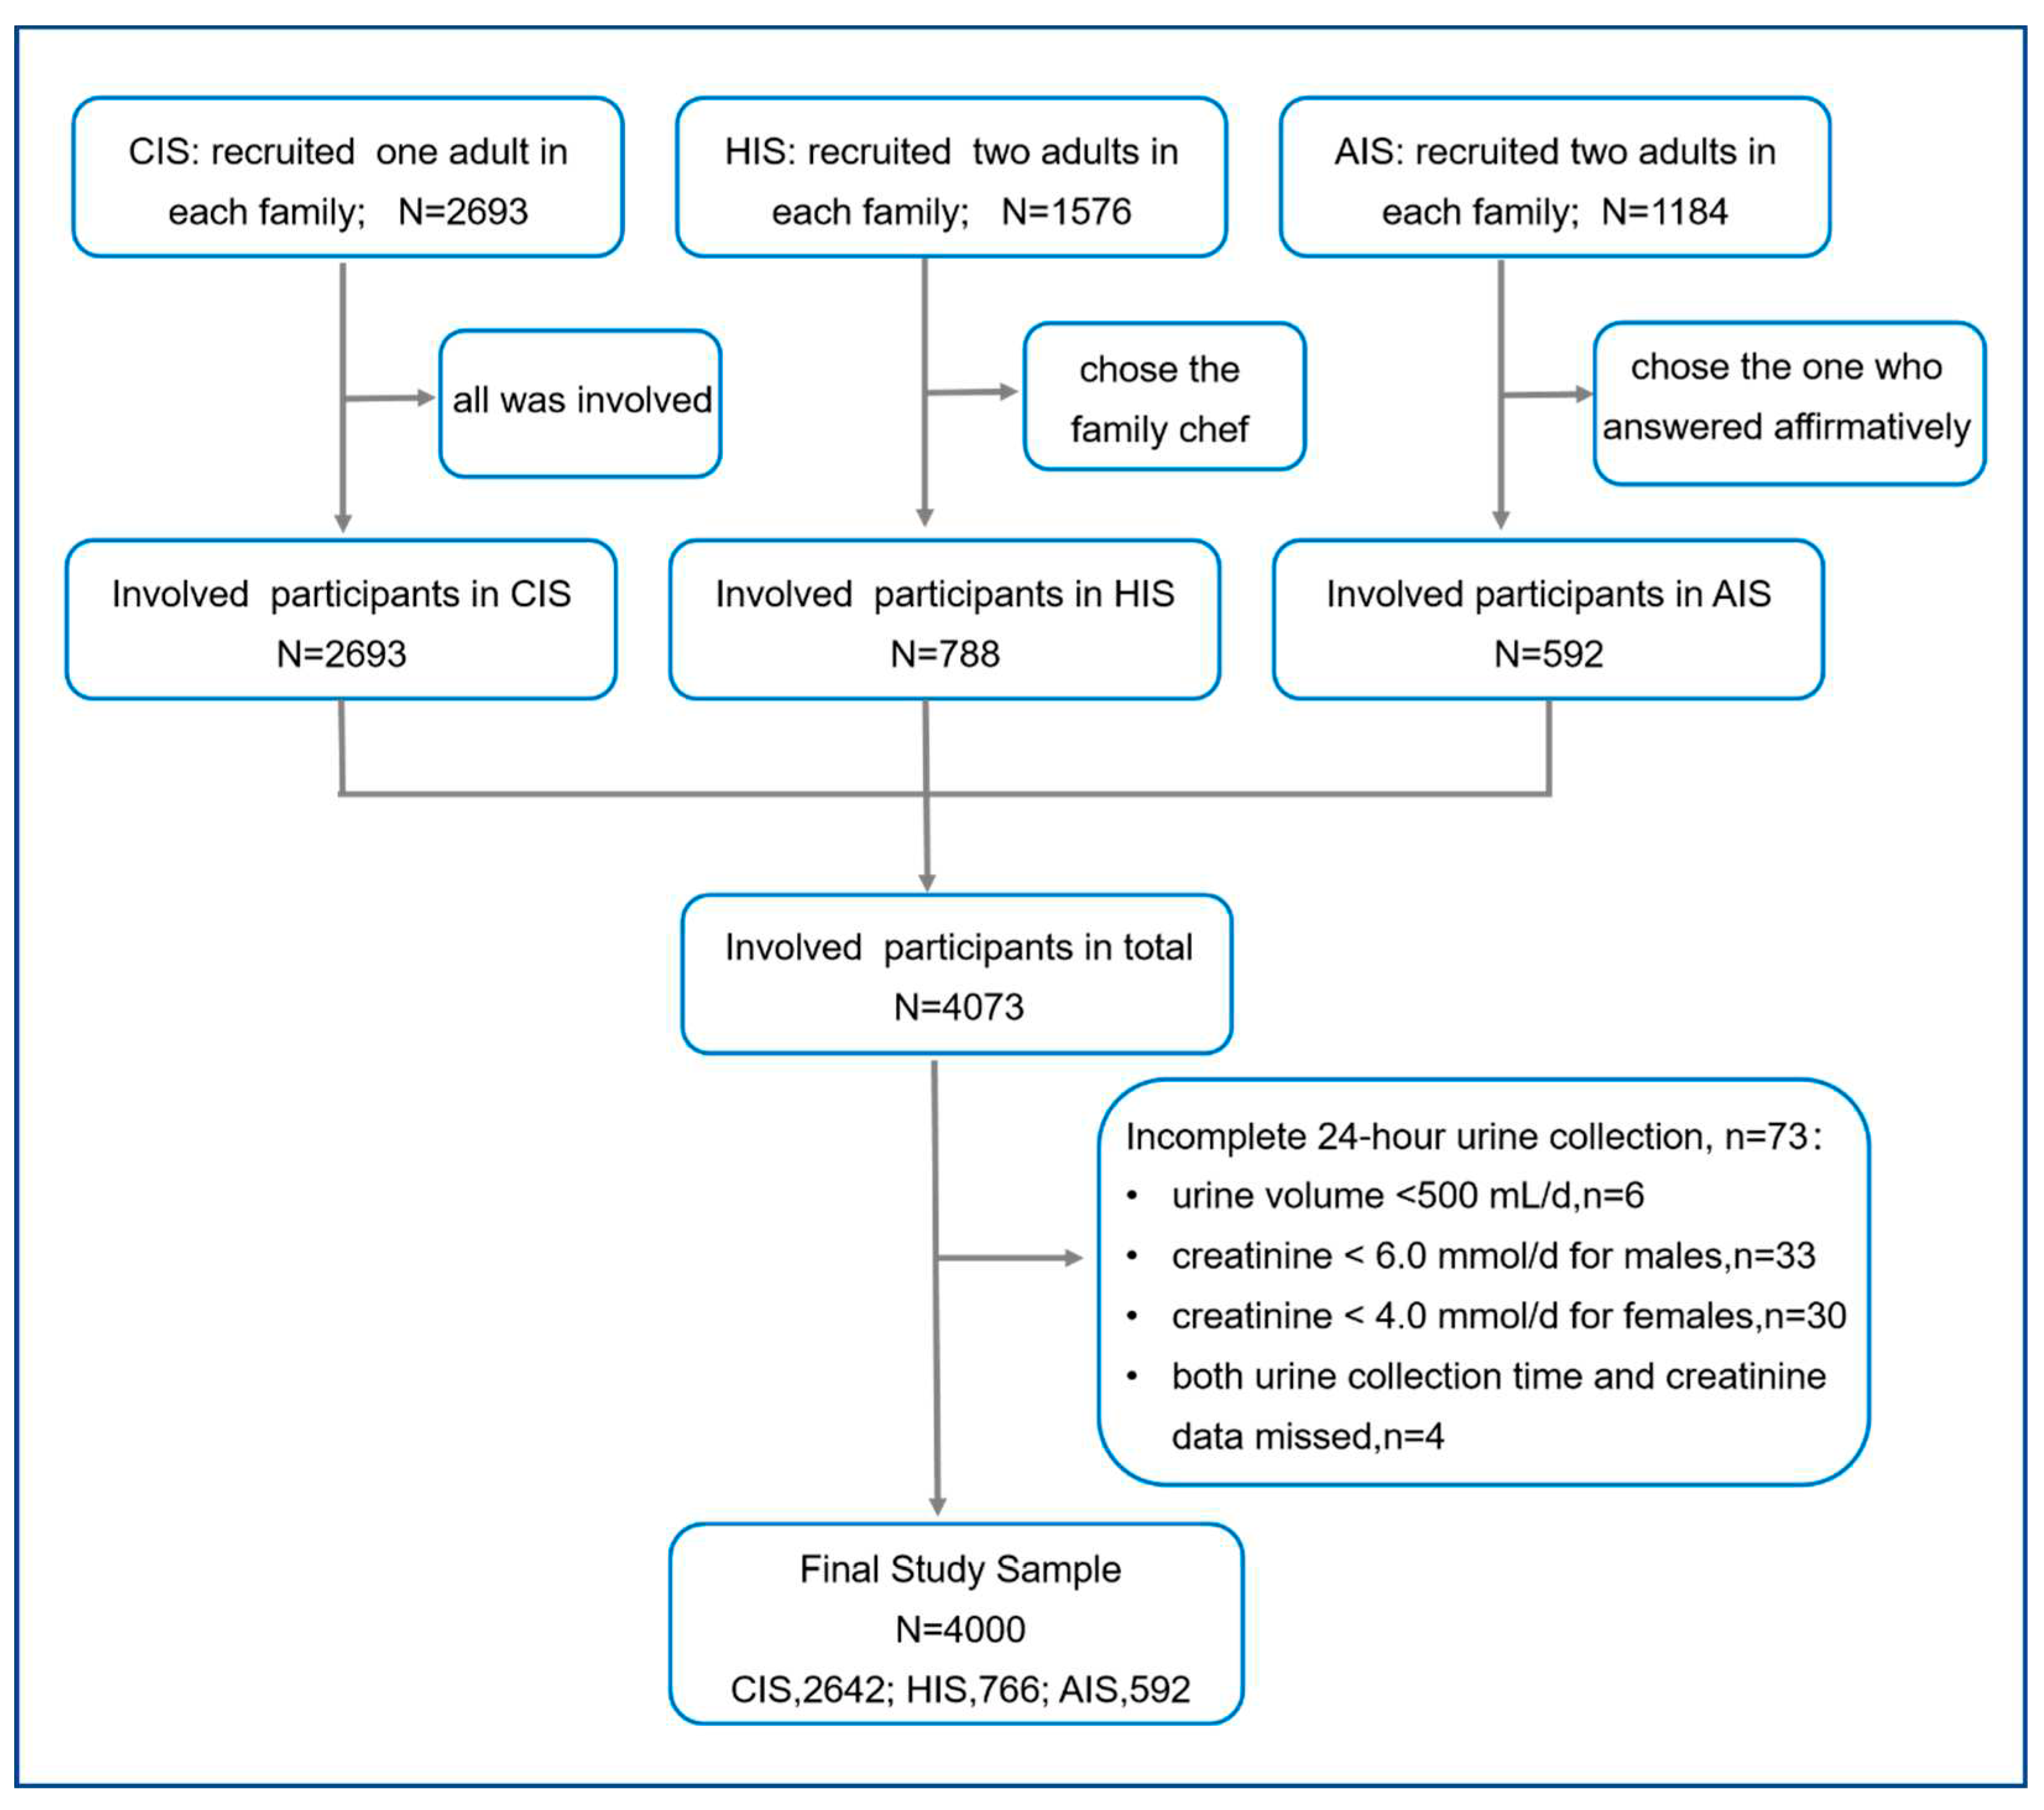
Table 1.
Characteristics of participants in the study.
| Characteristics | Statistics |
|---|---|
| Location, n (%) | |
| Urban | 722 (18.1) |
| Rural | 3278 (81.9) |
| Province, n (%) | |
| Hebei | 778 (19.4) |
| Heilongjiang | 558 (14) |
| Jiangxi | 573 (14.3) |
| Hunan | 756 (18.9) |
| Sichuan | 772 (19.3) |
| Qinghai | 563 (14.1) |
| Sex, n (%) | |
| Male | 1710 (42.8) |
| Female | 2290 (57.3) |
| Age (years), mean (SD) | 49 (12.8) |
| Age groups (years) , n (%) | |
| 18-44 | 1588 (39.7) |
| 45-59 | 1412 (35.3) |
| ≥60 | 1000 (25) |
| Education levels, n (%) | |
| Low | 1673 (41.8) |
| Medium | 1380 (34.5) |
| High | 947 (23.7) |
| Hypertension, n (%) | |
| No | 2644 (66.1) |
| Yes | 1356 (33.9) |
| SBP (mm Hg), mean (SD) | 125.8 (19.3) |
| DBP (mm Hg), mean (SD) | 79.2 (11.4) |
| Urinary collection time (h), mean (SD) | 23.9 (0.4) |
| Urinary volume (mL/24 h), mean (SD) | 1596.1 (639.4) |
| Urinary creatinine (mmol/24 h), mean (SD) | 7490.7 (3504.6) |
| 24-h urinary sodium (mg/d), mean (SD) | 4333.9 (1783.6) |
| 24-h urinary potassium (mg/d), mean (SD) | 1573 (635.8) |
| Sodium-to-potassium ratio (mol/mol), mean (SD) | 5.1 (2.3) |
Table 2.
Awareness and use of LSSS in 4000 participants with different demographic characteristics.
| Characteristics | Aware of and using LSSS | Aware of but not using LSSS | Unaware of LSSS | χ2 | p-value |
|---|---|---|---|---|---|
| Total | 469 (11.7) | 811 (20.3) | 2720 (68.0) | ||
| Location | 509.478 | <0.001 | |||
| Urban | 211 (29.2) | 269 (37.3) | 242 (33.5) | ||
| Rural | 258 (7.9) | 542 (16.5) | 2478 (75.6) | ||
| Sex | 5.466 | 0.065 | |||
| Male | 223 (13.0) | 350 (20.5) | 1137 (66.5) | ||
| Female | 246 (10.7) | 461 (20.1) | 1583 (69.2) | ||
| Age groups | 146.005 | <0.001 | |||
| 18-44 | 258 (16.2) | 418 (26.3) | 912 (57.5) | ||
| 45-59 | 137 (9.7) | 251 (17.8) | 1024 (72.5) | ||
| ≥60 | 74 (7.4) | 142 (14.2) | 784 (78.4) | ||
| Educational levels | 927.616 | <0.001 | |||
| Low | 40 (2.4) | 166 (9.9) | 1467 (87.7) | ||
| Medium | 138 (10.0) | 289 (20.9) | 953 (69.1) | ||
| High | 291 (30.7) | 356 (37.6) | 300 (31.7) | ||
| Hypertension | 50.247 | <0.001 | |||
| No | 344 (13.0) | 601 (22.7) | 1699 (64.3) | ||
| Yes | 125 (9.2) | 210 (15.5) | 1021 (75.3) | ||
Note: LSSS stands for low-sodium salt substitutes
Table 3.
24-h urinary sodium and potassium excretion, and sodium-to-potassium ratio among different LSSS awareness and use groups, mean (SD).
Table 3.
24-h urinary sodium and potassium excretion, and sodium-to-potassium ratio among different LSSS awareness and use groups, mean (SD).
| 24-h urinary sodium (mg/d) |
24-h urinary potassium(mg/d) |
Sodium to potassium ratio |
|
|---|---|---|---|
| LSSS awareness and use groups | |||
| Aware and using | 3877.1 (1416.0) | 1531.9 (601.8) | 4.9 (3.4) |
| Aware but not using | 4045.1 (1624.2) | 1527.6 (594.2) | 4.9 (2.2) |
| Unaware | 4498.7 (1860.3) | 1593.5 (652.6) | 5.2 (2.1) |
| Statistics for difference test among groups | |||
| F | 38.320 | 4.470 | 6.062 |
| p-value | <0.001 | 0.012 | 0.002 |
| Cohen's f | 0.138 | 0.047 | 0.055 |
Table 4.
Association between LSSS and 24-h urinary sodium and potassium excretion and sodium to potassium ratio.
Table 4.
Association between LSSS and 24-h urinary sodium and potassium excretion and sodium to potassium ratio.
| Variables | 24-h urinary sodium | 24-h urinary potassium | Sodium to potassium ratio | |||
|---|---|---|---|---|---|---|
| β (95% CI) | p-value | β (95% CI) | p-value | β (95% CI) | p-value | |
| LSSS group (Ref = ‘Unaware of’) | ||||||
| Aware but not using | -356.1 (-503.9, -205.9) |
<0.001 | -61.2 (-115.4, -7.0) |
0.027 | -0.2 (-0.4, -0.0) |
0.029 |
| Aware and using | -490.6 (-679.2, -293.7) |
<0.001 | -52.8 (-122. 6, 16.9) |
0.138 | -0.2 (-0.4, 0.1) |
0.253 |
| Location (Ref = ‘Urban’) | ||||||
| Rural | 754.9 (157.4, 1055.5) |
<0.001 | -12.2 (-68.8, 55.8) |
0.674 | 0.3 (0.1, 0.6) |
0.003 |
| Sex (Ref = ‘Male’) | ||||||
| Female | -505.9 (-623.8, -387.6) |
<0.001 | 29.2 (-11.8, 70.1) |
0.163 | -0.7 (-0.8, -0.5) |
<0.001 |
| Age groups (Ref = ’18-44’) | ||||||
| 45-59 | -120.9 (-256.1, 8.6) |
0.073 | 88.4 (41.1, 135.6) |
<0.001 | -0.5 (-0.7, -0.3) |
<0.001 |
| ≥60 | -492.7 (-647.4, -342.1) |
<0.001 | -13.2 (-67.6, 41.3) |
0.636 | -0.6 (-0.8, -0.4) |
<0.001 |
| Education levels (Ref = ‘Low’) | ||||||
| Medium | -132.9 (-270.0, 0.0) |
0.054 | 19.8 (-29.2, 68.9) |
0.429 | -0.2 (0.4, -0.0) |
0.050 |
| High | -305.6 (-480.4, -132.9) |
<0.001 | -9.1 (-72.4, 54.2) |
0.779 | -0.51 (-0.5, -0.1) |
0.007 |
Disclaimer/Publisher’s Note: The statements, opinions and data contained in all publications are solely those of the individual author(s) and contributor(s) and not of MDPI and/or the editor(s). MDPI and/or the editor(s) disclaim responsibility for any injury to people or property resulting from any ideas, methods, instructions or products referred to in the content. |
© 2023 by the authors. Licensee MDPI, Basel, Switzerland. This article is an open access article distributed under the terms and conditions of the Creative Commons Attribution (CC BY) license (http://creativecommons.org/licenses/by/4.0/).
Copyright: This open access article is published under a Creative Commons CC BY 4.0 license, which permit the free download, distribution, and reuse, provided that the author and preprint are cited in any reuse.


